
Abstract
Countries, companies, and customers are becoming increasingly concerned with sustainability. However, it is unclear how much increased cost, if any, companies are willing to tolerate for sustainability efforts at the rate of potentially lower profits. Plus, what are the customers’ sensitivities to the prices of products/services that are developed within the realm of sustainability initiatives (e.g., how much more can the products/services cost and still be viable)? Additionally, with 193 countries of the United Nations ratifying the Sustainable Development Goals, we know that countries are focused on sustainability, but can companies achieve positive sustainability effects on performance above what countries are doing? Consequently, what are the macro-micro dynamics in play for sustainability efforts? In a 10-country study involving 4,051 companies, we examine these macro-micro (country-company) dynamics, company costs, customer costs, and price sensitivities on the effects of sustainability on companies’ performance. The results indicate that positive effects on companies’ performance can be achieved (1) from the companies’ sustainability efforts in all 10 countries studied, (2) even if the costs and/or prices increased by 27 to 72 percent (depending on the dynamic and scenario), and (3) by companies implementing sustainability efforts that are 5 to 30 percent above the efforts of the country. Increased sustainability effects can also be gained from lowering customer and company costs, but no such effects were found when lowering product prices.
Keywords
Introduction
Sustainability is not about doing business as usual but making substantive changes to operations (Kilbourne 2010) that result in a “transformative” change (Varey 2010) that can be a positive force in the global marketplace. Admirably, a focus on sustainability has become an increasingly attractive marketing strategy for many global companies (e.g., Chabowski, Mena, and Gonzalez-Padron 2011; Kotler 2011; Varadarajan 2014). “Sustainability means seeking to replace what we use and repair what we damage, striving to leave the planet in a better condition than that in which we found it” (Hollensbe et al. 2014, p. 1232). Strategically, being sustainable has also resulted in nurturing sentiments of companies “doing good” and customers cultivating a “warm glow” feeling, such as having a lower carbon footprint (Luo and Bhattacharya 2009; White and Simpson 2013). That said, a person who is skeptical may suggest that nurturing such sentiments and feelings reside more in “responsible marketing” than in driving transformative change in the form of “sustainable marketing” practices (cf. Varey 2010).
In actuality, we do operate in an era of market competitiveness, and (most, if not all) companies need to address their bottom-line performance (Katsikeas, Morgan, Leonidou, and Hult 2016). Thus, the combination of responsible marketing and sustainable marketing is likely the prudent way to think about the issue (cf. Burroughs 2010). Within this frame of reference, marketing strategy for sustainability-focused companies is about creating a “warm glow” customer-effect or having to increase company costs, customer costs, and/or product prices (e.g., Habel, Schons, Alavi, and Wieseke 2016; Mitchell, Wooliscroft, and Higham 2010). In fact, one perspective is that marketing’s role can be to incentivize customer participation in sustainability programs and having these customers adjust their “warm glow thermostat” (Giebelhausen, Chun, Cronin, and Hult 2016, p. 56). A so-called warm glow can alleviate the negatives of some increased costs.
Regardless of why companies decide to engage and how customers become involved, “a key concern regarding sustainability initiatives…is how they affect operational performance” (Giebelhausen, Chun, Cronin, and Hult 2016, p. 56). Consequently, Habel, Schons, Alavi, and Wieseke (2016, p. 84) proposed that sustainability initiatives should be a matter of strategically deciding between a “warm glow or extra charge.” In this sense, like Giebelhausen, Chun, Cronin, and Hult (2016) proposed, marketing’s role can be to develop an incentive or reason for customers to feel that they are receiving added benefits by the company “doing good” in addition to the “warm glow” that customers themselves feel (Strahilevitz 1999). Warm glow refers to the positive feelings people typically experience when they support products by a company implementing sustainability initiatives (Andrews, Lou, Fang, and Aspara 2014). Likewise, many customers have a “warm glow” attachment, and oftentimes even a preference, for their home country’s products (cf. Agrawal and Kamakura 1999; Gurhan-Canli and Maheswaran 2000).
A company’s performance has long been influenced by the country in which it is headquartered. Variance decomposition studies show that country effects account for up to ten percent of companies’ bottom-line performance (e.g., Bamiatzi, Bozos, Cavusgil, and Hult 2016). To create this effect, companies’ marketing efforts are influenced by country attributes, institutions, and national policy (e.g., Clark 1990), and these influencers extend to sustainability efforts (Nilsson, Griggs, and Visbeck 2016). Specifically, in 2000, the United Nations established the Millennium Development Goals to reduce the number of people who live in extreme poverty by 2015. Subsequently, in September 2015, the United Nations and its 193-member countries ratified the Sustainable Development Goals that set targets to end poverty, protect the planet, and ensure prosperity for all countries by 2030 as part of a new sustainability agenda (United Nations 2015). Seventeen goals were created to replace the Millennium Development Goals (Griggs et al. 2013). As such, in parallel with companies’ sustainability efforts in the last couple of decades (Chabowski, Mena, and Gonzalez-Padron 2011), countries have developed policy to engage in sustainability (Flückiger and Seth 2016; Griggs et al. 2013).
Even with this increased country-company sustainability emphasis by the United Nations, we only have very limited knowledge of a country’s sustainability efforts in relation to sustainability initiatives by the companies from (i.e., headquartered in) the same country. We also have very limited knowledge about these companies’ product-market performance as it relates to sustainability initiatives. Several issues come up in this context, generally relating to cost issues (e.g., company costs, customer costs, and product prices). Consequently, our objective is to address these important gaps in macromarketing and policy knowledge for (at least) two core reasons. First, the dynamic between the macro-related sustainability issues at the country level need to be better understood vis-à-vis the same sustainability issues at the company level. Basically, companies are so-called “nested” in the countries in which they have their headquarters and the infrastructure for sustainability at each level (country, company) feed off each other. For example, it could be that the lack of sustainability infrastructure at the country level hinders a company from becoming as sustainability oriented as they would like in the industry across the global marketplace. Likewise, countries may want to drive the sustainability efforts – which some countries undoubtedly want to do with the ratification of the Sustainable Development Goals by the United Nations – but the core companies in a country may not be on board fully. Either of these scenarios present macro-micro issues, positive or negative, that have significant implications for a company’s product-market performance.
Second, company costs (e.g., Closs, Speier, and Meacham 2011), customer costs (e.g., Giebelhausen, Chun, Cronin, and Hult 2016), and product prices (Andrews, Lou, Fang, and Aspara 2014; Habel, Schons, Alavi, and Wieseke 2016) are generally viewed as the core cost/price factors affecting the sustainability “value” received by customers (cf. Woodruff 1997; Zeithaml 1988). These cost/price factors have been associated with “doing good” (company costs), “warm glow” (customer costs), and price fairness (product prices) in the marketing literature. Beyond price, both customer and company costs are composed of three core components: purchase costs, use costs, and post-use costs (e.g., disposing of the product). For example, it is easy to figure out that sustainable products that cost too much will only be purchased by a limited number of customers. As such, it is important to understand the sensitivities to customer costs, company costs, and product prices when implementing sustainability initiatives. How much above the norm can these costs and prices be, and the product still be competitive in the marketplace compared with suitable alternatives? Fortunately for customers, most product categories have closely related substitutes and largely the same (or better) quality. This is especially true in commodity-oriented products. It would be easy to think that customers are mindful of the “greening” effects/issues in the global marketplace ands would later their buying habits accordingly. That is, customers would be sustainable products because it is good for the planet, etc. Unfortunately, the reality is not as admirable. Albeit about a decade old, results by the Grocery Manufacturers Association (2009) suggest that about half of the customers surveyed indicated that they consider sustainability characteristics when making purchasing decisions. This is admirable; less admirable is the outcome that only 22 percent of these same customers actually bought sustainable products in the final count due to a number of reasons. This brings us to the unclarity that exists in the sustainability literature and practice at the macro (country) to micro (company, customer) levels. What are ultimately the cost and price sensitivities for companies and customers in the (constraining) context of the sustainability infrastructure provided (or advocated) by countries?
The rest of the paper is organized as follows. First, we develop the research hypotheses by drawing on the theoretical tension between institutional theory and resource-based theory as well as integrating several thematic literature streams as applicable to specific hypotheses (e.g., sustainability, corporate social responsibility, green marketing, price fairness, and customer value). Next, we describe the data collection, study measures, and report on the measurement analyses for the reflective scales. Third, we present the results of the sustainability analyses involving 4,051 companies in 10 countries. Finally, we discuss the significance of the results and the marketing implications for companies attempting to manage sustainability efforts.
Theories and Hypotheses
As it relates to country-company dynamics, the hypotheses in this study can be developed effectively by drawing on the theoretical tension that exists between institutional theory (e.g., Dacin 1997; DiMaggio and Powell 1983) and resource-based theory (e.g., Barney 1991; Kozlenkova, Samaha, and Palmatier 2014; Wernerfelt 1984). In the country-company context, institutional theory would suggest that companies within countries become isomorphic over time while resource-based theory suggests that companies’ strategic resources determine their individually unique competitive advantages. We briefly review the core aspects of RBV and institutional theory, and draw on the theoretical tension between the two as well as integrating several themes for the hypotheses (e.g., sustainability, corporate social responsibility, green marketing, price fairness, and customer value).
Institutional Theory
As applied in this study, institutional theory holds that to attain legitimacy, a company tends to be isomorphic to other companies in its country and, as a result, over time companies within the same country will resemble each other and be an extension of their environment (Dacin 1997). DiMaggio and Powell (1983) identify three mechanisms – coercive, mimetic, and normative pressures – through which such resemblance of companies occurs.
Coercive isomorphism is driven by two different forces – political influence and the problem of legitimacy (DiMaggio and Powell 1983). Within the country context, isomorphism is an idea of what contemporary societies should be that is addressed by the institutionalization of certain models that are constructed and promulgated through cultural and associational processes, such as the United Nations Sustainable Development Goals (e.g., Griggs et al. 2013; Nilsson, Griggs, and Visbeck 2016; United Nations 2015). Importantly, as specified by the United Nations, the expectation is not that all countries will adhere to all 17 Sustainable Development Goals equally from 2015 and on. Instead, countries have signed on to use the United Nations framework and work toward becoming more sustainable and, ultimately, achieve certain acceptable thresholds by 2030 (United Nations 2015). Within this frame-of-reference, to gain legitimacy for sustainability initiatives, companies imitate other companies that operate within their own country and, overall, these companies are, in essence, coerced to adhere to the sustainability infrastructure in the country (cf. McFarland, Bloodgood, and Payan 2008). Intra-country company-dependence, politically and from the standpoint of legitimacy, are key factors in coercive isomorphic change (Pfeffer and Salancik 1978). Since a company depends on its home country’s sustainability infrastructure to achieve its own sustainability goals, the company will imitate the structure, climate, and behavioral focus of other companies in the country as well as adhere to country attributes, institutions, and national sustainability policy (cf. Clark 1990).
Mimetic isomorphism arises under conditions of environmental uncertainty (DiMaggio and Powell 1983; McFarland, Bloodgood, and Payan 2008). When faced with ambiguous situations, as applied to our theorizing about country-company sustainability initiatives, companies model themselves after other companies in their home country, especially after those they regard as more legitimate or successful (Lieberman and Asaba 2006). These successful companies collectively have been able to work to achieve performance goals within the constraints resulting from country attributes, institutions, and national policy. Additionally, companies are also likely to mimic other companies in their country-environment with whom they have boundary-spanning ties, which favors intra-country connections over inter-country connections (cf. Galaskiewicz and Wasserman 1989). Managers who have intra-country ties to peers in other companies are able to see how such companies deal with country constraints and “learn what is and what is not acceptable” (Galaskiewicz and Wasserman 1989, p. 456). This learning influences the way they behave themselves in implementing sustainability initiatives.
Normative isomorphism results from the diffusion of ideas and normative rules via social networks (Mizruchi and Fein 1999). Normative rules dictate the organizational and professional behaviors that are considered appropriate within the environment (Guler, Guillen, and Macpherson 2002). In particular, professional and trade associations often serve as vehicles for the establishment and dissemination of such normative rules (DiMaggio and Powell 1983). Through these professional networks, members of one company influence those of another (Mizruchi and Fein 1999). For example, Beliveau, Cottrill, and O’Neill (1994) examined factors that predict sustainability and found that a company is more likely to engage in sustainability initiatives if other companies in its industry have done so.
Resource-Based Theory
A number of theoretical perspectives focus on company-level effects to explain variation in performance outcomes across companies (e.g., Hult 2011). Resource-based theory (Kozlenkova, Samaha, and Palmatier 2014; cf. Hunt and Morgan 1996), originating as the resource-based view (Barney 1991; Wernerfelt 1984), is very applicable for the country-company dynamics of sustainability initiatives since such initiatives build on resource use and constraints. Consequently, resource-based theory identifies the company’s idiosyncratic, strategic resources as the primary determinant of competitive advantage and company performance (Barney 1991). The theory portrays resources as those tangible and intangible strategic assets and capabilities possessed by a company that enable it to implement valuable strategies that improve its efficiency and effectiveness (Wernerfelt 1984). As examples, company resources include brand names, patents, corporate culture, trade contacts, knowledge, management skills, and efficient procedures (Barney 1991; Grant 1991; Wernerfelt 1984). In order for resources to be a source of sustained competitive advantage, they must be valuable, rare, imperfectly imitable, and non-substitutable (Barney 1991).
An important aspect of resource-based theory is that it explains long-lived variation in the profitability of companies within the same industry and country (Bamiatzi, Bozos, Cavusgil, and Hult 2016; Makino, Isobe, and Chan 2004; cf. Hunt and Morgan 1996). Due to the accumulation of unique resources, companies evolve differently, thus exhibiting distinct company structures and implementing different marketing strategies (Day 1994). By having unique strategic marketing resources, companies erect barriers to imitation with the objective of generating above-normal returns and protecting their competitive advantage in the marketplace (Wernerfelt 2005). Rumelt (1984, 1987) argues that through isolating mechanisms – such as response lags, producer learning, and reputation – companies prevent imitative competition.
The company’s portfolio of unique strategic resources also influences the strategies that it adopts (Peteraf 1993; Wernerfelt 2005). According to resource-based theory, these resources enable the company to either achieve superior performance through differentiation of its products or to have the ability to manufacture more efficiently to achieve a low-cost position (Conner 1991; Hunt and Morgan 1996; Porter 1980). At a given point in time, customers have divergent preferences, but due to constraints in inputs, the company is unable to satisfy all of the customers’ wants and needs (cf. Peteraf 1993). Instead, the company will seek a balance between the external market demands and the internal resources and capabilities to satisfy a segment of the market (Grant 1991). Different companies possess different resources and hence will target different segments, giving rise to within-country intra-industry heterogeneity and profit level variation (cf. Hunt and Morgan 1996). As such, idiosyncratic company characteristics, such as strategic resources allocated to sustainability initiatives, explain differences in product-market performance across companies (cf. Barney 1991).
Hypotheses
H1 serves as a benchmark examination of the theoretical tension between institutional theory (DiMaggio and Powell 1983) and resource-based theory, as it applies in marketing (e.g., Kozlenkova, Samaha, and Palmatier 2014). The basic notion for H1 is to provide guidance on what is possible in implementing sustainability initiatives based on country-company competitiveness dynamics (Buckley and Casson 2011). On one hand, institutional theory suggests that for a company to attain legitimacy regarding its sustainability efforts, the company tends to be isomorphic to the sustainability infrastructure in its home country and to other intra-country companies’ sustainability efforts (Dacin 1997). On the other hand, resource-based theory explains why there can be variation in the product-market performance of companies within the same country and industry (e.g., Wernerfelt 1984). The idea is that, by combining unique strategic resources idiosyncratically, companies erect barriers to imitation of their sustainability initiatives, with the objective of generating above-normal returns (Wernerfelt 2005).
While institutional theory is a robust theory which has been used in a variety of macro and micro settings, the theory has been used particularly effectively in country-level international research to explain macro phenomena (e.g., Udry 2003). Consequently, institutional theory provides certain “boundaries” for our expectation of what can be achieved by companies in the 10 countries studied (Hult 2011, p. 509). Beyond these boundaries, however, we suggest that resource-based theory coupled with the marketing literature on sustainability (e.g., Huang and Rust 2011; Hunt 2011; White and Simpson 2013), corporate social responsibility (e.g., Iyer and Soberman 2016; Luo and Bhattacharya 2009), and green marketing (e.g., Cronin et al. 2011; Trudel, Argo, and Meng 2016) provide a plausible justification for why companies’ sustainability efforts should reap performance advantages above the effects of the country’s sustainability infrastructure.
Perceptibly, Crittenden et al. (2011, p. 71) recognize that “sustainability is a major concern for marketers in the 21st century since marketing strategies and activities are inextricably linked to the future of the natural environment that sustains all life” (cf. Kotler 2011). However, more than just a recognition, which sometimes can be dismissed as a viewpoint or desired state, Luo and Bhattacharya (2009, p. 210) showed that CSR-driven marketing strategies can meaningfully meet Wall Street’s demands, such as product-market performance, and “create moral capital” as well as provide an “insurance-like protection” for companies’ shareholder wealth. This narrative is echoed by Cronin et al. (2011, p. 158) who state that “as companies note the positive gains that can accrue through environmentally friendly marketing strategies and the potential pitfalls associated with non-environmentally friendly strategies, going green is beginning to take center stage in boardrooms around the world.”
Consequently, our initial hypothesis (H1), which is tested with data from 10 countries, builds on the theoretical tension between institutional theory and resource-based theory. The theoretical weight, however, is allocated to companies’ potential to leverage their idiosyncratically organized strategic resources to implement sustainability initiatives that build on but also surpass the country’s sustainability effects. Thus, as a
Some companies are “doing good” (e.g., Kotler and Lee 2005) and some customers acquire a “warm glow” (Habel, Schons, Alavi, and Wieseke 2016) regardless of costs involved, product prices, or benefits received in the exchange. These companies and customers have adopted a “self-accountability” (Peloza, White, and Shang 2013, p. 104) that creates a unique value proposition for them. But, most companies and most customers, we argue, are not value-seeking without some logical cost-and-benefit reasoning. Value is the function of benefits “received and what is given” (Zeithaml 1988, p. 14). This rationale applies to both companies and customers; both receive benefits and both give up something in the exchange.
At the customer level, “value is a customer’s perceived preference for and evaluation of those product attributes, attribute performances, and consequences arising from use that facilitate (or block) achieving the customer’s goals and purposes in use situations” (Woodruff 1997, p. 142). Customer value is tightly connected to “price fairness” (Habel, Schons, Alavi, and Wieseke 2016), which is defined as “a consumer’s subjective sense of a price as right, just, or legitimate versus wrong, unjust, or illegitimate” (Campbell 2007, p. 261). Customer value is also connected to the notion of a “warm glow” (i.e., positive feelings people experience when they support products by a company implementing sustainability initiatives) in that increased warm glow also increases the perceived value received (Giebelhausen, Chun, Cronin, and Hult 2016).
At the company level, there are a number of value propositions and definitions, but the marketing focus on customer lifetime value (CLV) applies fittingly to sustainability initiatives since such initiatives are targeting, at least partially, the fundamental idea of gaining customers’ repeat business because of “doing good,” creating a “warm glow,” and/or offering sustainable products at fair prices (cf. Holm, Kumar, and Rohde 2012). In this case, “the economic value of repeat business is determined by the discounted net present value of future cash flows from current customers” (Fornell, Morgeson, and Hult 2016, p. 94). CLV leads to an increase in stock prices (Kumar and Shah 2009) and to increased company profits (Venkatesan and Kumar 2004).
With the assumption that customers are likely to purchase more quality products from a company implementing sustainability initiatives, if those initiatives do not affect costs or prices, a greater effect of sustainability on product-market performance than expected in the baseline hypothesis (H1) should also follow. The reasoning is rooted in sentiments stemming from companies “doing good” (Luo and Bhattacharya 2009), customers experiencing a “warm glow” by the value received or by adjusting their “warm glow thermostat” (Giebelhausen, Chun, Cronin, and Hult 2016, p. 56), and/or by “perceived price fairness” (Habel, Schons, Alavi, and Wieseke 2016, p. 84). Formally stated as H2:
As we stated in the theoretical development of H2, some companies are “doing good” (e.g., Kotler and Lee 2005) and some customers acquire a “warm glow” (Habel, Schons, Alavi, and Wieseke 2016). In fact, some companies and customers cultivate the “doing good” and “warm glow” phenomena even if costs and prices are very high or benefits are minimal or non-existent. From the standpoint of marketing strategy, consumer behavior, or ultimately product-market performance, theoretically there is no consistent reasoning that can be applied to prescriptively explain such phenomena for a complete customer base of a company or even a specific profitable customer segment (cf. Luchs, Naylor, Irwin, and Raghunathan 2010). Likewise, normatively it is also difficult to describe why this behavior ought to happen or ought to be rational. The logic of “self-accountability” (Peloza, White, and Shang 2013, p. 104) for the good of humanity is as close as we will get to encapsulate the unique value proposition for these companies and customers. However, building on the “value” rationale in H2, we argue that very high company costs, very high customer costs, and/or very high product prices are not viable. Therefore, H3 is a complementary hypothesis to H2 and states that:
The logic, but also harshness, of H3 suggests that there is a theoretical and practical middle ground that should be explored for products delivered by companies advocating and implementing sustainability initiatives. The literatures on “doing good” (Kotler and Lee 2005; Luo and Bhattacharya 2009), “warm glow” (Giebelhausen, Chun, Cronin, and Hult 2016), and “price fairness” (Habel, Schons, Alavi, and Wieseke 2016) theoretically demand such sensitivity analyses. That is, while very high company costs, very high customer costs, and/or very unfair prices seemingly – for most people – will be off putting and result in no purchase, some modest increases in costs and/or prices while maintaining a positive effect on performance seem plausible. In support, marketing research provides an indication that would lead us to believe that costs and prices being modestly higher would still entice customers to buy as a part of their “mindful consumption” (Sheth, Sethia, and Srinivas 2011, p. 21), socially responsible buying habits (Iyer and Soberman 2016), sustainable behaviors (Huang and Rust 2011), and “greening” deeds (cf. Leonidou, Katsikeas, and Morgan 2013, p. 151).
In parallel to H2 being a sensitivity analysis of H1, H4 is structured as a sensitivity analysis of H3. The rationale is that a company ought to, in a normative mode, be able to build on the positive embodiments of “doing good” (Luo and Bhattacharya 2009) and the customers’ sentiments toward wanting to experience a “warm glow” (even if it means adjusting their “warm glow thermostat,” Giebelhausen, Chun, Cronin, and Hult 2016) to implement sustainability activities that result in some increased company costs, increased customer costs, or increased product prices and still have a positive effect on the company’s product-market performance. Though indications exist that a 30 percent increase in product prices have been received favorably by customers (Enax, Krapp, Piehl, and Weber 2015), theoretically there is limited rationale to specify a specific breaking point for acceptable increases of company costs, customer costs, and product prices but the effects should be above market-competitive costs and prices. Thus, without specifying a cut-off point, theory (and practice) submit that:
The rationale for H5 comes full circle from where we started the hypothesis development in H1. That is, the tension between institutional theory (Dacin 1997; DiMaggio and Powell 1983) and resource-based theory (Barney 1991; Kozlenkova, Samaha, and Palmatier 2014; Wernerfelt 1984) mandate a deeper theoretical and practical examination of the give-and-take between the two theories, as they apply to country-company dynamics, competitiveness, and sustainability (cf. Buckley and Casson 2011; Buckley, Pass, and Prescott 1998).
Again, institutional theory holds that to attain legitimacy, a company tends to be isomorphic to actors in its home country and develop similar sustainability efforts as other companies in the country due to the country’s sustainability-infrastructure support (Dacin 1997; DiMaggio and Powell 1983). For example, the globally adopted United Nations Sustainable Development Goals are a form of coercive isomorphism to adhere to certain goals; modeling a company after other companies in the country or country initiatives regarding sustainability is a form of mimetic isomorphism; and following normative rules unique to a country is a form of normative isomorphism. The coercive, mimetic, and normative pressures of institutional theory suggest that companies cannot waver too far up or down on sustainability initiatives.
At the same time, resource-based theory suggests that even in the restrictive scenario presented in the country-company dynamics of sustainability initiatives, companies can leverage unique, idiosyncratic strategic resources above that of the country in which they reside (cf. Barney 1991; Wernerfelt 1984) to achieve superior product-market performance. At minimum, the amalgamation of strategic resources a company uses to address sustainability initiatives has a strong possibility to be valuable, rare, imperfectly imitable, and non-substitutable (Barney 1991) due to the mixture of country, industry, competitors, and customers involved.
Integrating the logic from institutional theory and resource-based theory, we apply the rationale that there is “tension” between the two theories, and that institutional theory presents boundary conditions for the unique leverage that can be realized by resource-based theory. We do, however, expect companies to be able to develop and implement sustainability initiatives that are to some extent above that of their home country and nonetheless at least maintain a positive product-market performance effect. To theoretically guide us in this endeavor, we build on configuration theory and the notion of “ideal profiles” of companies (e.g., Doty, Glick, and Huber 1993). Profile deviation studies normally select the highest performing 10% of companies to calibrate ideal profiles (e.g., Van de Ven and Drazin 1985, Venkatraman and Prescott 1990). In parallel, as a theoretical starting point and practical guide for the analyses, we expect that companies can implement sustainability initiatives that are 10 percent greater than the sustainability level achieved in a country’s infrastructure (cf. Van de Ven and Drazin 1985). As such, integrating institutional theory and resource-based theory and using guidance from configuration theory, H5 states:
Methods
Data Collection
We tested the five hypotheses using country, company, and customer-focused data gathered in 10 countries, including the nine Spanish-speaking sovereign countries in South America (Argentina, Bolivia, Chile, Colombia, Ecuador, Paraguay, Peru, Uruguay, and Venezuela) and the United States. South America occupies the entire southern part of the supercontinent of the Americas, and there are 12 independent countries and three territories on this continent. For data equivalence purposes (Hult et al. 2008), we excluded the three independent South American countries where the primary language is not Spanish (Brazil – Portuguese, Guyana – English, and Suriname – Dutch) as well as the three South American territories which are not considered sovereign states (Falkland Islands, French Guiana, and South Georgia and the South Sandwich Islands). The United States was included as a benchmark and independent sample due to its efforts on international competitiveness.
Professional marketing research companies in the 10 countries were used to identify the sampling frame, correlate the sampling frame across countries, and collect the data online using Qualtrics. For the survey instrument, we used a “parallel translation approach” and multiple translators to ensure that the questionnaire had semantic equivalence across languages (English and Spanish), conceptual equivalence across the countries, and normative equivalence to the source survey (which was created in English). Specifically, we used two translators to create the Spanish version of the questionnaire from English. Then we had two Spanish-English fluent translators attend to semantic, conceptual, and normative equivalences. Any differences of opinion between the translators was solved in conference. As such, we took precautions to ensure that the words and sentence structure in the translated items expressed the same meaning as in English (semantic equivalence), that the constructs used were the same across groups (conceptual equivalence), and, if needed, there was an ability of the translated items to address social norms that differ across the countries (normative equivalence).
In collecting the data, our focus was on (1) statistical power (Cohen 1988) and (2) data collection equivalence, the latter referred to as “whether the sources of data, the methods of eliciting data and the resulting samples are comparable across cultures, and can be viewed in relation to three elements: sampling frame comparability, data collection procedure, and sample comparability” (Hult et al. 2008, p. 1037). To eliminate the alternative explanation that differences in the sampling frame, data collection methods, and final samples account for differences across the 10 countries, we took steps to safeguard that (1) the sampling frame was the same across countries (senior manager working full-time for a company headquartered in the country), (2) the data collection method was the same for each country (online via Qualtrics), and (3) a random selection of companies was used from a country-specific representative sample to alleviate any uncontrolled, systematic errors biasing the estimators.
The survey instrument, statistical power, and data collection criteria led us to a sample of n = 4,051 for the 10 countries. The country samples are: Argentina, n = 437; Bolivia, n = 355; Chile, n = 286; Colombia, n = 480; Ecuador, n = 548; Paraguay, n = 247; Peru, n = 297; Uruguay, n = 484; Venezuela, n = 388; and the USA, n = 529. On average, the companies in the database are 44 years old (range across countries: 28 to 69 years), employ 2,377 people (range across countries: 938 to 3,680 people), and are dispersed across all ten economic sectors of the globally used Harmonized Commodity Description and Coding System (agriculture, forestry, and fishing, n = 110; mining, n = 60; construction, n = 249; manufacturing, n = 344; transportation, communications, electric, gas, and sanitary services, n = 352; wholesale trade, n = 270; retail trade, n = 394; finance, insurance, and real estate, n = 259; services, n = 1,433; and public administration, n = 580). The company age range (28 to 45 years) and company size range (769 to 1,486 people) among the South American countries are relatively consistent while the US companies are, on average, older (69 years) and larger (3,680 people employed). Descriptive statistics (means, standard deviations) and bivariate correlations are included in Table 1 for the overall sample (n = 4,051).
Descriptive Statistics and Correlations for the Overall Sample.
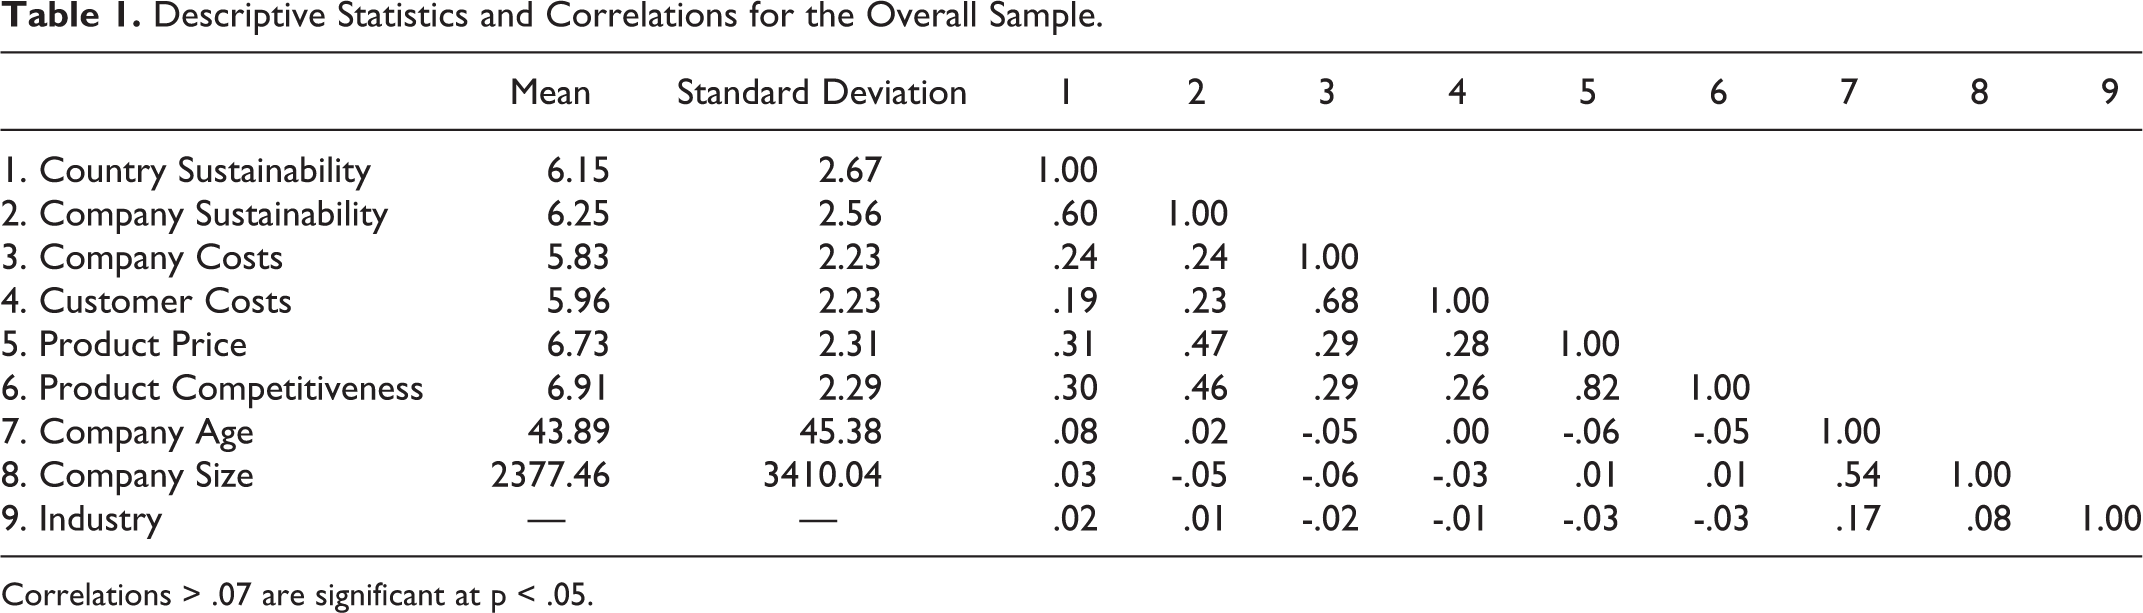
Correlations > .07 are significant at p < .05.
Dependent Variable
To align with the study’s focus on the effects of a company’s sustainability activities – rooted in the United Nations’ Sustainable Development Goals (United Nations 2015) – on product-market performance (e.g., Morgan 2012; O’Sullivan and Abela 2007), the dependent variable was anchored by growth of the market competitiveness of the company’s portfolio of products (e.g., Buckley, Pass, and Prescott 1998). Performance in t0 was the temporal reference point to t1 (compared with last year, our company’s products are much more competitive in the marketplace; en comparación con el año anterior, los productos de nuestra empresa son mucho más competitivos en el mercado). To assess the validity of the dependent variable (DV) prior to the hypothesis testing, we tested the bivariate correlations between product-market performance (“product competitiveness”) and return-on-investment (.27, p<.01), sales growth (.25, p<.01), Tobin’s Q (.56, p<.01), and Altman’s Z (.38, p<.01). In each case, the DV of product competitiveness is significantly related to traditional firm-level accounting and financial-market performance variables, as would be expected if the variable has criterion and concurrent validity (Standards for Educational and Psychological Testing 2014) and is temporally embedded in the marketing-performance outcome chain (Katsikeas, Morgan, Leonidou, and Hult 2016).
Independent Variables
Sustainability
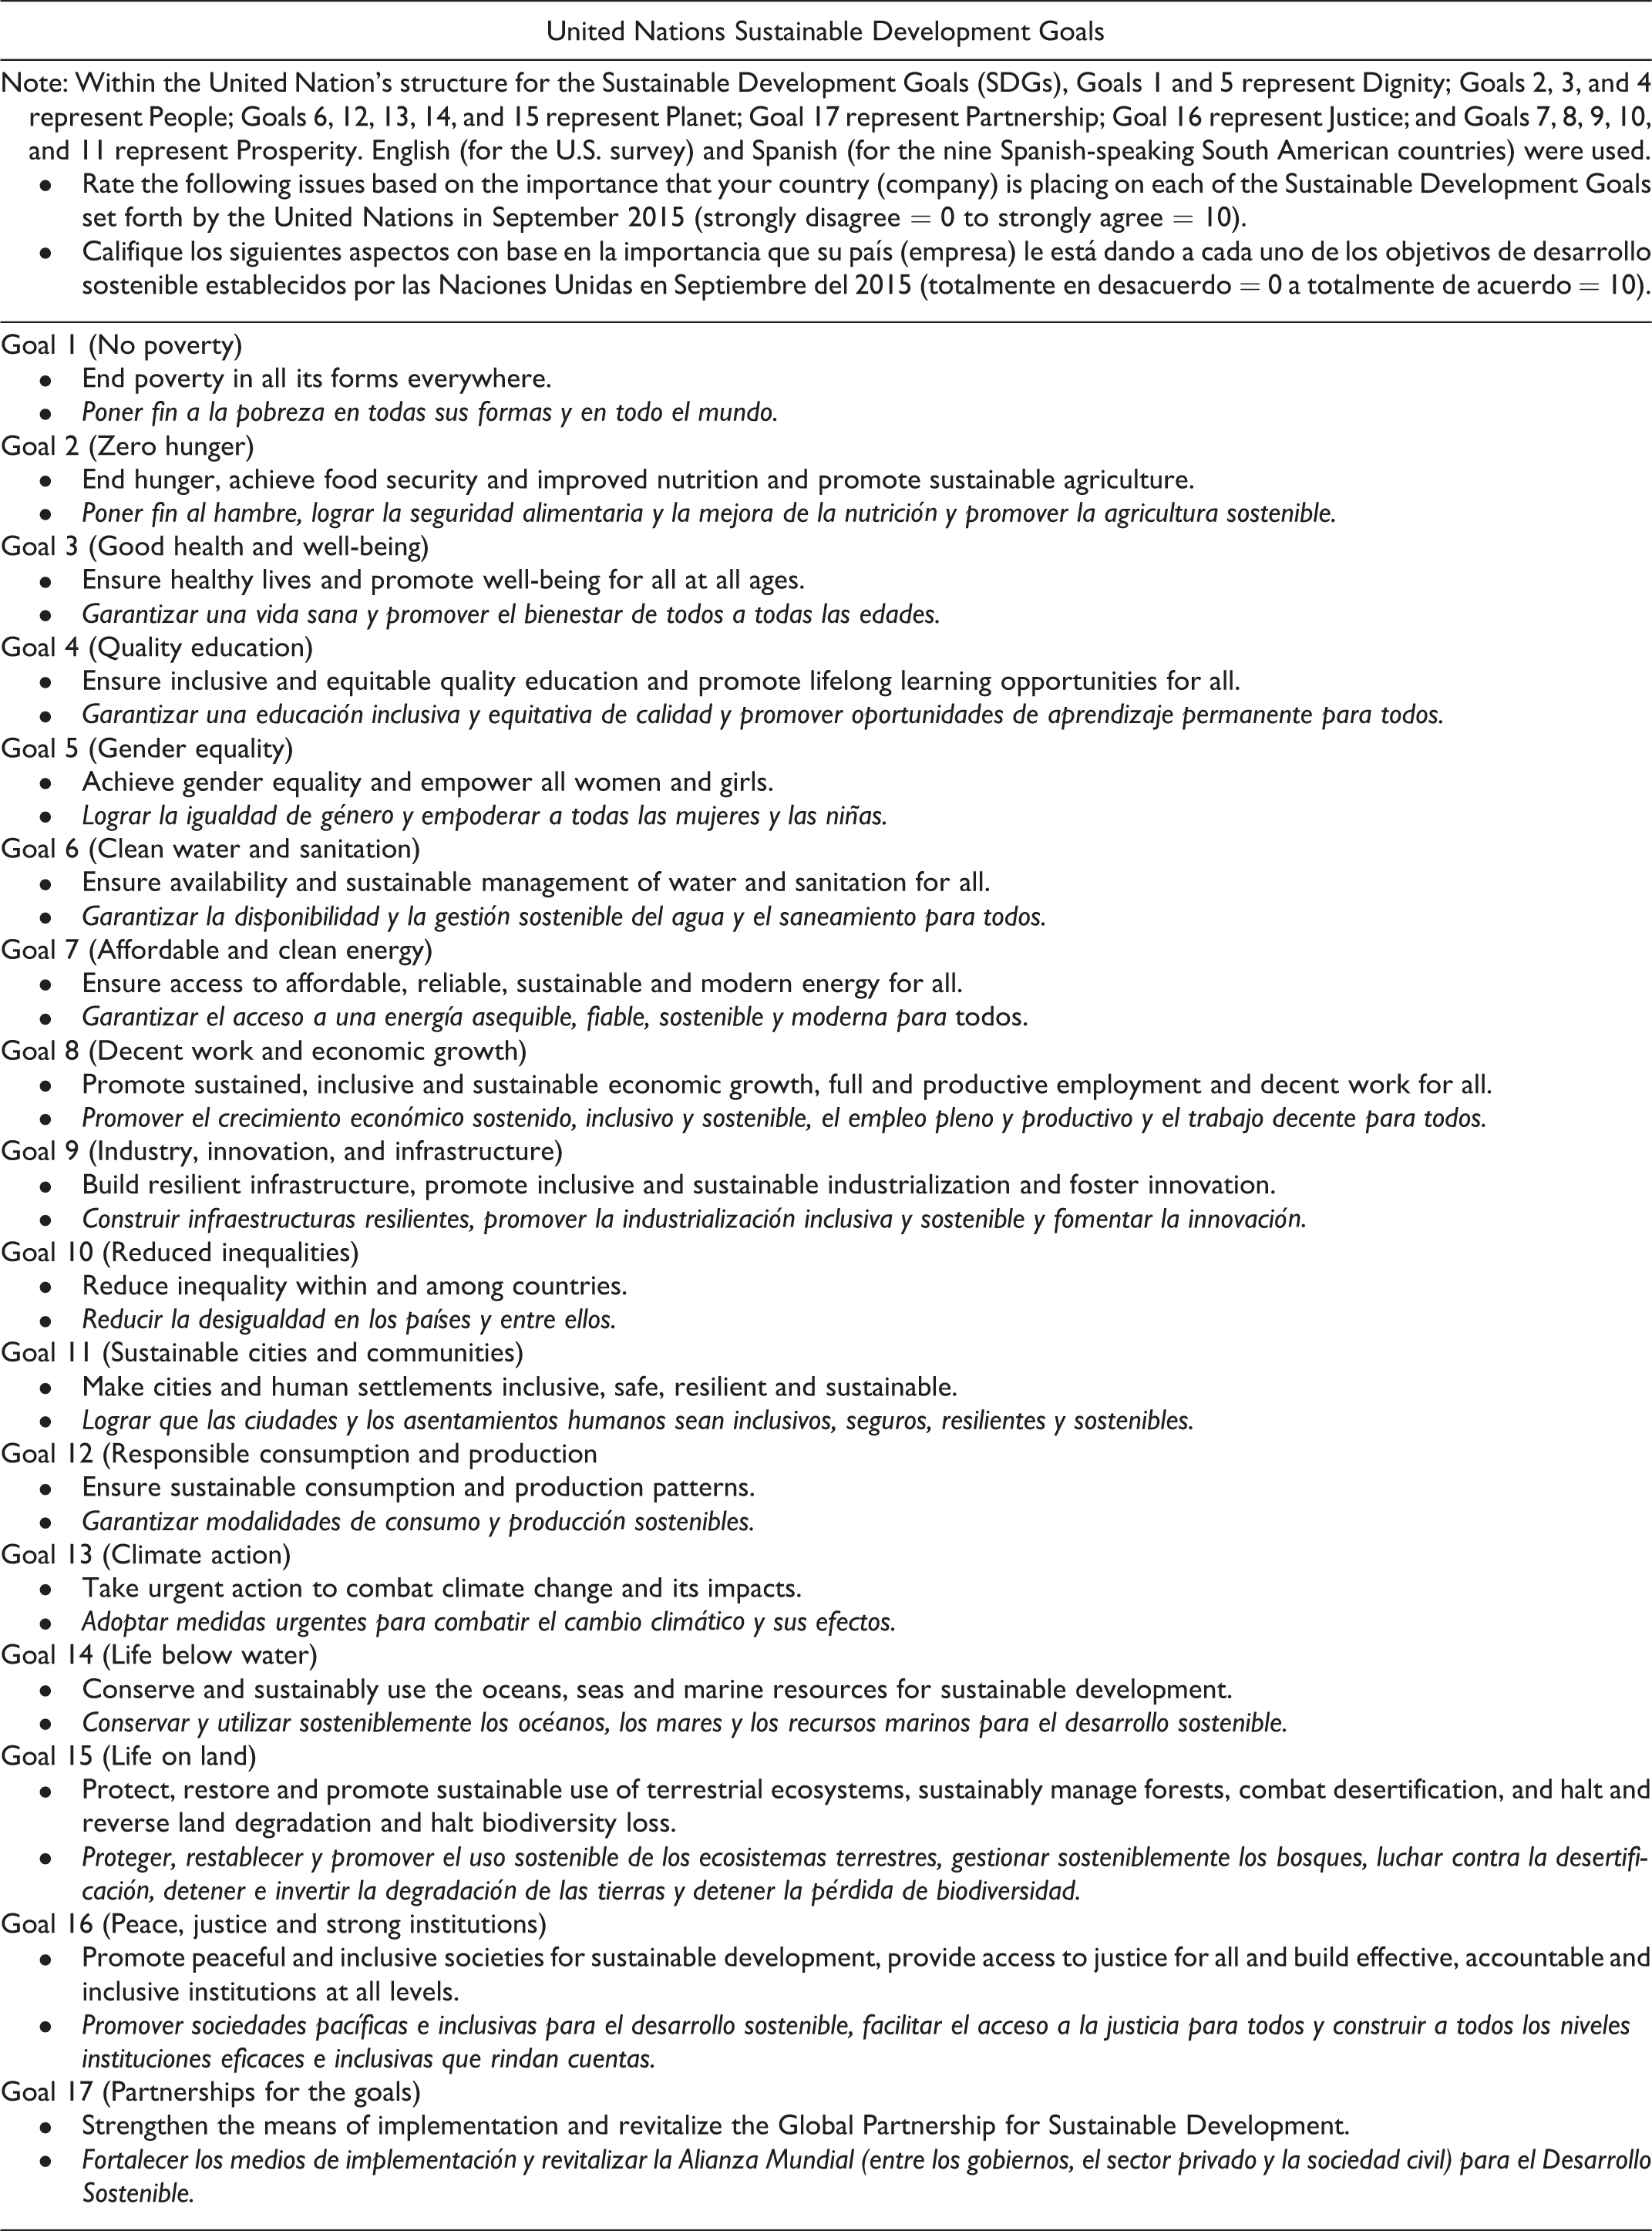
On September 25, 2015, the United Nations and its 193-member countries ratified the “Sustainable Development Goals…to set goals to end poverty, protect the planet, and ensure prosperity for all as part of a new sustainable development agenda” (United Nations 2015). Seventeen goals were created as an extension and refined update of the earlier version called the “Millennium Development Goals” (Griggs et al. 2013). The millennium goals targeted issues related to dignity, people, planet, and partnership. Those four issues and the additions of justice and prosperity form the six dimensions aligned with the 17 “Sustainable Development Goals.” In our research, we asked the respondents to rate each of the 17 formative scale items based on the importance that their (1) country and (2) company are placing on each of the goals (i.e., each item was rated twice, once for the company’s sustainability efforts and once for the country’s sustainability infrastructure). A Likert-type scale ranging from “Strongly Disagree” = 0 to “Strongly Agree” = 10 was used. We weighted each of the six dimension equally in creating an aggregate index for “Country Sustainability” and “Company Sustainability,” respectively. The 17 goals, instructions, and items are included in the Appendix (in both English and Spanish), with goals 1 and 5 representing dignity; goals 2, 3, and 4 representing people; goals 6, 12, 13, 14, and 15 representing planet; goal 17 representing partnership; goal 16 representing justice; and goals 7, 8, 9, 10, and 11 representing prosperity (Nilsson, Griggs, and Visbeck 2016).
Company costs, customer costs, and product price
The two measurement scales for Company Costs and Customer Costs were adapted from work by Kirmani (1990). Each scale has three reflective items anchored by “a very high cost” (un costo muy alto) = 0 to “no cost at all” (sin costo) = 10. For the scale measuring Company Costs, the items are: (1) our company bears considerable costs for its sustainable development activities (COcost1; nuestra empresa tiene costos considerables por sus actividades de desarrollo sostenible); (2) the money our company invests on sustainable development activities is very large (COcost2; el dinero que nuestra empresa invierte en actividades de desarrollo sostenible es muy alto); and (3) our company incurs very high costs for its sustainable development engagement (COcost3; nuestra empresa incurre en altos costos por su compromiso al desarrollo sostenible). For Customer Costs, the parallel items are: (1) our customers bear considerable costs for our company’s sustainable development activities (CUcost1; nuestros clientes/consumidores tienen costos considerables por las actividades de desarrollo sostenible de nuestra empresa); (2) the money our customers invest in our company’s sustainable development activities is very large (CUcost2; el dinero que nuestros clientes/consumidores invierten en actividades de desarrollo sostenible de nuestra empresa es muy alto); and (3) our customers incur very high costs for our company’s sustainable development engagement (CUcost3; nuestros clientes/consumidores incurren en altos costos por el compromiso al desarrollo sostenible de nuestra empresa). The price competitiveness item was based on Buckley, Pass, and Prescott (1998), with a scaling from “strongly disagree (totalmente en desacuerdo)” = 0 to “strongly agree (totalmente de acuerdo)” = 10: Compared with last year, our company’s prices are much more competitive in the marketplace (en comparación con el año anterior, los precios de nuestra empresa son mucho más competitivos en el mercado).
Table 2 summarizes the results of the measurement analyses for the reflective scales of Company Costs and Customer Costs by country, region, and overall samples. The psychometric properties were evaluated via confirmatory factor analyses (CFA) using LISREL 9.20 (Jöreskog et al. 2000). The model fits were evaluated using the Comparative Fit Index (CFI) and the Root Mean Square Error of Approximation (RMSEA). Composite reliability was calculated using the procedures outlined by Fornell and Larcker (1981) based on Werts, Lin, and Jöreskog (1974). In each of the 10 countries, region of South America, and overall sample, the parameter estimates (factor loadings) ranged from .67 to .99, the composite reliabilities ranged from .86 to .96, and the average variances extracted ranged from .67 to .89. The CFI ranged from .88 to .99 and the RMSEA ranged from .02 to .09. Each measurement statistic indicates valid and reliable scales.
Measurement Analysis of Reflective Scales.
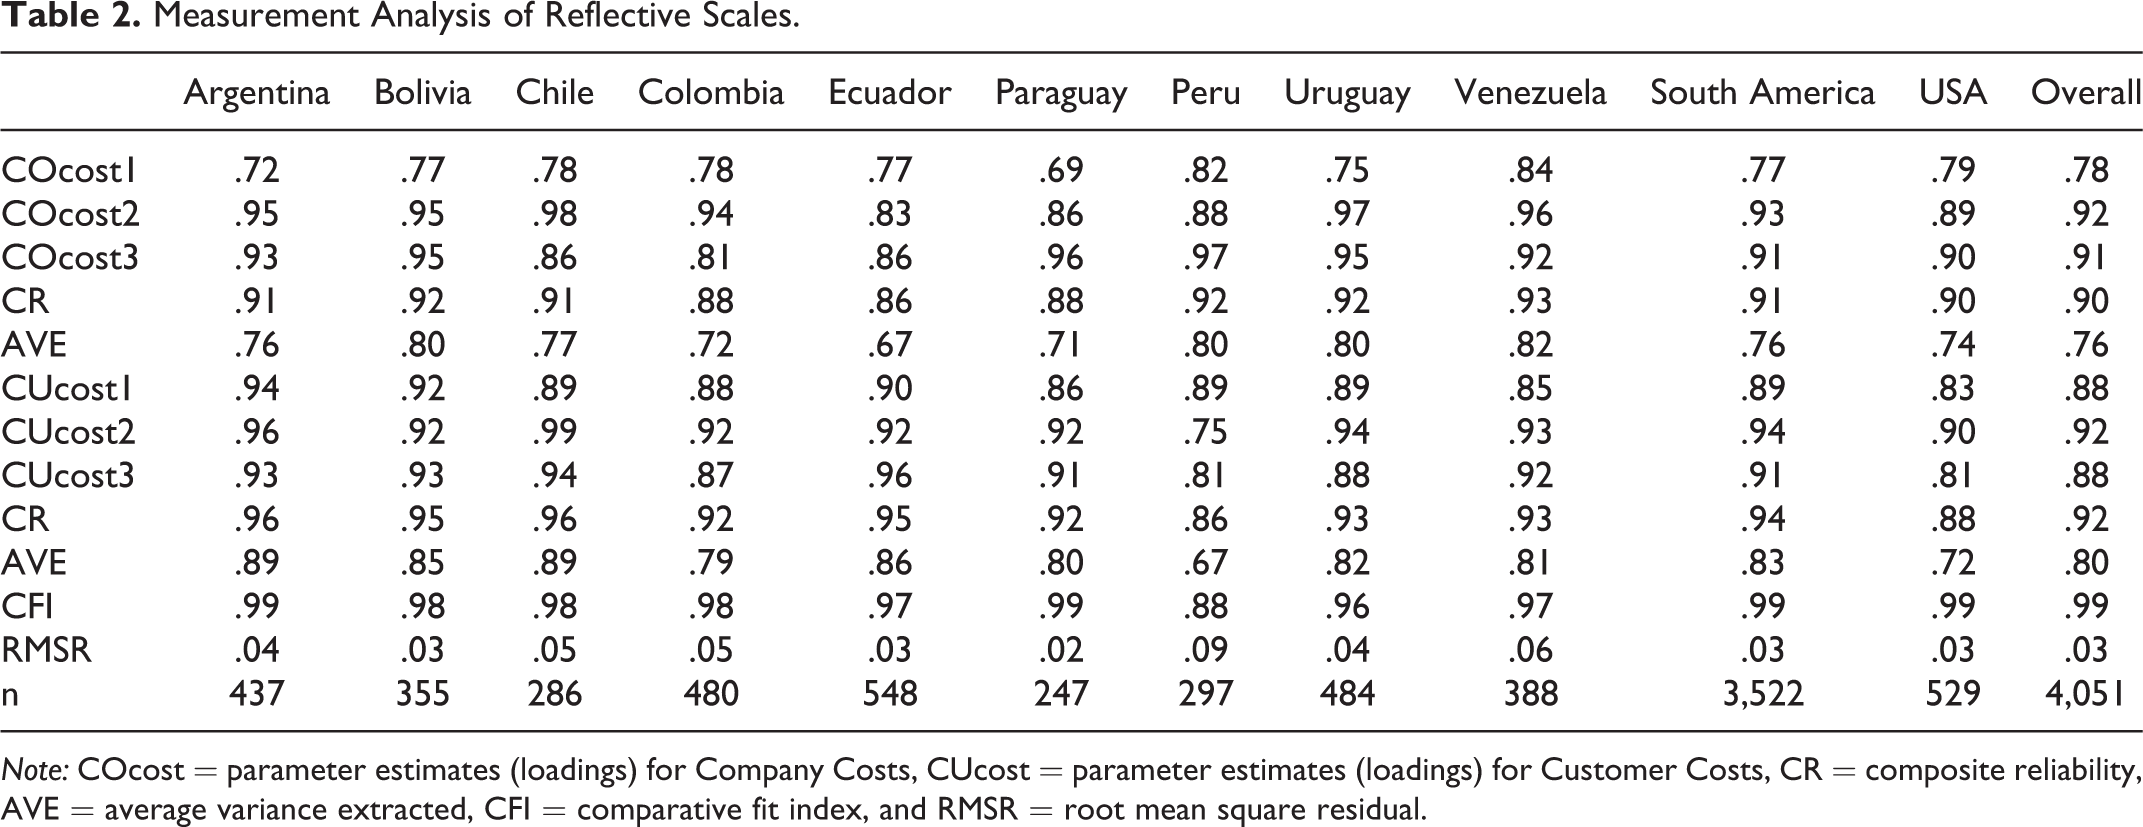
Note: COcost = parameter estimates (loadings) for Company Costs, CUcost = parameter estimates (loadings) for Customer Costs, CR = composite reliability, AVE = average variance extracted, CFI = comparative fit index, and RMSR = root mean square residual.
However, since our research incorporates data collected in 10 countries, a need exists to establish measurement equivalence across countries prior to the hypothesis testing (Steenkamp and Baumgartner 1998). The assumption is that factor loadings, factor correlations, and error variances are invariant across countries. To test these premises, four different CFA models were analyzed and a chi-square (χ2) difference test was performed on the nested models. First, we ran a model where the factor loadings, factor correlations, and error variances are all invariant across the 10 countries (χ2 = 1,668.75, df = 197). Second, we analyzed a model where the factor loadings are allowed to differ across each of the 10 countries (χ2 = 1,632.17, df = 143). The Δχ2 = 36.58 and Δdf = 54, which is not significant. Adding two more models (freely estimated error variances and factor loadings; freely estimated error variances only), as expected, resulted in no improvements. Thus, the measurement scales are robust across countries.
Discriminant validity between Company Costs and Customer Costs was assessed using the procedures recommended by Anderson (1987), Bagozzi and Phillips (1982), and Fornell and Larcker (1981). First, this entails analyzing the pair of constructs in a series of two-factor CFA models for the country, region, and overall samples. Each model was run twice – once constraining the phi coefficient (φ) to unity and once freeing this parameter. A chi-square (χ2) difference test was performed on the nested models to assess if the χ2 values were significantly lower for the unconstrained models. The critical value (▵χ2 (1)>3.84) was exceeded in all cases. Second, we examined the confidence interval (+/− two standard errors) built around the correlation between pairs of constructs to see whether it includes 1.0 (Anderson 1987). None of the intervals includes 1.0, indicating discriminant validity between constructs. Third, we examined the difference between the Average Variances Extracted (AVE) for each construct and compared it with the Shared Variances (SV) across constructs. In all cases, the AVE was higher than the corresponding SVs. The SVs were also .46 (lower than the preferred .50 value) while the AVEs were .76 to .89 for Company Costs and Customer Costs, respectively (higher than the preferred 50 percent). This indicates that the measures possessed robust discriminant validity.
In addition, we used the CFA structure to assess common method variance. We employed a CFA approach to Harman’s one-factor test (McFarlin and Sweeney 1992; Sanchez and Brock 1996). The rationale for this test is that if common method bias poses a serious threat to the analysis and interpretation of the data, a single latent factor would account for all manifest variables (Jarvis, MacKenzie, and Podsakoff 2003). A worse fit for the one-factor model would suggest that CMV does not pose a serious threat. In all cases, the fits are worse for the unidimensional models, suggesting that CMV is not a threat to the analyses.
Control variables
In addition to controlling for the country’s level of sustainability via the 17 Sustainable Development Goals (see Appendix) to evaluate a company’s effect of sustainability on product-market performance, we included three additional control variables: company age (years), company size (number of employees), and industry classification (agriculture, forestry, and fishing; mining; construction; manufacturing; transportation, communications, electric, gas, and sanitary services; wholesale trade; retail trade; finance, insurance, and real estate; services; and public administration). The industry classification was grouped into the ten economic sectors in the Harmonized Commodity Description and Coding System (HS). The HS system is an internationally standardized system to classify traded products that can be aligned with the North American Industry Classification System (NAICS) and the Standard Industrial Classification (SIC).
Analyses and Results
Table 3 to Table 8 present the results of the hypothesis testing (H1 to H5) and Figure 1 provides a depiction of the relationships studied. Table 3 reports on the effects of a company’s sustainability activities on product-market performance (H1). Table 4 summarizes the results of H2, which examines the potential for greater effects of a company’s sustainability activities on product-market performance when the company and customer costs are contained and when the product prices are at least market competitive. Table 5 addresses the sensitivity to increased costs (company and customer) and higher product prices (H3, H4). Table 6 and Table 7 deal with containing multiple costs (H2) as well as increasing multiple costs (H3), respectively. Table 8 reports on a company’s sustainability efforts at 110% of the country’s sustainability infrastructure, but also provides data on the maximum above or below the country’s sustainability level a company can be to achieve performance benefits (H5).
Effects of a Company’s Sustainability Activities on Product-Market Performance (H1).
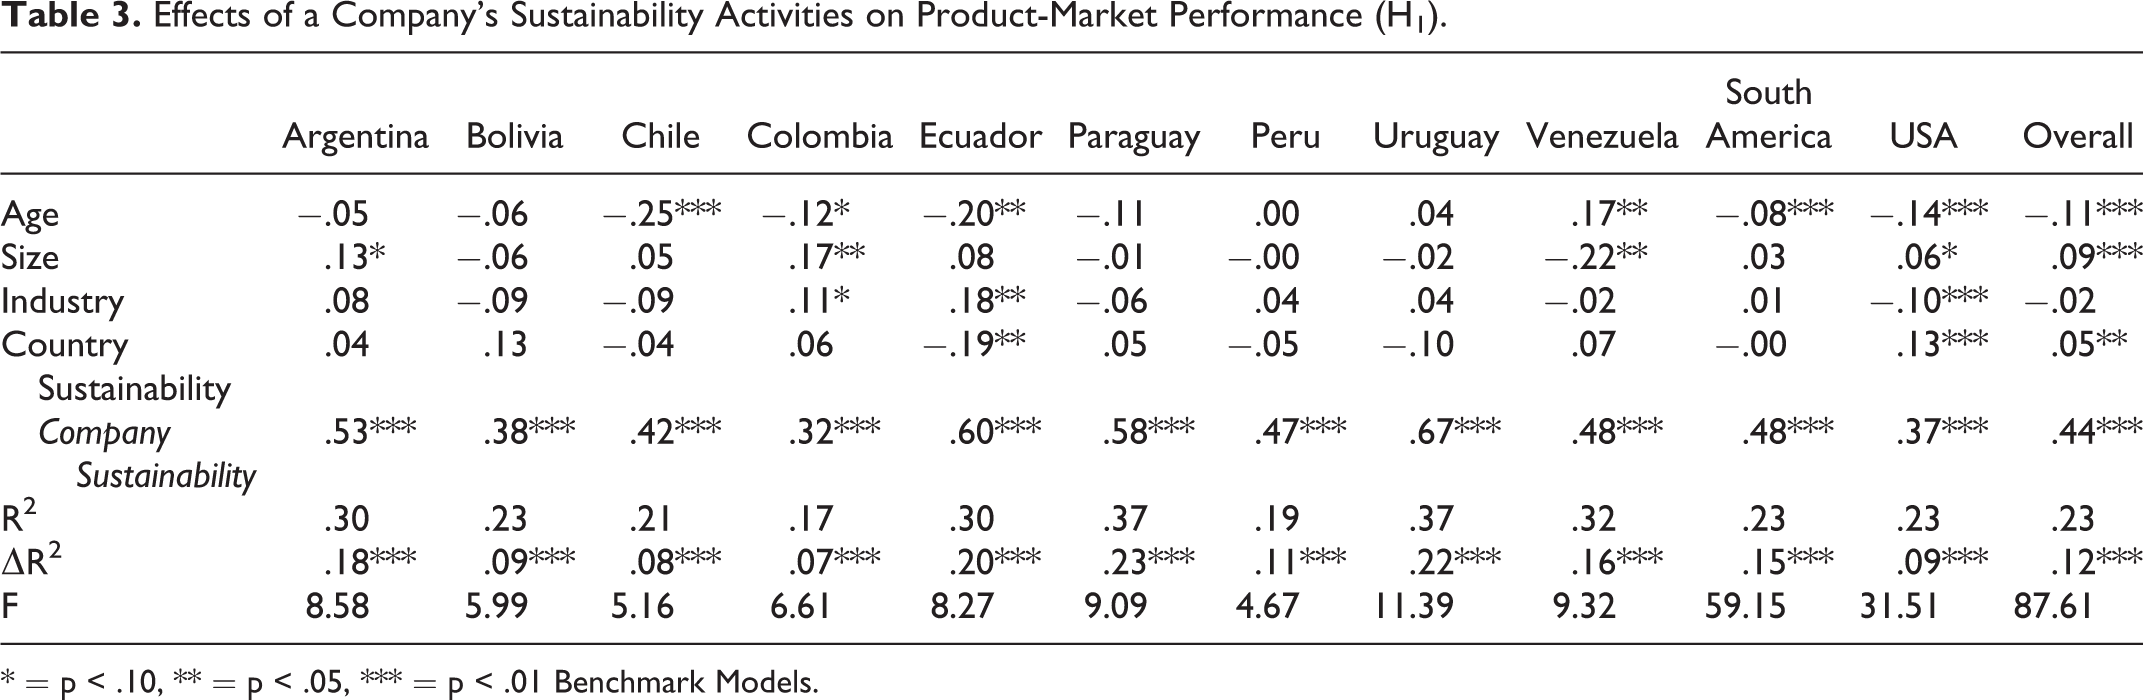
* = p < .10, ** = p < .05, *** = p < .01 Benchmark Models.
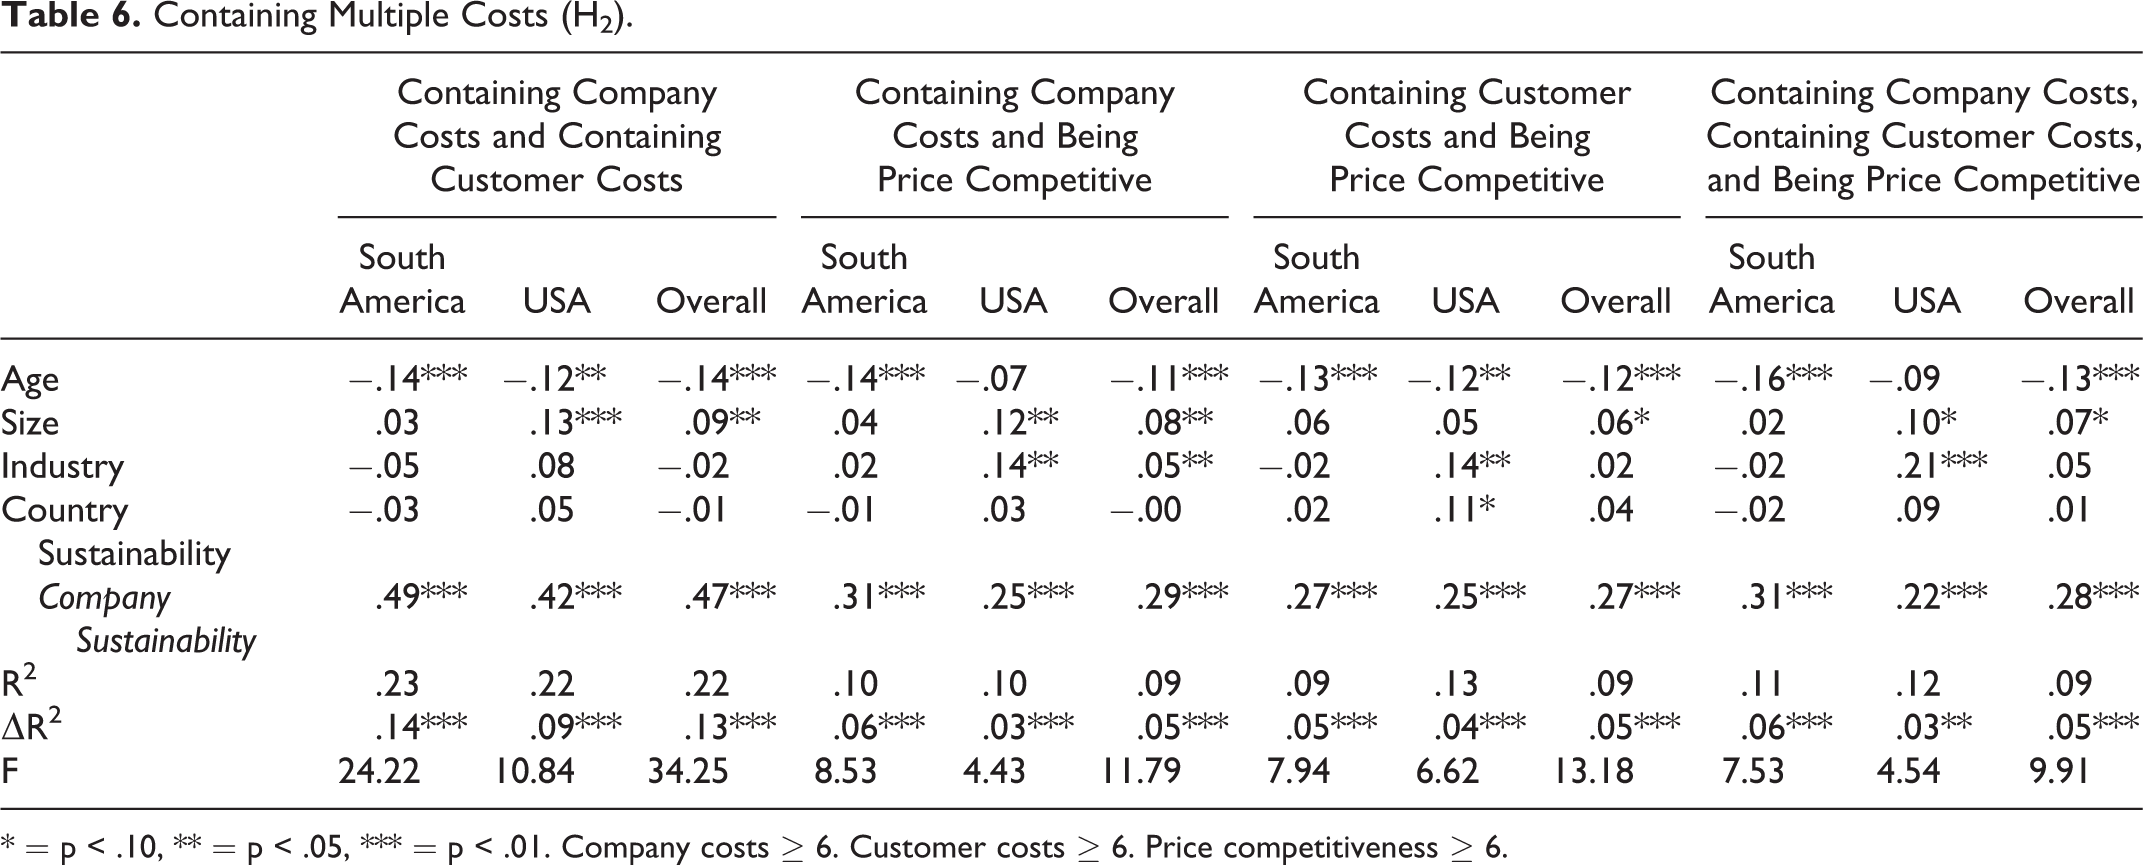
Containing Company Costs, Customer Costs, and Being Price Competitive (H2).
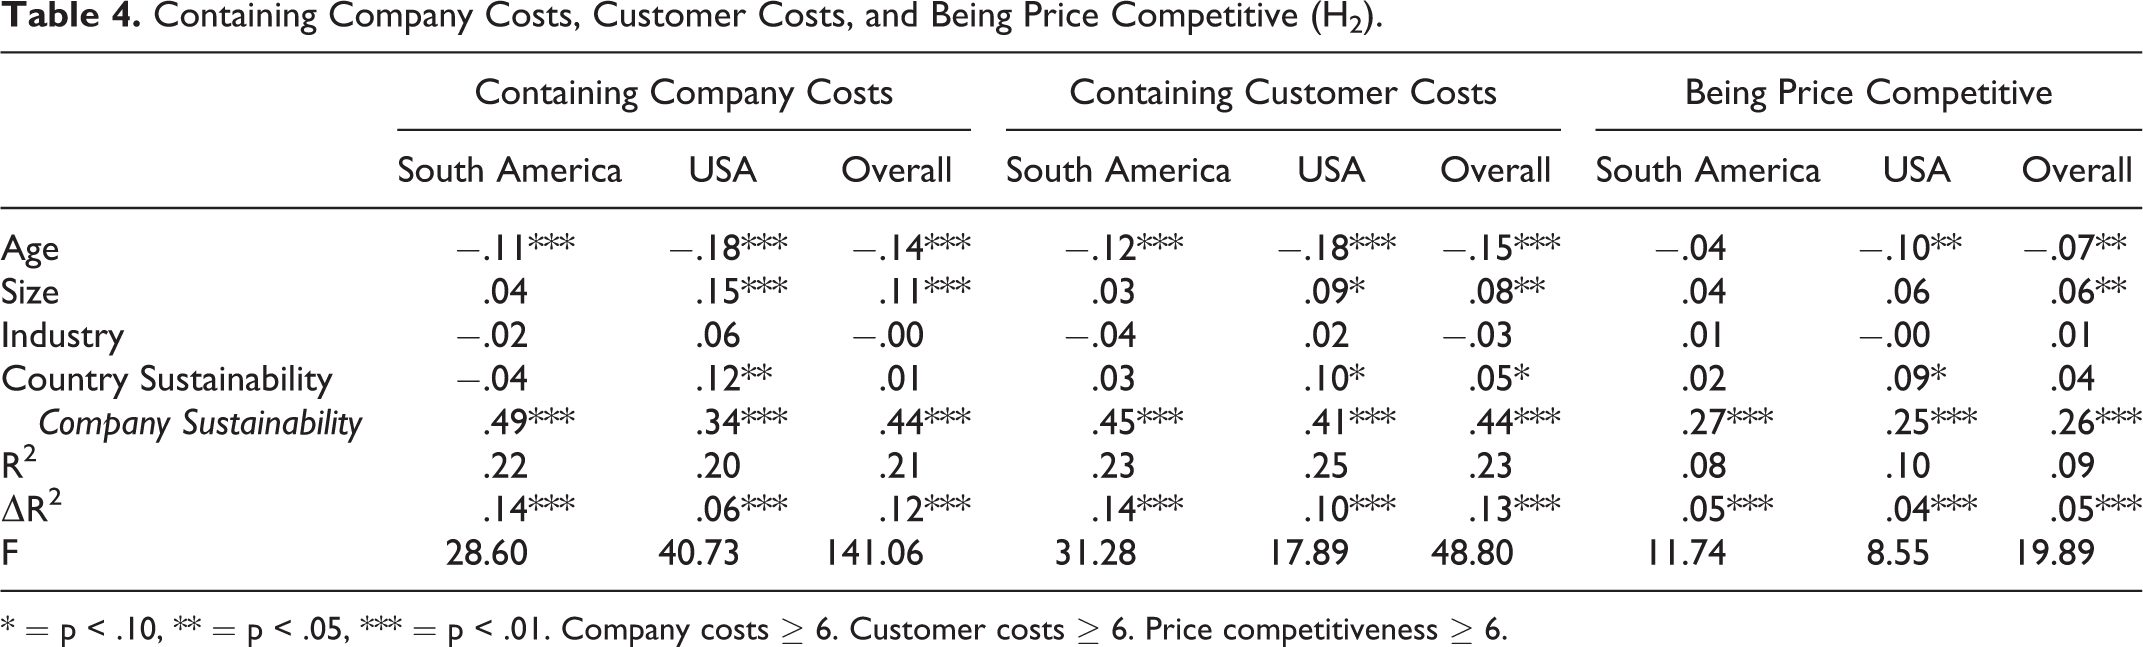
* = p < .10, ** = p < .05, *** = p < .01. Company costs ≥ 6. Customer costs ≥ 6. Price competitiveness ≥ 6.
Increasing Company Costs, Customer Costs, and Being Price Expensive (H3, H4).
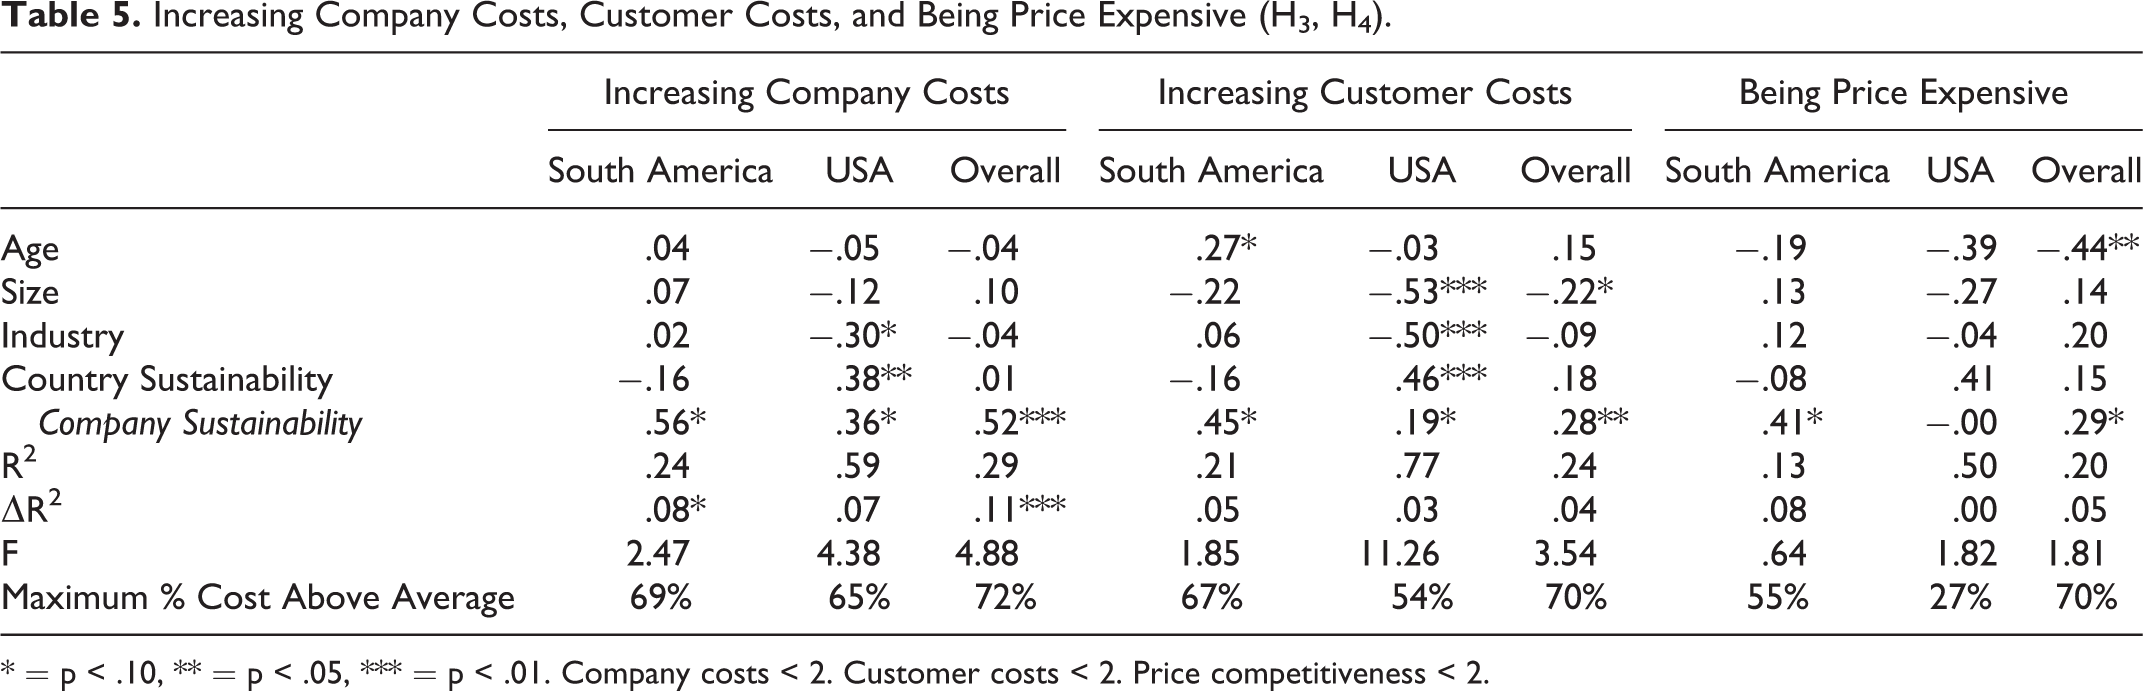
* = p < .10, ** = p < .05, *** = p < .01. Company costs < 2. Customer costs < 2. Price competitiveness < 2.
Containing Multiple Costs (H2).
* = p < .10, ** = p < .05, *** = p < .01. Company costs ≥ 6. Customer costs ≥ 6. Price competitiveness ≥ 6.
Increasing Multiple Costs (H3).
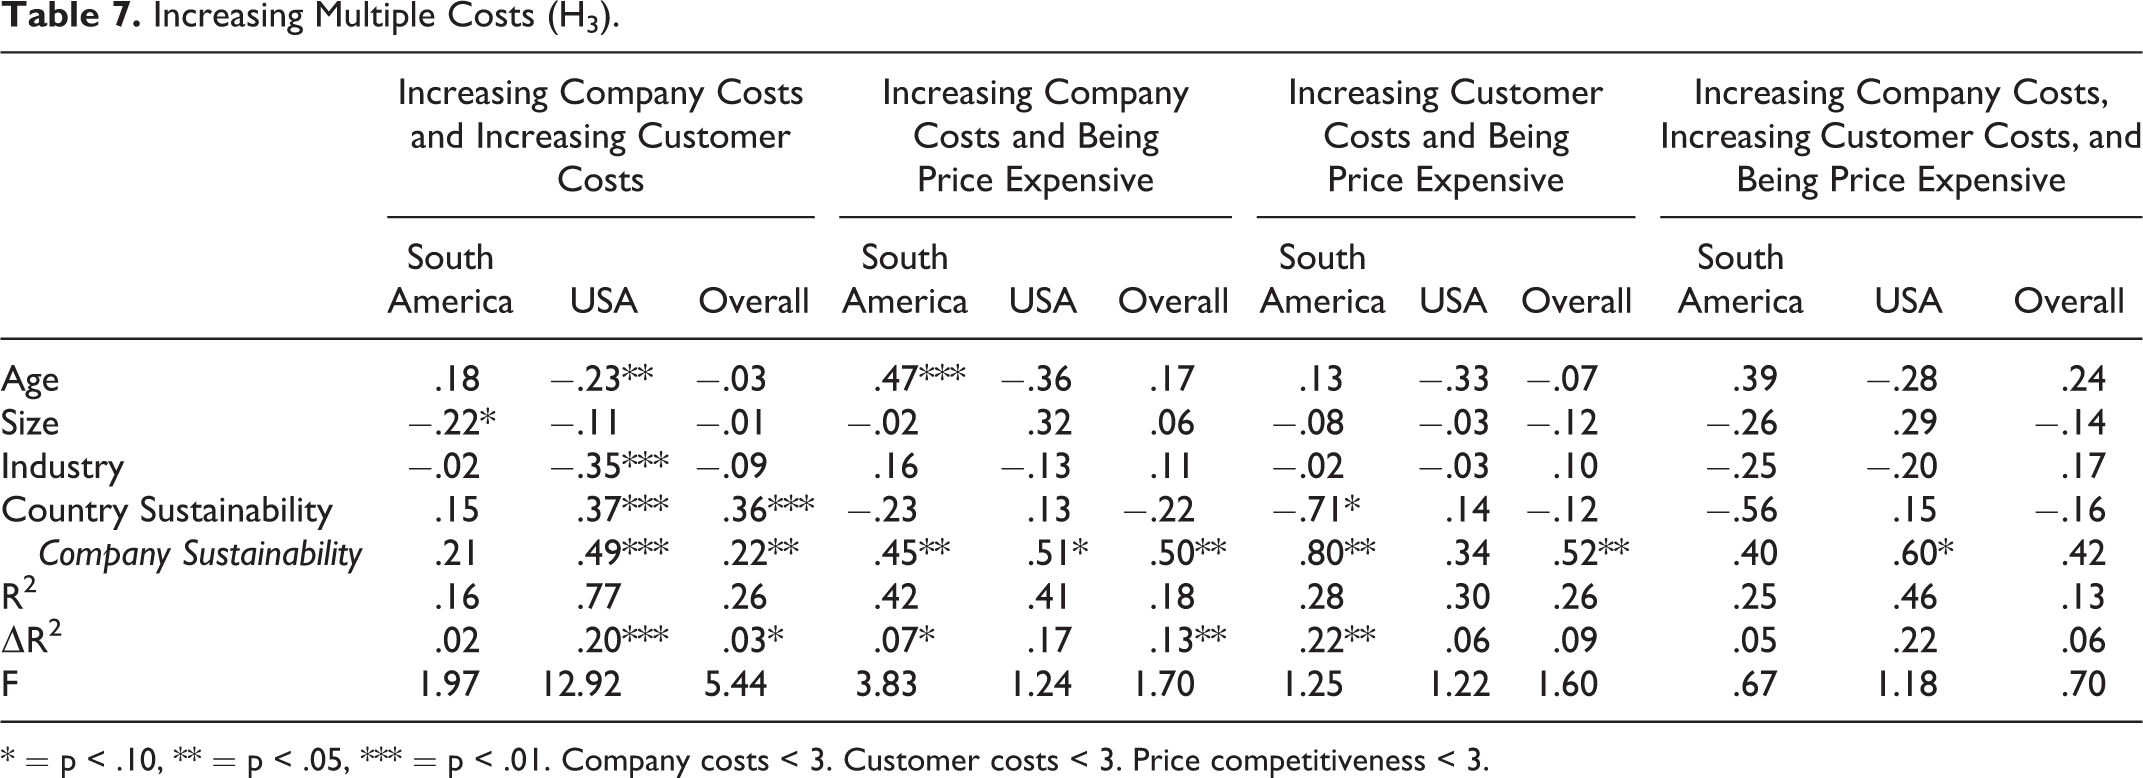
* = p < .10, ** = p < .05, *** = p < .01. Company costs < 3. Customer costs < 3. Price competitiveness < 3.
Company Sustainability Efforts at 110% of Country Sustainability (H5).
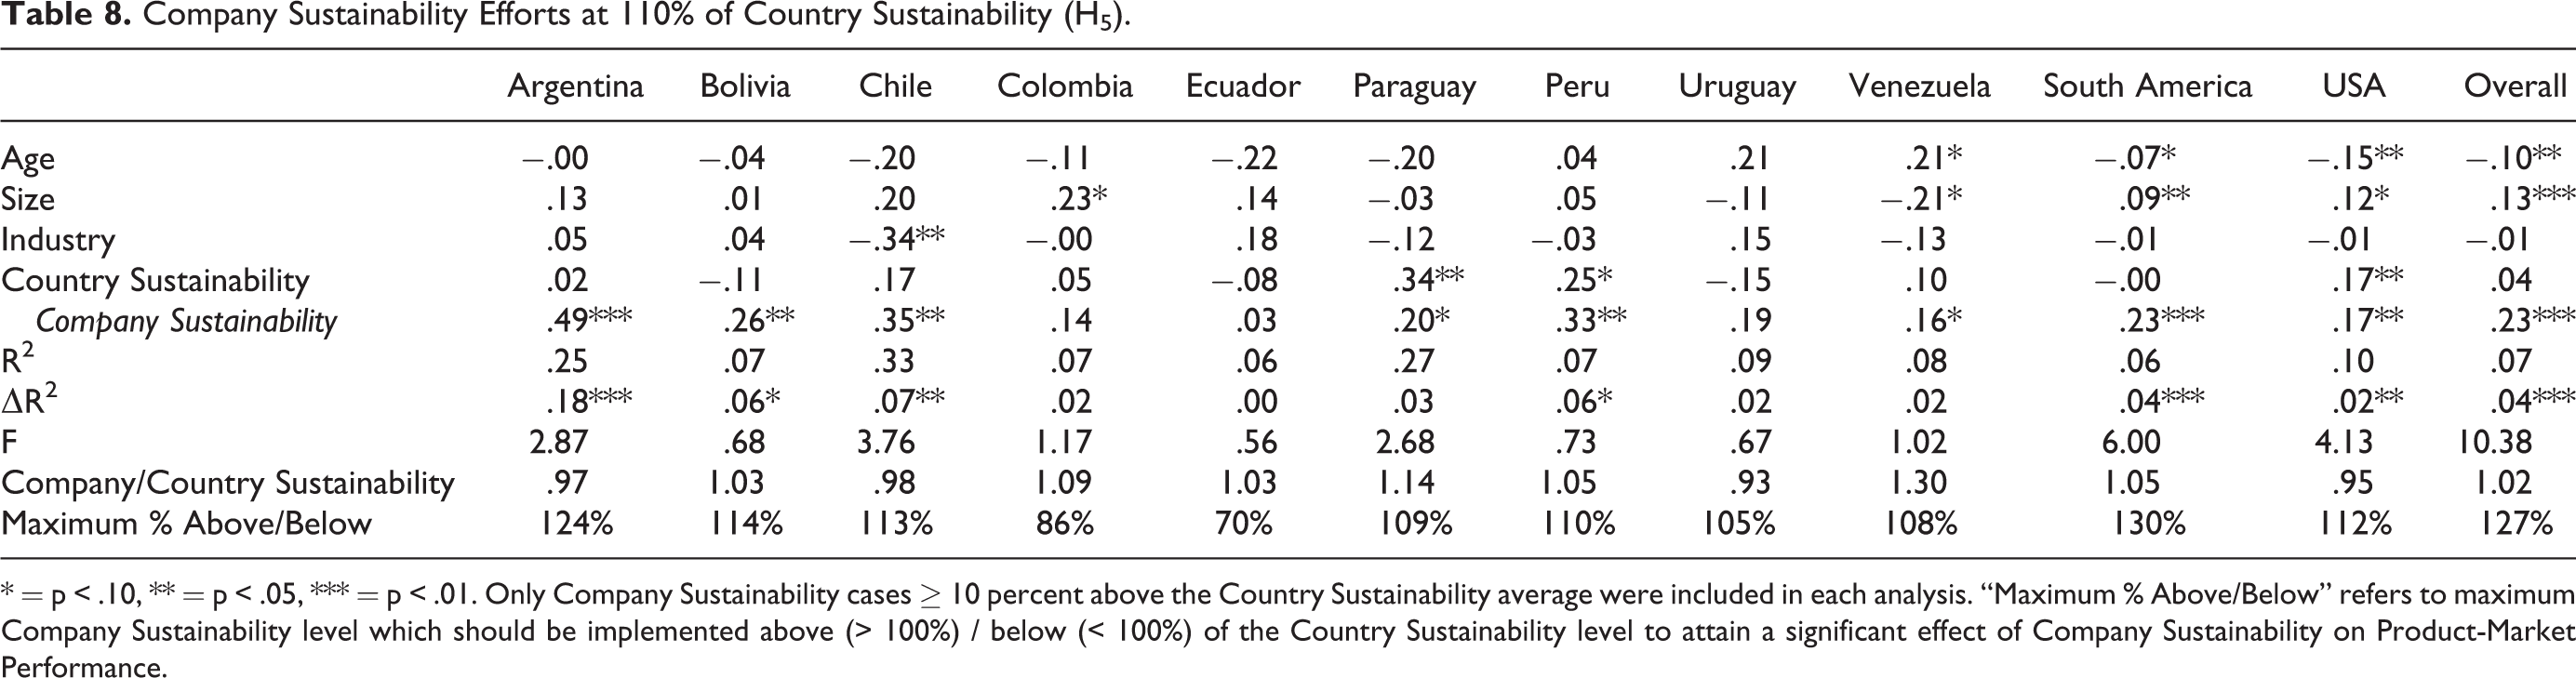
* = p < .10, ** = p < .05, *** = p < .01. Only Company Sustainability cases ≥ 10 percent above the Country Sustainability average were included in each analysis. “Maximum % Above/Below” refers to maximum Company Sustainability level which should be implemented above (> 100%) / below (< 100%) of the Country Sustainability level to attain a significant effect of Company Sustainability on Product-Market Performance.
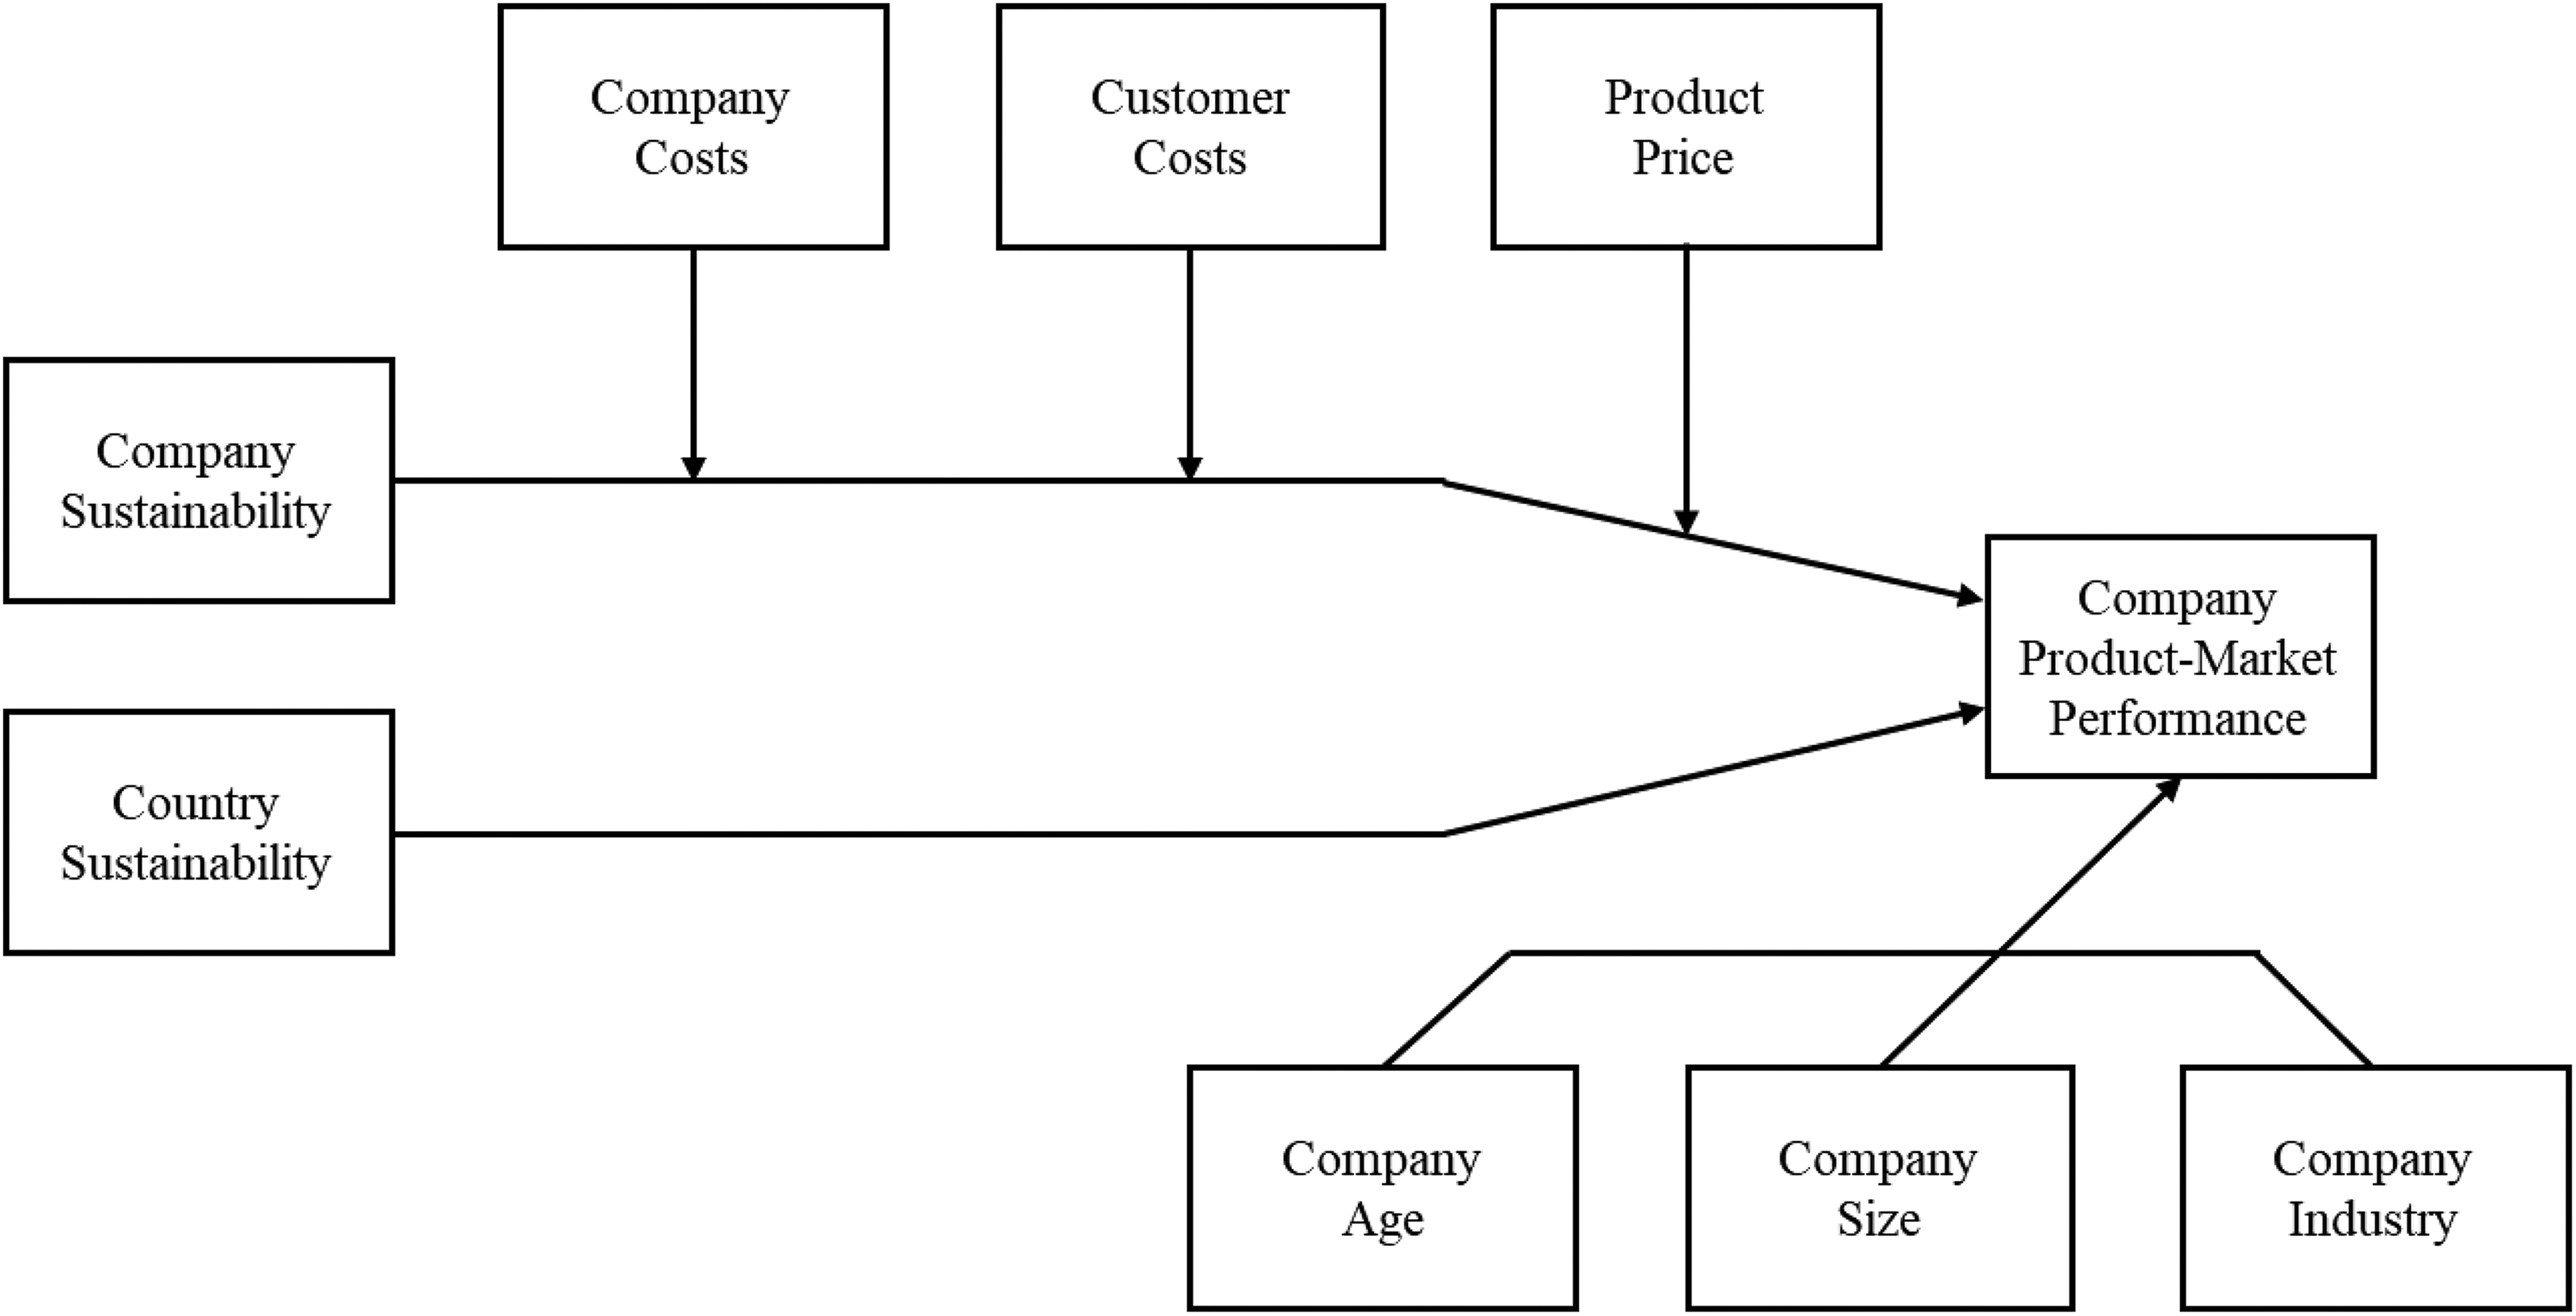
Country-Company Sustainability and Product-Market Performance: Influences of Company Costs, Customer Costs, and Product Prices.
Each hypothesis was examined via hierarchical multiple regression where the controls where entered first, followed by the hypothesized effect (Cohen, Cohen, West, and Aiken 2003). In analyzing the regression models, we also ensured that the Variance Inflation Factors (VIF) did not inhibit the results and that the effect sizes for the models confirmed sufficient power. The VIFs were lower than 2.15, indicating that multicollinearity does not significantly affect the analyses. Additionally, at a confidence level of 90 percent, the margin of error in each of the ten countries averages 4.15 percent and the probability of finding the R2 s achieved was β > .90 at α = .05 (except of course in cases with insignificant predictors). As such, tolerable levels of multicollinearity and adequate power were found in all models (e.g., Cohen et al. 2003).
H1 states that a company’s sustainability activities have a significant positive effect on the company’s product-market performance above the sustainability efforts provided by the company’s home country. The results for H1 are in Table 3 and include country-specific analyses, region analysis for South America, and an overall analysis. In all 12 analyses, company sustainability has a positive effect on product-market performance, with beta coefficients ranging from .32 to .67 (p<.01), overall R2 ranging from .17 to .37 (p<.01), and the ΔR2 from entering the controls in step 1 to the company sustainability variable in step 2 ranging from .07 to .23 (p<.01) in the 12 models. As such, H1 is supported.
H2 states that a company’s sustainability activities have a greater significant positive effect on the company’s product-market performance when (a) company costs are contained, (b) customer costs are contained, and/or (c) product prices are competitive, while accounting for sustainability efforts provided by the company’s home country. The results for H2 are in Table 4 and Table 6 and include analyses for South America, USA, and the overall sample (to ensure adequate power – β > .90 at α = .05 – we only conducted region, USA, and overall analyses for H2, H3, and H4). For H2, this included a combination of moderating influences of company costs, customer costs, and product prices (where company costs ≥ 6, customer costs ≥ 6, and product prices ≥ 6). Sample sizes restrict us from conducting country analyses. In all 21 analyses, company sustainability has a positive effect on product-market performance when company costs, customer costs, and/or product prices are contained (i.e., not adversely affecting the market competitiveness of the product due to sustainability efforts increasing costs and/or prices). The beta coefficients range from .22 to .49 (p<.01), overall R2 range from .08 to .25 (p<.01), and the ΔR2 from entering the controls to the company sustainability variable range from .03 to .14 (p<.05) in the 21 models.
When comparing the beta coefficients across the models represented in H1 (see Table 3, shaded area) and the corresponding models represented in H2 (Clogg, Petkova, and Haritou 1995; Cohen, Cohen, West, and Aiken 2003), only the beta coefficients in the models for South America – company costs (Z-score = 2.94, p<.01) and USA – customer costs (Z-score = 7.41, p<.01) in Table 4, and South America – company and customer costs (Z-score = 2.85, p<.01), USA – company and customer costs (Z-score = 6.74, p<.01), and the overall model for company and customer costs (Z-score = 12.54, p<.01) in Table 6 are larger. However, sensitivity analyses – where the cutoff for company costs, customer costs, and product price approach the highest score possible (10) – suggest that lowering company costs and customer costs have an effect but no such effect was found for product prices. At company costs ≥ 8 and customer costs ≥ 8, the beta coefficients in the models for USA – company costs (Z-score = 3.67, p<.01), overall – company costs (Z-score = 5.37, p<.01), South America – customer costs (Z-score = 7.13, p<.01), and overall – customer costs (Z-score = 24.45, p<.01) also become larger than the benchmark in Table 3. Consequently, H2 was supported in 9 of 21 models (when both the regular and sensitivity analyses are taken into account).
H3 states that a company’s sustainability activities have no effect on the company’s product-market performance when (a) company costs are high, (b) customer costs are high, and/or (c) product prices are expensive. In opposite to the analyses for H2, for H3 we conducted analyses that took into account increased company costs, increased customer costs, and/or increased product prices. The results for H3 are in Table 5 and Table 7 and include analyses for South America, USA, and the overall sample for a combination of moderating influences of company costs, customer costs, and product prices. Company costs < 2, customer costs < 2, and product prices < 2 for the individual cost analyses (table 5), and company costs < 3, customer costs < 3, and product prices < 3 for the multiple-cost analyses (Table 7). In seven of the 21 analyses, company sustainability did influence product-market performance positively at the p<.05 level (and positively in an additional eight analyses at the p<.10 level). However, 12 of the 21 models had F-values < 1.96. Thus, while company sustainability does seem to have some influence even at higher costs and higher product prices, the positive effects are varied, not consistent, and unpredictable; as such, H3 is largely supported.
H4 states that a company can implement sustainability activities that result in some (a) increased company costs, (b) increased customer costs, or (c) increased product prices and still have a positive effect on the company’s product-market performance. The results for H4 are in Table 5 and include analyses for South America, USA, and the overall sample for the moderating influences of company costs, customer costs, and product prices. As a decision rule, we analyzed all possible sensitivity scenarios in the equations used to test the 9 equations in Table 5 to arrive at the lowest point where company sustainability was still significant at the p<.05 level. The benchmarks were the average company cost, customer cost, and product price. As Table 5 shows (in the last row), companies are willing to take on an additional 65 to 69 percent in costs for their products and still reap positive benefits of their sustainability efforts on product-market performance. Customers have flexibility to take on from 54 to 70 percent extra costs, allowing companies to alleviate some of their cost concerns and maintaining a positive effect of sustainability on performance. Customers are more reluctant to see the extra cost burden realized in increased product prices, agreeing to take on 27 to 70 percent additional price increases (with US customers only willing to see a 27 percent increase). Consequently, H4 is supported.
H5 states that a company can implement sustainability activities at 10 percent above that of the sustainability infrastructure provided by the company’s home country and have a positive effect on the company’s product-market performance. The results for H5 are in Table 8 and include analyses for the 10 countries, South America, and the overall sample. As a decision rule, initially the full set of statistics to address H5 are for company sustainability set at 110 percent of country sustainability. These 110-percent-analyses for the 12 regression models produced mixed results. Seven of the 12 equations had company sustainability showing an effect on product-market performance (p<.05) but two of those equations had insignificant F-values. As such, similar to the sensitivity analyses in H4, we empirically determined the maximum company sustainability levels that could be achieved in each country above that of the country’s sustainability infrastructure and still have a positive effect on companies’ product-market performance. The results in the last row of Table 8 indicate that in eight of the countries (Argentina, Bolivia, Chile, Paraguay, Peru, Uruguay, Venezuela, and the USA), a company can invest in a greater level of sustainability than the country (ranging from 5 to 30 percent above the country/region) in which it resides and reap positive benefits on product-market performance. In two countries (Colombia and Ecuador), the country’s sustainability infrastructure sets the tone for what can be achieved. Thus, H5 is supported.
Discussion and Implications
Sustainability has become embedded in many companies’ marketing strategies as a weapon to outduel competitors, “do good” in the community, and create a “warm glow” among customers (e.g., Habel, Schons, Alavi, and Wieseke 2016). In effect, implementing sustainability initiatives has become a way to organize for marketing excellence (cf, Moorman and Day 2016) and create customer value (cf. Kumar and Reinartz 2016). Sustainability has also received a lot of attention from countries’ policymakers, first with the establishment of the United Nations Millennium Goals in 2000 and more recently in 2015 with the ratification by United Nations’ 193-member countries of the Sustainable Development Goals (e.g., Griggs et al. 2013; Nilsson, Griggs, and Visbeck 2016; United Nations 2015). This country-company sustainability dynamic feeds into a company’s marketing strategy. From a marketing strategy perspective, the more a company can nurture the “doing good” mindset of its stakeholders (Hillebrand, Driessen, and Koll 2015; Laczniak and Murphy 2012) and create a “warm glow” among its customers (Giebelhausen, Chun, Cronin, and Hult 2016), the more the burden will be lessened on costs and product prices (e.g., Andrews, Lou, Fang, and Aspara 2014).
However, institutional theory suggests that country-company alignment regarding levels of achieved sustainability is a likely consequence and could serve as a constraint to what a company can achieve (cf. Husted, Montiel, and Christmann 2016). Theoretically, in this scenario, institutional theory holds that to attain legitimacy, a company tends to be isomorphic to its environment and, as a result, over time companies within the same country will resemble each other in sustainability efforts (e.g., Hillman and Wan 2005). Conversely, resource-based theory argues that companies can uniquely configure their resources to take strategic advantage of sustainability initiatives beyond that of which the country has achieved (e.g., Kozlenkova, Samaha, and Palmatier 2014). In our study, the theoretical tension between institutional theory (Dacin 1997; DiMaggio and Powell 1983) and resource-based theory (Barney 1991; Wernerfelt 1984) manifests itself as a range from -30.0% to +24.0% of company sustainability levels (excluding regional and overall scores). This is the range of company sustainability that is achievable across countries (with individual country levels reported in Table 8), above or below that of the countries’ levels of sustainability, and the companies still being able to achieve positive effects on product-market performance. For example, companies in Ecuador (-30.0%) rely heavily on the country’s sustainability infrastructure while companies in Argentina (24.0%) have an opportunity to elevate their sustainability efforts significantly above that of their country and reap advantages on product-market performance.
Ultimately, as we indicated previously, “a key concern regarding sustainability initiatives…is how they affect operational performance” (Giebelhausen et al. 2016, p. 56) in the marketing-performance outcome chain (Katsikeas, Morgan, Leonidou, and Hult 2016). In our study, we found that positive effects on product-market performance can be achieved (1) from companies’ sustainability efforts in all 10 countries studied (Argentina, Bolivia, Chile, Colombia, Ecuador, Paraguay, Peru, Uruguay, Venezuela, and the United States), (2) even if the costs and/or prices increase by 27 to 72 percent, and (3) by companies implementing sustainability efforts that are 5 to 30 percent above sustainability efforts of the company’s home country or region (with the exception of Colombia and Ecuador, where the sustainability infrastructure in the country has to lead the effort). Additionally, increased sustainability effects can be gained from lowering customer costs and/or lowering company costs but no such effects were found when lowering product prices. These results support several implications for (1) country-company sustainability and (2) customer costs, company costs, and product prices.
Country-Company Sustainability
This study’s results were predicated on
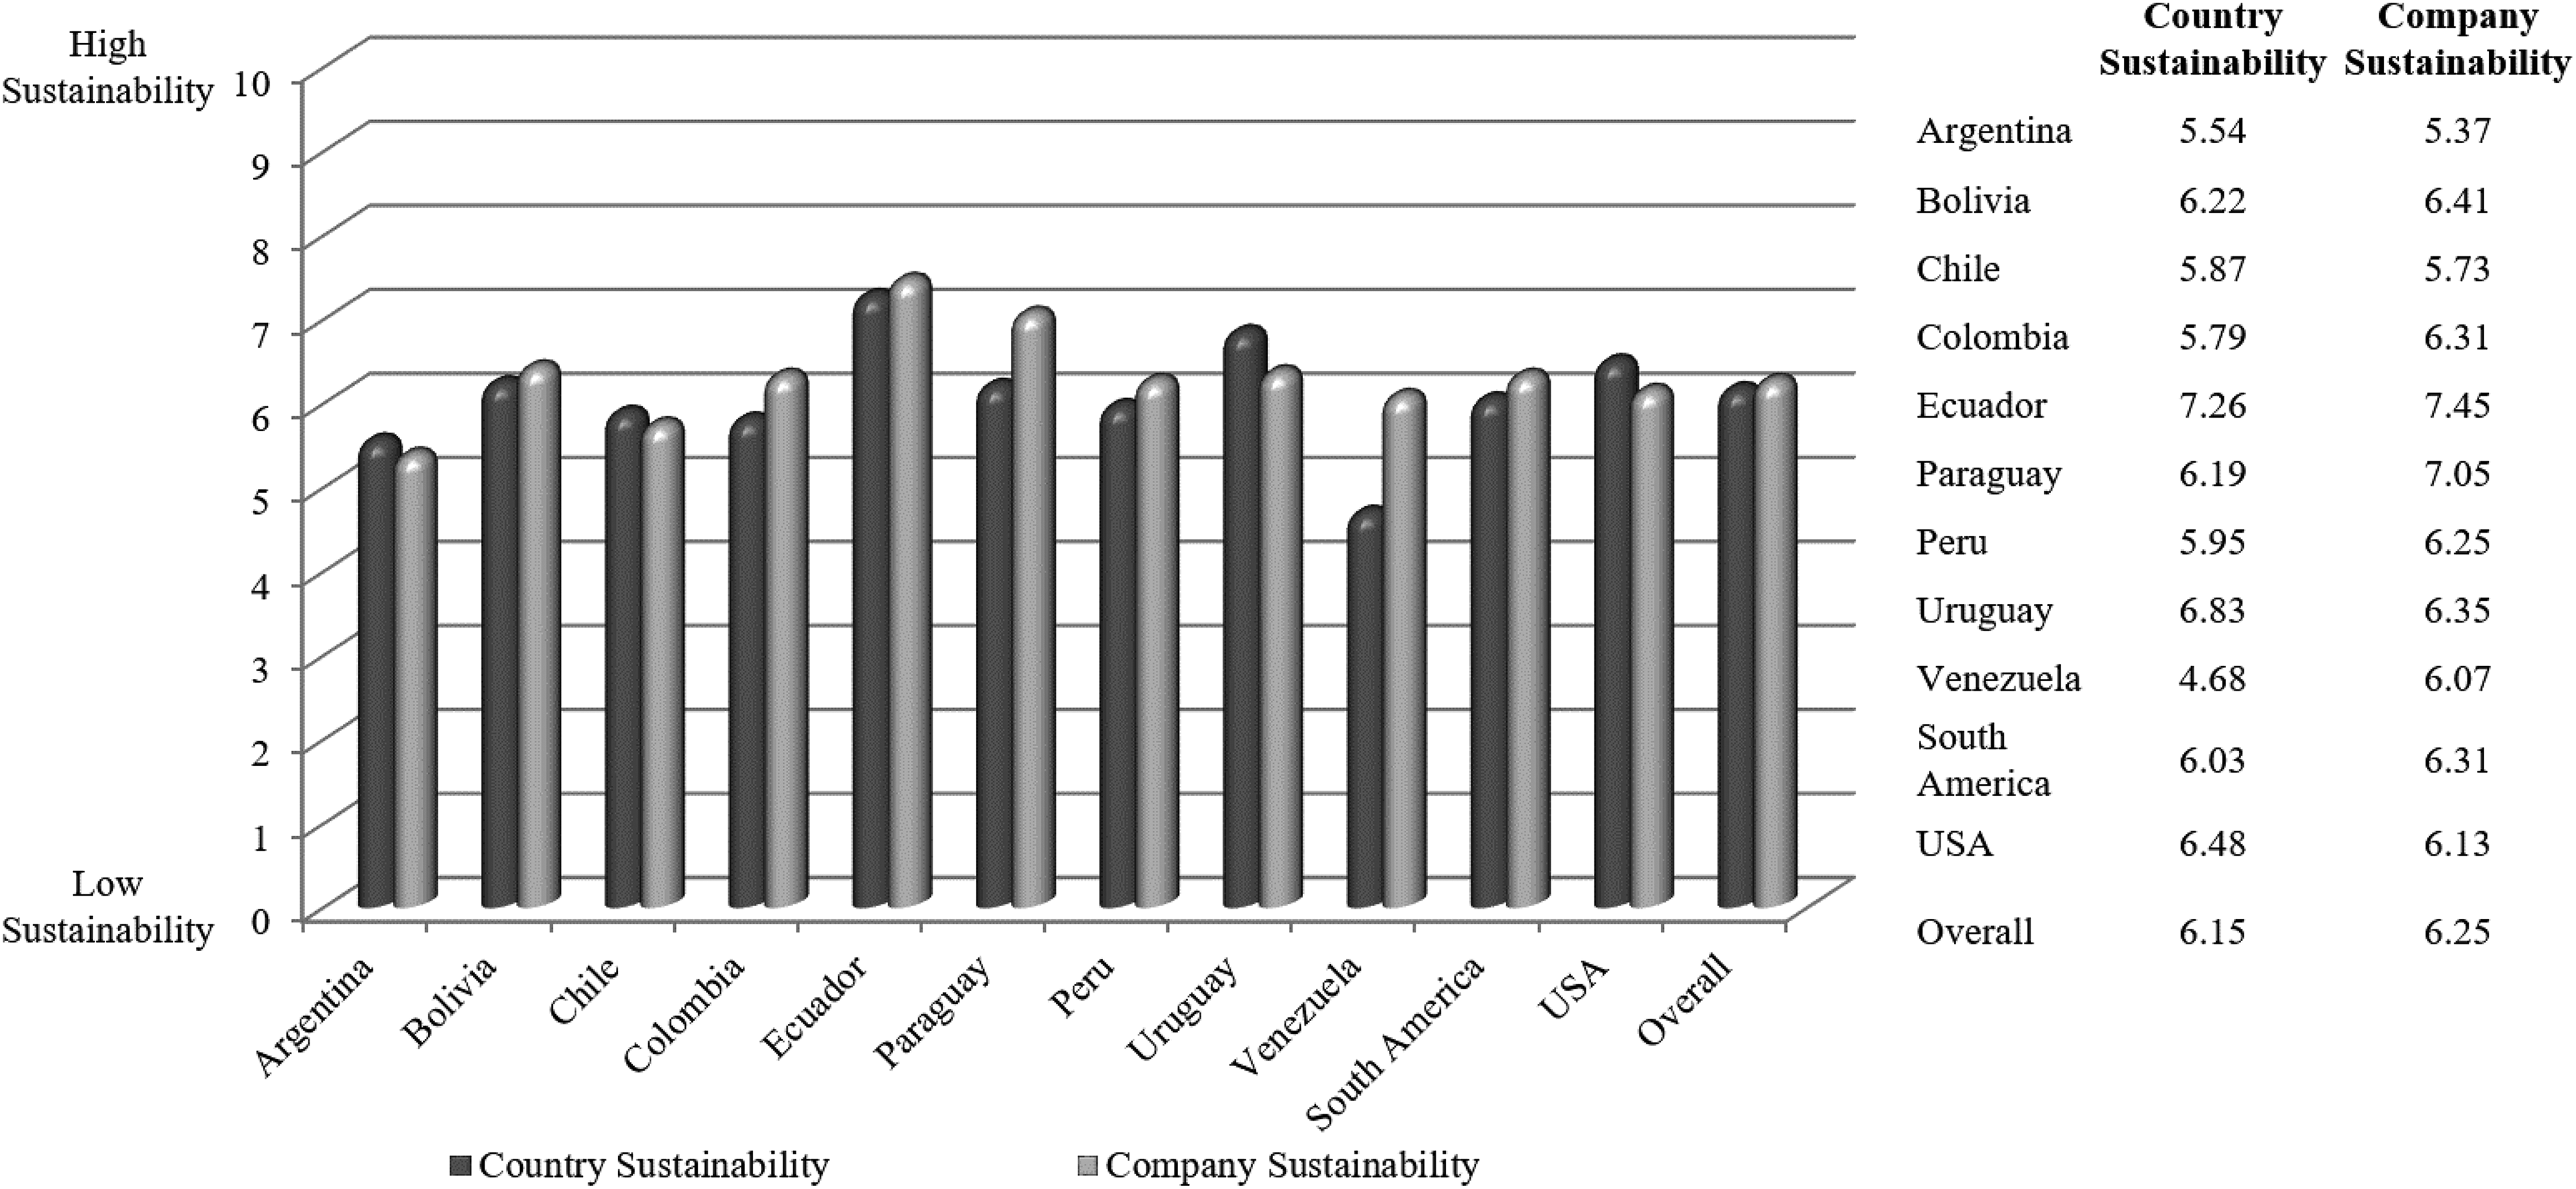
Sustainability Levels of Countries and Companies.
The bar charts in Figure 2 also indicate that in four of the countries (Argentina, Chile, Uruguay, and the USA), the countries themselves have achieved higher levels of sustainability infrastructure than the efforts demonstrated by the countries’ companies. This presents a great marketing opportunity for companies since in each of those four countries, a company can gain marketplace advantages by implementing sustainability efforts above that of the country (see Table 8). For example, in Argentina, where companies can gain positive product-market performance by implementing sustainability initiatives at 124 percent of the country’s efforts, companies right now underperform the country efforts by 3.17 percent (Δ 27.17%). Similarly, companies in Chile (Δ 15.44%), Uruguay (Δ 12.56%), and the USA (Δ 17.51%) can gain positive effects on product-market performance by increasing their sustainability efforts.
Companies in Colombia and Ecuador should, at this time, rely on their countries’ sustainability infrastructure (see Table 8). Interestingly, Colombian and Ecuadorian companies in actuality implement initiatives that are above their respective countries. This means that companies in Colombia (Δ -22.24%) and companies in Ecuador (Δ -32.55%) are spending resources on sustainability initiatives that do not directly have as much effect on product-market performance, a noble albeit performance-detrimental action. That said, despite costs, these Colombian and Ecuadorian companies are admirably building a movement toward sustainability in their countries to reach both higher country and company levels of sustainability over time. The remaining four countries have mixed results on country-company alignment (Bolivia, 2.96%; Paraguay, 12.20%; Peru, 4.80%; and Venezuela, 22.90%). Companies in Bolivia (<14.0%) and Peru (<10%) are well within the sustainability efforts supported by the sensitivity analyses (Table 8), while companies in Paraguay (>9.0%) and Venezuela (>8.0%) are not.
Customer Costs, Company Costs, and Price Sensitivities
The analyses involving customer costs, company costs, and product prices were foundationally rooted in institutional theory (DiMaggio and Powell 1983) and resource-based theory (Barney 1991; Wernerfelt 1984) like the country-company analyses. These cost/price factors have been associated with “warm glow” (customer costs), “doing good” (company costs), and price fairness (product prices) in the literature. With respect to the costs/prices, institutional theory guides what cost and price levels are appropriate in a country while resource-based theory guides companies on how to use resources effectively to develop the value proposition for customers. However, the substantive literatures of “warm glow” (Giebelhausen, Chun, Cronin, and Hult 2016), “doing good” (Lou and Bhattacharya 2009), “price fairness” (Habel, Schons, Alavi, and Wieseke 2016), and “customer value” (e.g., Woodruff 1997; Zeithaml 1988) drive much of the theorizing and the implications that can be drawn for customer costs, company costs, and product prices, respectively.
Table 4 through Table 7 have numerous results relating to containing and increasing individual and multiple costs/prices. As expected, when costs and prices are contained (i.e., neither the company nor the customer has increased costs associated with purchasing a product and the prices of that product are market-competitive), company sustainability has a positive and significant effect on product-market performance (see Table 4 and Table 6). The implication is rather straightforward, company stakeholders (Hillebrand, Driessen, and Koll 2015) like to buy products from companies practicing and incorporating sustainability initiatives in their operations if the costs and prices are market competitive. Containing company costs and/or containing customer costs, when the sensitivity analyses were involved, resulted in product-market performance improvements vis-à-vis the benchmark model in H1. Logically, cost effectiveness is preferred by companies and customers. However, the effects of all of the models involving containing product prices (as a form of price competitiveness or “price fairness”) were reduced. This indicates that companies prefer a “doing good” frame-of-reference and customers prefer a “warm glow” feeling over price competitiveness. In the opposite, when costs and prices are perceived to be increased significantly, the effects of company sustainability on product-market performance are inconsistent and in the vast majority of scenarios not significant in Table 5 and Table 7 (insignificant beta coefficients, ΔR2, and/or equations). Too high of a cost and too high of a price result in less interest and an inconsistent sustainability-performance relationship. Again, this is not controversial, per se, although some heavily oriented “warm glow” customers may prefer that sustainability products were always preferred by everyone (cf. Fenton 2014).
Finally, where marketing strategy-making is important relative to our study’s scope is in the large “band” of options between the two extremes of containing costs/prices (company costs ≥ 6; customer costs ≥ 6; and price competitiveness ≥ 6) and drastically increasing these costs/prices (company costs < 2; customer costs < 2; and price competitiveness < 2). This middle-band-range is basically represented by the results that are in between what is reported in Table 4 and Table 5 on one hand and Table 6 and Table 7 on the other (with the exception of the last row of Table 5). The basic notion of cost flexibilities and price sensitivities build on “warm glow” feelings (customers), “doing good” (companies), and “price fairness” (customers’ perception of product prices). For example, as a comparison, fifty-five percent of customers across 60 countries were found in a study by The Nielsen Company to be willing to pay more for products from companies that are committed to sustainability initiatives (Fenton 2014). In our case, we found that customer and company costs as well as product prices can increase by 27 to 72 percent without being detrimental to a company’s product-market performance. Of the cost/price alternatives in Table 5, product prices are the most inflexible in the U.S., where only a 27 percent price premium can be added without loss of the effects of sustainability initiatives on a company’s product-market performance. The company costs in South America has the greatest flexibility, with a 69 percent above-normal cost possible to be added without significant detrimental effects on a company’s product-market performance.
Footnotes
Appendix
| United Nations Sustainable Development Goals |
|---|
|
Note: Within the United Nation’s structure for the Sustainable Development Goals (SDGs), Goals 1 and 5 represent Dignity; Goals 2, 3, and 4 represent People; Goals 6, 12, 13, 14, and 15 represent Planet; Goal 17 represent Partnership; Goal 16 represent Justice; and Goals 7, 8, 9, 10, and 11 represent Prosperity. English (for the U.S. survey) and Spanish (for the nine Spanish-speaking South American countries) were used. Rate the following issues based on the importance that your country (company) is placing on each of the Sustainable Development Goals set forth by the United Nations in September 2015 (strongly disagree = 0 to strongly agree = 10). Califique los siguientes aspectos con base en la importancia que su país (empresa) le está dando a cada uno de los objetivos de desarrollo sostenible establecidos por las Naciones Unidas en Septiembre del 2015 (totalmente en desacuerdo = 0 a totalmente de acuerdo = 10). |
|
Goal 1 (No poverty) End poverty in all its forms everywhere.
Poner fin a la pobreza en todas sus formas y en todo el mundo.
|
|
Goal 2 (Zero hunger) End hunger, achieve food security and improved nutrition and promote sustainable agriculture.
Poner fin al hambre, lograr la seguridad alimentaria y la mejora de la nutrición y promover la agricultura sostenible.
|
|
Goal 3 (Good health and well-being) Ensure healthy lives and promote well-being for all at all ages.
Garantizar una vida sana y promover el bienestar de todos a todas las edades.
|
|
Goal 4 (Quality education) Ensure inclusive and equitable quality education and promote lifelong learning opportunities for all.
Garantizar una educación inclusiva y equitativa de calidad y promover oportunidades de aprendizaje permanente para todos.
|
|
Goal 5 (Gender equality) Achieve gender equality and empower all women and girls.
Lograr la igualdad de género y empoderar a todas las mujeres y las niñas.
|
|
Goal 6 (Clean water and sanitation) Ensure availability and sustainable management of water and sanitation for all.
Garantizar la disponibilidad y la gestión sostenible del agua y el saneamiento para todos.
|
|
Goal 7 (Affordable and clean energy) Ensure access to affordable, reliable, sustainable and modern energy for all. Garantizar el acceso a una energía asequible, fiable, sostenible y moderna para todos. |
|
Goal 8 (Decent work and economic growth) Promote sustained, inclusive and sustainable economic growth, full and productive employment and decent work for all.
Promover el crecimiento económico sostenido, inclusivo y sostenible, el empleo pleno y productivo y el trabajo decente para todos.
|
|
Goal 9 (Industry, innovation, and infrastructure) Build resilient infrastructure, promote inclusive and sustainable industrialization and foster innovation.
Construir infraestructuras resilientes, promover la industrialización inclusiva y sostenible y fomentar la innovación.
|
|
Goal 10 (Reduced inequalities) Reduce inequality within and among countries.
Reducir la desigualdad en los países y entre ellos.
|
|
Goal 11 (Sustainable cities and communities) Make cities and human settlements inclusive, safe, resilient and sustainable.
Lograr que las ciudades y los asentamientos humanos sean inclusivos, seguros, resilientes y sostenibles.
|
|
Goal 12 (Responsible consumption and production Ensure sustainable consumption and production patterns.
Garantizar modalidades de consumo y producción sostenibles.
|
|
Goal 13 (Climate action) Take urgent action to combat climate change and its impacts.
Adoptar medidas urgentes para combatir el cambio climático y sus efectos.
|
|
Goal 14 (Life below water) Conserve and sustainably use the oceans, seas and marine resources for sustainable development.
Conservar y utilizar sosteniblemente los océanos, los mares y los recursos marinos para el desarrollo sostenible.
|
|
Goal 15 (Life on land) Protect, restore and promote sustainable use of terrestrial ecosystems, sustainably manage forests, combat desertification, and halt and reverse land degradation and halt biodiversity loss.
Proteger, restablecer y promover el uso sostenible de los ecosistemas terrestres, gestionar sosteniblemente los bosques, luchar contra la desertificación, detener e invertir la degradación de las tierras y detener la pérdida de biodiversidad.
|
|
Goal 16 (Peace, justice and strong institutions) Promote peaceful and inclusive societies for sustainable development, provide access to justice for all and build effective, accountable and inclusive institutions at all levels.
Promover sociedades pacíficas e inclusivas para el desarrollo sostenible, facilitar el acceso a la justicia para todos y construir a todos los niveles instituciones eficaces e inclusivas que rindan cuentas.
|
|
Goal 17 (Partnerships for the goals) Strengthen the means of implementation and revitalize the Global Partnership for Sustainable Development.
Fortalecer los medios de implementación y revitalizar la Alianza Mundial (entre los gobiernos, el sector privado y la sociedad civil) para el Desarrollo Sostenible.
|
Declaration of Conflicting Interests
The author(s) declared no potential conflicts of interest with respect to the research, authorship, and/or publication of this article.
Funding
The author(s) received no financial support for the research, authorship, and/or publication of this article.