
Abstract
Background
Chronic progressive swelling of the lower extremity due to secondary lower extremity lymphedema (LEL) can affect a patient’s quality of life, both physically and psychologically. A feasible and reproducible method for detecting and staging LEL will facilitate decision-making about appropriate management strategies.
Purpose
To determine whether the thickness of the soft tissues of the lower extremities, measured with magnetic resonance imaging (MRI), could stage unilateral secondary LEL.
Material and Methods
Seventy-two women with unilateral LEL and 22 participants without LEL underwent lower extremity MRI after treatment of uterine malignancies. LEL was classified clinically as stage 0, 1, 2, or 3. On fat-suppressed T2-weighted mid-axial images of calves and thighs, the total thickness of the soft tissue (TT), muscle thickness (MT), subcutaneous tissue thickness (STT), and the differences in TT (DTT), MT (DMT), and STT (DSTT) values and corresponding measurements in the contralateral lower extremity, were obtained and analyzed statistically for staging LEL.
Results
There was a trend for the TT and STT of the affected calf and thigh to increase with increasing LEL stage. These parameters were strongly and moderately correlated with LEL stage, respectively (P < 0.001). Both the DTT and DSTT of the calves or thighs were strongly correlated with LEL stage (P < 0.001). Among the parameters, the DSTT of the calves could best stage LEL, with an area under the receiver operating curve of more than 0.89.
Conclusion
The DSTT of the calves could be recommended as an informative indicator for staging LEL.
Introduction
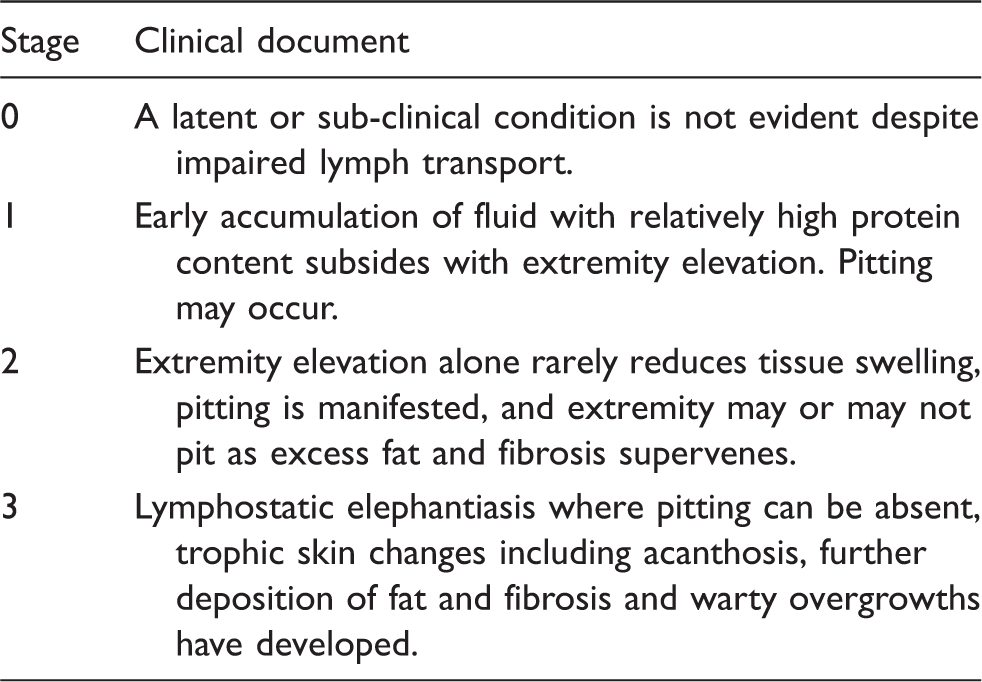
Secondary lower extremity lymphedema (LEL) occurs in 1–49% of survivors of uterine and other malignancies, and can present months to years after treatment (1–3). Chronic, progressive lower extremity swelling can cause discomfort, distortion, reduced mobility, and dysfunction, thereby affecting the patient’s quality of life, both physically and psychologically. LEL can be staged according to the International Society of Lymphology (ISL) 2009 (4). In the early stage, LEL can be relieved completely by limb elevation (5). With increasing LEL stage, the lymphedematous extremity may be controlled with timely and appropriate physical therapy. In the late stage, treatment of LEL is ineffective even if surgery is performed (6,7). Therefore, accurate staging of LEL is essential for satisfactory therapeutic outcomes (8).
Clinically, LEL staging commonly involves measuring changes in the circumference of the involved extremity (with tape) or changes in its volume (by water displacement) (4,9). As there are no accepted standards for defining LEL in terms of circumference or volume changes, previously reported incidences of lymphedema vary widely. Some patients with early-stage LEL are not identified using the recommended values of a 20% increase in volume, or 2 cm increase in circumference, of the affected limb compared with the unaffected limb (4,10,11). Moreover, these objective methods provide little information about the underlying tissue structural changes (2). Therefore, an informative method for timely diagnosis and staging of LEL is needed.
Thickened subcutaneous tissue and adipose tissue hypertrophy contribute to the development of chronic lymphedema, and can be delineated with computed tomography (CT), dual energy X-ray absorptiometry (DAX), magnetic resonance imaging (MRI), and ultrasonography (US) (12–15). CT and DAX have associated radiation hazards and are insensitive to the fluid component of tissues, while US has difficulties achieving deep tissue penetration; hence, these modalities are limited for the detection of lymphedema. Excellent soft tissue contrast with MRI allows identification of soft tissue changes in LEL, and can distinguish subcutaneous tissue from muscle (13,16,17). To date, no investigations have explored the use of MRI to assess or accurately stage secondary LEL through measurements of lower extremity soft tissue thickness. Therefore, the present study aimed to determine whether measurement of lower extremity soft tissue thickness with MRI could stage unilateral secondary LEL.
Material and Methods
Participants
This prospective study was approved by our institutional review board. Written informed consent was obtained from each participant prior to the study.
Clinical criteria for staging lymphedema in the consensus document of the International Society of Lymphology 2009.
Patient clinical characteristics.
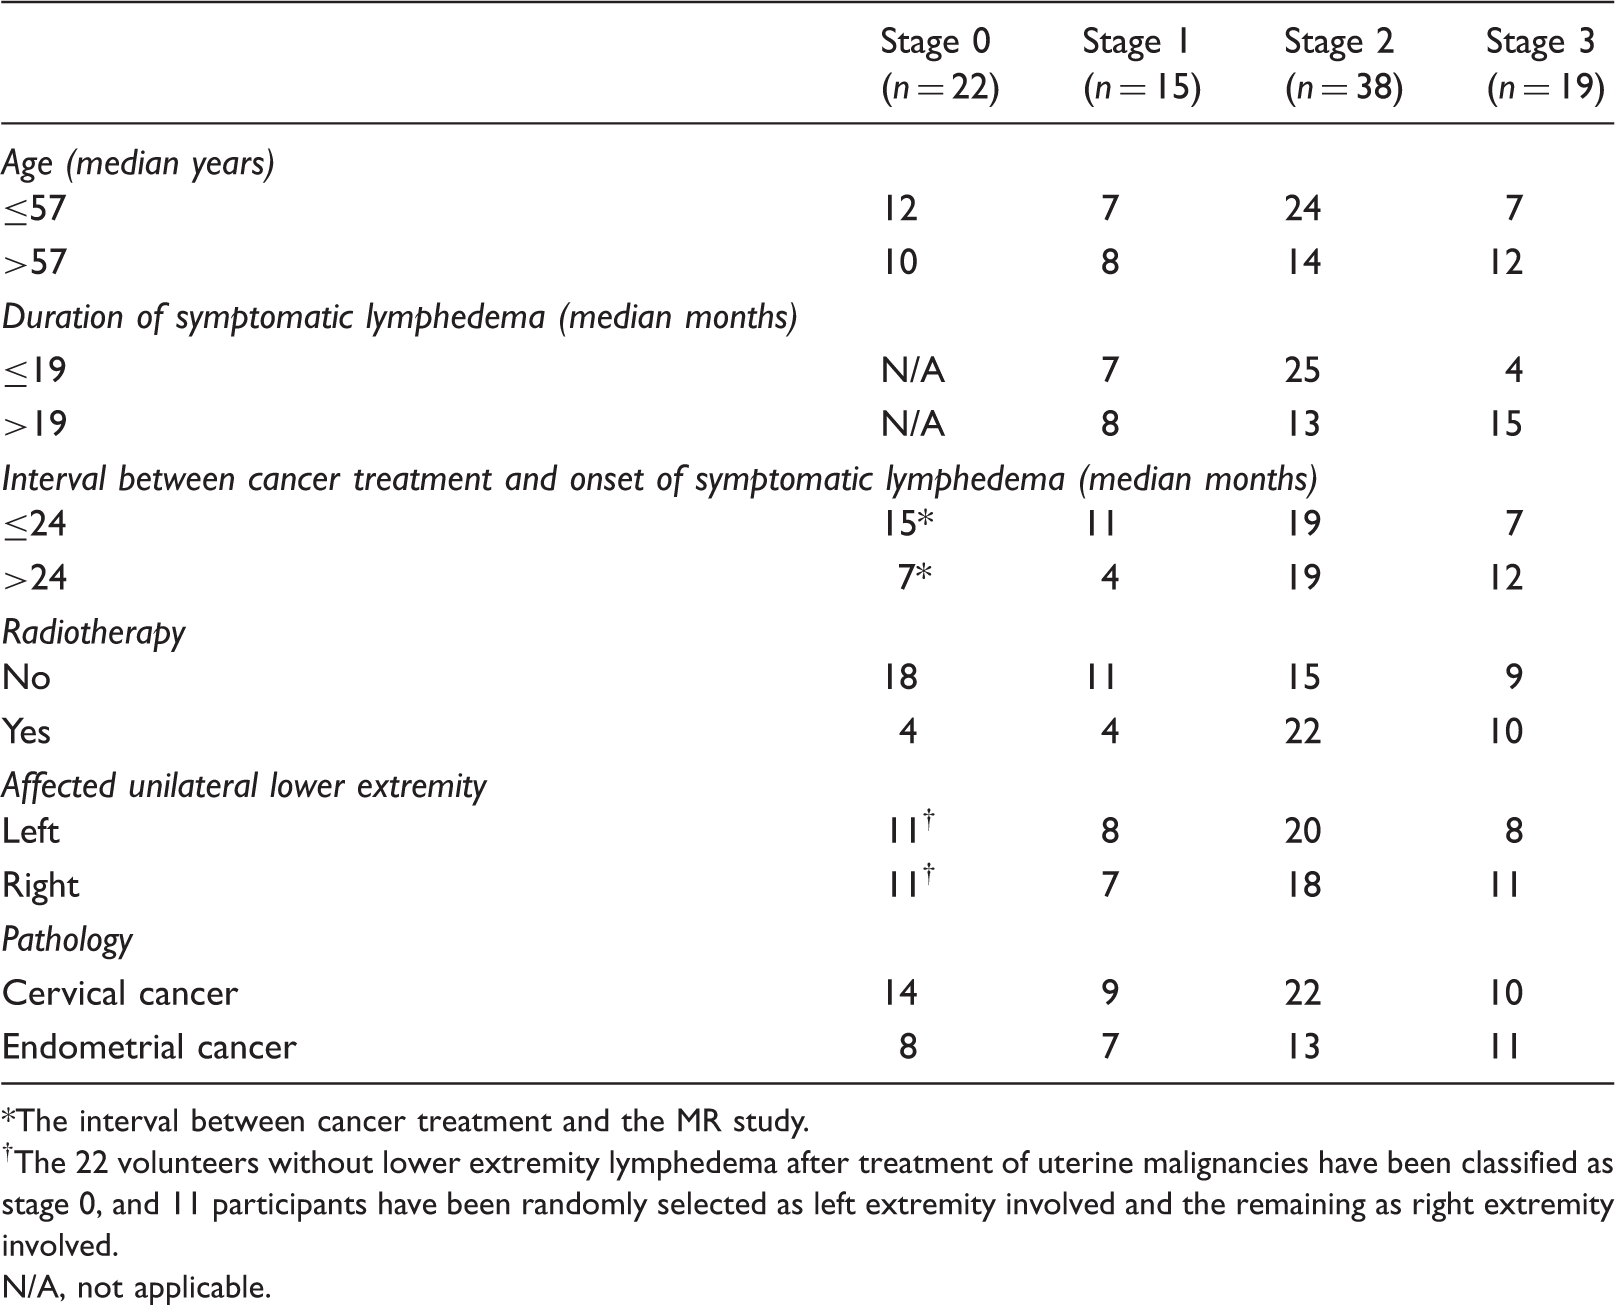
The interval between cancer treatment and the MR study.
The 22 volunteers without lower extremity lymphedema after treatment of uterine malignancies have been classified as stage 0, and 11 participants have been randomly selected as left extremity involved and the remaining as right extremity involved.
N/A, not applicable.
MRI
MRI was performed using a clinical 3.0 T MR scanner (Achieva, Phillips Medical Systems, Best, The Netherlands) equipped with an eight-channel torso array coil. The interval between the MRI study and clinical staging was in the range of 1–3 h (mean, 1.2 h; median, 1.5 h). Each participant was placed in the supine position, with feet first into the magnet. Scans were initiated at the patient’s feet and moved toward the inguinal region. After localizing images, we obtained coronal T2-weighted (T2W) (repetition time [TR], 3500 ms; echo time [TE], 120 ms; matrix, 320 × 304; section thickness, 5 mm; number of slices, 24–32; acquisition time, 142–196 s), axial fat-suppressed T2W (TR, 3500 ms; TE, 120 ms; matrix, 320 × 304; section thickness, 5 mm; number of slices, 32; acquisition time, 196 s), and axial T1-weighted (T1W) (TR, 650 ms; TE, 12 ms; matrix, 320 × 304; section thickness, 5 mm; number of slices, 32; acquisition time, 132 s) images of the bilateral lower extremities. The coronal images were obtained along the long-axes of the fibula and femur, and axial images perpendicular to these long-axes of the fibula and femur. A field of view of 400 × 400 mm2 was used to cover the thigh and the calf. The coronal T2W images were included to plan the subsequent acquisitions, and axial T1W images were included as conventional diagnostic images.
Image interpretation
Postprocessed images were reviewed by two independent readers (QL and JRX, with 13 and 25 years of experience in musculoskeletal MRI, respectively) blinded to the clinical data. The uniform window of a Philips MRI workstation (ViewForum, R4.1) was used to determine the total thickness of the soft tissue (TT), muscle thickness (MT), and subcutaneous tissue thickness (STT) of the calf and thigh, as measures of the soft tissue thickness changes in the affected lower extremity. Fat-suppressed T2W axial images, corresponding to the midpoint of the fibula and femur, were used to eliminate the impact of the high signal of fat tissue on the measurement of edematous soft tissue. The midpoint of the calf was defined as the midpoint of the fibula, from the lateral malleolus to the fibular head. The midpoint of the femur was defined as the midpoint between the lesser trochanter and medial epicondyle. In axial images of the calf and thigh, a horizontal line was drawn through the center of each of the fibula and femur (Fig. 1). The TT of the affected calf/thigh was defined as the distance, excluding the diameter of the fibula/femur, between the two intersection points of the line with the medial and lateral skin. The MT of the affected calf/thigh represented the distance, excluding the fibula/femur, between the intersection points of the line with the medial superficial fascia-muscle interface and the lateral superficial fascia-muscle interface. The superficial fascia-muscle interface was defined as the anatomic border between the muscle and subcutaneous tissue, evident on fat-suppressed T2W images as a slight linear structure of low signal intensity between the low signal of the muscle and high signal of the subcutaneous tissue. The tibia was excluded from the measurements of TT and MT of the calf. The STT of the calf/thigh was calculated as the corresponding TT minus the corresponding MT. To better demonstrate the changes in soft tissue thickness of the affected extremity, TT, MT, and STT were also obtained in the unaffected (contralateral) extremity, and the differences in TT, MT, and STT between the affected and normal extremities (expressed as DTT, DMT and DSTT, respectively) were obtained by subtraction.
These images illustrate how total thickness of soft tissue (TT), muscle thickness (MT), and subcutaneous tissue thickness (STT) of calves (a) and thighs (b) are acquired. On the fat-suppressed mid-axial T2W images of calves and thighs, a horizontal line is drawn through the center of fibulas (a, arrow heads) and the center of femurs (b, open arrow heads) to measure the thickness of soft tissue of calves and thighs, respectively. The lines respectively intersect with the medial (A) and lateral (B) skin, medial (C) and lateral (D) superficial fascia, medial (E) and lateral (F) bone cortex of affected left calf (a) and thigh (b). On the previous lines, distance between A and B minus distance between E and F represents the value of TT; distance between C and D minus distance between E and F represents the value of MT. STT obtained by TT subtracting MT. The TT, MT, and STT of unaffected right calf or thigh are acquired by the methods similar to those parameters of affected left calf or thigh.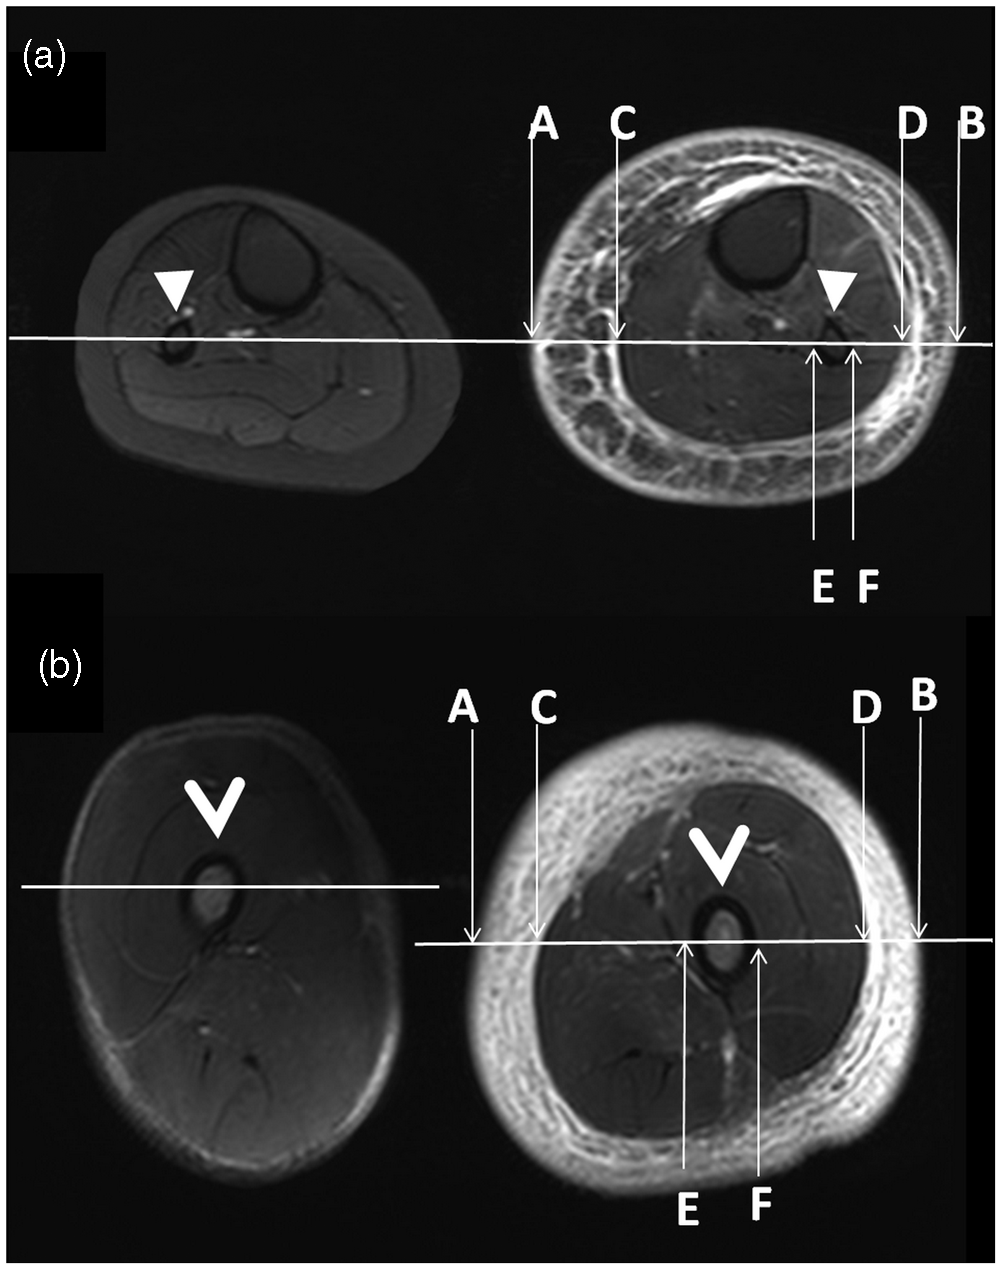
Statistical analysis
The reliability of the measurements of TT and MT in the calf or thigh, obtained by two independent readers, was assessed with the intra-class correlation coefficient (ICC), as follows: 0–0.20, no agreement; 0.21–0.40, poor agreement; 0.41–0.60, moderate agreement; 0.61–0.80, good agreement; and >0.80, excellent agreement.
Spearman’s rank correlation analysis was used to assess the correlation between the LEL stage and the TT, MT, and STT values of the affected calf or thigh, as well as DTT, DMT, and DSTT. These parameters were compared between patients stratified by LEL stage, using multivariate analysis with Bonferroni correction for multi-comparisons. If the multivariate analysis yielded a significant positive finding for a parameter, the parameter cutoff values for classifying LEL stages were determined with receiver-operating characteristic (ROC) analysis. All statistical analyses were carried out with SPSS version 16.0 (SPSS Inc., Chicago IL, USA). A P value <0.05 was considered indicative of a significant difference.
Results
Reliability of inter-observer measurements
Soft tissue thickness of affected versus contralateral lower extremity corresponding to stages of lower extremity lymphedema (mm).
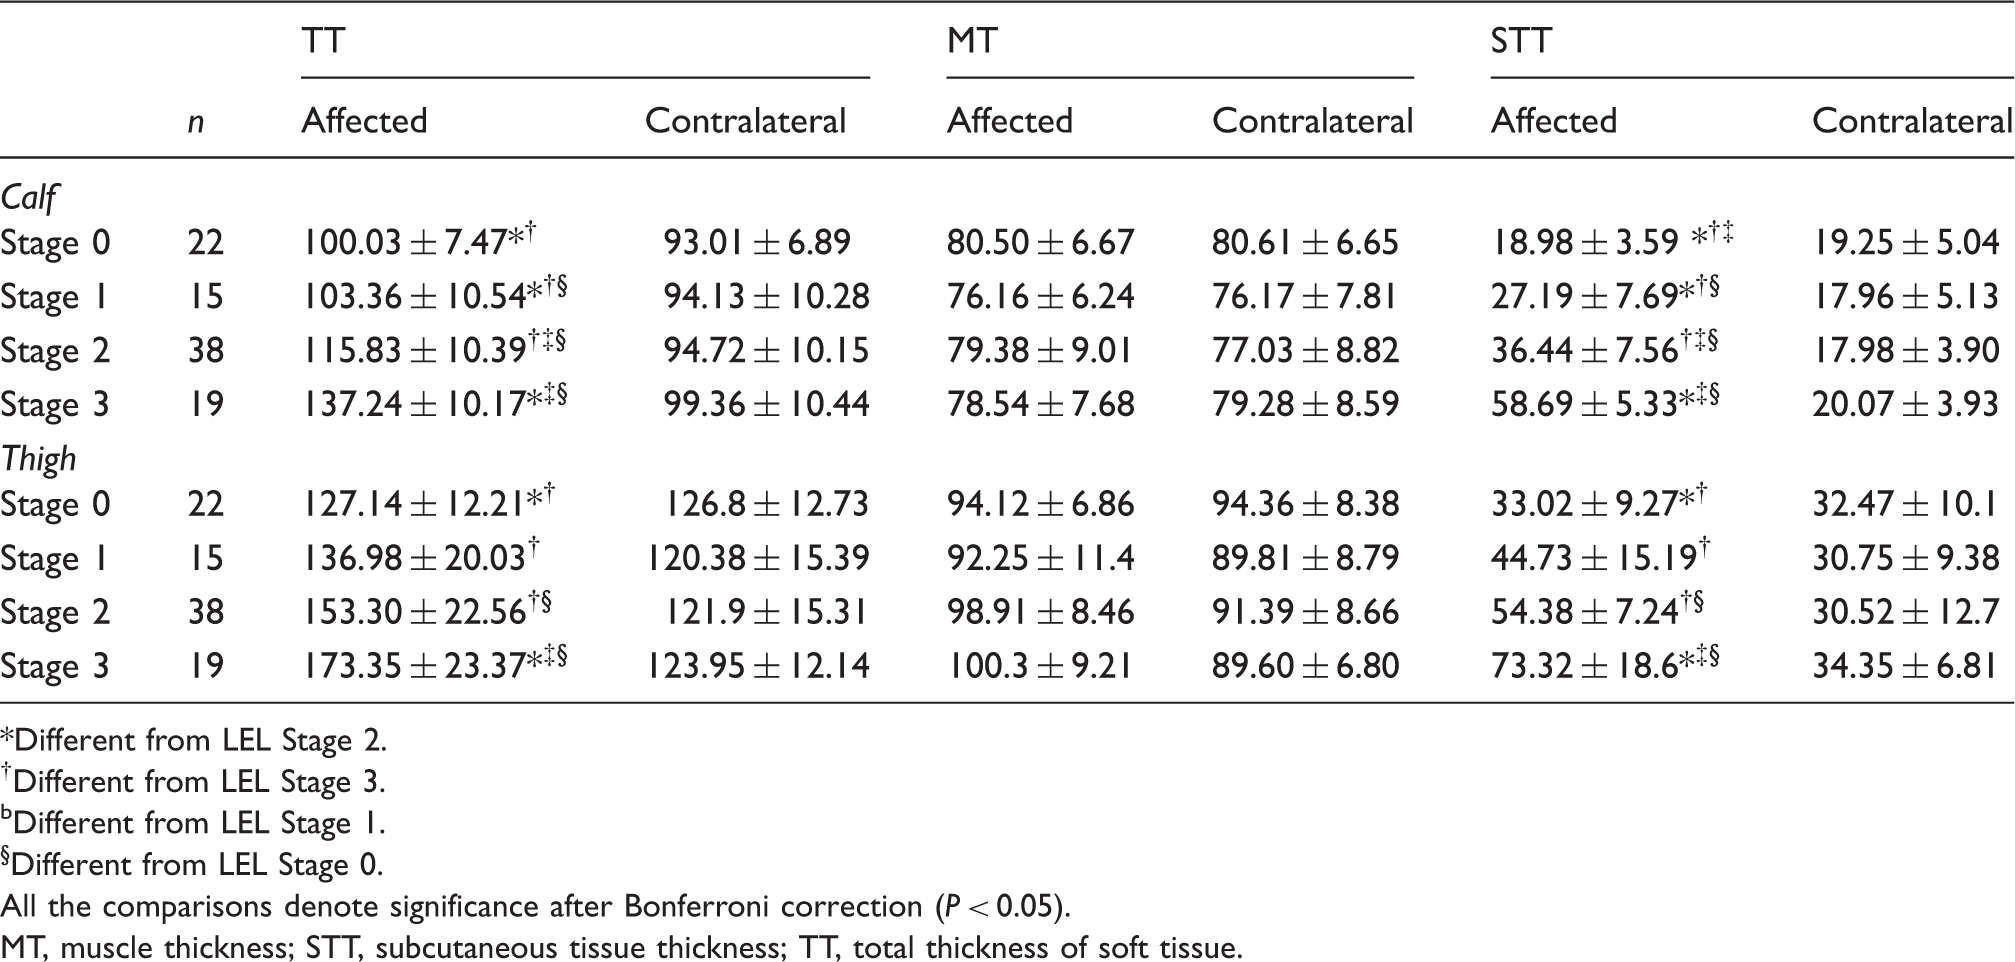
*Different from LEL Stage 2.
†Different from LEL Stage 3.
bDifferent from LEL Stage 1.
§Different from LEL Stage 0.
All the comparisons denote significance after Bonferroni correction (P < 0.05).
MT, muscle thickness; STT, subcutaneous tissue thickness; TT, total thickness of soft tissue.
The difference of soft tissue thickness between affected and contralateral lower extremity corresponding to stages of lower extremity lymphedema (mm).

*Different from LEL Stage 1.
†Different from LEL Stage 2.
‡Different from LEL Stage 3.
§Different from LEL Stage 0.
All the comparisons denote significance after Bonferroni correction (P < 0.05).
DMT, difference of muscle thickness; DSTT, difference of subcutaneous tissue thickness; DTT, difference of total thickness of soft tissue.
Correlation of the LEL stage of the affected extremity with soft tissue thickness
There was a trend for the TT and STT of the affected calf (Fig. 2a, b, Fig. 3a–d) and thigh (Fig. 2d, e) to increase with LEL stage; no such trend was observed for the MT (Fig. 2c, f). Spearman analysis showed moderate-to-strong correlation between LEL stage and increasing TT (0.755), STT (0.864), DTT (0.874), and DSTT (0.898) in the affected calf (all P < 0.001). Moderate-to-strong correlation was also found between LEL stage and increasing TT (0.642), STT (0.671), DTT (0.774), DSTT (0.725), and DMT (0.599) in the affected thigh (all P < 0.001). However, no correlation was found between LEL stage and MT values. Among all the soft tissue thickness parameters, increasing DSTT and DTT correlated best with increasing LEL stage.
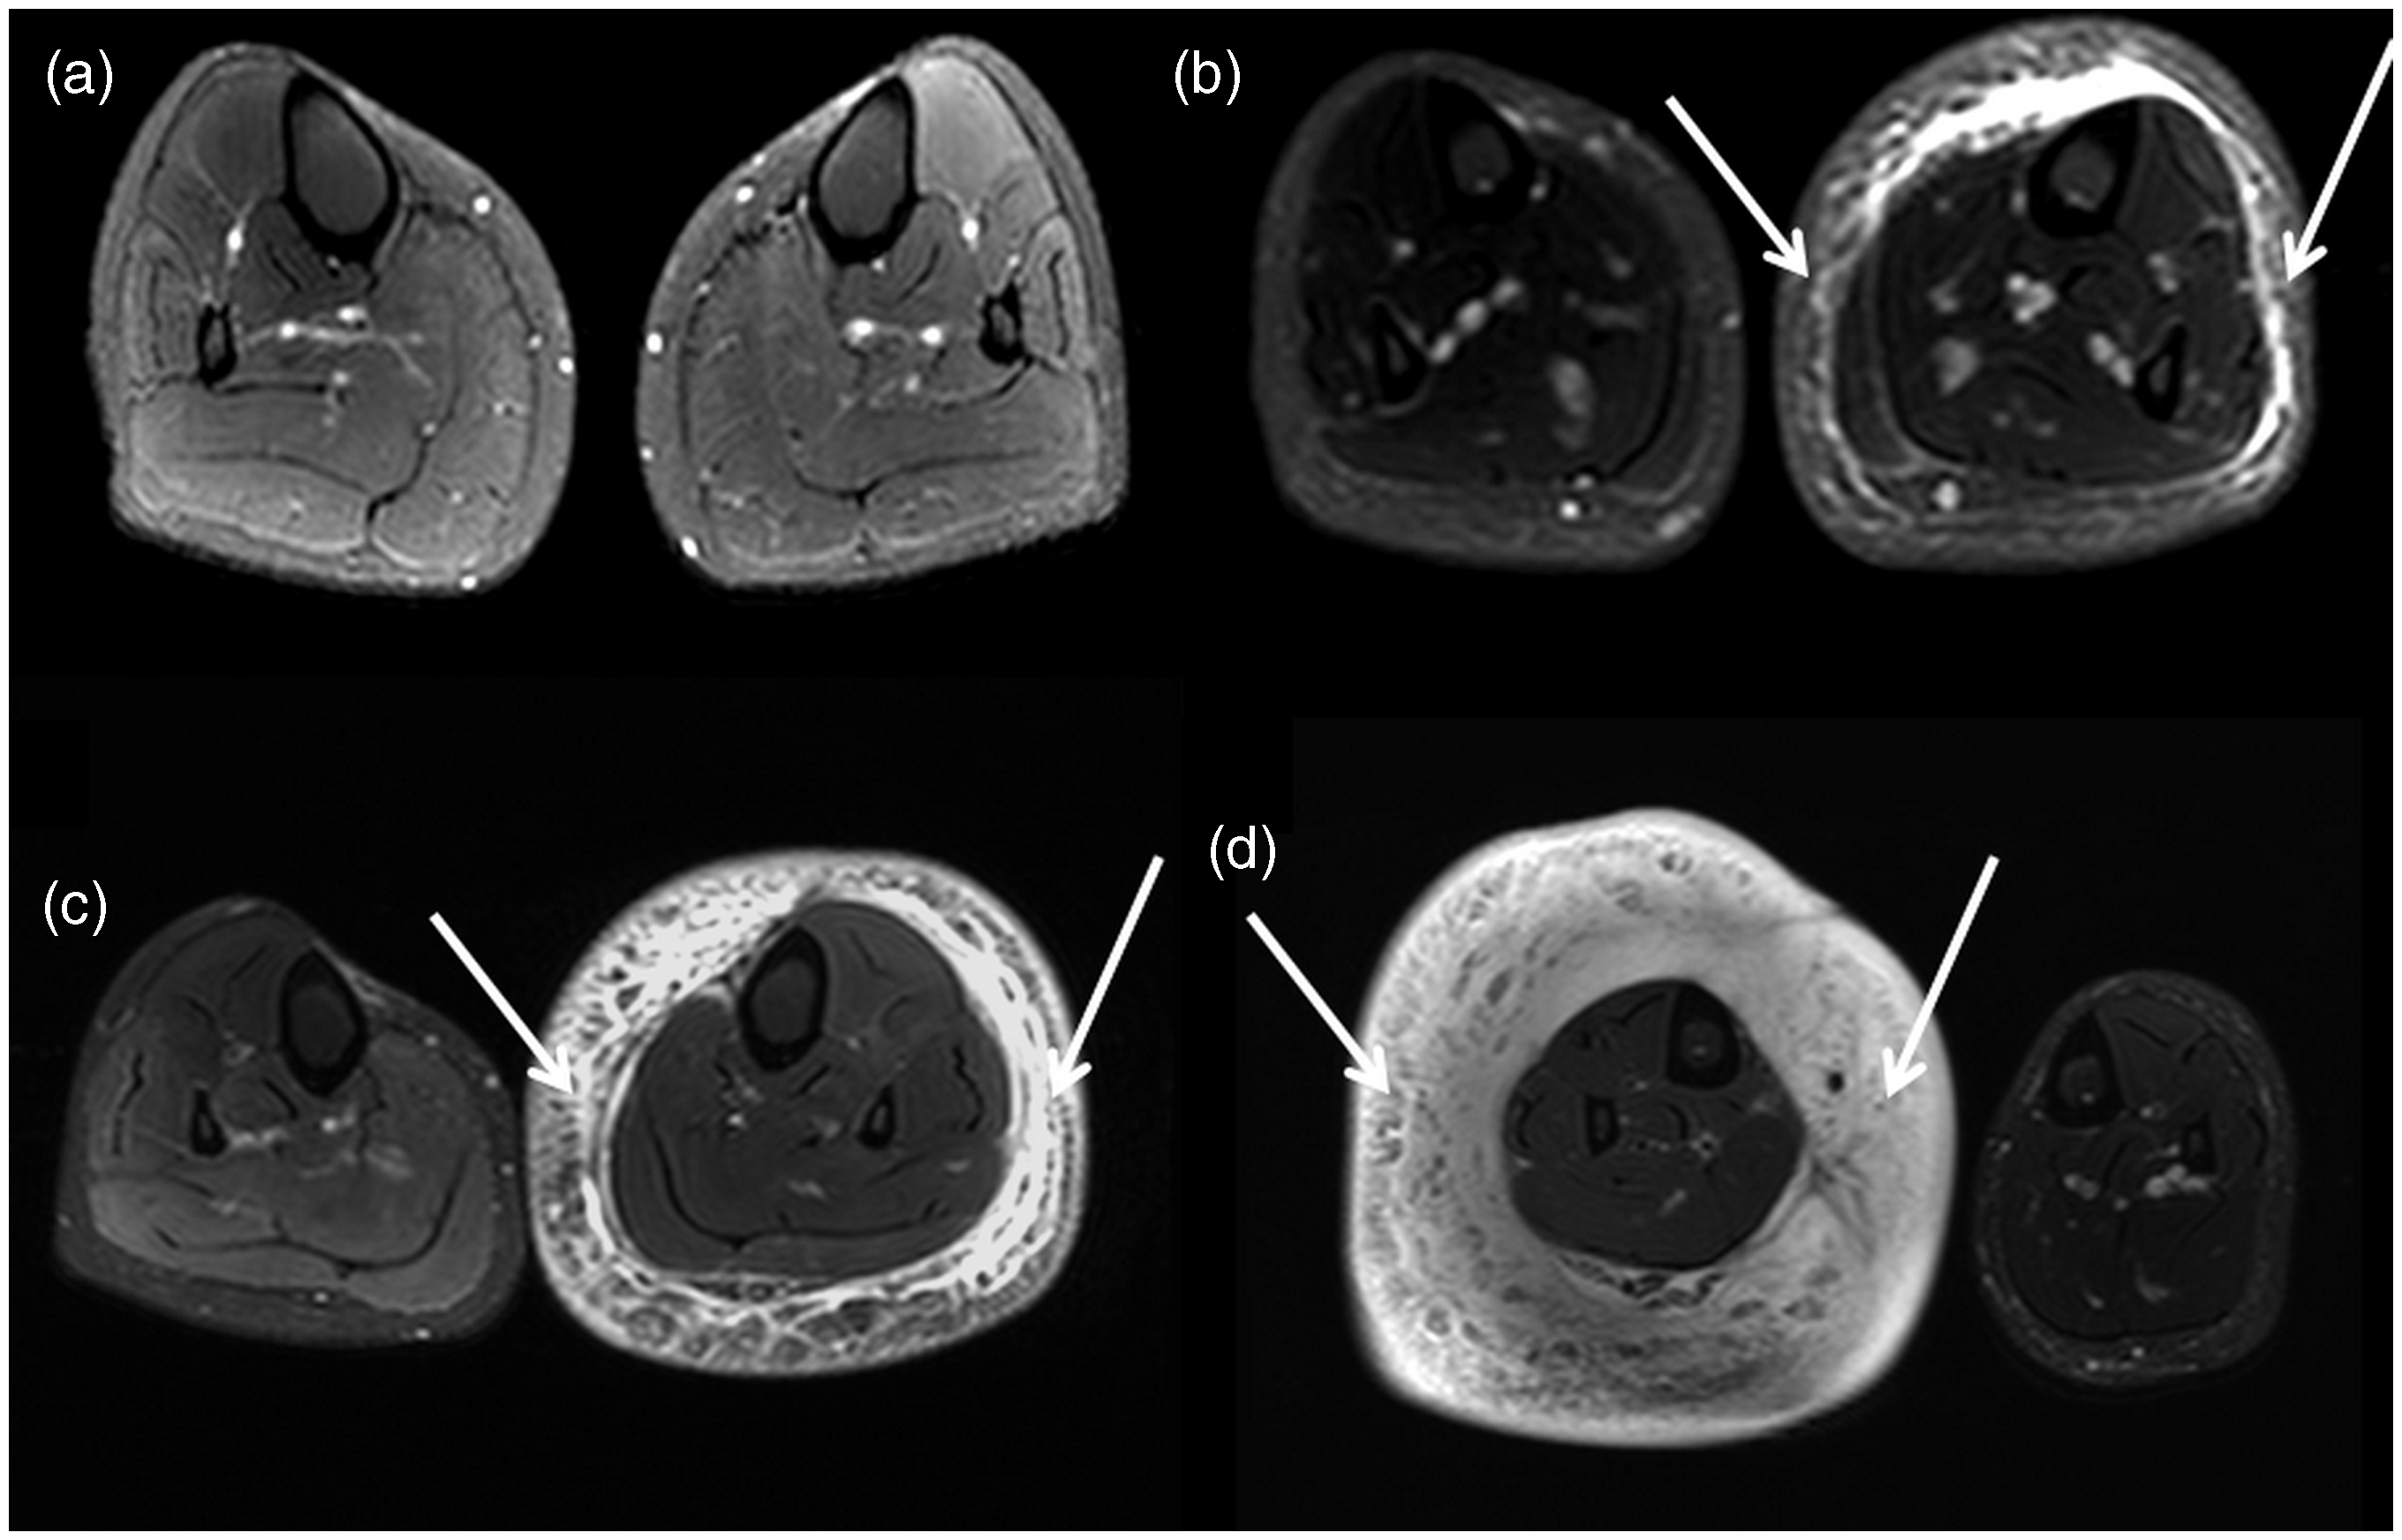
These histograms illustrate the correlation between soft tissue thickness of lower extremities and stages of lower extremity lymphedema (LEL). The histograms a, b, and c show the correlation between mean total thickness of soft tissue (TT), subcutaneous tissues thickness (STT), and muscle thickness (MT) of affected calf and contralateral unaffected calf with LEL stages, respectively. The histograms d, e, and f show the correlation between mean TT, STT, and MT of affected thigh and contralateral thigh with LEL stages, respectively. Fat-suppressed mid-axial T2W images of calves show the changes of subcutaneous tissues thickness with lower extremity lymphedema identified as stage 0 in bilateral calves (a) in a 55-year-old woman, stage 1 in the left calf (b, arrows) in a 48-year-old woman, stage 2 in the left calf (c, arrows) in a 57-year-old woman, and stage 3 in the right calf (d, arrows) in a 62-year-old woman.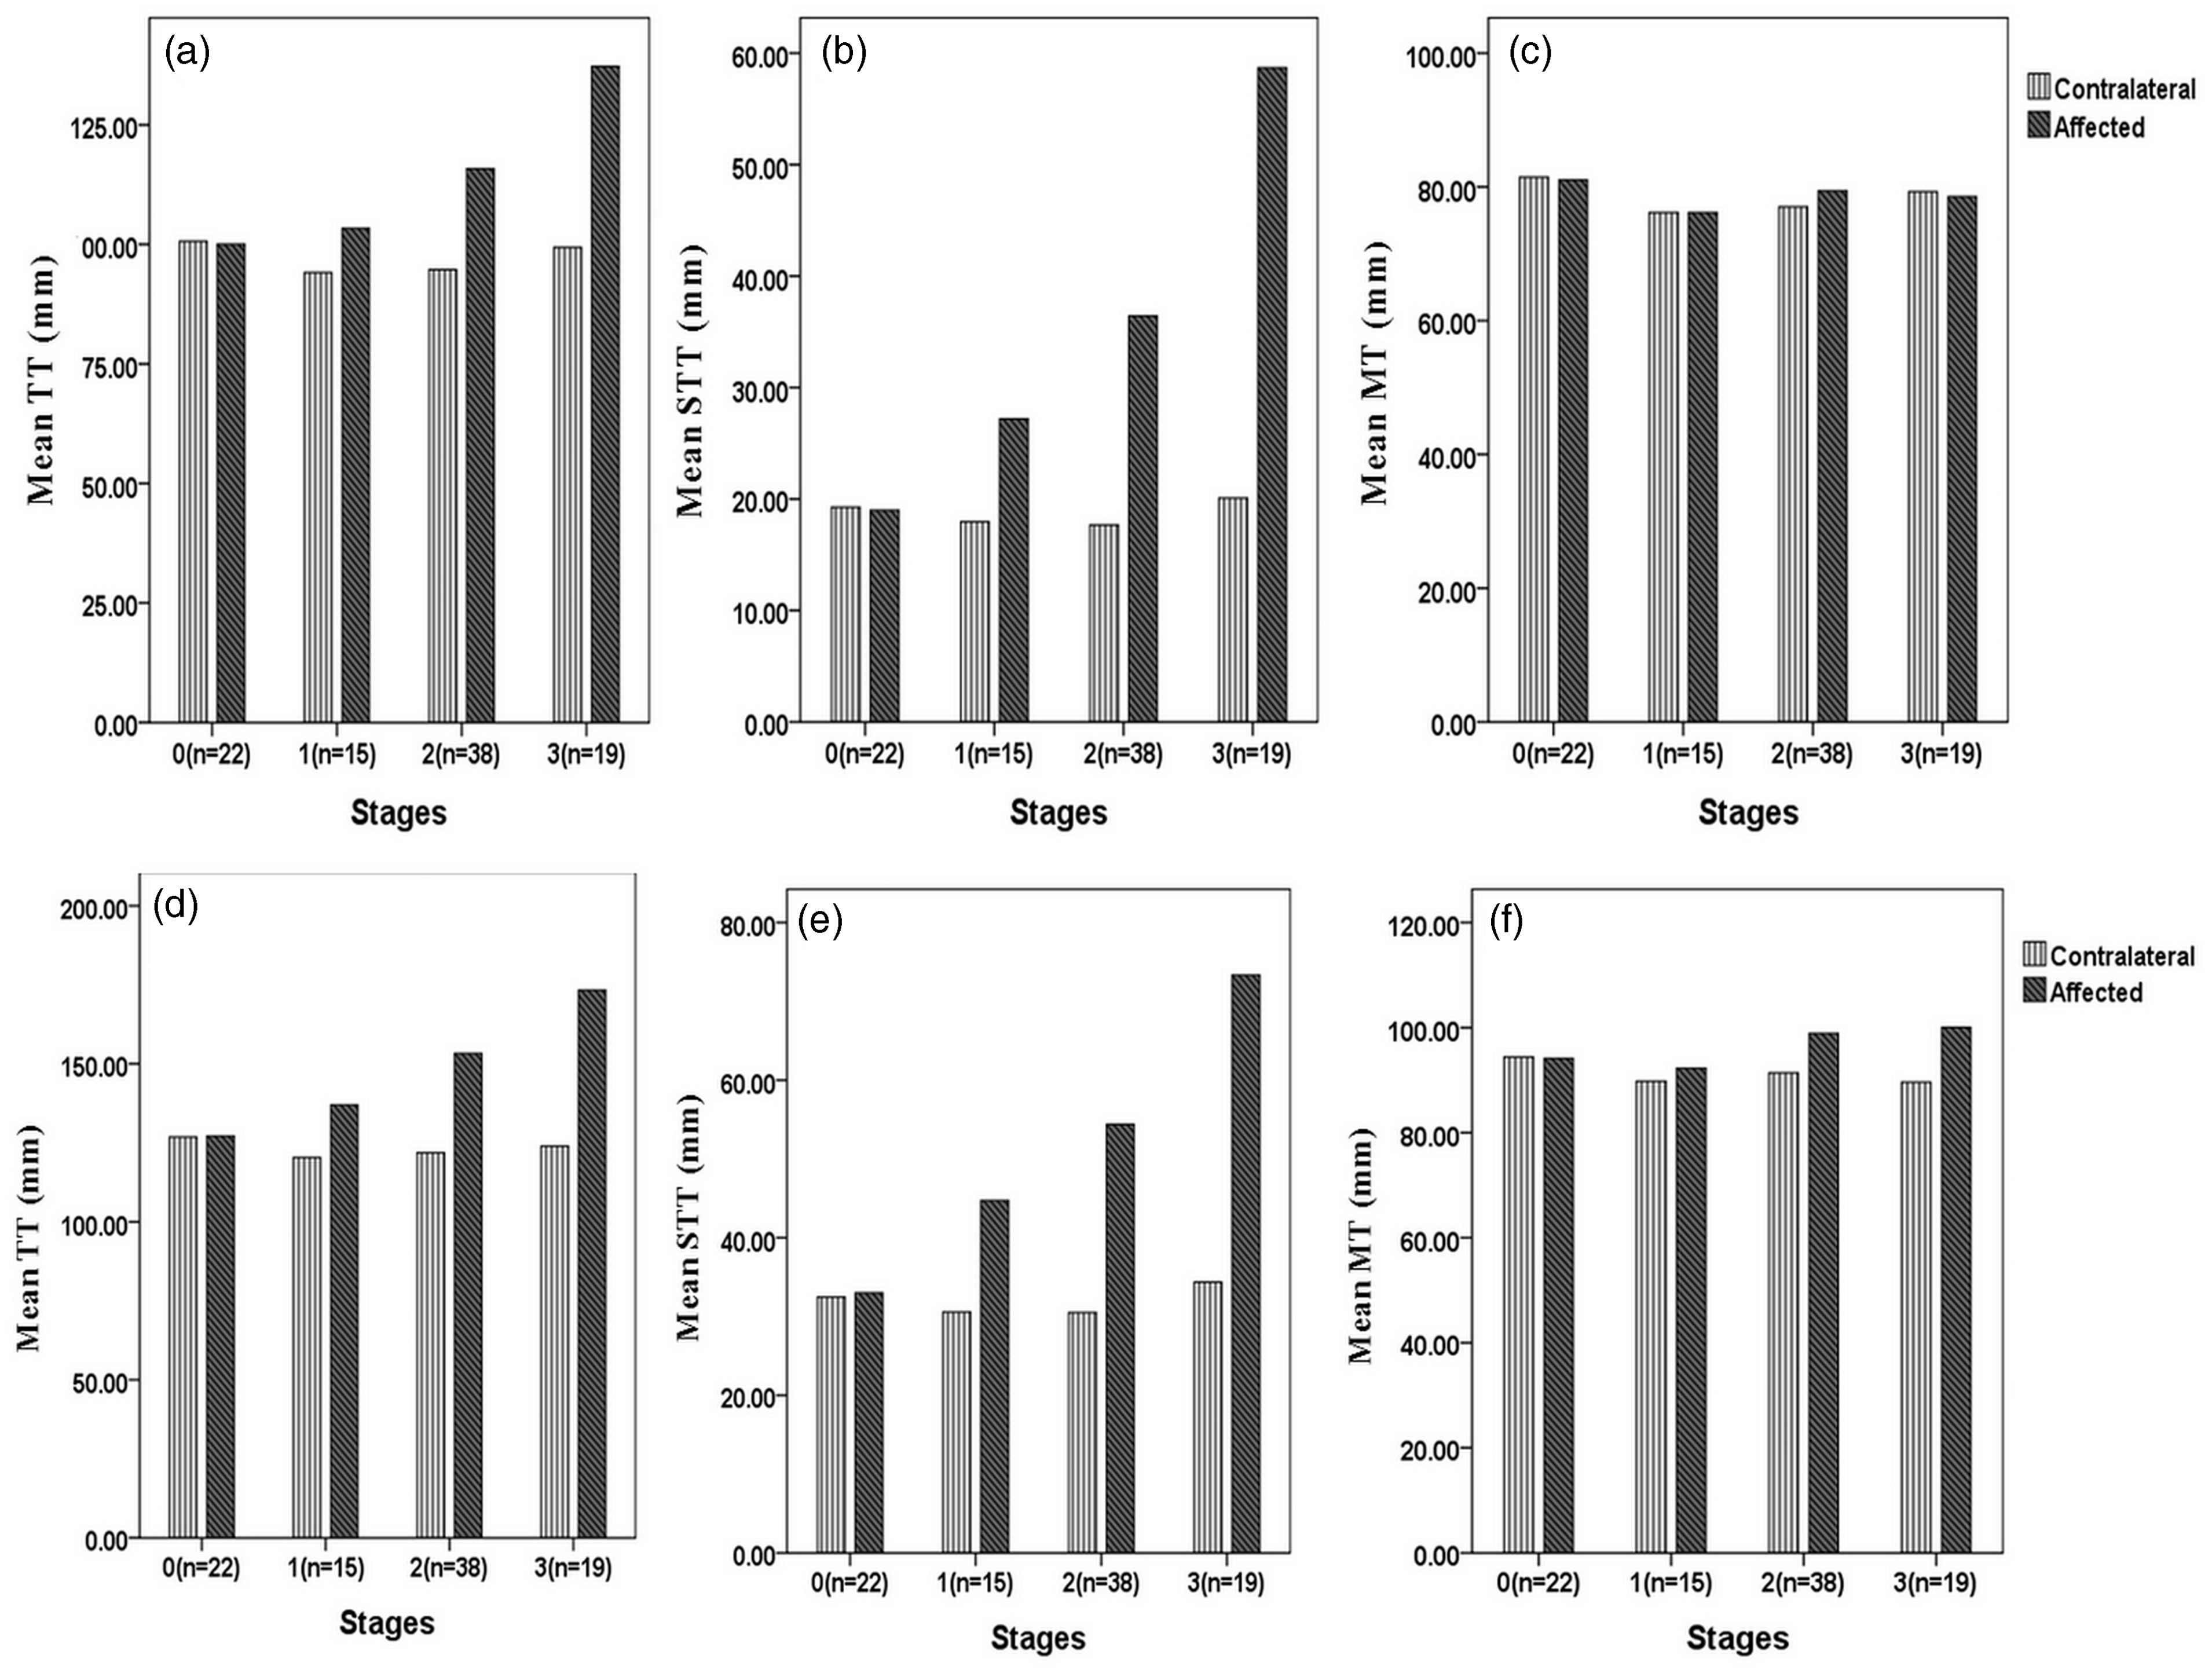
Multivariate analyses showed that the TT and STT of the affected calf, and the DTT and DSTT, significantly increased from stages 0 to 3 (all P < 0.05). However, no significant increase could be found in the MT of the affected calf or the DMT between calves. In the affected thigh, all the parameters, except MT, significantly increased from stages 0 to 3 (all P < 0.05). Pairwise comparisons with Bonferroni correction showed significant differences in the STT, DTT and DSTT of the affected calf between the different LEL stages; and in the DTT of the affected thigh between different LEL stages (all P < 0.05). No significant differences were found in the TT of the affected calf, and in the TT, STT, DSTT, and DMT of the affected thigh, in inter-LEL stage pairwise comparisons.
ROC analysis of the utility of the soft tissue thickness of the affected extremity for staging LEL
Receiver operating curve analysis of soft tissue thickness of affected extremity for classifying stages of lower extremity lymphedema.

AUC, area under the curve; DTT, DSTT, and DMT, difference of TT, STT, and MT, respectively; MT, muscle thickness; STT, subcutaneous tissue thickness; TT, total thickness of soft tissue.
Discussion
As well documented in the literature, tissue remodeling is significantly associated with LEL (15,18). Typical MRI features of LEL allow characterization of the pathological changes, including circumferential edema, increased subcutaneous tissue volume, and a honeycomb pattern with marked dermal thickening (13,16,17,19,20). Because MRI has excellent soft tissue contrast, we were able to utilize it to quantitatively measure the thickness of remodeled soft tissue in the lower extremity, and determine how the parameters obtained could be used to assess and classify the severity of unilateral LEL. In this study, we initially used fat-suppressed T2W MRI for quantitative assessment of the thickness of different soft tissue layers in the lower extremity, as a means of staging unilateral LEL. T2W imaging with fat suppression can overcome the impact of the high signal of fatty tissue and show subcutaneous tissue edema. This procedure is reproducible, and excellent inter-observer agreements in the TT and MT values of the calf and thigh were achieved.
The TT, STT, DTT, and DSTT of the affected calves and thighs correlated closely with LEL stage; the DSTT of the calves and DTT of the thighs were the best parameters. These findings suggest that thickened subcutaneous tissue contributes to the enlargement of the lymphedematous calf, while thickened subcutaneous tissue and expanded muscle contribute to the enlargement of the lymphedematous thigh. These findings are consistent with previous studies of LEL using MRI, CT, or US, which have demonstrated that the subcutaneous tissue thickness commonly increases in a lower extremity with chronic lymphedema (13,17,21–23). We have also demonstrated a positive correlation between increasing soft tissue thickness and increasing LEL stage. In addition, our findings are not consistent with previous studies on primary lymphedema, which reported that subcutaneous tissue and muscle contributed equally to the enlargement of the lymphedematous calf (13,22). Our findings also suggest that the calf suffers more from lymphedema than the thigh, perhaps attributable to gravity and differences in tissue elements (22,23). Our results can be explained by pathophysiologic observations that tissue remodeling is significantly associated with LEL. As shown in Fig. 3, although increasing clinical LEL stage was associated with increased fluid in the subcutaneous compartment of the edematous calf, there was also deposition of reorganized adipose tissue and formation of fibrosis in stages 2 and 3. The data in Tables 3 and 4, and Fig. 2, indicate that an increase in the measured muscle tissue in the thigh is not caused by the presence of more water or adipose tissue within the muscle compartment, but by an enlargement of the muscle diameter itself (muscle hypertrophy), presumably secondary to the extra weight that the extremity has to carry.
The significant differences in the STT, DTT, and DSTT of the calves, and the DTT of the thighs, between the various LEL stages suggest that these parameters could potentially be used as indicators to differentiate between LEL stages. Our findings highlight that the DSTT of the calves was the best parameter for classifying LEL stage, since it had the highest AUC. Thus, we recommend that the DSTT of the calves could be a potential parameter for staging LEL.
MRI is more expensive than circumference or volume measurements for assessing LEL; nonetheless, it may prove cost-effective. It is well known that detection and treatment of early-stage LEL can lead to near normalization of a swollen limb, and a greater chance of minimizing or avoiding significant complications. Left untreated, LEL will progressively worsen and result in many complications, including increased pain, reduced range of motion and mobility, increased risk of infection, and other physical and psychological sequelae (7). Patients who develop chronic LEL may suffer significant physical disability, unemployment, and financial problems (8,24,25). MRI-derived DSTT can identify stage 0 and 1 LEL with a sensitivity of 93.0% and specificity of 81.8%. This suggests that MRI could be a potentially useful tool for detecting early-stage LEL, and thus a cost-effective approach to assessing LEL in the future.
Our study has several limitations. First, validation of this quantitative approach in patients with LEL in bilateral extremities was not carried out. Despite this limitation, our results are suitable for patients with unilateral LEL. Second, this quantitative approach has not been validated for the determination of therapeutic effectiveness; further studies should focus on quantification of lymphedema for prognostic purposes and determination of therapeutic responses. Third, the 22 participants without LEL and 72 patients with LEL may have had slight pre-clinical lymphedema in their unaffected extremity; hence, a subsequent study should include a group of un-operated, healthy controls.
In conclusion, fat-suppressed T2W MRI is a feasible and reproducible method for quantitatively assessing secondary unilateral LEL. We recommend DSTT measured with MRI for staging LEL. We hope this study will prove helpful for detecting and staging LEL, thus facilitating decision-making about appropriate management strategies.
Footnotes
Conflict of interest
None declared.
Funding
This work was supported by the National Natural Science Foundation of China (81271638, 30970819, 81371622); National Basic Research Program of China (973 Program, 2012CB932600); Frontier Technology Project of Shanghai Shen-kang Hospital Development Center (SHDC12012112); and Shanghai Leading Academic Discipline Project (S30203).