
Abstract
Background
Increased wall thickness in the aortic root has been suggested as an early sign of prosthetic valve endocarditis (PVE). However, there are no previous studies on the aortic wall thickness after aortic valve replacement (AVR) or in patients with PVE.
Purpose
To identify a clinically useful cutoff value for aortic wall thickness to detect PVE.
Material and Methods
Chest computed tomography (CT) studies (n = 303) on patients with a prosthetic aortic valve were retrospectively analyzed. CT studies on patients without PVE (n = 260) were compared with CT studies on patients with definite PVE (n = 43). A receiver operator characteristic (ROC) analysis was performed.
Results
In non-PVE patients, the wall thickness during the first 3 months postoperatively (n = 70, 4.5 ± 1.7 mm) was increased compared to beyond 3 months postoperatively (n = 190, 3.2 ± 1.0 mm, P < 0.001). Beyond 3 months postoperatively, the wall thickness 95th percentile was 5.0 mm without signs of further decrease with time. The wall thickness in PVE patients was 6.8 ± 3.0 mm (n = 43). Beyond 3 months postoperatively, ROC analysis yielded an area under the curve of 0.89 (95% CI, 0.81–0.96). With a cutoff value of 5 mm the sensitivity was 67%, specificity 95%, positive likelihood ratio 14.1, and negative likelihood ratio 0.35 of increased wall thickness in detecting PVE.
Conclusion
In the early postoperative period after AVR, the aortic wall thickness is increased compared to the late postoperative period. After 3 months, the wall thickness has decreased and stabilized. Increased wall thickness (>5 mm) beyond 3 months postoperatively significantly increases the likelihood of PVE.
Introduction
The diagnosis of aortic prosthetic valve endocarditis (PVE) remains a challenge and is more difficult than in native valve endocarditis (1). Transesophageal echocardiography (TEE) is the recommended imaging modality in suspected PVE (1). Three echocardiographic findings constitute major criteria in the diagnosis of PVE: vegetation, abscess, and dehiscence of a prosthetic valve (1). Increased wall thickness of the aorta has been observed in infective endocarditis (2) and suggested as an early sign of PVE (3) but is not included in diagnostic guidelines (1). We have shown in an earlier study that ECG-gated computed tomography (CT) has comparable diagnostic performance to TEE in the diagnosis of patients with aortic PVE (4). In this previous study, increased wall thickness of the aorta was regarded as a sign of aortic root infection (4). A complicating factor in diagnosing PVE is that in the early postoperative course after aortic valve replacement (AVR), the aortic wall is to some extent thickened due to postoperative hematoma and edema that will resolve with time (5,6). When this is the case, the appearance of the aortic wall on CT/TEE early after AVR may simulate infection. To our knowledge, there are no studies or consensus on the aortic wall thickness early or late after AVR or in patients with PVE.
The aim of this study was to identify a clinically useful cutoff value for aortic wall thickness to detect PVE. A retrospective analysis was performed of chest CT studies in patients with a prosthetic aortic valve with or without PVE. The aortic wall thickness over time after AVR was determined and compared with the aortic wall thickness in patients with PVE.
Material and Methods
Study population
Indications for chest CT.
The final study material consisted of 303 CT studies: 260 studies in patients (n = 185) without PVE (non-PVE patients; age, 70 ± 13 years) and 43 CT studies in patients (n = 43) with definite PVE (PVE patients; age, 64 ± 14 years). A flow chart of included cases is shown in Fig. 1.
Flow chart of included CT studies.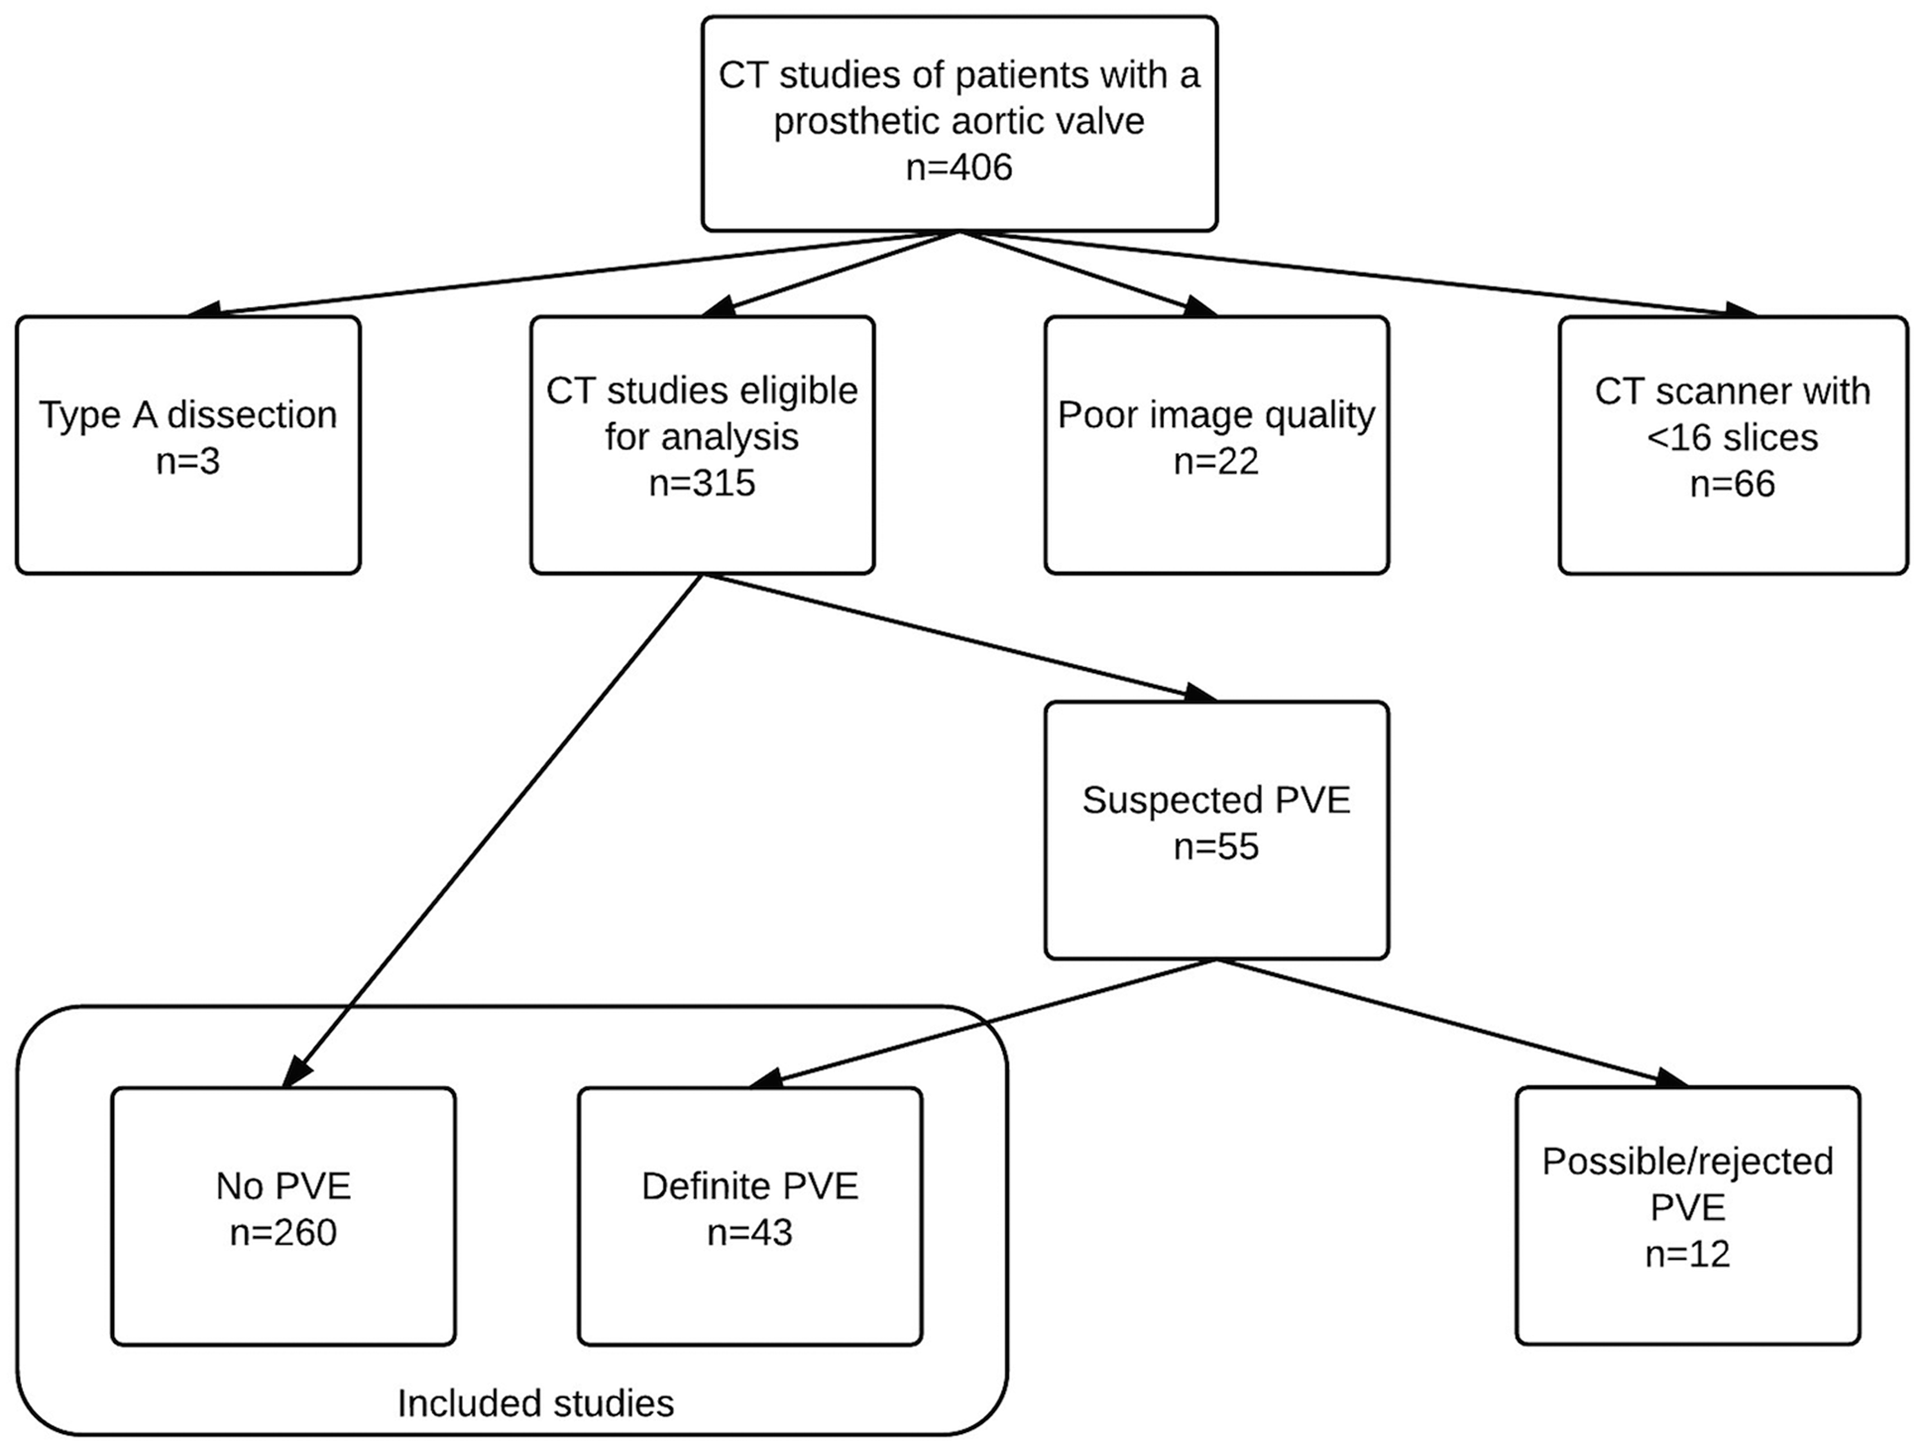
This retrospective study was approved by the Ethics Committee at the University of Gothenburg (no. 455-13).
Computed tomography
CT scanners.
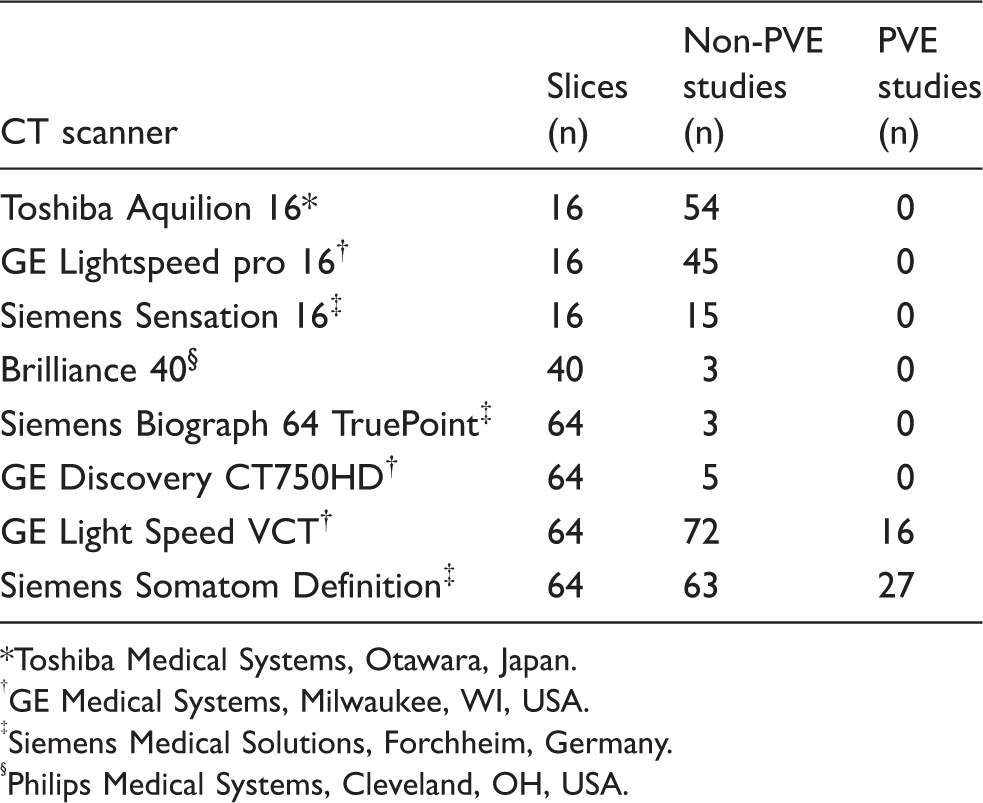
Toshiba Medical Systems, Otawara, Japan.
GE Medical Systems, Milwaukee, WI, USA.
Siemens Medical Solutions, Forchheim, Germany.
Philips Medical Systems, Cleveland, OH, USA.
In the 43 CT studies in patients with PVE, the slice thickness of transaxial images saved in the archive was 0.6 (n = 42) or 1.3 mm (n = 1). Forty-two studies (98%) were ECG-gated. The scanning protocol has been described in detail in a previous publication (4).
Wall thickness analysis
Wall measurements were performed by one radiologist (EF) using Centricity® Radiology RA600 (GE Healthcare, Barrington, IL, USA) picture archiving and communication system (PACS). The reader was free to use the magnification and windowing tools. The thickness of the aortic wall was measured on a transaxial image perpendicular to the wall in sinus Valsalva where the dorsal aspect of the aorta is adjacent to the left atrium (Fig. 2). The measurement was performed directly above the valve prosthesis. If available, sagittal reformatted images were used to aid the decision on which level to choose for the measurement (Fig. 2). This measurement point was chosen since in this region, the aortic wall is in immediate proximity to the left atrium and there is no epicardial fat or pericardium adjacent to the aortic wall. In cases where there were calcifications in the aortic wall, the measurement was performed in a part of the wall free of calcifications. Cases with extensive calcifications or motion artifacts were excluded (n = 22) (Fig. 1). In ECG-gated studies, the measurement was performed in diastole at 75% of the R-R interval. The reader was not blinded with respect to which group the patient was in.
Measurement of aortic wall thickness. (a) Aortic wall thickness was measured directly above the prosthesis where the aorta (AO) is apposed to the left atrium (LA). (b) Sagittal reformatted image. The white line shows the plane where the measurement was performed.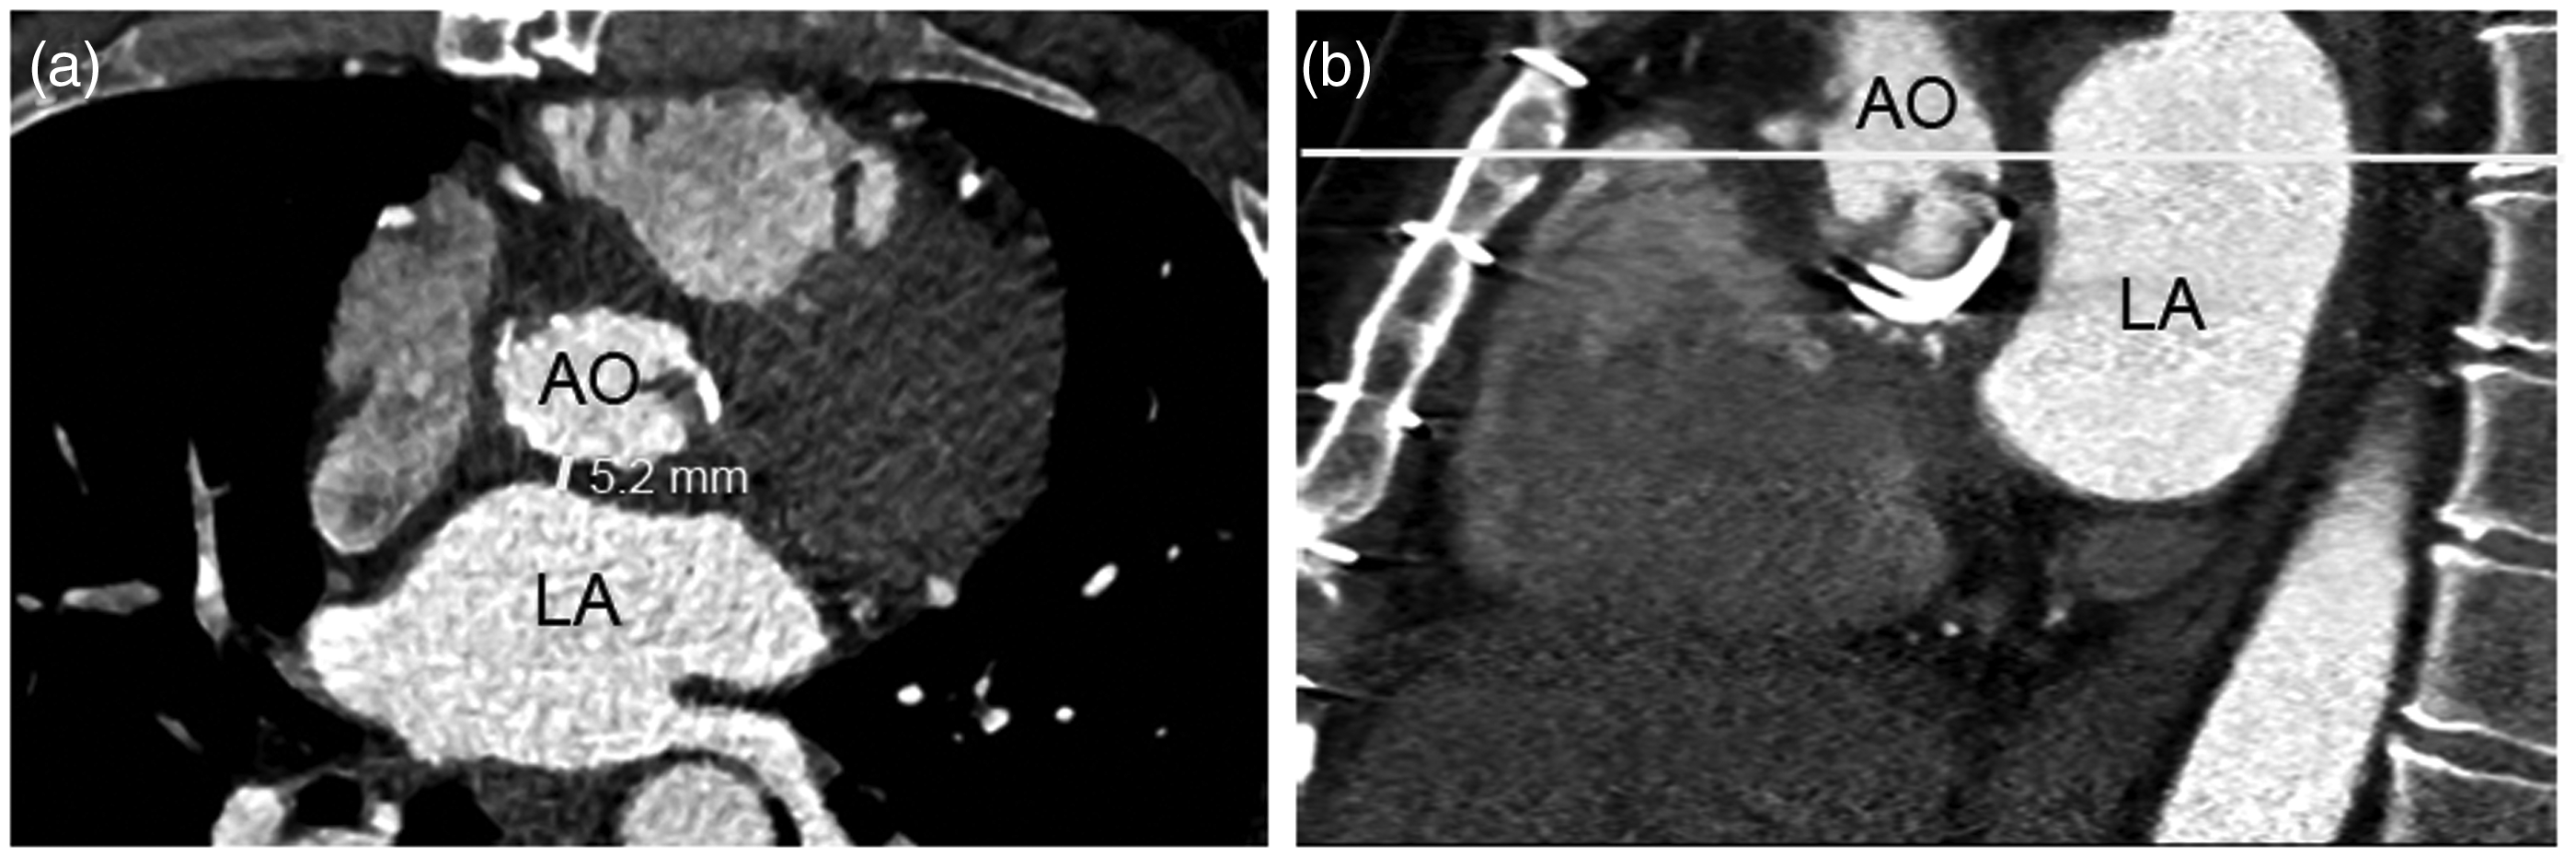
Observer variability
To assess inter-observer variability 40 studies (20 in non-PVE patients [not ECG-gated] and 20 in PVE patients [ECG-gated]) were independently analyzed by a second radiologist (AF). To assess intra-observer variability the 40 studies were re-analyzed by the first radiologist (EF) 6 months after the first evaluation. The image used for the measurement was chosen by the reader from the whole stack of transaxial images.
Statistical analysis
Continuous variables are presented as mean ± SD. To define the limit of a one-sided reference interval the 95th percentile was used. Comparison between groups was performed using independent samples Mann–Whitney U test. A P value less than 0.05 was considered significant. A receiver-operator characteristic (ROC) curve analysis was performed to assess the performance of increased wall thickness to detect PVE and to establish cutoff values. Diagnostic utility was described using sensitivity, specificity, positive likelihood ratio (LR(+)), and negative likelihood ratio (LR(–)). Inter- and intra-observer agreement were described with the repeatability coefficient (defined as 1.96 × √ [sum of the squares of the differences between observer measurements divided by n]) (8). Statistical analysis was performed using SPSS version 21 (SPSS Inc., Armonk, NY, USA).
Results
Non-PVE patients
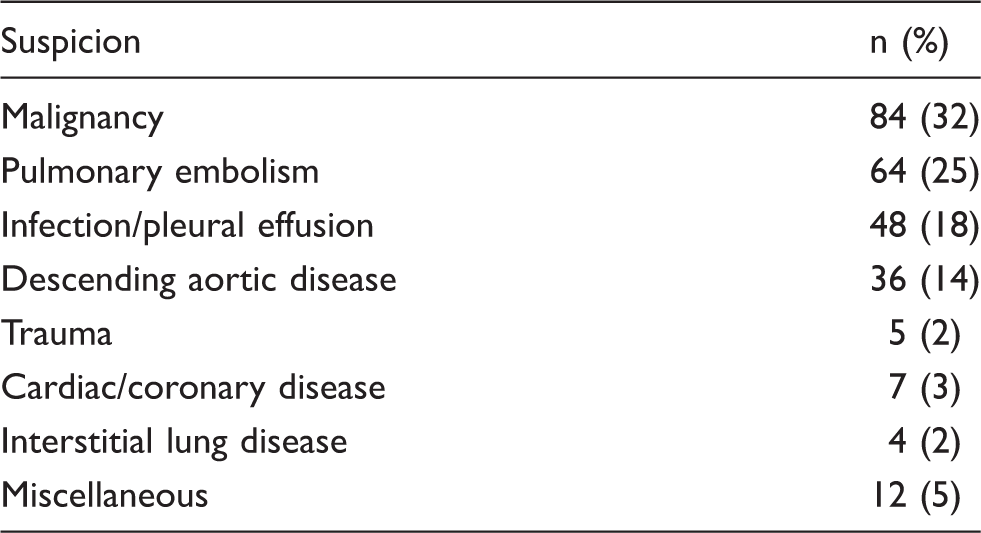
A total of 260 CT studies performed between 1 day and 11 years after AVR were evaluated. The indications for performing the CT studies are listed in Table 1. The aortic wall thickness was 3.6 ± 1.3 mm (n = 260).
The wall thickness decreased with time in the early postoperative period (Fig. 3). The scatter plot showed a large dispersion of aortic wall thickness during the first 3 months postoperatively with stabilization with no further change around 3 months postoperatively (Fig. 3). The wall thickness during the first 3 months postoperatively (n = 70, 4.5 ± 1.7 mm) was significantly increased compared to beyond 3 months postoperatively (n = 190, 3.2 ± 1.0 mm, P < 0.001) (Fig. 4). Linear regression analysis showed no further decrease in wall thickness (R = 0.12) after 1 year postoperatively.
Aortic wall thickness in non-PVE patients the first 2 years postoperatively. An increased aortic wall thickness is observed in the early postoperative period. Beyond 3 months postoperatively, the wall thickness 95th percentile is at 5.0 mm. Boxplot of aortic wall thickness in non-PVE patients and PVE patients. Non-PVE and PVE patients are compared during the first 3 months postoperatively (left) and beyond 3 months postoperatively (right).

Beyond 3 months after AVR, the wall thickness 95th percentile was at 5.0 mm.
There was no significant difference in wall thickness between mechanical (n = 76, 3.5 ± 1.6 mm) and biological (n = 184, 3.6 ± 1.2 mm, P = 0.39) prostheses. No significant difference between men (n = 158, 3.5 ± 1.4 mm) and women (n = 102, 3.7 ± 1.2 mm, P = 0.28) was found. Linear regression analysis showed that age was not associated with aortic wall thickness (R = 0.075).
PVE patients
A total of 43 CT studies, performed between 21 days and 9 years after surgery, were evaluated. The aortic wall thickness was 6.8 ± 3.0 mm (Fig. 5). There was no significant difference in wall thickness when comparing the first 3 months postoperatively (n = 7, 6.6 ± 2.4 mm) with beyond 3 months postoperatively (n = 36, 6.9 ± 3.6 mm, P = 0.8) (Fig. 4).
Increased aortic wall thickness in two patients with PVE. (a, b) A 27-year-old man with a mechanical prosthetic valve. Two years postoperatively, CT shows an aortic wall thickness of 2.9 mm (a). One year later, the patient presents with fever. CT shows an aortic wall thickness of 9.1 mm (b). PVE was confirmed at surgery. (c, d) A 67-year-old woman with a biological prosthetic valve. One month postoperatively, CT shows an aortic wall thickness of 3.3 mm (c). Three months later, the patient presents with fever. CT shows an aortic wall thickness of 9.8 mm (d). The patient had confirmed PVE according to the modified Duke criteria and was treated conservatively. AO, aorta; LA, left atrium; *, wall thickness measurement point.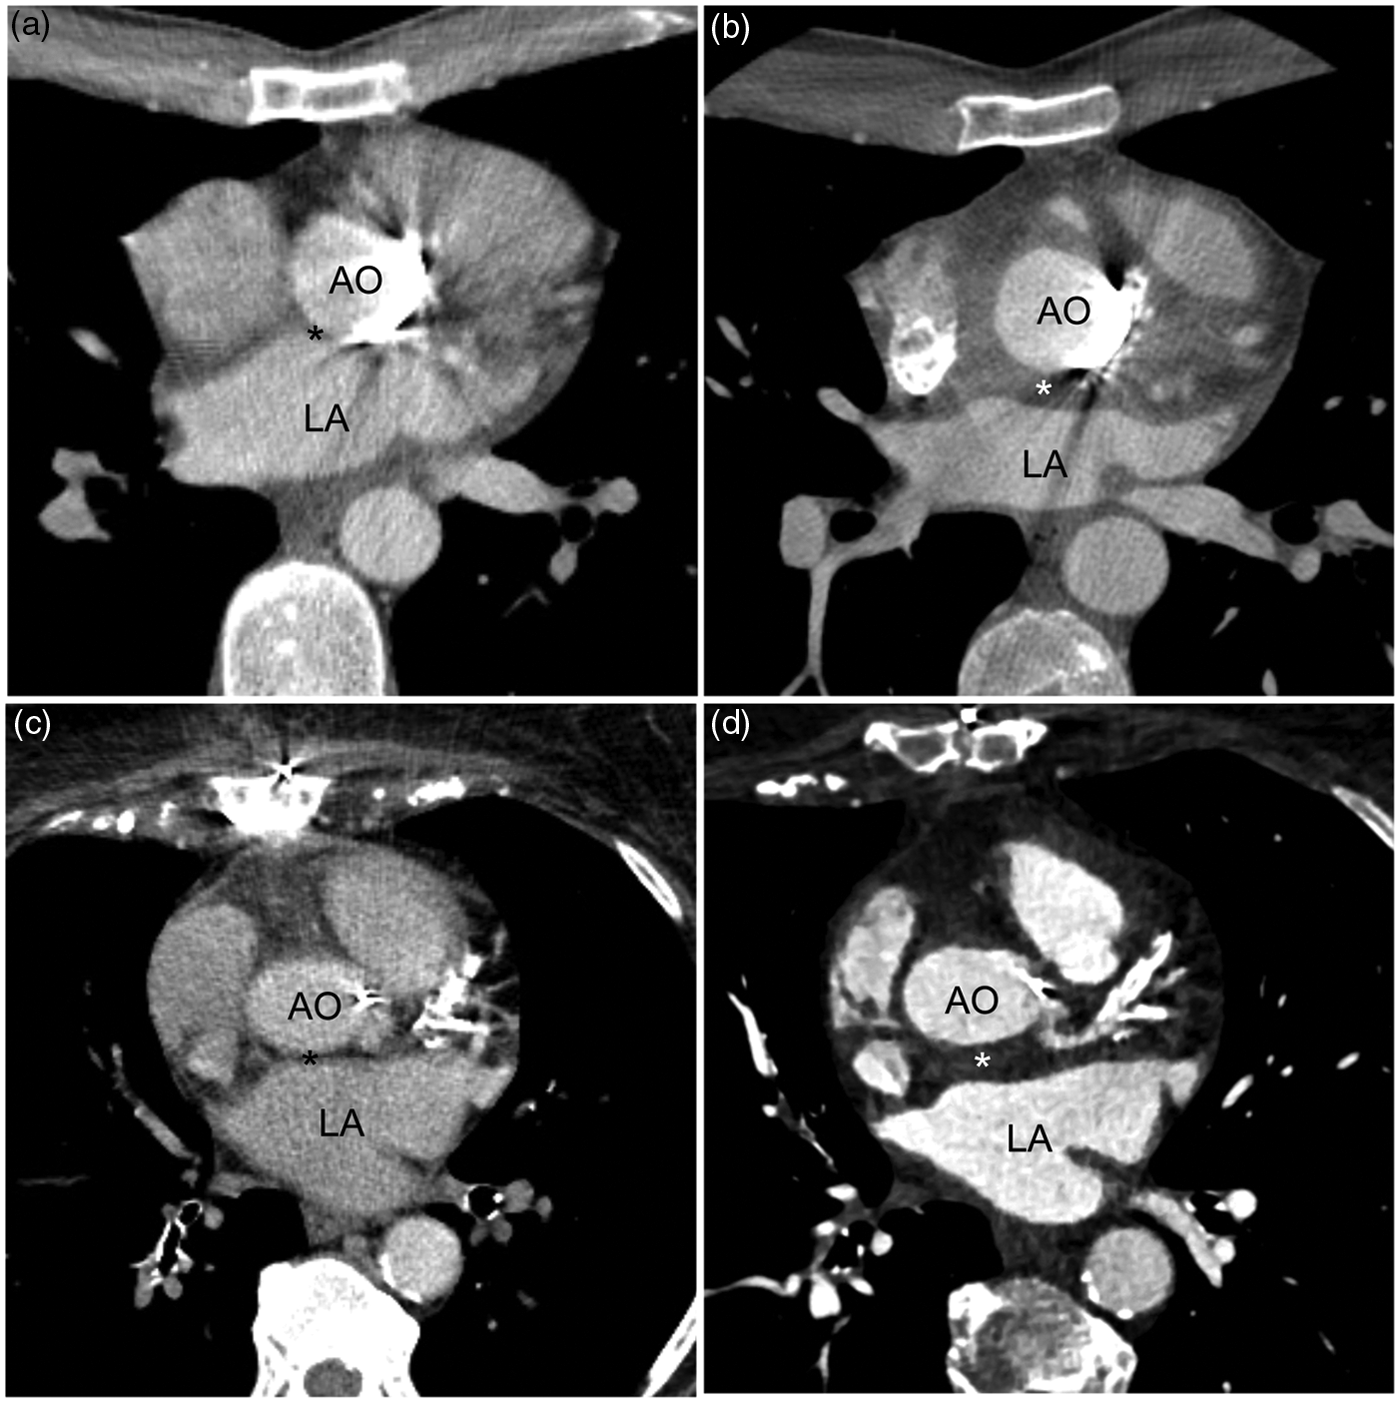
PVE patients versus non-PVE patients
A comparison of PVE patients with non-PVE patients for the first 3 months and beyond 3 months postoperatively is shown in Fig. 4. The PVE patients had significantly thicker aortic wall compared with non-PVE patients both when investigated within 3 months of surgery and later.
The ROC curve analysis of wall thickness for diagnosis of PVE beyond 3 months postoperatively showed an area under the curve of 0.89 (95% CI, 0.81–0.96) (Fig. 6). With a cutoff value of 5 mm, the sensitivity was 67% and the specificity 95%, LR(+) 14.1, and LR(–) 0.35.
ROC curve for the performance of aortic wall thickness in the differentiation of PVE and non-PVE patients. The area under the curve is 0.89. The asterisk marks the coordinate for a 5 mm cutoff. A lower cutoff (moving towards the upper right corner of the ROC curve) would give a higher sensitivity but to the cost of lower specificity.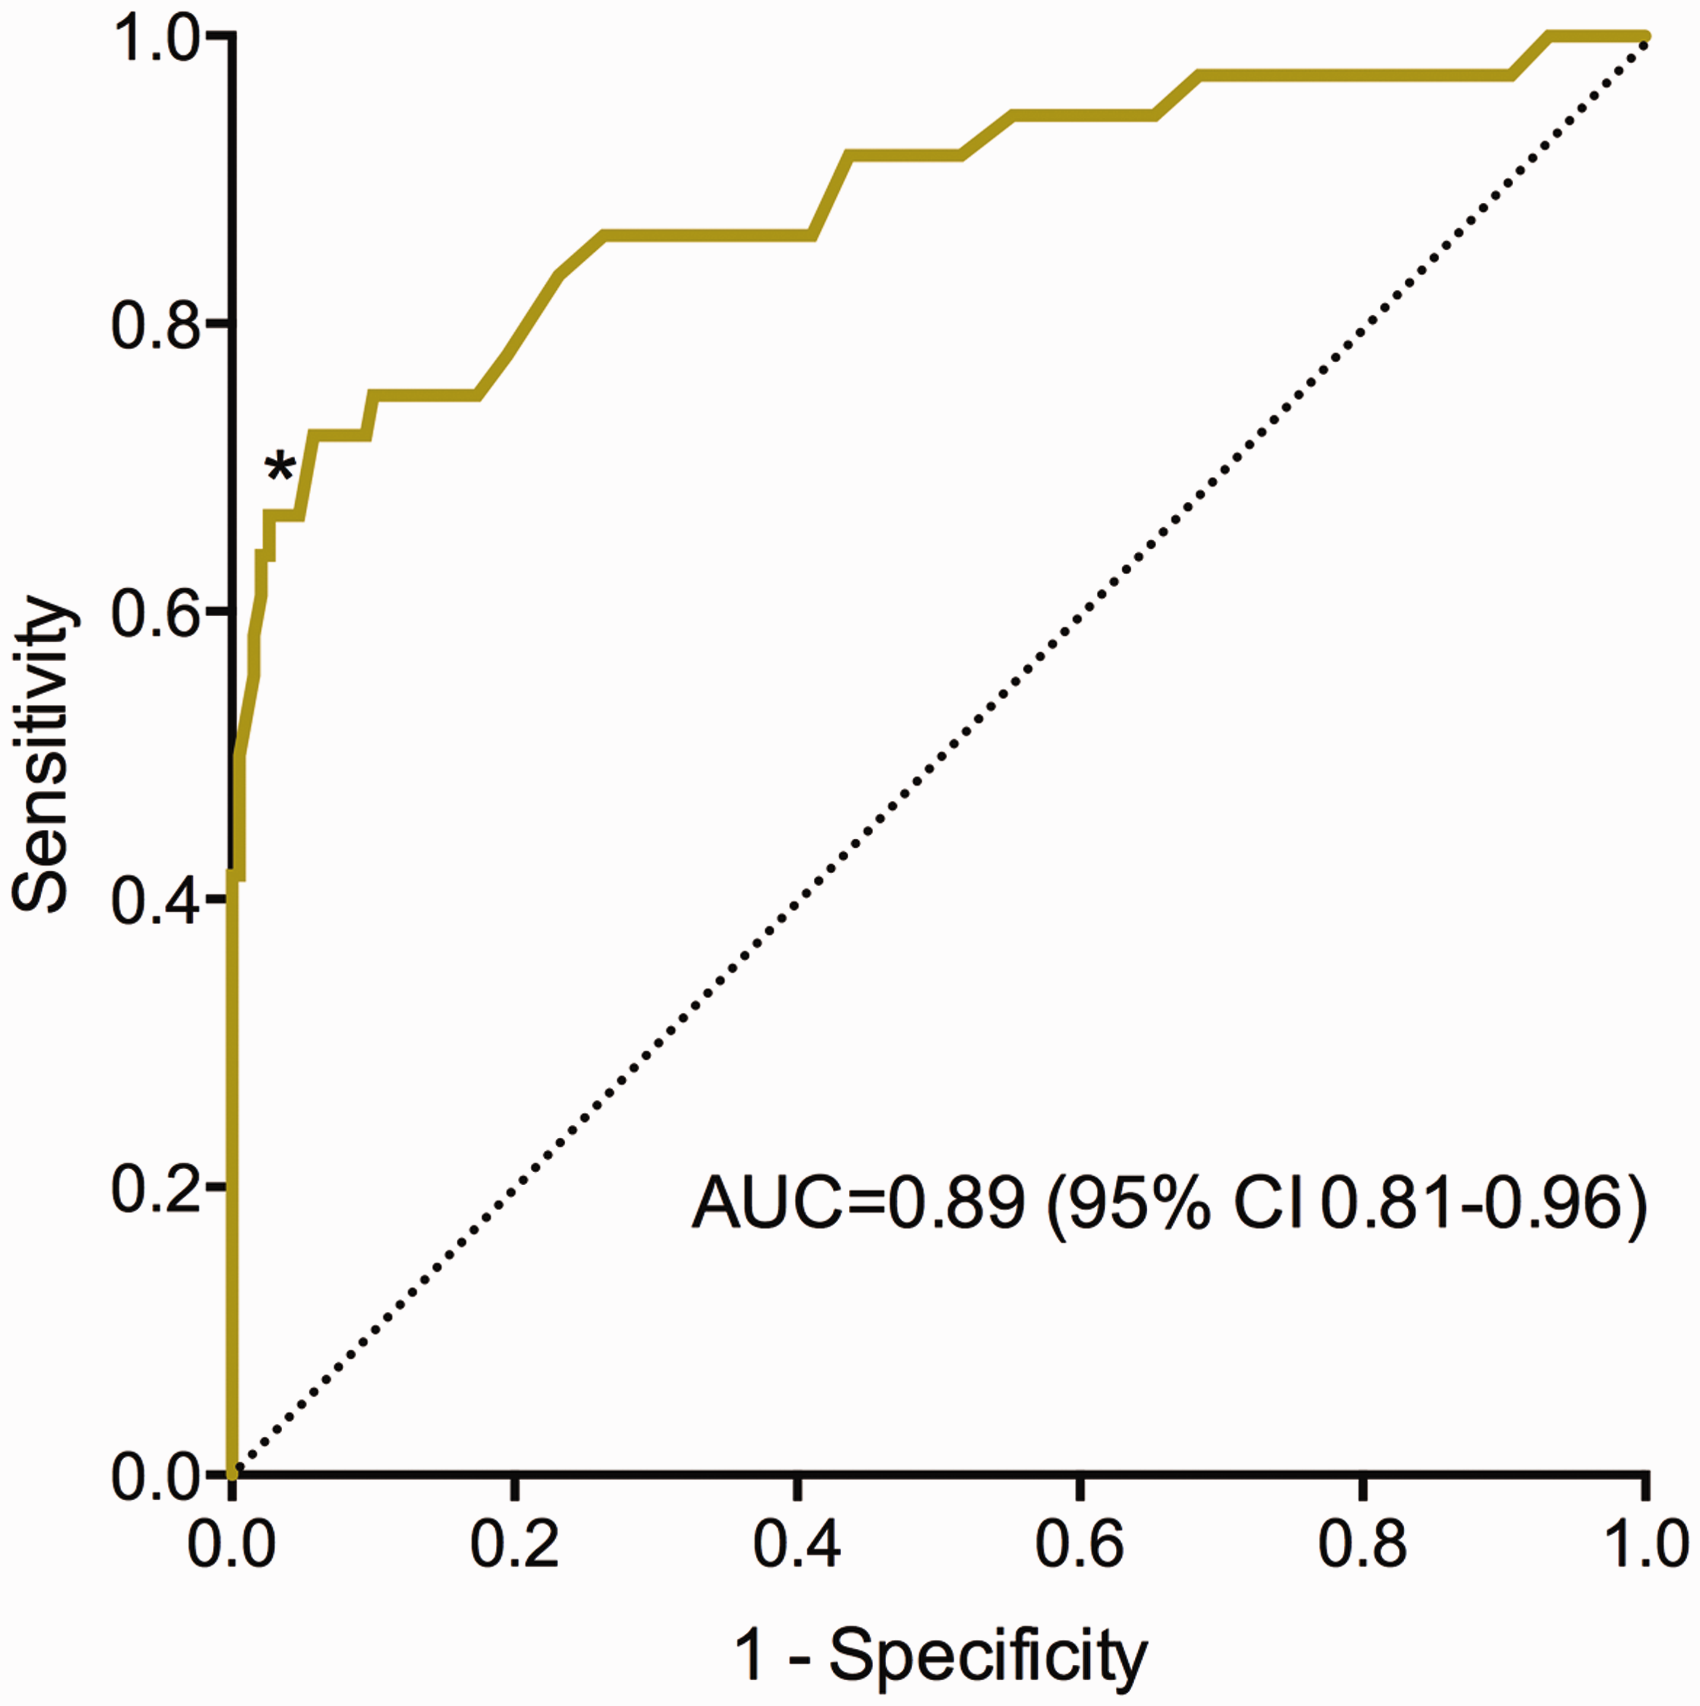
ROC curve analysis of wall thickness for diagnosis of PVE during the first 3 months postoperatively showed an area under the curve of 0.79 (95% CI, 0.65–0.92). With a cutoff value of 5 mm, the sensitivity was 57%, specificity 67%, LR(+) 1.7, and LR(–) 0.64 for the diagnosis of PVE.
Observer variability
In 20 CT studies on non-PVE patients (not ECG-gated), the repeatability coefficient for inter-observer variability was 1.4 mm and for intra-observer variability 1.5 mm. In 20 CT studies on PVE patients (ECG-gated), the repeatability coefficient for inter-observer variability was 1.5 mm and for intra-observer variability 1.3 mm.
Discussion
The main findings of the present study are: (i) An aortic wall thickness of more than 5 mm after AVR is a highly specific sign of PVE (except for the first 3 months postoperatively); and (ii) In non-PVE patients, the wall thickness is increased in the early compared to the late postoperative period. After 3 months, the wall thickness has decreased and has stabilized with 5 mm as upper normal limit.
PVE is the most severe form of infective endocarditis and is associated with high mortality and difficulties in diagnosis (1). Early diagnosis is important and may improve clinical outcome (2). Diagnosis is mainly based on the results of echocardiography and blood cultures (1). However, the sensitivity of TEE is lower in PVE than in native valve endocarditis and the diagnosis is missed by echocardiography in up to 30% of cases (2,9). Vegetation may be difficult to identify or be absent in the presence of a prosthetic valve (1). In an earlier study by our group, TEE found no vegetation in 14 out of 27 patients (52%) with PVE (4). Acoustic shadowing from the prosthetic valve is another important contributor to the lower sensitivity of TEE in PVE compared with native valve endocarditis (4,10). Other imaging modalities as 18F-fluorodeoxyglucose (18 F-FDG) PET-CT (9,11) and radiolabeled leukocyte single photon emission computed tomography fused with CT (SPECT/CT) (12) have been used in patients with PVE. The PET-CT method detects increased metabolism while SPECT/CT is more specific for infection using isotope-labeled leukocytes. Both methods, especially PET-CT, may play a role in the management of patents with suspected PVE. However, there are issues concerning availability, cost, imaging protocols, and false negative and false positive investigations (13–15). 18F-FDG PET-CT may be false positive in the early postoperative period following AVR and findings should be interpreted with caution (16). ECG-gated CT is a new cardiac imaging modality with a possible complimentary role in the diagnosis of PVE (4,17,18). Definite paravalvular lesions on ECG-gated CT has been added as a major criterion in the diagnosis of infective endocarditis in the recently updated guidelines by the European Society of Cardiology 2015 (19). Although TEE will be diagnostic in most patients with PVE, ECG-gated CT might add important information. Perivalvular extension of endocarditis is the most frequent cause of uncontrolled infection and is associated with poor prognosis and high likelihood of need for surgery (1). Prognosis is better if surgery is undertaken early (20). Thus, early diagnosis is of importance for prognosis. Increased aortic wall thickness may be the first imaging finding indicating PVE and was in an earlier study by our group the most common finding in patients with PVE (4). Thorough inspection of the aortic root on chest CT in patients with a prosthetic aortic valve presenting with fever may lead to suggestion of the diagnosis early in the disease progression before abscess and valve dehiscence have developed. Furthermore, in cases were a pseudoaneurysm of unclear nature is present, increased wall thickness in surrounding parts of the aortic wall might be a sign of active infection as the cause of the pseudoaneurysm.
The time course of the inflammatory response in the aortic root after AVR is not known. The present study showed an increased wall thickness in the early postoperative period after AVR (≤3 months postoperatively) in patients without infection. After 3 months the wall thickness stabilized at a constant level. The aortic wall thickness in the late postoperative period was in the same range as in previous studies of aortic wall thickness in normal subjects (without any aortic surgery). In a study by Summers et al., maximum supravalvular aortic wall thickness on MRI in healthy volunteers was 3.0 ± 0.8 mm (21). In a study by Muraru et al., the mean ascending aortic wall thickness measured by 2D echocardiography in healthy volunteers was 2.4 ± 0.8 mm (22). In the present study the corresponding diameter was 3.2 ± 1.0 mm and the 95th percentile of a one-sided reference interval in non-PVE patients beyond 3 months postoperatively was 5.0 mm. During the first 3 months postoperatively, there was a significant difference in wall thickness between PVE and non-PVE patients but the ROC-curve analysis demonstrated low ability to discriminate between PVE and postoperative inflammatory response. Thus, in the early postoperative period, increased wall thickness is less useful as a criterion for the diagnosis of PVE. After 3 months wall thickness can be used to identify patients with PVE. ROC analysis gave an optimal cutoff value around 5 mm with high specificity. The relatively low sensitivity is an expected finding. In patients with PVE, perivalvular extension of the infection is common but infection may be limited to the prosthetic valve with vegetation as the only imaging finding. These cases will be false negative.
The major limitation of this study is that the measurements in non-PVE patients were performed on CT studies with varying image quality and slice thickness and in most cases without ECG-gating. Motion artifacts in the aortic root might lead to an overestimation of the wall thickness. Further, the measurements were performed on regular transaxial slices of the chest and not on oblique images with a true transaxial plane through the aortic root. This may also lead to an overestimation of the wall thickness. The CT studies in PVE patients were in most cases ECG-gated. These measurements were likely more accurate. Hence, the difference in true wall thickness between non-PVE and PVE patients might be even larger than this study showed. A second limitation is that blinding of the reader performing the measurements with respect to which group the patient was in was not possible, since most studies of PVE patients were ECG-gated in contrast to the non-PVE group. A third limitation is that the CT studies performed on non-PVE patients were all clinically indicated and hence this is not a true normal population. Although all patients with PVE or aortic dissection/aneurysm were excluded, there might be other diseases in this group that affect the aortic root. Finally, there were only seven PVE patients in the early postoperative period and further studies on patients with PVE in the early postoperative period are needed to conclude if this subgroup differs in wall thickness from late PVE or from early non-PVE patients. Future prospective studies with ECG-gated CT in PVE and non-PVE patients with blinded readers are also warranted to test the 5 mm limit and evaluate the diagnostic performance of increased aortic wall thickness in the diagnosis of PVE.
In conclusion, our results suggest that the aortic wall thickness is increased in the early postoperative period after AVR compared to the late postoperative period. After 3 months, the wall thickness had decreased and stabilized with a 5 mm upper limit. Increased wall thickness (>5 mm) beyond 3 months postoperatively significantly increases the likelihood of PVE.
Footnotes
Declaration of conflicting interests
The author(s) declared no potential conflicts of interest with respect to the research, authorship, and/or publication of this article.
Funding
The author(s) received no financial support for the research, authorship, and/or publication of this article.