




Abstract
Background
Mouse models of human-malignant-melanoma (MM) are important tools to study tumor dynamics. The enhanced green fluorescent protein (EGFP) is widely used in molecular imaging approaches, together with optical scanners, and fluorescence imaging.
Purpose
Currently, there are no data available as to whether other fluorescent proteins are more suitable. The goal of this preclinical study was to analyze two fluorescent proteins of the GFP superfamily under real-time in vivo conditions using fluorescence reflectance imaging (FRI).
Material and Methods
The human melanoma cell line MeWo was stable transfected with one plasmid: pEGFP-C1 or pDsRed1-N1. We investigated two severe combined immunodeficiency (SCID)-mice groups: A (solid xenografts) and B (xenografts as metastases). After three weeks, the animals were weekly imaged by FRI. Afterwards the mice were euthanized and metastases were imaged in situ: to quantify the cutis-dependent reduction of emitted light, we compared signal intensities obtained by metastases in vivo with signal intensities obtained by in situ liver parenchyma preparations.
Results
More than 90% of cells were stable transfected. EGFP-/DsRed-xenograft tumors had identical growth kinetics. In vivo the emitted light by DsRed tumors/metastases was much brighter than by EGFP. DsRed metastases were earlier (3 vs. 5 weeks) and much more sensitive detectable than EGFP metastases. Cutis-dependent reduction of emitted light was greater in EGFP than in DsRed mice (tenfold). Autofluorescence of DsRed was lower than of EGFP.
Conclusion
We established an in vivo xenograft mouse model (DsRed-MeWo) that is reliable, reproducible, and superior to the EGFP model as a preclinical tool to study innovative therapies by FRI under real-time in vivo conditions.
Introduction
Malignant melanoma (MM) is still a frequent cutaneous neoplasm with poor prognosis. The reason for this phenomenon is unclear, but limited study options may play a role in this context. Most recent studies to analyze pathological mechanisms or innovative treatments have been done on cell culture models in vitro only (1–4). Preclinical in vivo animal MM models have so far been very rarely reported (5–8).
Since both growth and regression are dynamic processes, the combination of xenografts with non-invasive imaging techniques with different modalities is an excellent in vivo platform to continuously monitor oncological processes. It also affords the opportunity to develop image-based prognostic biomarkers that could lead to individualized patient treatment (9–12). Due to its sensitivity, optical imaging (OI) in general and fluorescence reflectance imaging (FRI) in particular are comparable to nuclear medical imaging procedures such as single photon emission computed tomography (SPECT) or positron emission tomography (PET) and has the advantage of lacking radioactive tracers. Moreover, OI is cost-effective, rapid, easy to use, and can be readily applied to studying disease processes and biology in vivo (13). In vivo OI is the result of a coalescence of technologies from chemistry, physics, and biology (13), but should be adjusted to in vivo conditions. Previous studies show that imaging of green fluorescent protein (GFP)-transfected tumor cell lines is an interesting tool to monitor both tumor progression, and treatment-induced regression, and can yield prognostic information (14–21). Enhanced green fluorescent protein (EGFP) is one of the most common used fluorescent proteins in pre-clinical OI studies (22–25). Despite great advances in OI techniques, limited information is available on the use of the most suitable fluorescence protein for preclinical tumor models. Other members of the GFP superfamily such as the fluorescent protein called DsRed have been rarely used for these approaches (26,27). In particular, the question of which fluorescent protein is the most suitable has not yet been investigated thoroughly. Moreover, to our knowledge there are no papers available that report on non-invasive in vivo monitoring of melanoma growth by FRI. Therefore, the goal of the present preclinical study was to establish an animal model for studying MM growth including metastasis by FRI by using genetically modified MeWo cells (human melanoma cell line) expressing one of two different fluorescent proteins of the GFP superfamily: EGFP or DsRed. This paper, for the first time, shows non-invasive FRI of human melanoma xenografts as diagnostic tool to depict both solid tumors and metastases in vivo.
Material and Methods
Reporter genes and corresponding fluorescent proteins of the GFP superfamily
The two fluorescent protein encoding plasmids pEGFP-C1 (vector C1) and pDsRed2-N1 (vector N1) (Fig. 1), purchased from Clontech Laboratories (Mountain View, CA, USA), were used. Plasmid pEGFP-C1 contains the gene (egfp) of the enhanced green fluorescent protein (EGFP). The pDsRed2-N1 plasmid contains the dsred2 gene.
Schematic drawing of plasmids, three-dimensional structure of the proteins as well as excitation/emission spectra of both EGFP and DsRed (after 42–47).
EGFP has an excitation maximum of 484 nm and an emission maximum of 510 nm. DsRed is another fluorescent protein of the GFP superfamily with an excitation maximum of 556 nm and an emission maximum of 586 nm.
Tumor cells
The human melanoma cell line MeWo (European Collection of Authenticated Cell Cultures [ECACC] no. 93082609), originally obtained from the American Type Culture Collection (ATCC) (Manassas, VA, USA), was grown at 37℃ in a 5% CO2 humidified atmosphere in Dulbecco’s Modified Eagle Medium (DMEM) (BioWhitaker, Verviers, Belgium) supplemented with 10% fetal bovine serum (BioWhitaker), 1% penicillin/streptomycin, and 200 mM glutamine in 100-mm2 culture dishes (Nunc, Wiesbaden, Germany).
Transfection experiments
1 × 10⁶ MeWo cells were grown to 50% confluence in 100 mm2 dishes before the transfection started. Then MeWo cells were seeded into six-well plates (Nunc, Wiesbaden, Germany). After 24 h, the medium was replaced by serum-free DMEM. Transfection was done with Lipofektin™ (Invitrogen, CA, USA) and 5 µg of each plasmid (pEGFP-C1 or pDsRed2-N1), according to the manufacturer’s instructions. Briefly, 10 µL lipid and 100 µL OptiMEM (reduced serum medium on the basis of Minimal Essential Medium [MEM] purchased from GibcoBRL, Eggenstein, Germany) were mixed in a polystyrene tube (Greiner, Nürtlingen, Germany) and incubated for 30 min. Afterwards, 5 µL pEGFP or pDsRed2-N1 in 100 µL OptiMEM was added and incubated for a further 15 min. The mixture was added to the cells. After 3 h incubation, the transfection medium was removed and fresh complete growth medium was added.
Twenty-four hours after transfection, the cells were selected with 500 µg/mL geneticin (G418; Clontech) to obtain pools of stable transfected cell lines. Individual colonies were transferred into six-well plates to continue incubation with G418 selection medium. The medium was changed every three days until G418-resistant colonies were clearly evident. Individual colonies were evaluated for EGFP or DsRed expression by fluorescent microscopy (see below). Monoclonal transfected MeWo cell lines were used for all experiments successively.
In vitro cell analysis
Figure 2 illustrates the experimental in vitro, in vivo, and in situ settings.
Schematic drawing showing the experimental settings of this preclinical study. (a) Starting with culture of MeWo cells (left), we transfected them either with DsRed or EGFP. We checked the successful transfection by fluorescence microscopy visualization and measured the fluorescence signal intensities in dependency of different excitation times. We then started the animal experiments. We induced solid tumors (group A, n = 4 animals) by tumor cell injection in the flanks, and metastases (group B, n = 5 animals) by intravenous tumor cell injection. Tumor growth in vivo was measured on days 7, 14, and 21 after xenotransplantation. (b) Group A (n = 4) SCID mice with solid tumors were imaged by FRI on days 23, 30, 37, 44 after tumor induction. Group B (n = 5) SCID mice with liver metastases were imaged by FRI on days 23, 30, 37, 44, and 51 after induction. In addition, on day 51, only lung metastases were imaged in vivo. (c) Group B (n = 5). On day 51 following tumor inoculation: animals were euthanized, the abdominal cavity was opened, covered by 1–3 skin layer(s), and imaged by FRI to visualize the liver metastases.
Transfected MeWo cells were fixed in 4% formaldehyde and microscopically analyzed by a Leitz Aristoplan fluorescence microscope (Leitz, Wetzlar, Germany) equipped with a mercury 50-W lamp power supply and following filters A, I3, N3, and Y5 with a spot camera. Both EGFP- and DsRed-expressing cells were either left unstained or have been stained with Hoechst 33258 (Sigma Aldrich) to visualize the nuclei.
Xenograft tumor models
Male severe combined immunodeficiency (SCID)-mice (purchased from Charles River Laboratories, Inc., Cambridge, MA, USA) aged 2–6 months were used (Fig. 2b and c). All procedures were approved by the local institutional animal care and use committee. The animals were individually housed in cages at a temperature of 23℃ ± 2℃, and a light-controlled room (alternating 12-h periods of light and dark) under sterile conditions. Mice were allowed free access to food and deionized water throughout the test period. Mice were anesthetized in an isoflurane chamber before being injected. Stable transfected MeWo cells were used to establish human melanoma tumor models in SCID mice.
The animals were randomly divided into two groups (A and B) (Fig. 2). Each mouse in group A (four mice for each plasmid) was injected subcutaneously into the flanks with 5 × 10⁶ MeWo cells suspended in 5 mL sterile phosphate buffered saline to induce solid xenograft tumors. Their growth kinetics were regularly determined. Three weeks after the inoculation, when the tumors reached diameters of 0.5–0.8 cm, the mice underwent weekly in vivo imaging (see below).
Group B comprised five mice for each plasmid: the animals were injected intravenously (1 × 10⁶ cells) with the transfected cells to induce metastases (Fig. 2). Tumor cells were allowed to engraft for three weeks. Then we started in vivo optical imaging at weekly intervals to visualize metastasis growth.
In vivo and in situ fluorescence reflectance imaging
After three weeks of tumor growth in vivo, mice were imaged weekly up to seven weeks under general anesthesia induced by intraperitoneal injection of 90 µg/g ketamine and 10 µg/g Rompun® (Xylazin). FRI was performed with an AEQUORIA™ Macroscopic Imaging System (Hamamatsu Photonics Systems, Hamamatsu City, Japan) equipped with filters for GFP (excitation maximum 475 nm, emission maximum 509 nm), DsRed (excitation filter HQ 535/50, barrier filter HQ 572 LP), and with a Hamamatsu C5810 three-chip cooled color charge-coupled device (CCCD) camera (Hamamatsu Photonics Systems, Hamamatsu City, Japan).
To quantify penetration of emitted light through the cutis, we compared signal intensities of tumors/metastases that have been measured in vivo with signal intensities of the prepared liver (in situ imaging) after the animals had been euthanized (Fig. 2c).
Analyzes of signal intensities
Digital images obtained by in vivo imaging were saved as bmp (bitmap) files, processed for contrast and brightness, and analyzed using Adobe® Photoshop® 7.0 software (Adobe Systems, San Jose, CA, USA). High-resolution images were captured directly on an IBM PC.
The mean fluorescence intensity (MFI) of the signals was obtained from histograms. The background signal (autofluorescence) was subtracted from the value of the MFI to get the MFIreal value. To compare different signals with each other, we multiplicated MFIreal values with the signal intensities in pixels, and thereby calculated the total signal intensity (sum of the integrals of a signal). The standard signal intensity was set at 100. Later, we calculated the total signal intensities of different fluorescence signals (by dividing by 100). The obtained results enabled the comparison of different signal intensities.
The cutaneous penetration intensity was calculated as follows: signal intensity (in situ) – signal intensity (in vivo). The latter was reduced by cutaneous absorption of light energy.
Results
Expression of EGFP and DsRed in MeWo cells
Fluorescence microscopy revealed bright fluorescence in transfected MeWo cells (Fig. 3) that remained stable through numerous passages. The cells either expressed the EGFP or DsRed protein. Transfection efficacies > 90% could be revealed for both plasmids. Approximately 70% of the cells displayed strong fluorescence. The MFIs of EGFP and DsRed cells were nearly identical.
Fluorescence microscopy imaging of stable transfected MeWo cells. (a) Green fluorescence of EGFP transfected cells; (b) red fluorescence of DsRed transfected cells; (c) cell nuclei stained with Hoechst 332587 of EGFP-transfected cells; and (d) cell nuclei stained with Hoechst 332587 of DsRed-transfected cells. (e) Merging of (a) and (c).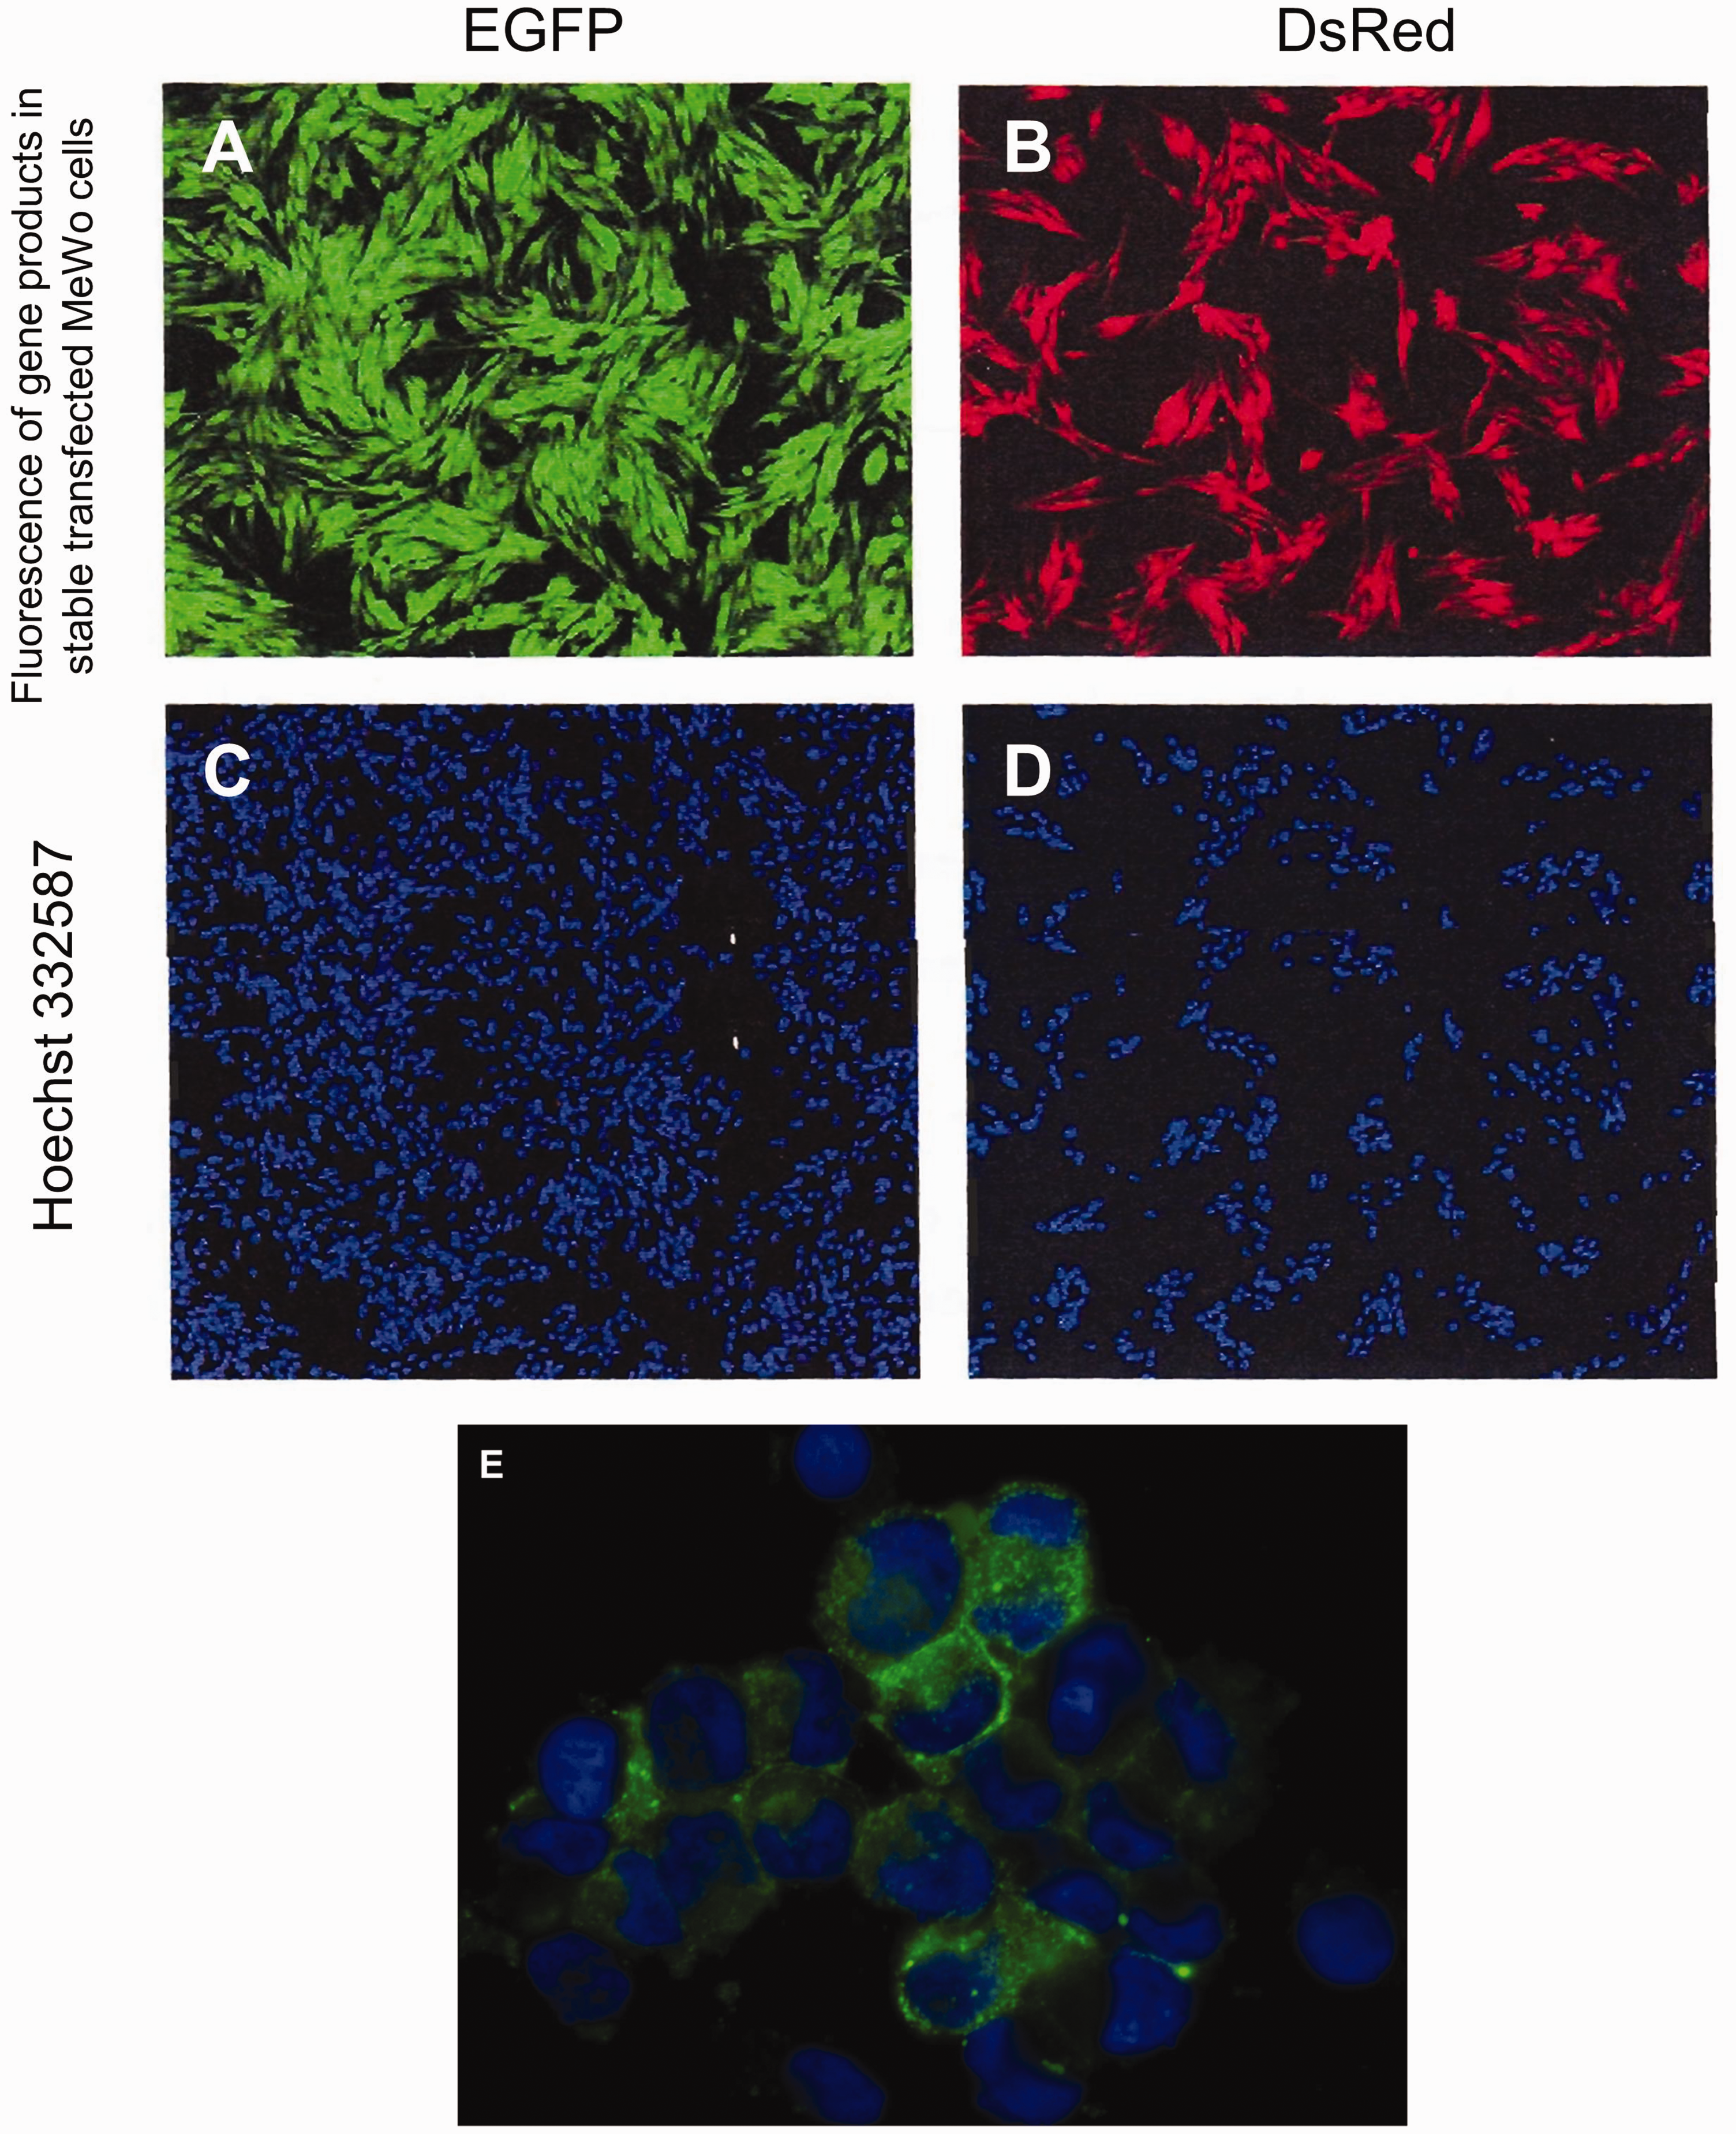
Fluorescence intensities and excitation times
To determine the optimal excitation times for in vivo imaging, we measured fluorescence intensities induced by different excitation times (Fig. 4). Up to an excitation time of 80 ms, red fluorescence intensities were lower than those of the green fluorescence (Fig. 4). Excitation times > 80 ms induced strong red fluorescence intensities. EGFP intensities were lower than those of DsRed at excitation times > 100 ms (Fig. 4). Excitation times > 200 ms did not induce further increase of green fluorescence intensities. For in vivo FRI, we used excitation times of 20, 30, and 50 ms for the delineation of DsRed tumors/metastases and 50, 100, and 500 ms for EGFP xenografts.
Measured signal intensities of EGFP- (▵) or DsRed- (○cf) expressing cells in dependency of different excitation times (in ms) showed an increased signal intensity of DsRed than of EGFP cells.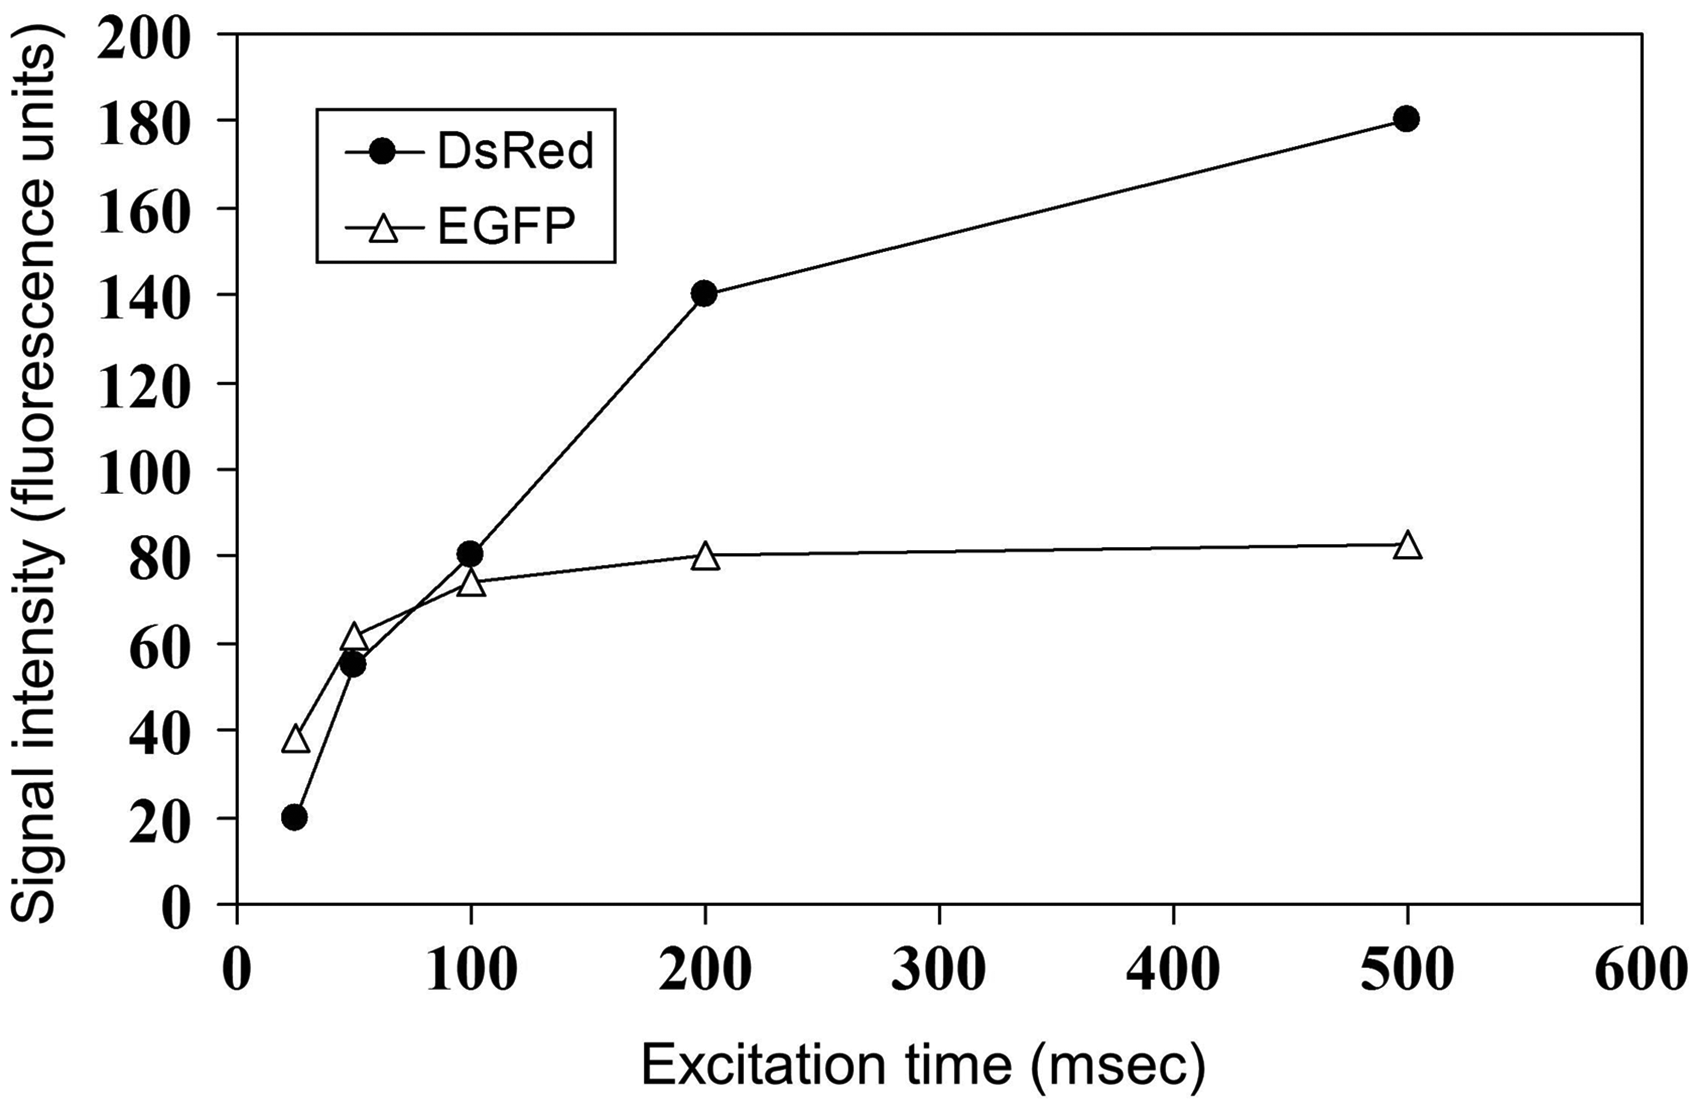
Solid tumor growth characteristics in vivo
To exclude different growth kinetics of EGFP and DsRed tumors in vivo, we analyzed growth behavior of solid MeWo tumors in SCID mice. Following tumor induction, we regularly measured the diameters of the tumors over a period of 23 days (Fig. 5). Seven days after xenotransplantation both tumors had mean diameters of 5 mm. During the follow-up, all tumors enlarged to mean diameters of 13 mm and thereby showed linear tumor growth characteristics. This could be clearly demonstrated by regression analyses. The linear EGFP tumor growth could be expressed as f(x) = 0.52 x + 1.5 and the regression parameter R2 was 0.990. DsRed tumor growth could be expressed as f(x) = 0.53 x + 1.7 and R2 was 0.986.
Tumor growth characteristics in vivo in SCID mice of EGFP- (▵) or DsRed- (○cf) expressing cells displayed an identical behavior.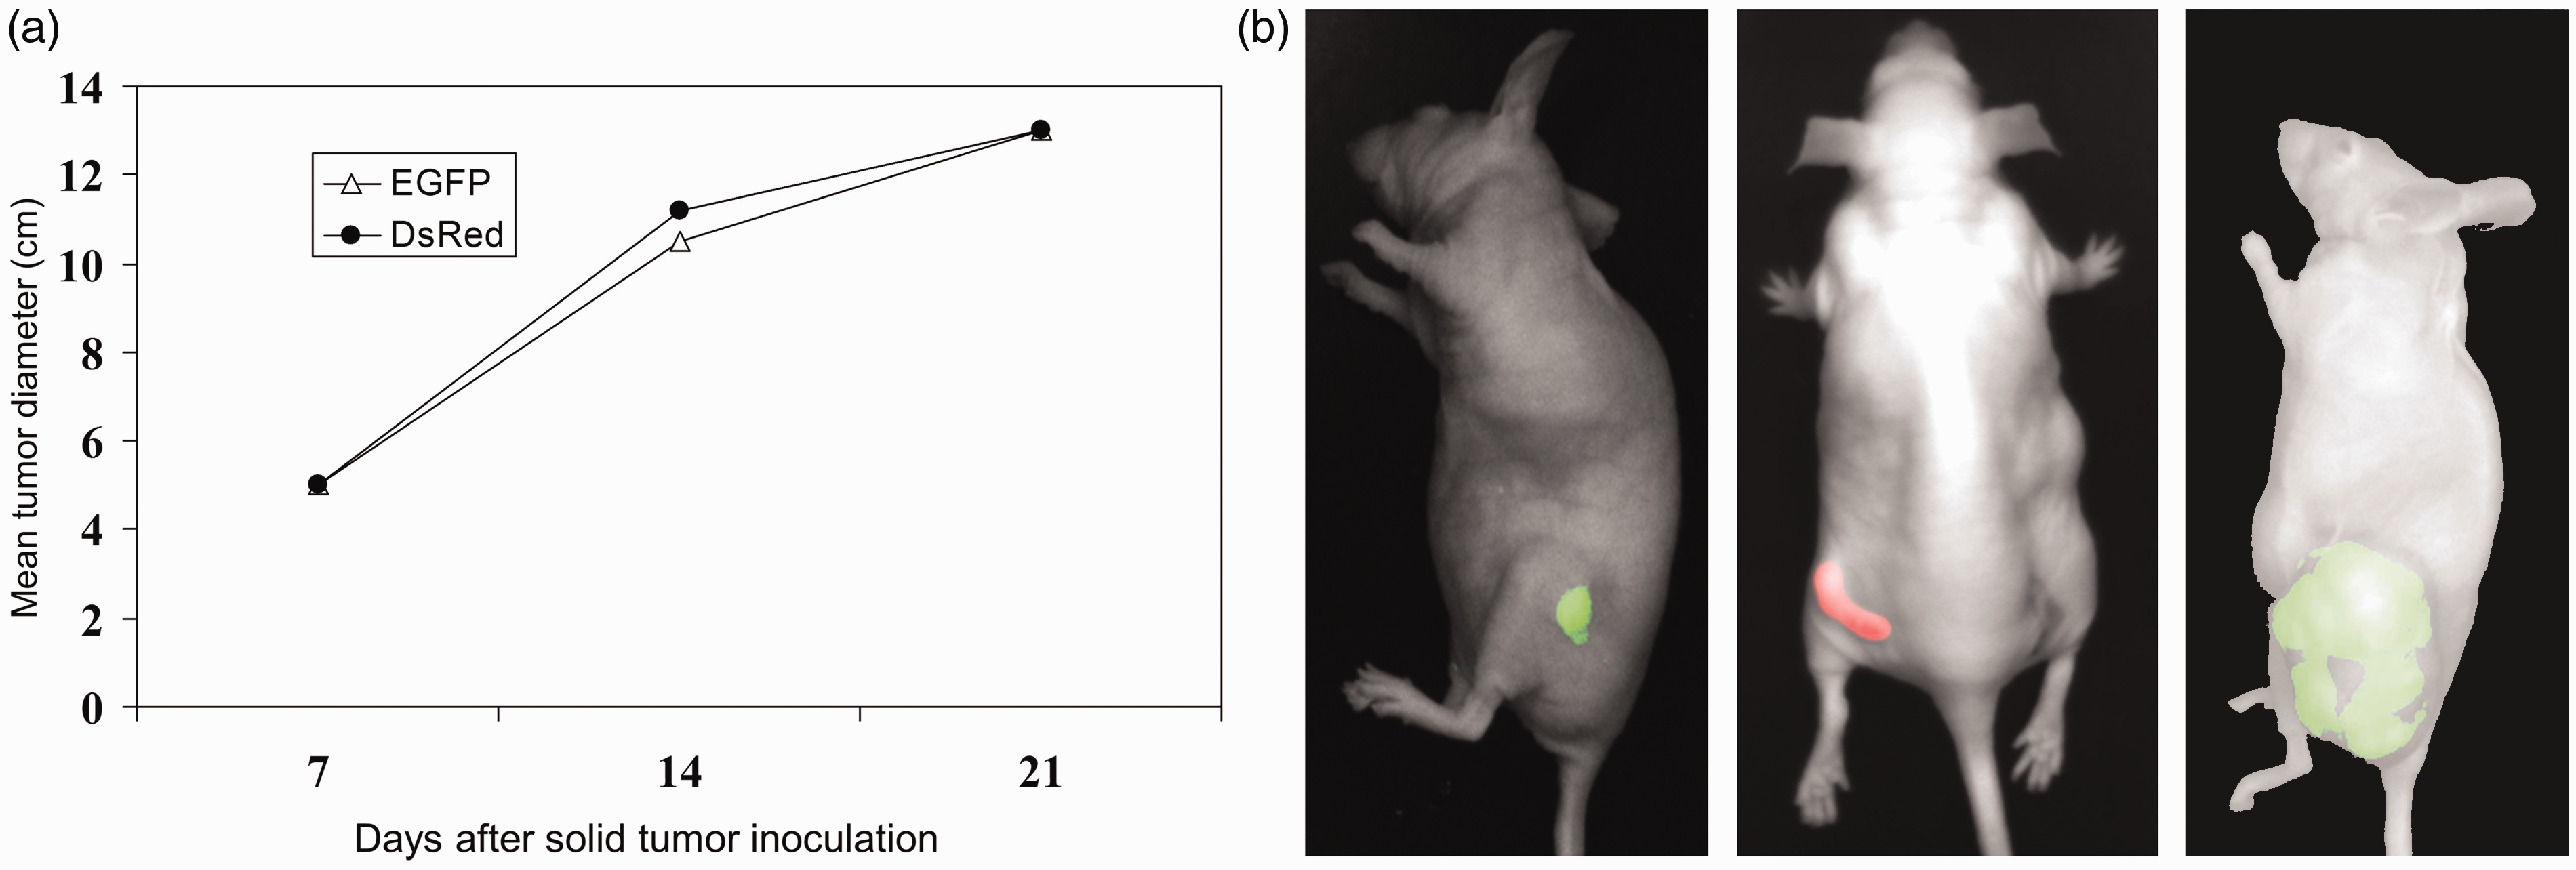
In vivo monitoring of metastases by FRI
Twenty-three days after intravenous tumor cell injection we started FRI of induced metastases. At this time point, we detected a mean number of three signals in DsRed mice but did not find any signals in the EGFP group (Fig. 6). After 30 days, the mean number of visible metastases increased to 20 in the DsRed group. In the EGFP group, the first fluorescence signals (mean = 5) were detectable on day 37 and increased to a mean of 8 on day 42 (Fig. 6). At this time point, DsRed animals had a mean of 48 visible metastases (Fig. 6).
Twenty-one days following tumor cell inoculation, DsRed cell tumors for the first time can be visualized by FRI. The number of DsRed tumor-produced signals (), and the mean diameter of the signals (○cf) is shown. In contrast, both the number of signals (⋄) and their diameters (○) of EGFP-transfected MeWo cells can be detected as early as 38 days after tumor cell inoculation.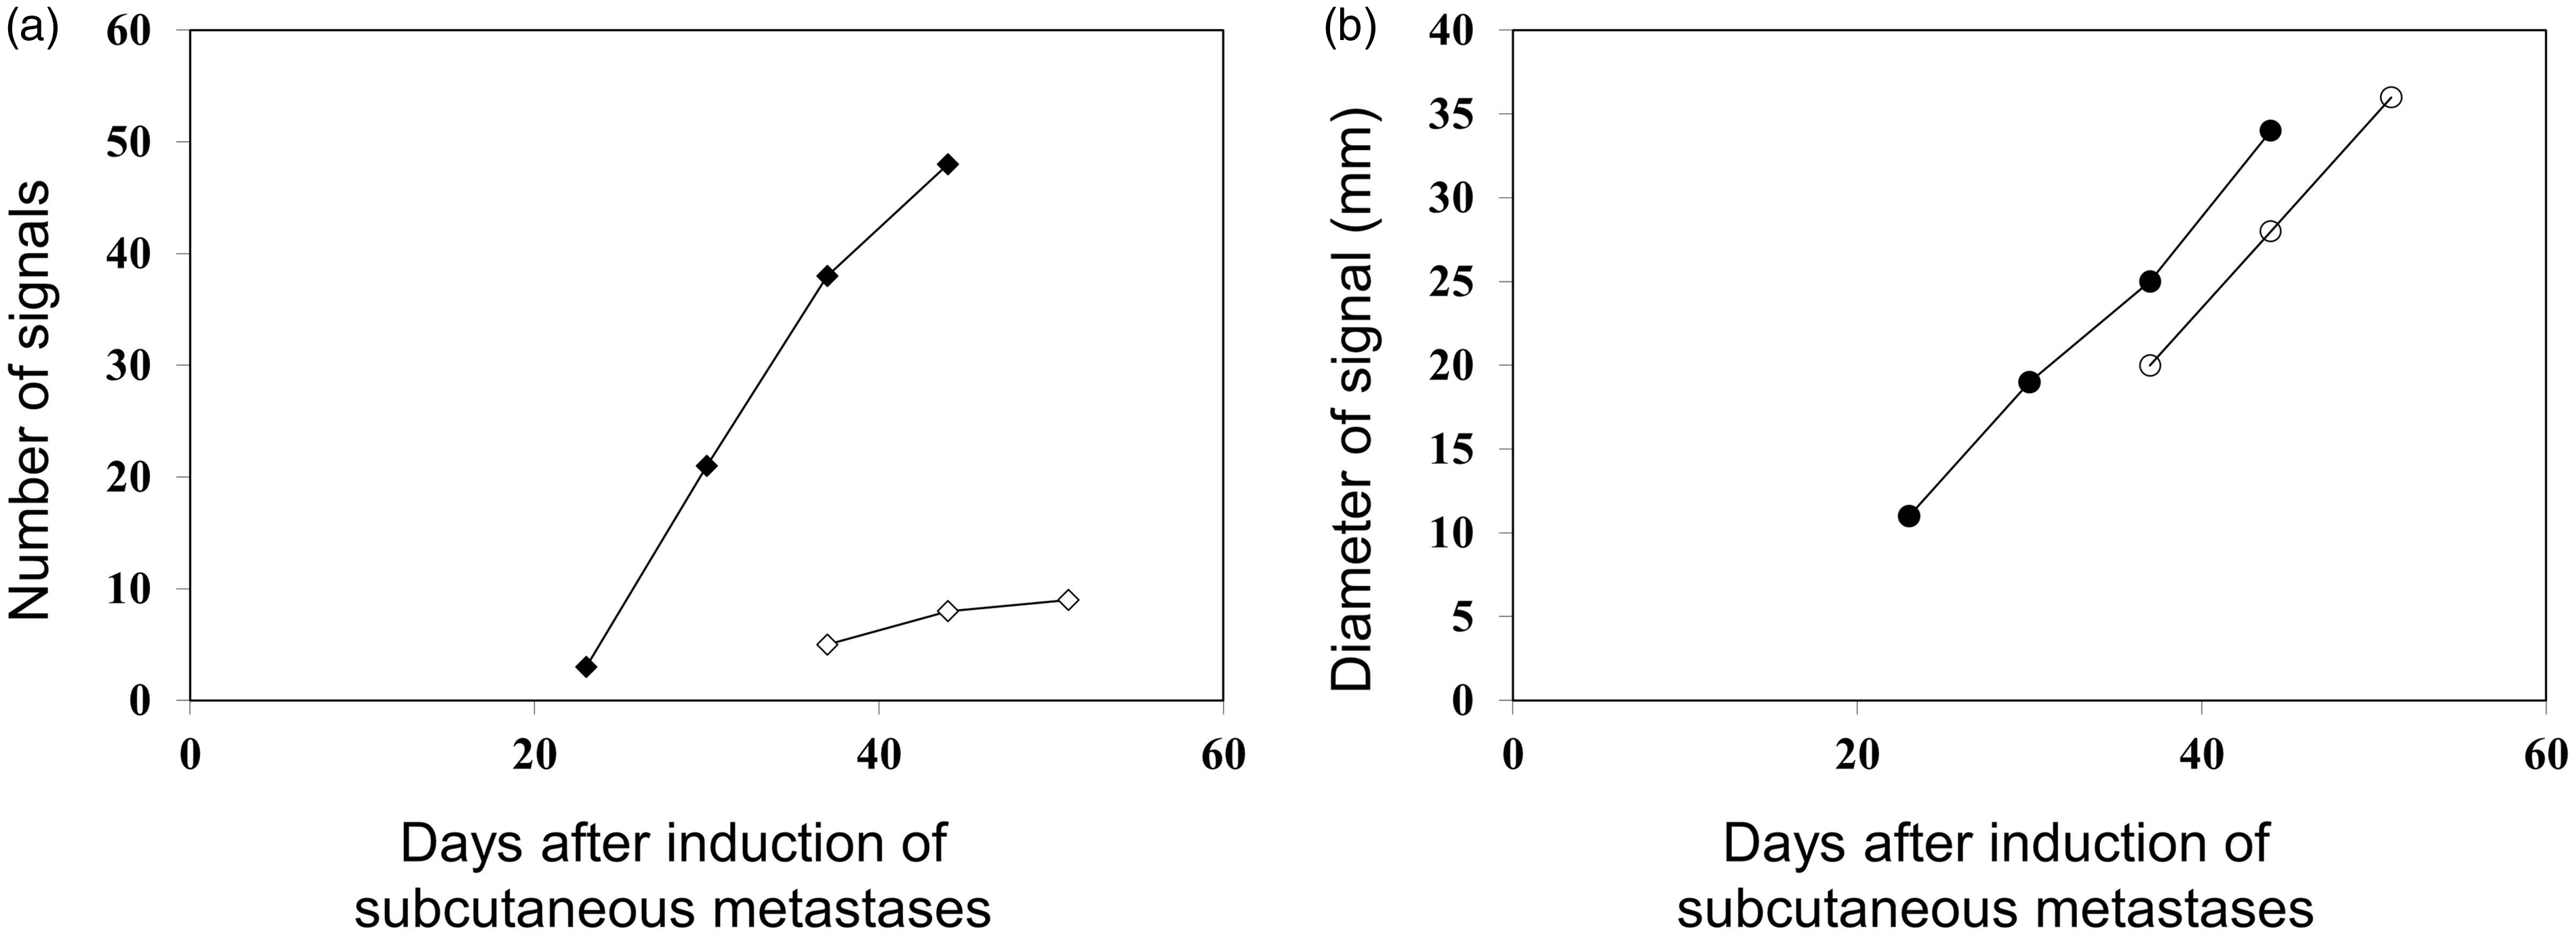
The same was true for liver metastases (Fig. 7). DsRed metastases could be detected earlier (beginning at 21 days after xenotransplantation) by FRI than EGFP metastases (Fig. 8). Moreover, the number of in vivo visible metastases was greater in the DsRed group (Fig. 8).
Scans of a representative SCID mouse with intraperitoneal DsRed metastases in an advanced stage. (a) Day light showed the surface of the mouse including multiple swellings as hint for its intraperitoneal metastases. (b) FRI of DsRed metastases. (c) Merging of (a) and (b). Comparison of the number of detectable liver metastases: in DsRed-SCID mice, metastases could be visualized earlier (first seen 21 days after the induction of metastases) than in EGFP mice (first seen 38 days after the induction of metastases) and displayed a significant increase in the number of detectable metastases.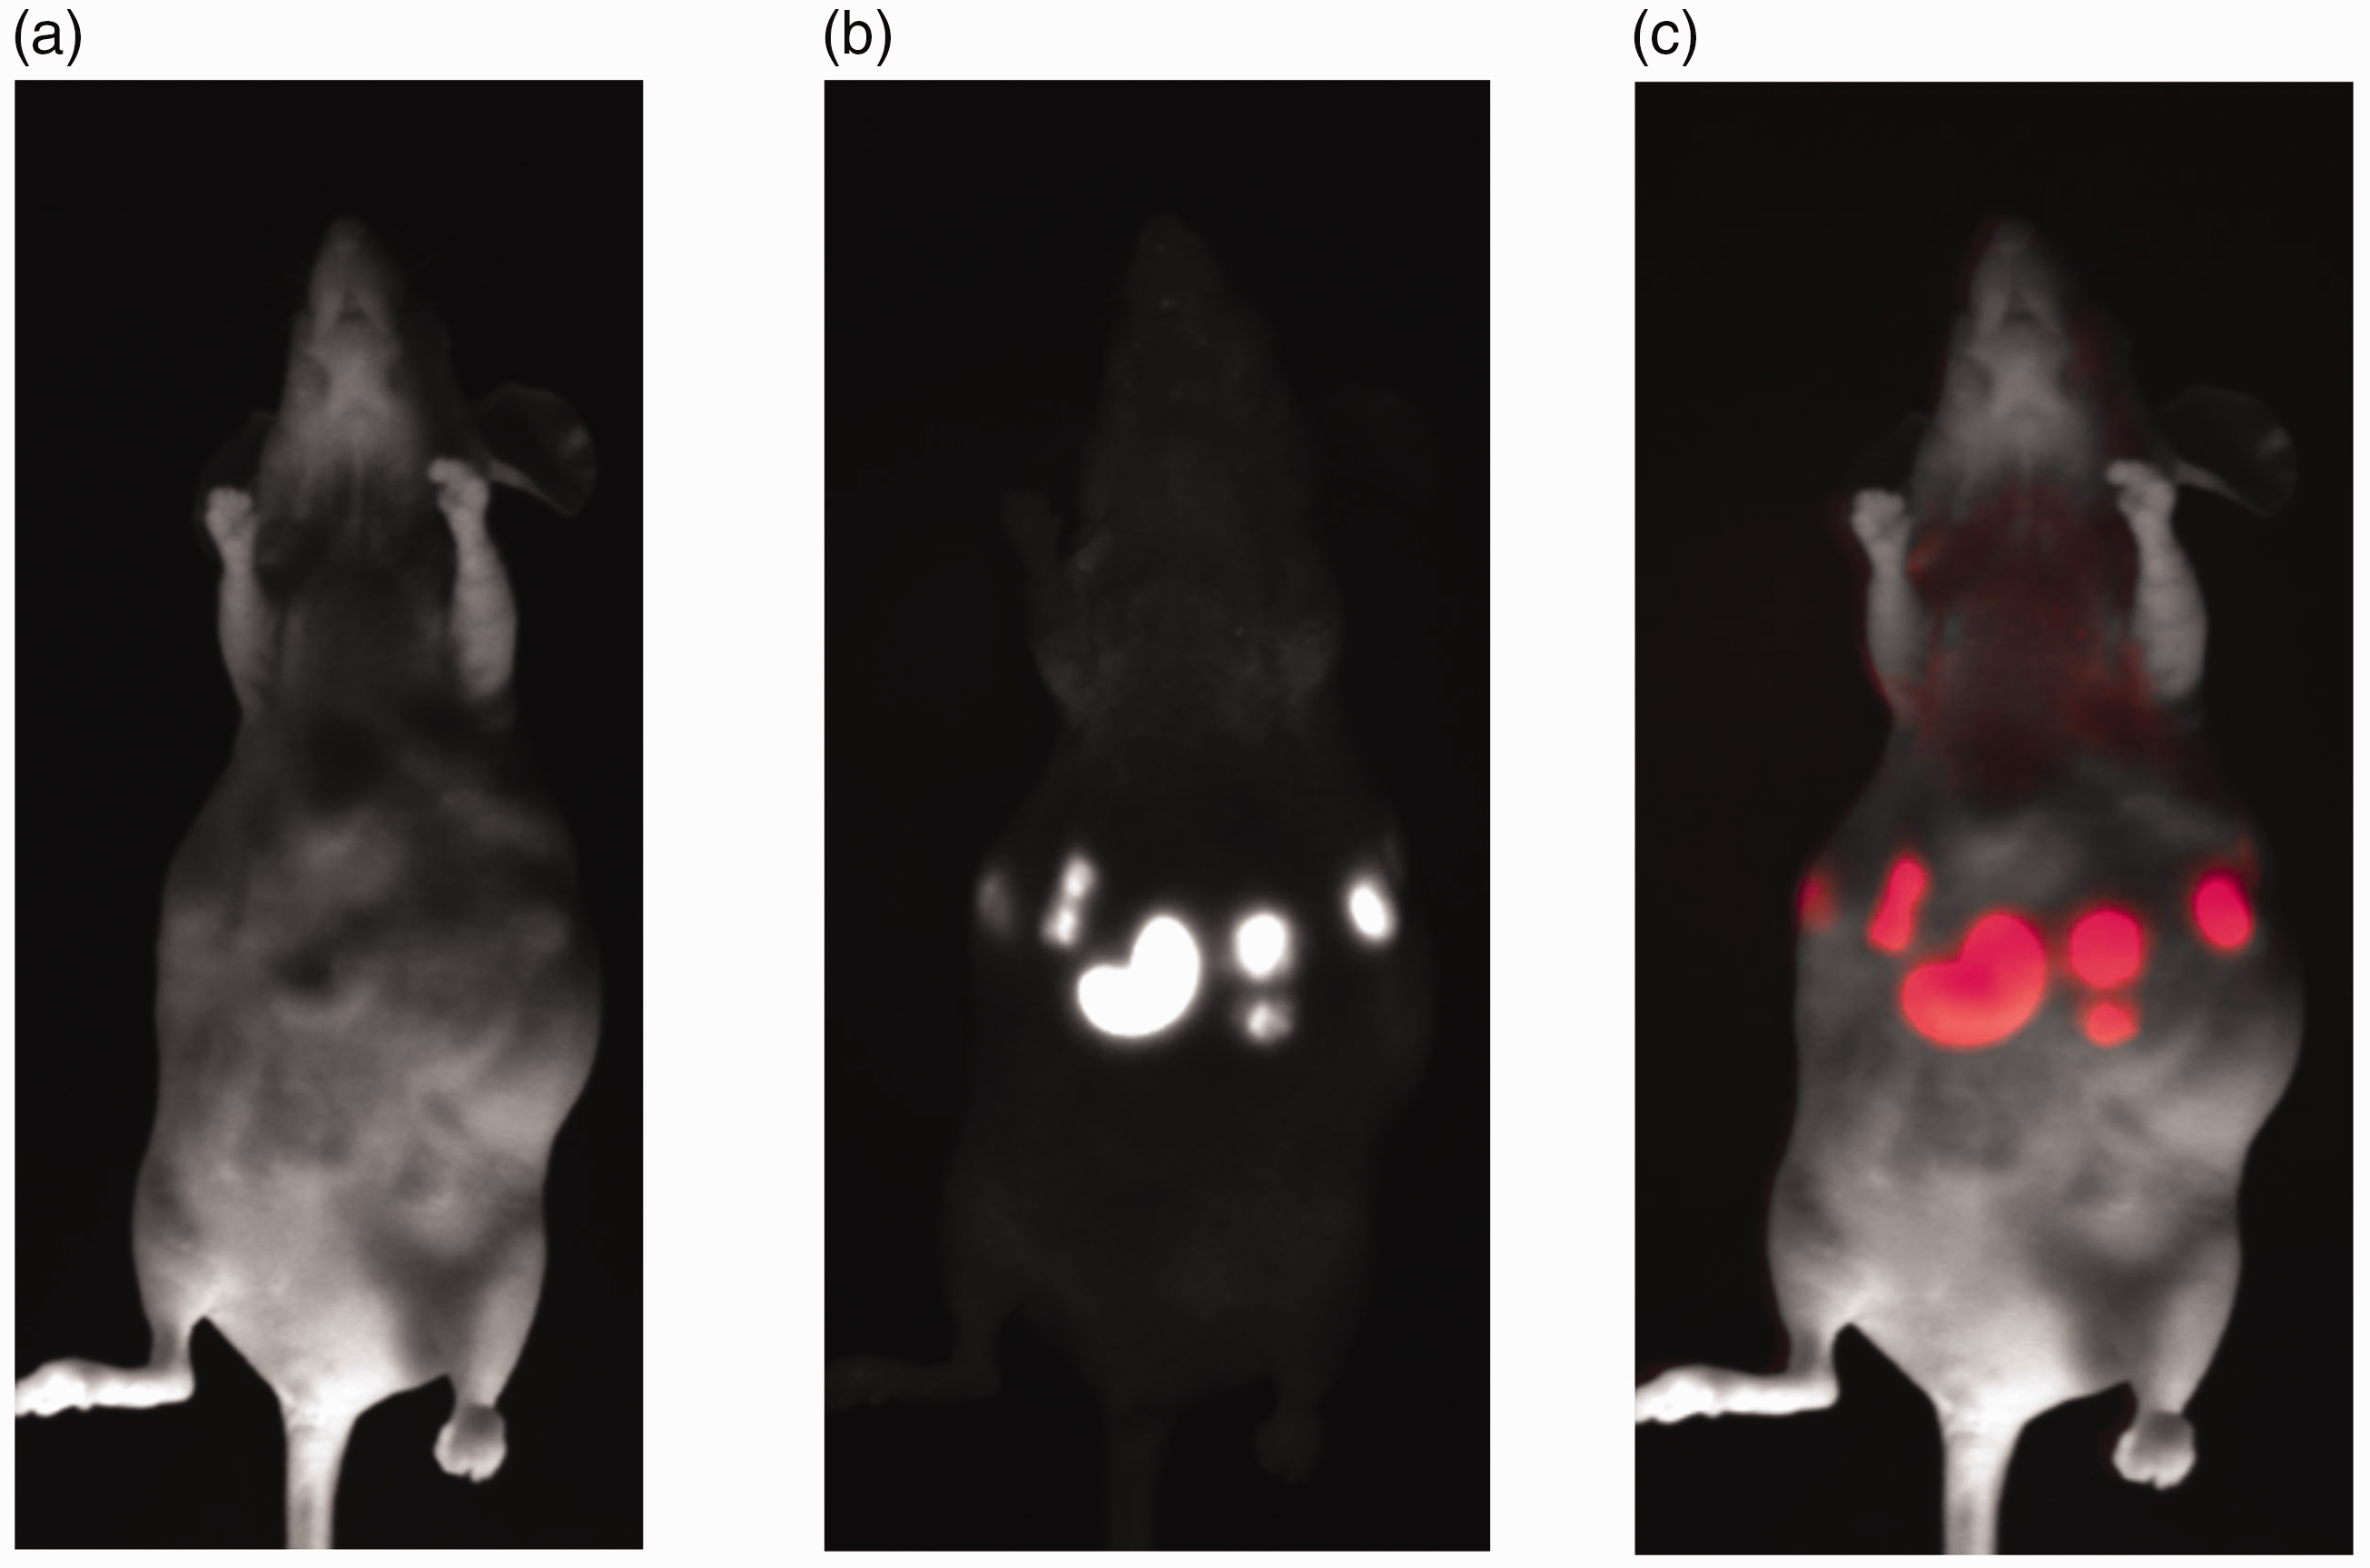

In vivo and in situ imaging of metastases
The next experiments were performed to answer the question of which fluorescent protein is more suitable to study metastasis by FRI. First, we imaged liver metastases in living SCID mice. Later, the animals were euthanized, disemboweled, and imaged again to document the in situ situation (Fig. 9).
Ex vivo/in situ FRI scans of a representative SCID mouse with intraperitoneal DsRed-MeWo metastases in an advanced stage. (a) Day light showed the surface of the internal organs of the mouse including its intraperitoneal metastases. (b) FRI of DsRed metastases. (c) Merging of (a) and (b).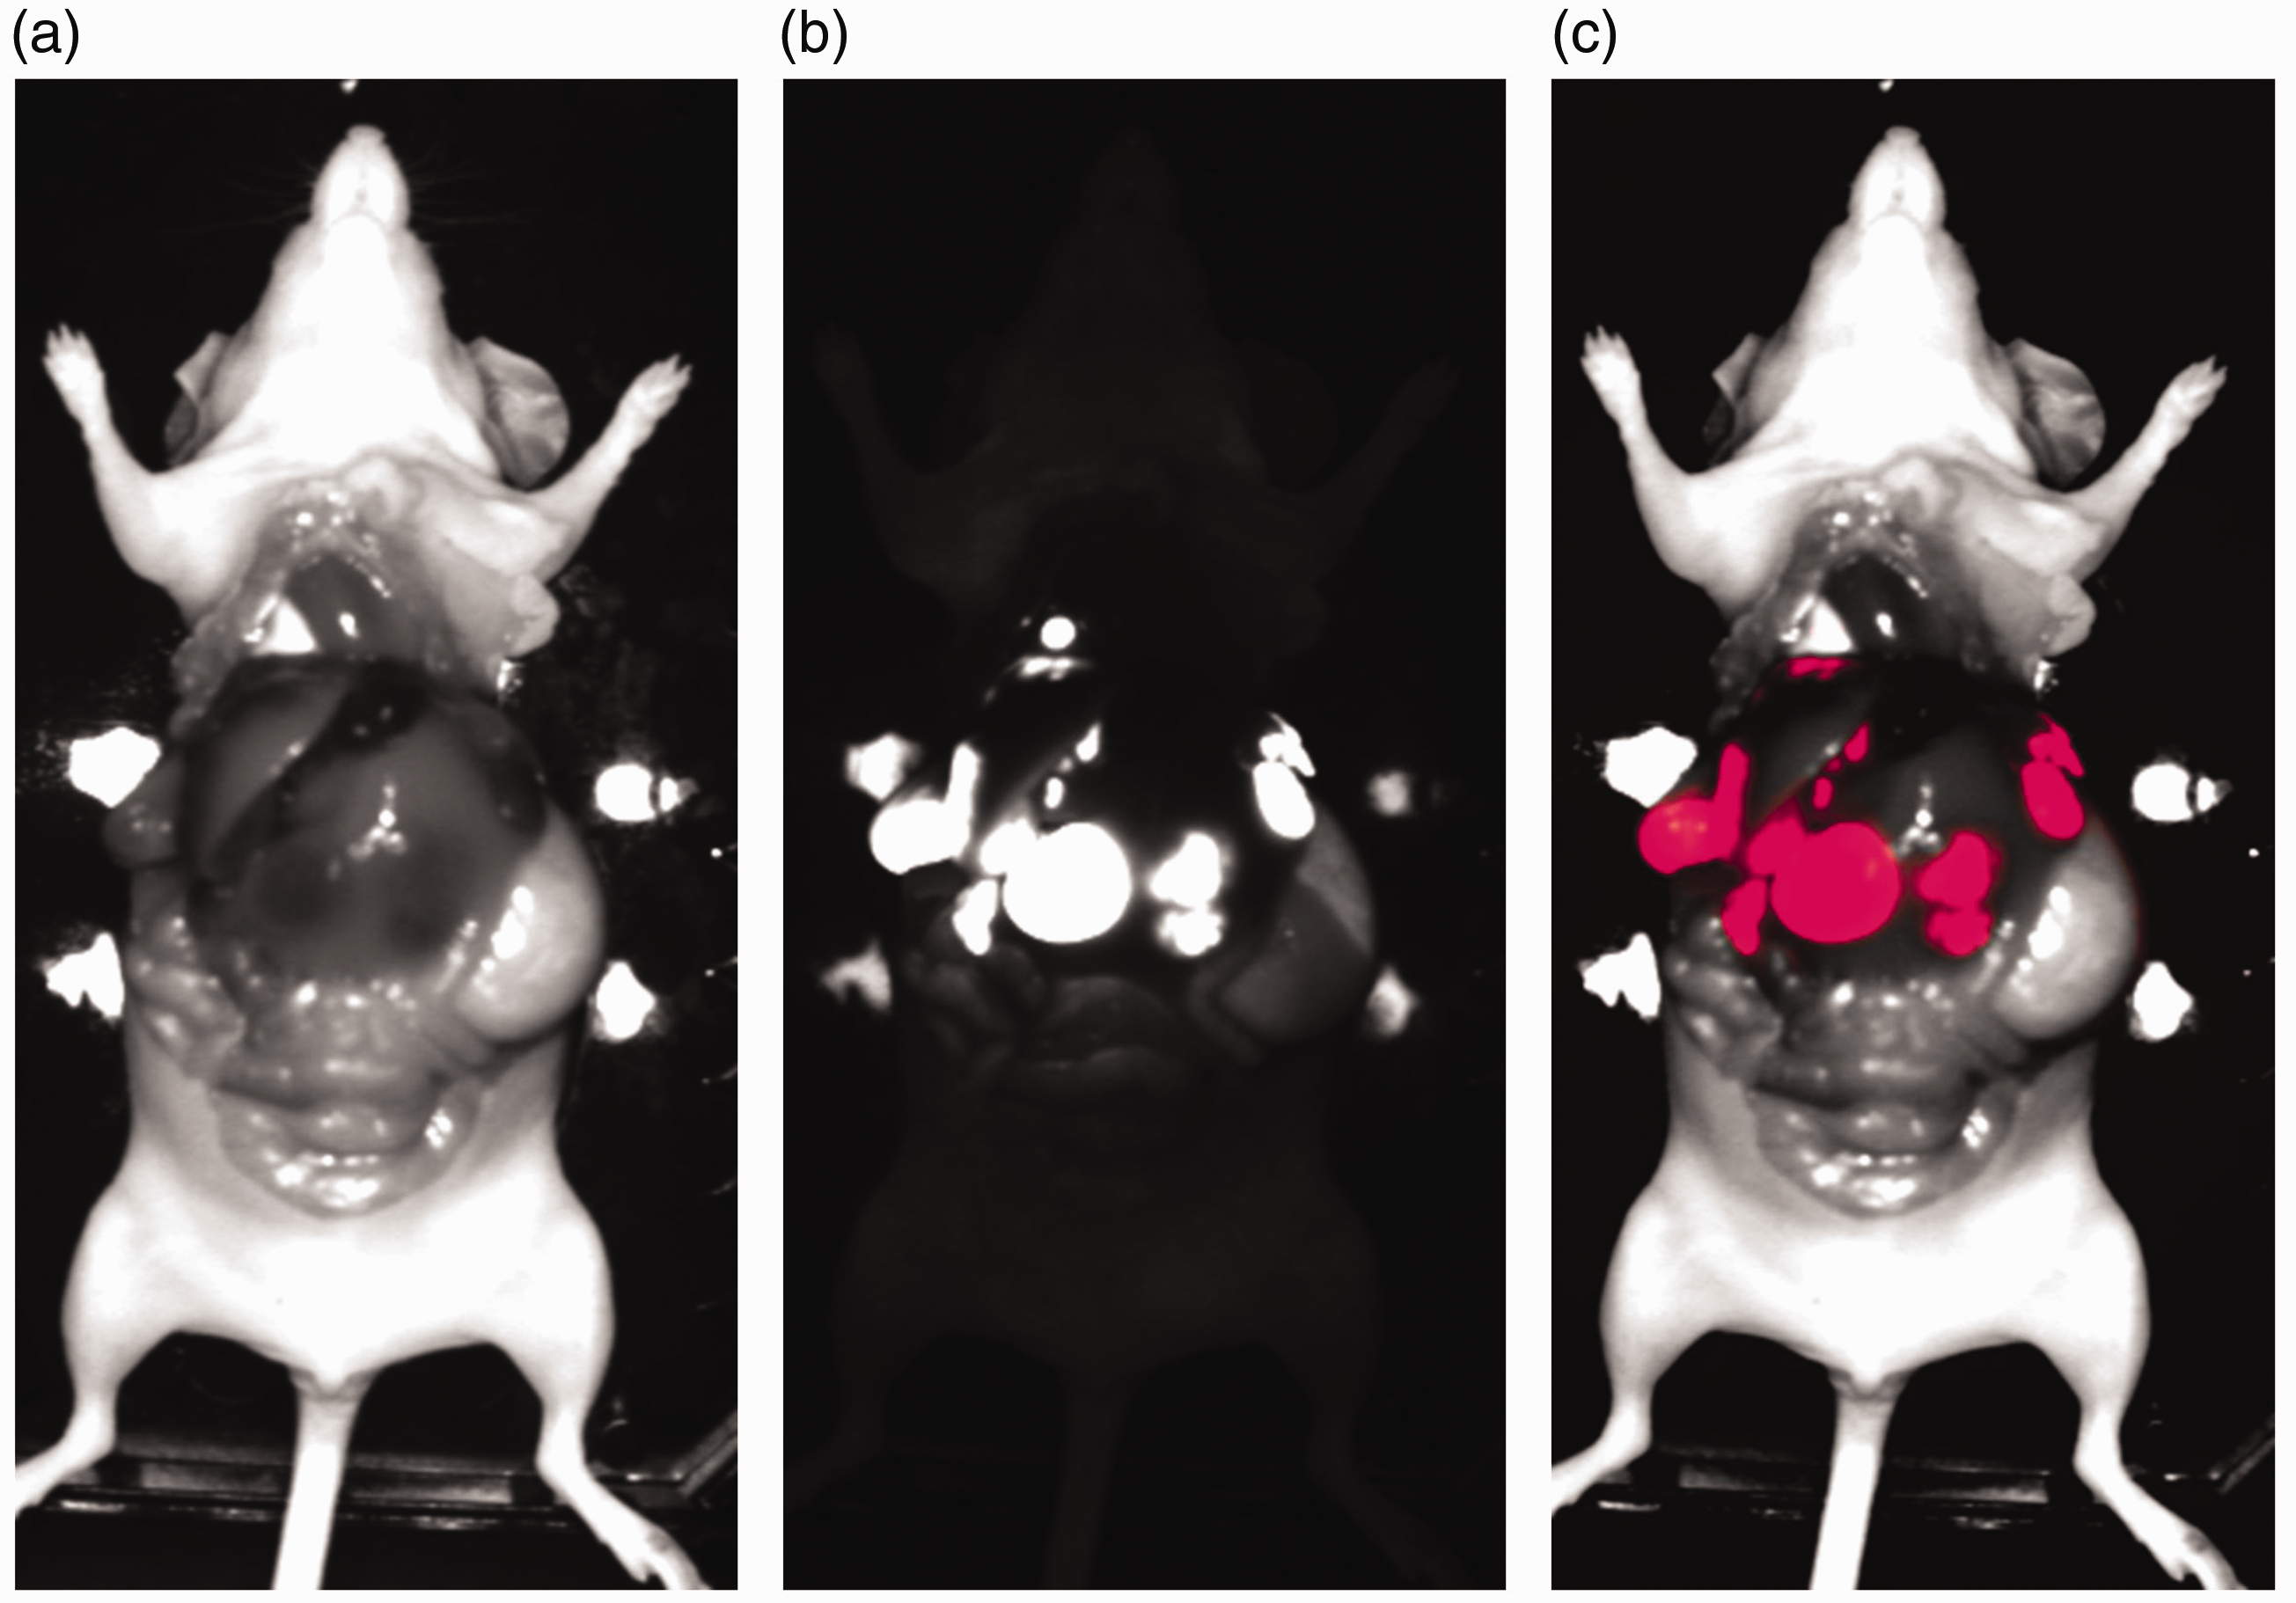
The signal intensities in situ were greater than those measured in vivo. Fig. 10 shows the calculated ratio of the signal intensities obtained in vivo and in situ was much greater for DsRed than for EGFP. Fluorescence intensities of DsRed were significantly stronger (13.8-fold) than of EGFP. DsRed shows in vivo 89% of the in situ signal, whereas EGFP reached only 9%. The absorption of the red light was less than that of the green light. These results clearly show that DsRed MeWo tumors produced a significant stronger fluorescence signal than EGFP tumors.
Ratio of signal intensities measured in vivo/signal intensities measured in situ were significantly increased in DsRed mice than in EGFP mice.
Next, we analyzed the diameters, and areas (cm2) of the FRI signal induced by the metastases in vivo and in situ (cm2). Fluorescence areas produced by DsRed in situ were 5.8-fold greater than areas obtained by in vivo imaging. In contrast, areas produced by in situ EGFP fluorescence were smaller than areas of metastases measured in vivo.
The additional observation—that in tumors with diameters of 1.6 mm, DsRed was 13.8-fold stronger, and in tumors with diameters of 8.4 mm, the difference was 2.8-fold—was due to a detection limitation of the software used.
FRI of subcutaneous tumors and metastases in dependency of their localization (depth)
Depiction of both tumors and metastases by optical imaging is limited to superficial lesions because both exciting light beam and emitted light of the fluorescence proteins must cross the skin layer and subcutaneous fat where most photons are absorbed.
Therefore, the following experimental ex vivo setting has been done to evaluate both the number of existing tumors/metastases and the number of tumors/metastases detected by FRI. We analyzed the minimal detectable tumor diameter in dependency of the distance from the skin surface. Metastases with physical diameters in the range of 0.5–4.7 mm were covered with 1–3 skin layers. Each single skin layer had a thickness of 0.75 mm and absorbed the emitted light of the tumors/metastases. In this setting, we measured the emitted light and found the following: (i) the greater the diameter of the tumor, the greater the intensity of the fluorescence signal; and (ii) one skin layer simulated the in vivo condition of subcutaneous tumors. We detected signals of all metastases covered by one skin layer. A second skin layer reduced the number of detectable tumors/metastases to those with a diameter > 2.3 mm. Finally, the third skin layer further absorbed emitted fluorescence signals, so that we only detected tumors/metastases that were > 3.9 mm in diameter.
Real-time in vivo FRI of lung metastases
The following experiments were carried out to delineate metastases of the lung (Fig. 11). Independent of the expressed fluorescent protein, the animals acquired similar numbers of metastases with nearly identical diameters, so that we could compare both variants.
Representative FR image of (a) a SCID mouse bearing DsRed metastases displaying a low autofluorescence background; single DsRed metastases are visible, especially those with close subcutaneous localization. (b) FRI of a SCID mouse bearing EGFP metastases displaying an intense autofluorescence background, so that single EGFP metastases are not visible.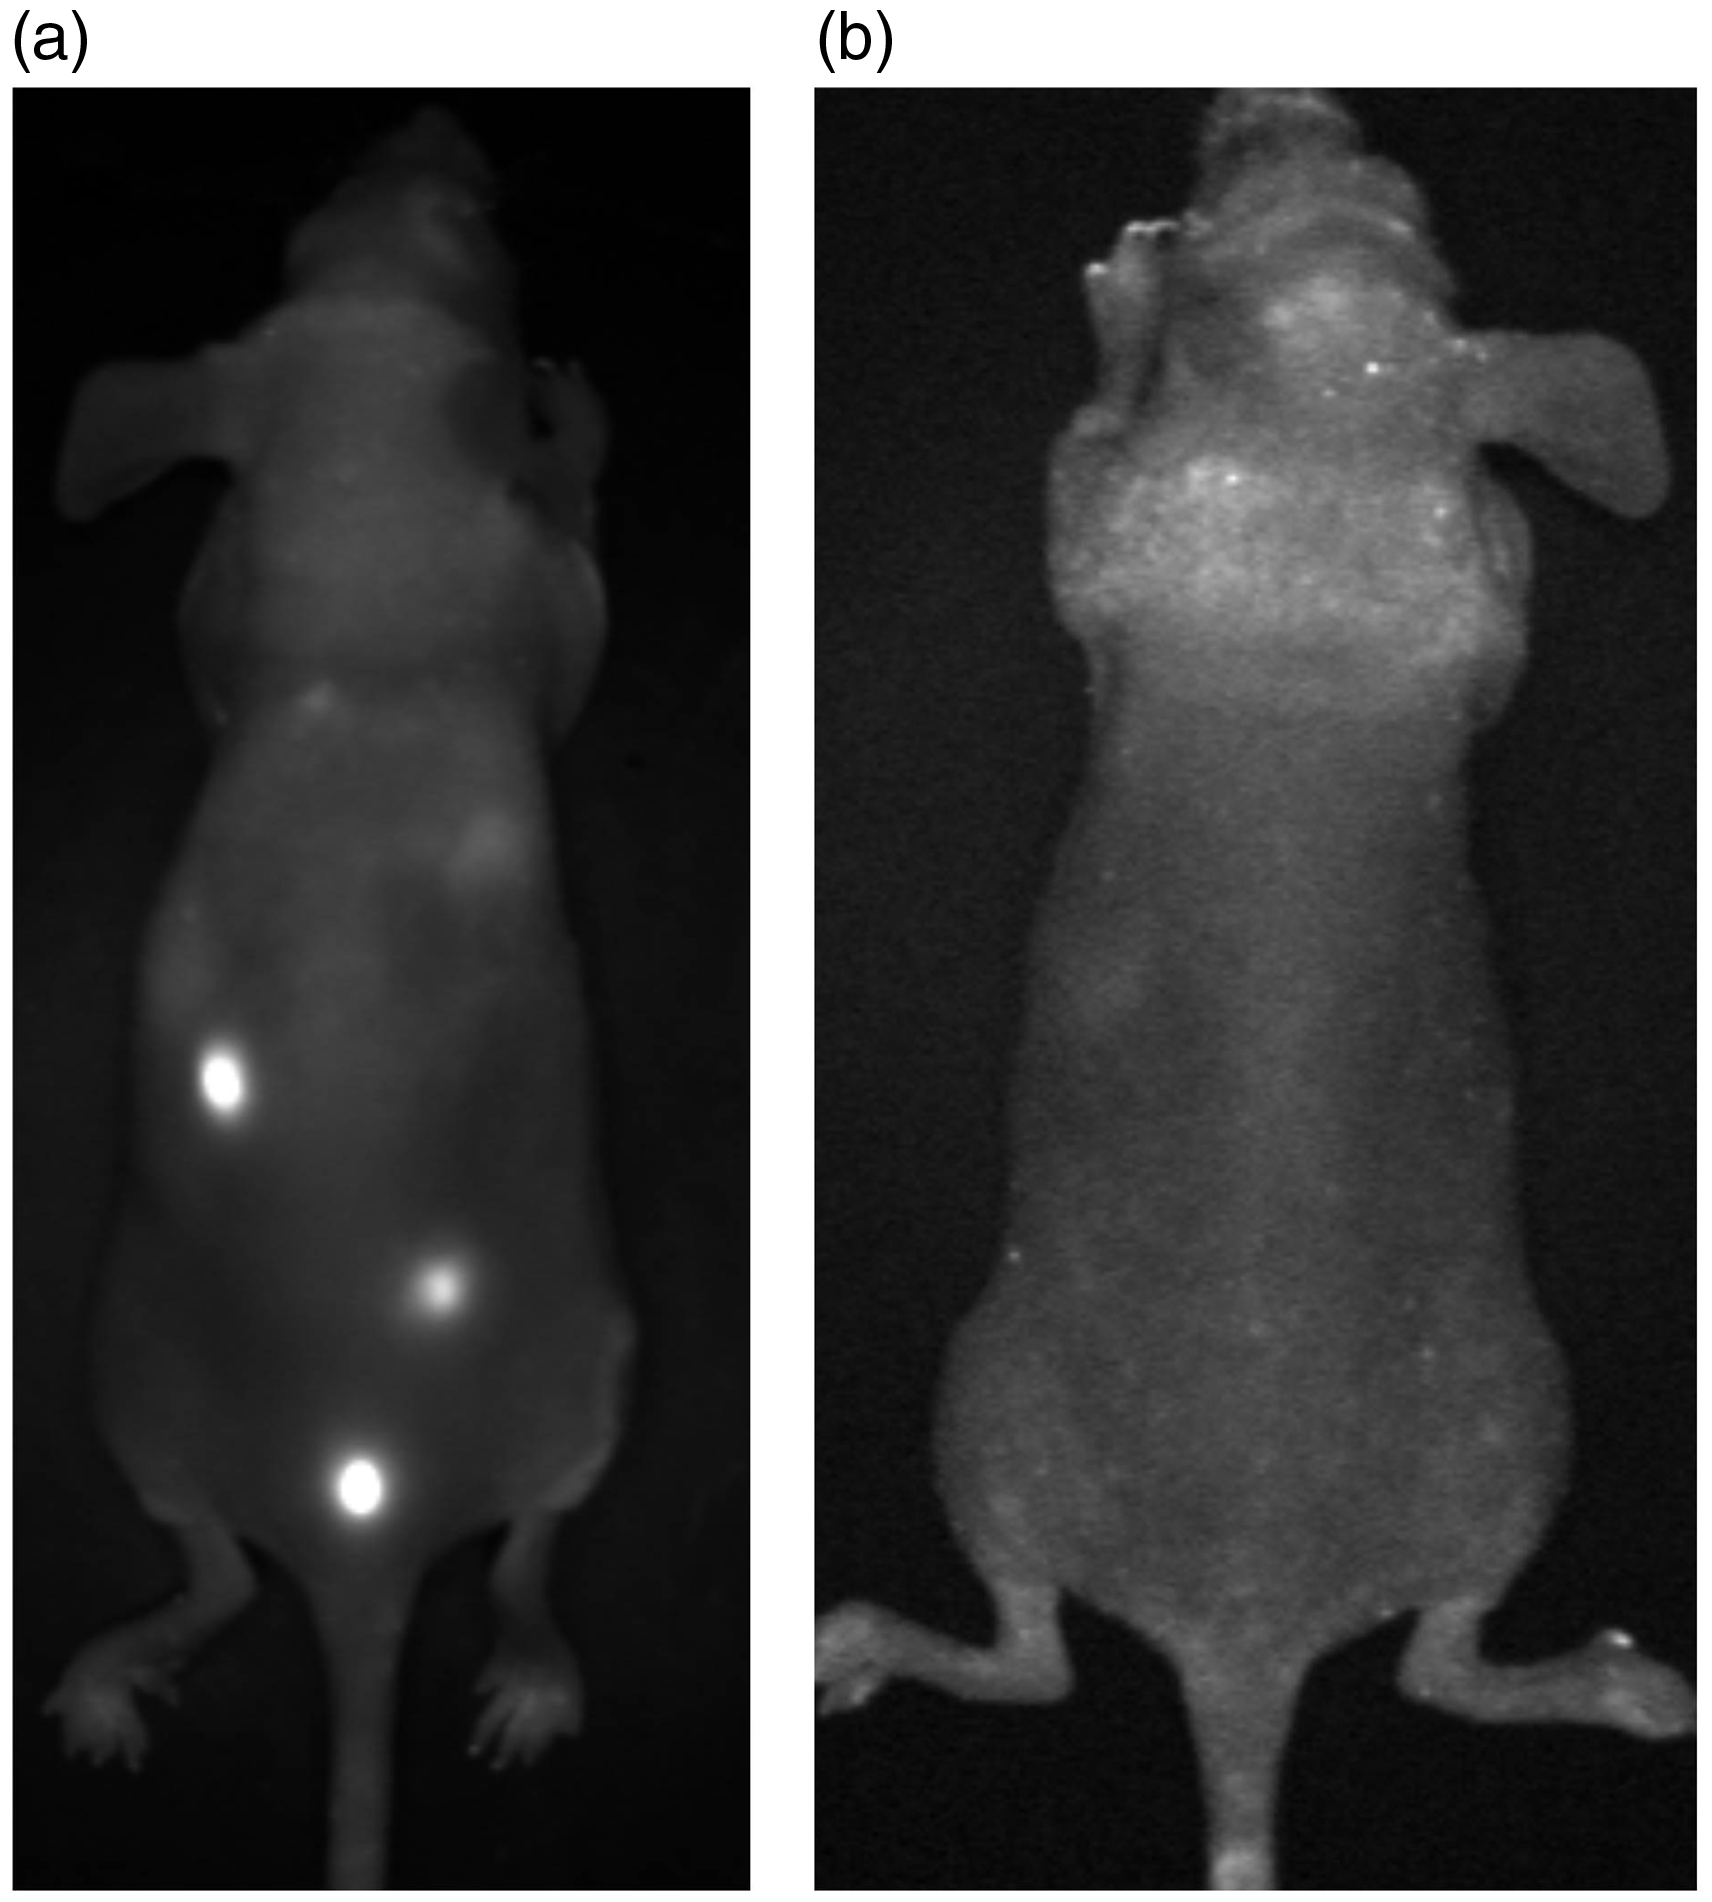
DsRed metastases within the lung could be easily visualized in vivo. In contrast, EGFP metastases could not be detected; we only saw autofluorescence signals of the skin (Fig. 11, right). These results are summarized in Fig. 12 which shows increased fluorescence signals in the DsRed group compared to the EGFP group.
The number of fluorescence signals detectable in EGFP-tumor-bearing mice were significantly less frequent than in DsRed-tumor-bearing mice.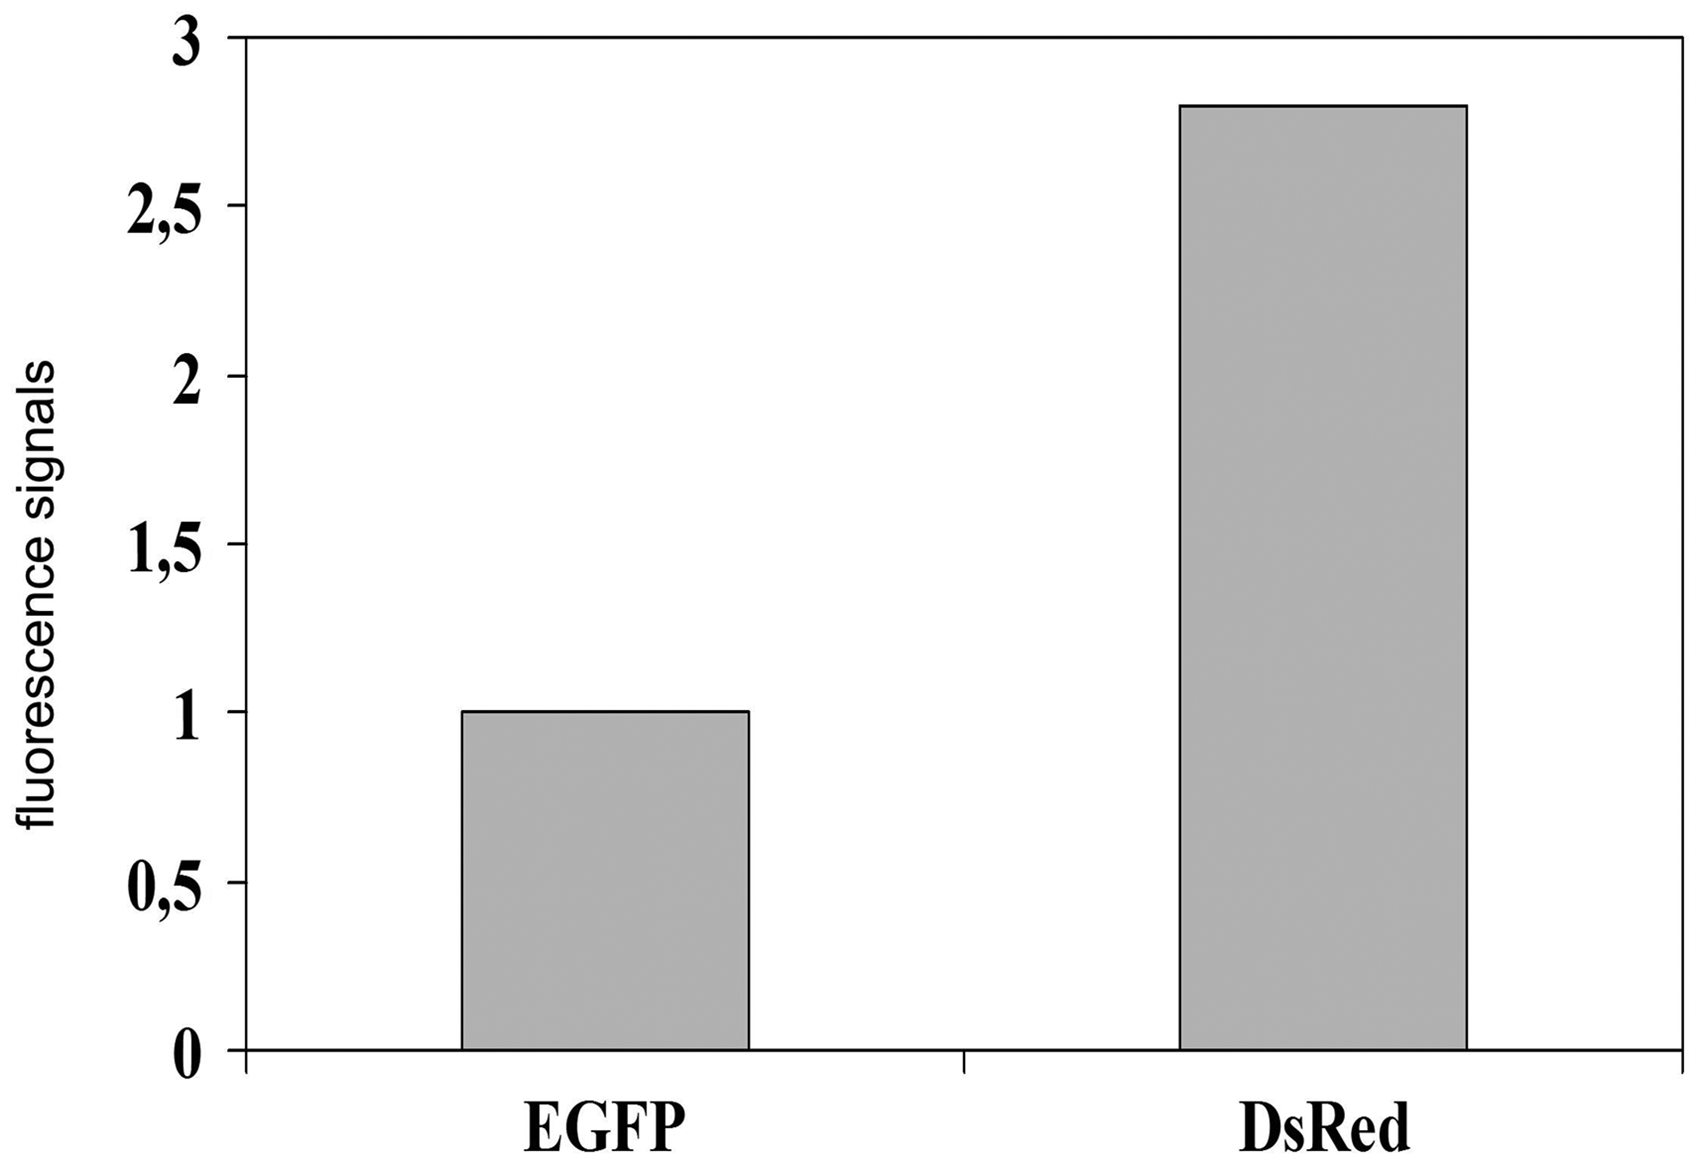
Discussion
The comparison of two fluorescent proteins (EGFP and DsRed) of the GFP superfamily displayed similar results in vitro, but different results in vivo. In living animals, DsRed together with FRI was superior to EGFP. Currently, EGFP is intensely used for different molecular imaging approaches (22–26). Less known, and therefore rarely used, is the red fluorescent protein variant DsRed (Fig. 1). Previously, other researchers comparing the real-time fluorescence imaging system using GFP- and DsRed-tagged metastasis animal models (26) did not focus on differences of the two fluorescent proteins as demonstrated above.
Fluorescence microscopy (in vitro) revealed bright fluorescence in both EGFP- and DsRed-transfected MeWo cells (Fig. 3). Due to the absence of a specific targeting sequence, EGFP and DsRed are located throughout the cytoplasm (28). For in vitro investigations only, both EGFP and DsRed are excellent fluorescent markers (22,26,28–31).
We found that EGFP fluorescence intensities were lower than those of DsRed at excitation times of 100–200 ms (Fig. 4). We decided to use excitation times of 20, 30, and 50 ms for in vivo imaging of DsRed tumors/metastases, and 50, 100, and 500 ms for in vivo imaging of EGFP xenografts.
Other researchers found that the fluorescence lifetimes and spectra of EGFP and DsRed in living cells were the same as in aqueous solutions, which indicates the absence of both aggregation of fluorescent proteins and cellular environmental effects on the protein folding under our experimental conditions (28). The authors also revealed that the oligomer configuration (tetrameric organization) and internal depolarization of DsRed, previously observed in solution, persists upon expression in these cells (28). Therefore, in both cultured cells and embryos, DsRed lifetimes were several-fold longer than those of EGFP (32).
Growth kinetics of EGFP and DsRed cells in SCID mice were identical and linear (Fig. 5). In bacterial cultures it could be demonstrated that DsRed had an extended maturation time and E. coli expressing this fluorescent protein were significantly smaller than those expressing EGFP (33). In aging bacterial cultures, DsRed aggregated within the cells, accompanied by a strong reduction in its fluorescence lifetime (33).
On day 23 following tumor cell inoculation, we could visualize the first metastases: a mean of three signals in DsRed mice but we did not find any signals in EGFP animals (Fig. 6). During the follow-up, visible metastases was always greater in DsRed than in EGFP mice (Fig. 6). These results clearly show that DsRed metastases could be detected earlier than those expressing EGFP (Fig. 6).
The same was true for liver metastases (Fig. 7). DsRed metastases could be visualized earlier (beginning at 21 days after inoculation) by FRI than EGFP metastases (Fig. 8). Moreover, the number of FRI-visible metastases was greater in the DsRed group (Fig. 8).
In previously published models, metastases were visualized in EGFP-expressing tumor cells only without comparison to other fluorescent proteins (34,35). A comparison of different fluorescent proteins is shown in the study of Yamaoka et al. (36; see details below).
The comparison of in vivo and in situ imaging findings of liver metastases showed that DsRed is superior to EGFP (Figs. 9 and 10). All measured parameters (signal intensities, number of visible metastases, and diameter or area produced by the fluorescence of the metastases) were greater in situ than in vivo.
Previously, the comparison between in vivo and in situ (ex vivo) results have been rarely performed and published (36). Yamaoka et al. developed in vivo fluorescence imaging models for human malignant mesothelioma in mice using tumor cells engineered to express different fluorescent proteins including EGFP, mRFP, mCherry, and mPlum (36). They found the best correlation between in vivo and ex vivo results in the mCherry model (36).
Depiction of tumors and metastases by optical imaging is limited to superficial lesions because both exciting light beam and emitted light of the fluorescence proteins are absorbed by the skin layer and subcutaneous fat. We analyzed the minimal detectable tumor diameter in dependency of the distance from the skin surface. The greater the diameter of the tumor, the greater were the intensities of the fluorescence signals. Subcutaneous EGFP tumors with diameters < 1.2 mm could not be visualized while DsRed tumors could be visualized. Thereby, it became evident that EGFP labelling of MeWo tumors is less efficient.
While in very small animals like insects (e.g. pupal stage of Drosophila (37)) or fishes (e.g. larvae of zebra fishes (38)) both EGFP and DsRed can be used for imaging experiments, in mice this cannot be recommended as shown above.
FRI of lung metastases is a challenge, because both excitation light and emitted light waves must pass several anatomical structures and air. In the skin, the natural pigment melanin is mainly responsible for the absorption of photons. In addition to the covering skin layer, light must also penetrate fat tissue and air-filled bronchi, bronchioles, and alveoli, for example. Therefore, previously, lung or pleural tumors/metastases have been rarely imaged by FRI under in vivo conditions (36,39). In addition, other working groups were able to visualize great tumor masses within the lung by bioluminescence, but not by FRI (40,41).
We were able to delineate metastases within the lung by FRI (Fig. 11). Following the induction of similar numbers of metastases with nearly identical diameters in EGFP and DsRed animals, we showed that DsRed-lung metastases could be easily visualized in vivo. EGFP metastases could not be detected; we only saw autofluorescence signals of the skin (Fig. 11, right).
In situ images clearly show the different signal intensities of both fluorescent proteins. Fig. 12 shows fluorescence signals of EGFP- and DsRed-lung metastases. As expected, the signals produced by DsRed were more intense than those produced by EGFP. In both groups, fluorescence signals were more intense after 42 days than after 21 days (Fig. 8).
In conclusion, the herein presented data for the first time show comparisons between two members of the GFP superfamily in a xenograft mouse model to study both tumorigenesis and metastasis in vivo by using real-time optical imaging (FRI). We clearly show that DsRed is superior compared to EGFP for in vivo imaging options. In general, the translation of in vitro methods for in vivo molecular imaging applications needs critical analyses of the used materials and methods, and possibly a special adjustment as in the presented model.
Footnotes
Declaration of Conflicting Interests
The author(s) declared no potential conflicts of interest with respect to the research, authorship, and/or publication of this article.
Funding
The author(s) received no financial support for the research, authorship, and/or publication of this article.