
Abstract
Background
In CT imaging, a high concentration of iodinated contrast media in axillary and subclavian veins after brachial application can cause perivenous artifacts impairing diagnostic assessment of local vascular structures and soft tissue.
Purpose
To investigate reduction of perivenous hypo- and hyperattenuating artifacts of the axillary and subclavian veins using virtual monoenergetic images (VMI) in comparison to conventional CT images (CI), acquired on spectral-detector CT.
Material and Methods
50 spectral-detector CT datasets of patients with perivenous artifacts from contrast media were included in this retrospective, institutional review board-approved study. CT images and virtual monoenergetic images (range 40–200 keV, 10-keV increments) were reconstructed from the same scans. Quantitative analysis was performed by region of interest-based assessment of mean attenuation (HU) and standard deviation in most pronounced hypo- and hyperdense artifacts and artifact-impaired arteries as well as muscle. Visually, artifact reduction, assessment of vessels, and surrounding soft tissue were rated on 5-point Likert-scales by two radiologists.
Results
In comparison to CT images, virtual monoenergetic images of ≥90 keV showed a significant reduction of hypo- and hyperattenuating artifacts (hypodense: CI -220.0±171.2 HU; VMI130keV -13.4±49.1 HU; hyperdense: CI 274.6±184.4 HU; VMI130keV 24.2±84.9 HU; P<0.001). Subjective analysis confirmed that virtual-monoenergetic images of ≥100 keV significantly reduced artifacts (hypodense: CI 2[1–3]; VMI130keV 5[4–5], hyperdense: CI 2[1–4]; VMI130keV 5[5–5], P<0.001) and improved diagnostic assessment. Best results for diagnostic assessment were noted for virtual monoenergetic images at 130 keV. Overcorrection of artifacts was observed at higher keV values. Interrater agreement was excellent for each evaluation and keV value (intraclass correlation coefficient 0.89).
Conclusion
Higher keV virtual monoenergetic images yielded significant reduction of contrast media artifacts and led to improved assessment of vessels and surrounding soft tissue. Recommended keV values for best diagnostic assessment are in the range of 100–160 keV.
Introduction
Fast image acquisition as enabled by multidetector computed tomography (CT) requires adequate and optimized contrast media (CM) injection protocols (1). High CM concentration is required for multiple clinical indications, such as angiographies, detection of hypervascular liver lesions, and parenchymal depiction; however, high CM concentrations can lead to severe perivenous hypo- and hyperattenuating artifacts (1–4). When brachial injection is used, these artifacts typically arise around the junction of the axillary and subclavian veins impairing diagnostic assessment of local vascular structures and adjacent soft tissue (e.g. muscle, fat, and lymph nodes). In staging and restaging examinations, this is important as soft tissue and lymph node metastases as well as vascular involvement need to be detected or vessel pathologies must be evaluated. Breast cancer patients are specially affected as the evaluation of the chest wall and axilla has high relevance in these patients due to the primary location of the cancer and its metastatic pathway (5,6). Strategies to reduce these perivenous artifacts comprise limiting CM concentration and flow rate; however, these may result in worsened image quality (1,2,4). Optimization of injection protocols, such as applying a saline flush can be used to lower CM concentration in the axillary and subclavian veins for acquisition. Nevertheless, several reasons might prevent sufficient administration: accidental extravasation; suboptimal intravenous access or other pathological venous conditions; and technical difficulties (1,2,4,7).
In CT imaging, materials with high densities, such as high concentration of CM or metal implants lead to three different types of artifacts (1,2,4,8): beam-hardening, low energy photons are absorbed (9); photon starvation, all photons are completely absorbed (9); and scatter artifacts, resulting from greater differences of attenuation of artificial materials (e.g. CM, metal implants) and adjacent soft tissue (8).
Virtual monoenergetic images (VMI) from dual-energy CT (DECT) offer an effective method for artifact reduction from external highly attenuating material, such as CM and metal implants, as VMI with higher keV values are less susceptible for beam hardening (10–13). Separate detection of low- and high-energy photons allow extrapolation of VMI corresponding to images which would result from true monoenergetic x-ray acquisitions. At present, there are four clinical available tube-based dual-energy techniques: dual-spin; dual-source; split- or twin-beam; and kVp-switching. Spectral-detector CT (SDCT) is the only clinically available detector-based variant. It applies a single X-ray source and a corresponding dual-layer detector. The upper layer detects low-energetic photons while the lower layer absorbs high-energetic photons. Low- and high-energetic datasets are therefore accurately matched temporally and spatially allowing for image reconstruction in the projection domain which is not possible for all emission-based dual-energy solutions (10,13,14).
Several studies have already shown the potential of high-keV VMI from DECT for metal artifact reduction; however, available data on using this approach for artifacts from CM are limited (3,15,16). Therefore, this study investigates the effectiveness of VMI from SDCT to reduce artifacts from CM in the axillary and subclavian veins.
Material and Methods
The local institutional review board approved this retrospective study. It was in accordance with the Health Insurance Portability and Accountability Act and informed written consent was waived under Code of Federal Regulations (title 45, §46.116d). In a first step, 346 thoracoabdominal staging and restaging SDCT scans (IQon, Philips, Cleveland, OH, USA) in portal-venous and supine head-first position conducted between May 2017 and April 2018 were identified. To be included in the final analysis, the following additional criteria were applied: (i) age ≥18 years; and (ii) axillary and subclavian hypo- and hyperattenuating artifacts (impairing diagnostic assessment) in conventional CT images due to concentrated CM. Following these criteria, 50 patients were eligible for study inclusion. The criteria were applied by a radiologist with three years of experience in oncologic imaging.
Imaging protocol
Iodinated CM (Optiray 350, Guerbet, Bloomington, IN, USA) was adapted to the body weight (1.5 mL/kg, maximum amount of CM injected was set to 140 mL) and applied through an antecubital vein with a flow rate of 1.5–2.0 mL/s. Image acquisition began 70 s after CM application. Scan parameters were set as follows: collimation = 64 × 0.625 mm; rotation time = 0.33 s; pitch = 0.98; matrix = 512 × 512. Tube voltage was 120 kVp and automatic tube current modulation was applied (DoseRight 3D-DOM, Philips Healthcare, Cleveland, OH, USA). The CT dose index (CTDIvol) and dose length product (DLP) were copied from radiation dose reports, resulting in a mean of 12.2 ± 6.1 mGy for CTDIvol and 871.2 ± 441.5 mGy*cm for DLP.
A dedicated spectral reconstruction algorithm was used enabling reconstruction of conventional CT images (CI; corresponding to images reconstructed with the vendor’s routine hybrid-iterative reconstruction algorithm, that allows for reduction of radiation dose while maintaining image quality [iDose 4, level 3], (17,18)) and VMI in the range of 40–200 keV with increments of 10 keV (Spectral B, level 3, Philips Healthcare, Cleveland, OH, USA). All images were reconstructed with a slice thickness of 3 mm.
Objective analysis
Image assessment was carried out by one radiologist with three years of experience in oncologic imaging using regions of interest (ROI) with a defined size of 100 mm2. ROI size could possibly be reduced to avoid unrepresentative tissue/areas. ROI placement was applied in CI and then copied to VMI using vendor proprietary image viewer (IntelliSpace Portal v9, Philips Healthcare, Cleveland, OH, USA). ROI were placed in most pronounced (strongest) hypo- and hyperdense artifacts as well as corresponding artifact-free reference tissue (e.g. when the hypodense artifact impaired fat the according reference tissue was artifact-free fat; this was applied for each artifact individually). Further, ROI were drawn in adjacent artery and muscle with presence of artifacts as well as corresponding artifact-free reference tissue. Both mean and standard deviation (SD) of attenuation (HU) were measured. SD within artifacts impairing artery and muscle were considered representative for image noise and indicative of artifact burden (19).
To account for changes in HU values that appear along different keV values in VMI (13) (e.g. at higher keV values attenuation of muscle as well as arteries decreases and attenuation of fat increases), as applied before (16), we calculated the corrected attenuation as the difference between HU values in soft tissue (hypo- and hyperdense artifact, axillary/subclavian artery, muscle) with presence of artifacts and corresponding artifact-free reference. To correct for general lower image noise in high keV reconstructions, as applied before (16,20), we calculated the corrected image noise as the difference between image noise in soft tissue with presence of artifacts and corresponding artifact-free reference tissue.
Visual analysis
Visually, two board-certified fellowship-trained radiologists evaluated the extent of hypo- and hyperdense artifact reduction, diagnostic assessment of axillary and subclavian vessels, as well as surrounding soft tissue on 5-point Likert-scales. Further, appearance of overcorrection or new artifacts was rated on a tertiary scale by the two readers. More detailed information is given in Table 1. Additionally, both readers reported the optimal keV values for diagnostic assessment (artifact extent versus introduction of new artifacts and loss of soft tissue contrast, which appear at higher keV values (13,16)).
Visual analysis.
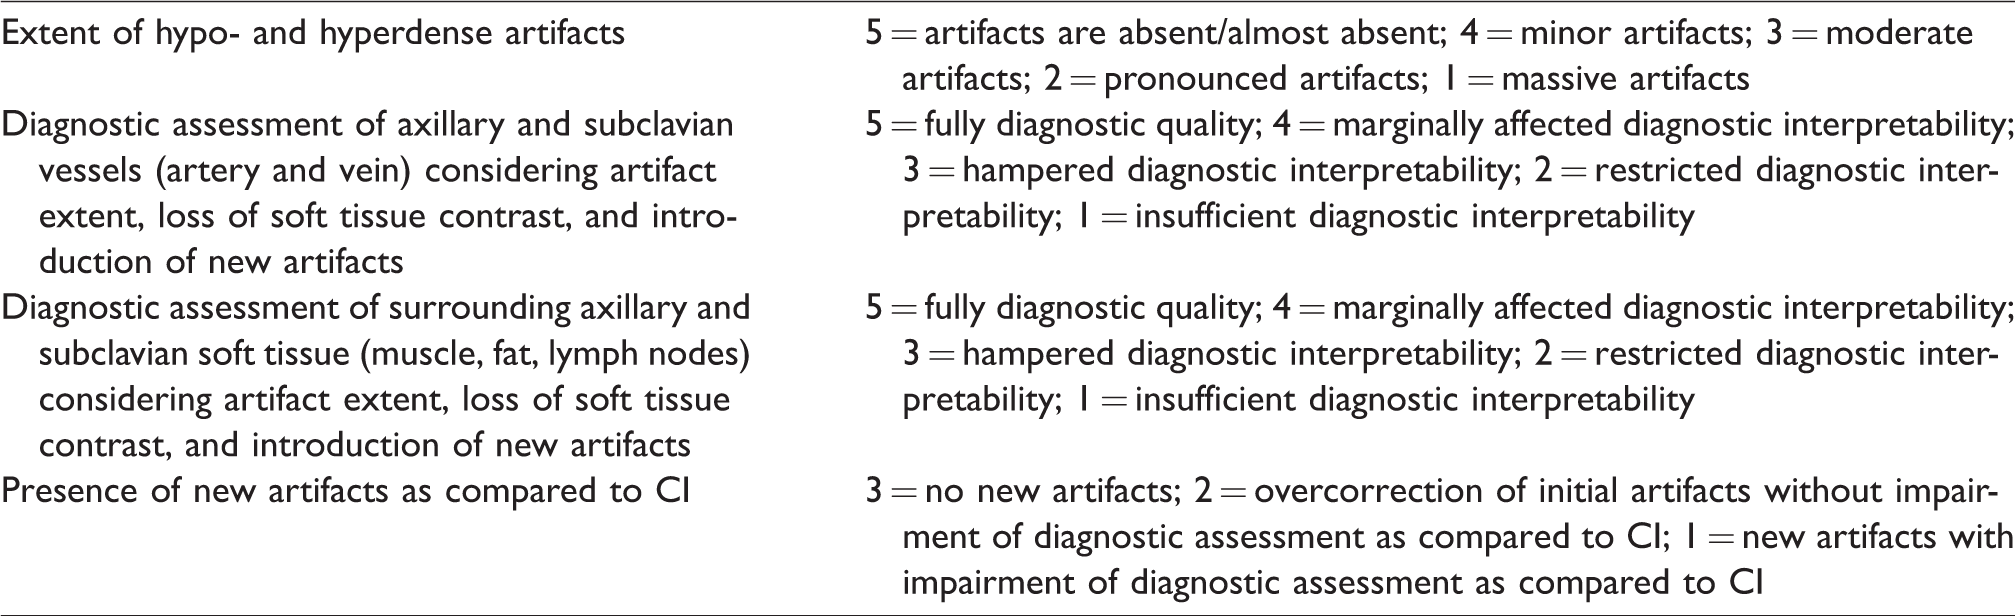
For visual assessment besides CI, we chose VMI reconstruction levels with larger increments (70, 100, 130, 160, and 200 keV) to allow for detection of relevant changes in image assessment and to not obscure differences by repetitive rating of (too) similar images, as applied before (3,16). The following image parameters were used: slice thickness = 3 mm; axial plane; soft tissue window settings (window level = 60, window width = 350); readers were allowed to adapt window settings manually.
Statistical analysis
Statistical analyses were conducted using JMP Software (V12, SAS Institute, Cary, NC, USA). Quantitative results are displayed as mean (±SD) and qualitative results are displayed by median and 10/90 percent quartile. To test for normal distribution, Shapiro–Wilk test was applied. Further testing was conducted using Wilcoxon test with Steel adjustment for multiple comparisons. Statistical significance was set to P < 0.05. The intraclass correlation coefficient (ICC) was calculated and interpreted as proposed earlier for visual analyses (21,22).
Results
A total of 50 patients (23 men, 27 women) who were affected by hypo- and hyperattenuating artifacts impairing diagnostic assessment were included in the analysis. The average age was 62.2 ± 10.6 years (age range = 42–90 years). Mean body weight of these patients was 77.3 ± 16.0 kg (and thereby higher than in the 296 patients that did not show diagnostic assessment impairing perivenous artifacts 72 ± 14.4 kg, P = 0.057). Patients were diseased with the following types of neoplasms: lung cancer, n = 9; breast cancer, n = 8; malignant melanoma, n = 8; prostate cancer, n = 6; lymphoma, n = 5; kidney cancer, n = 5; cervical cancer, n = 2, esophageal cancer, n = 2; and others, n = 5.
Objective assessment
Corrected attenuation within the hypodense artifacts significantly increased with higher VMI keV values in the range of 90–200 keV, thus approximating their true values (Table 2, Figs 1–3). Further, VMI ≥90 keV led to a significant decrease of corrected attenuation values within the hyperdense artifacts, also corresponding to an approximation to their true expected values (Table 2, Figs 1–3). In addition, the corrected attenuation values reached 0 HU between 140 and 150 keV for hypodense artifacts and between 150 and 160 keV for the hyperdense artifacts. As the corrected attenuation is the difference between tissue with artifacts and reference tissue without artifacts, this indicates that artifacts were eliminated in images between 140 and 160 keV. At higher keV levels, HU values of VMI even became positive in hypodense artifacts, indicating an overcorrection of the initial artifacts (Table 2, Figs 1–3). The same effect occurred in hyperdense artifacts, in which HU values turned negative.
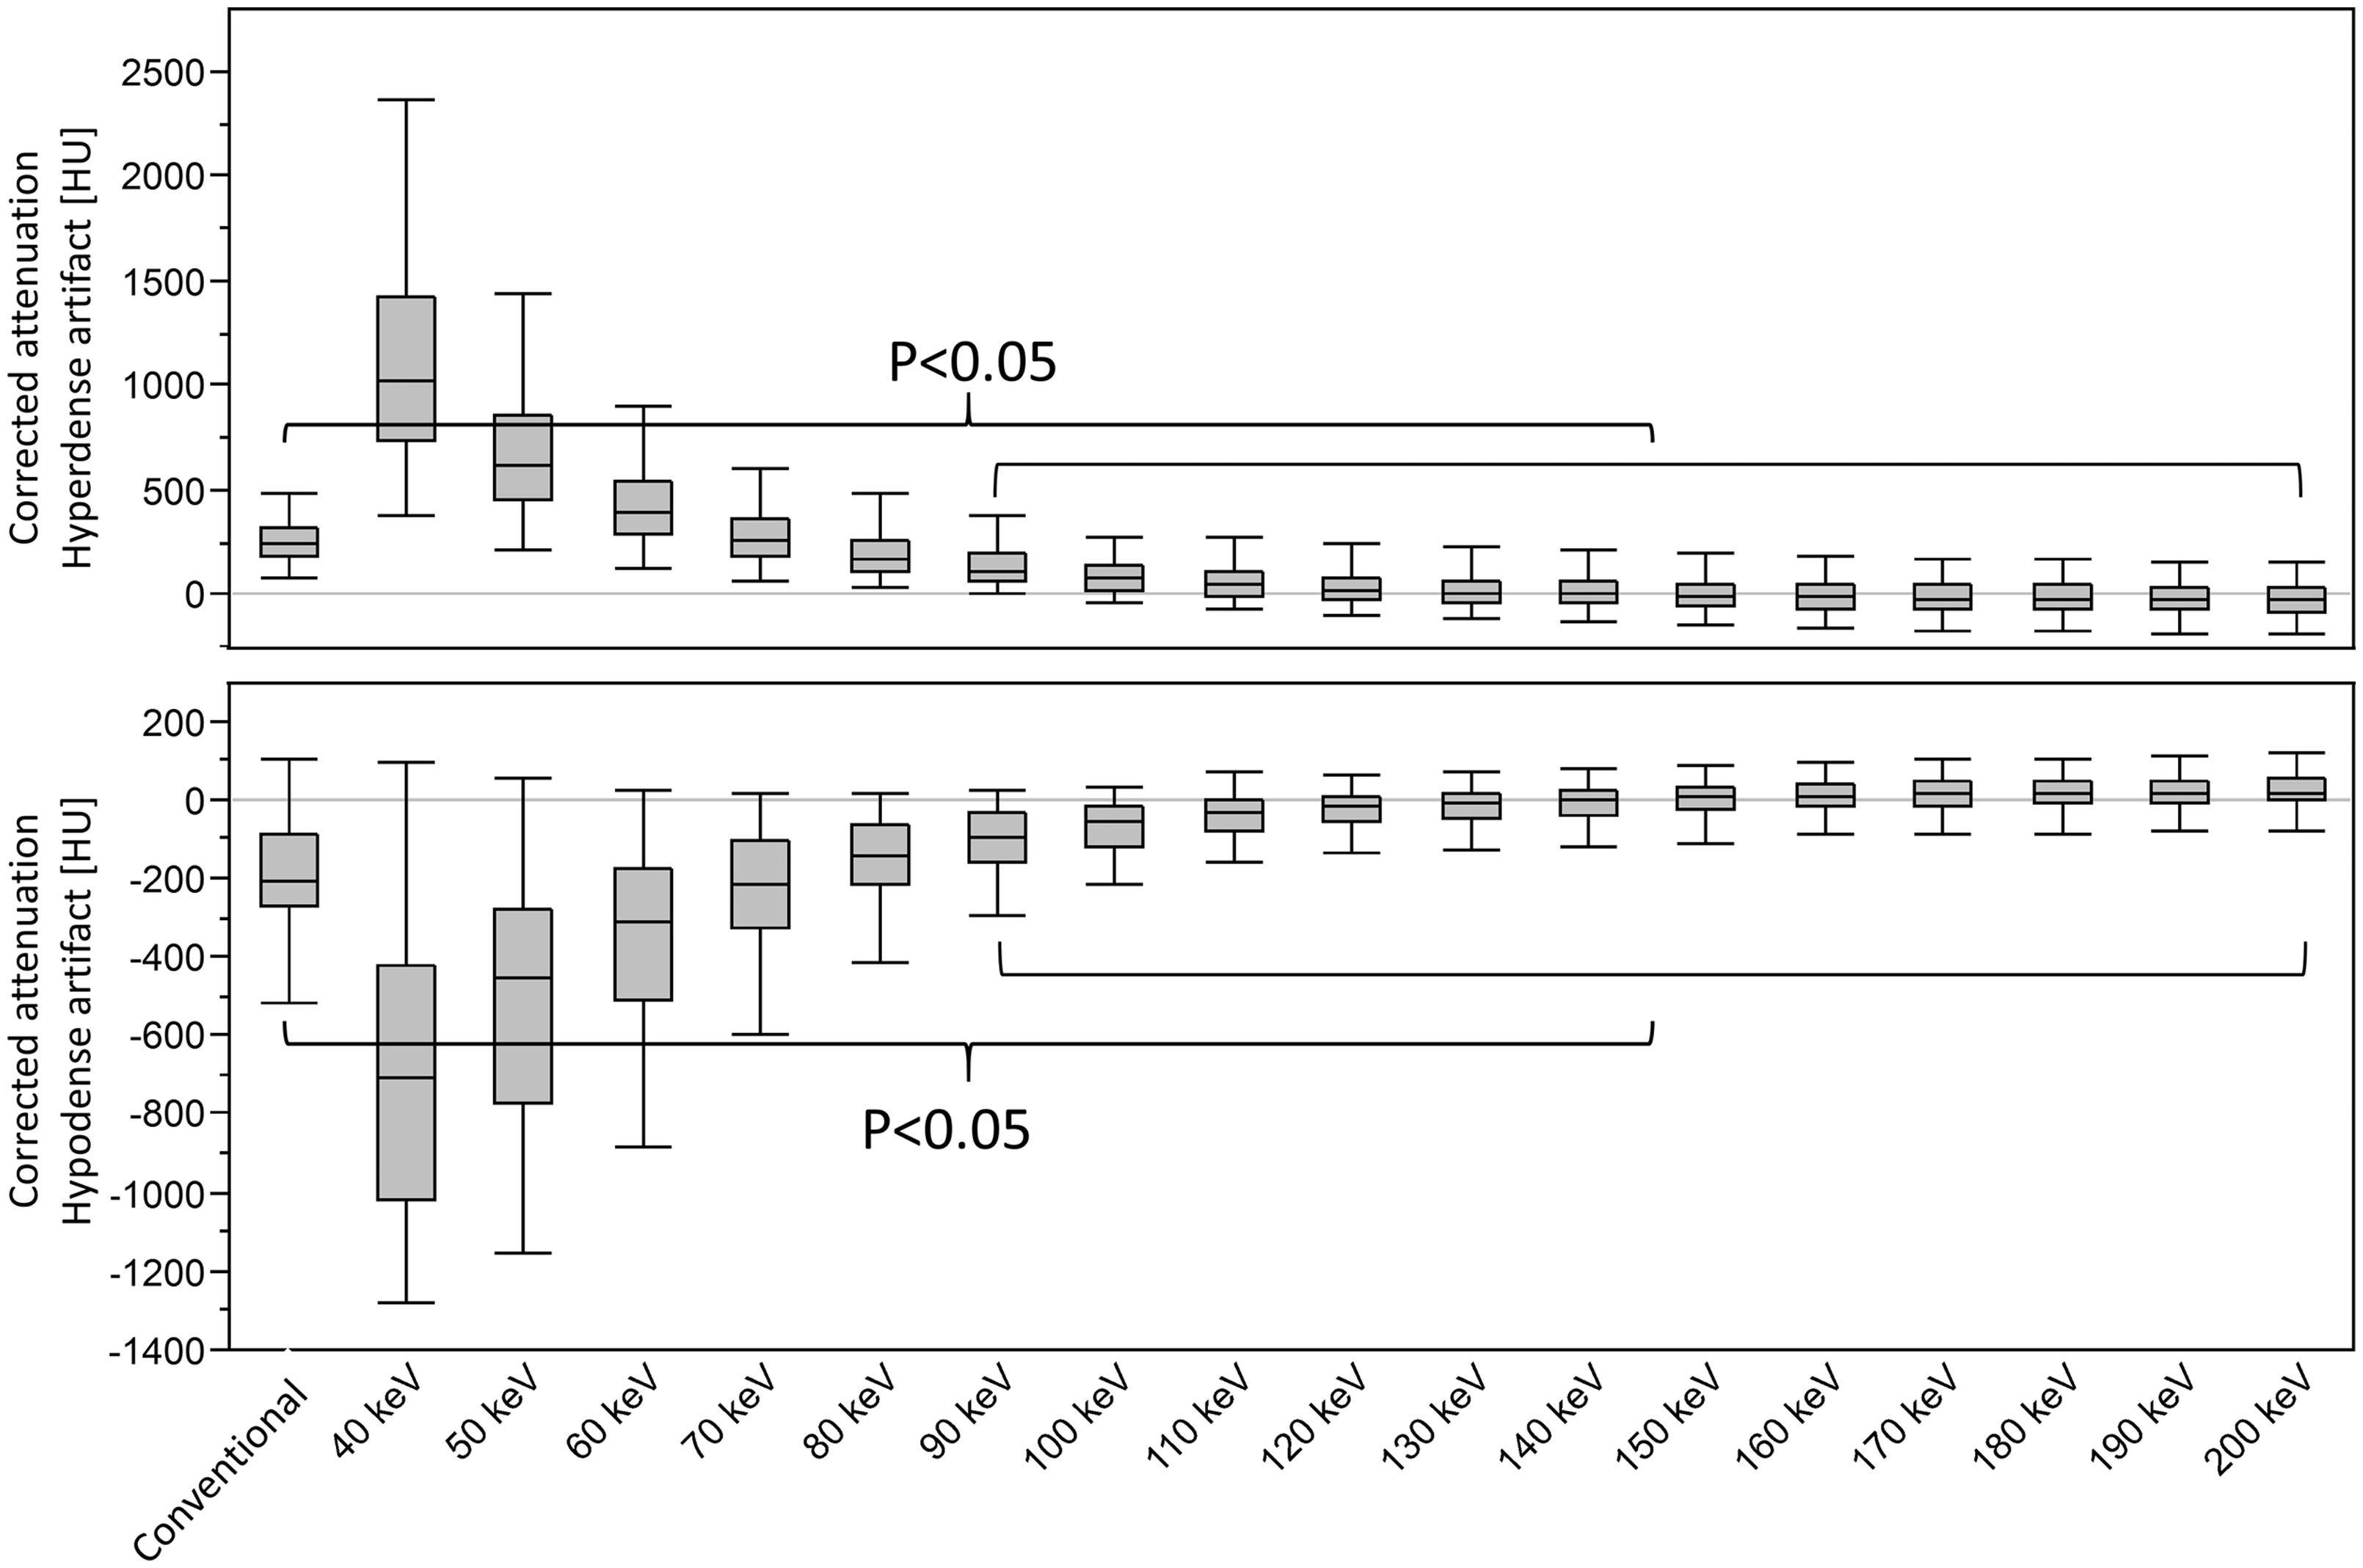
Box plot displaying corrected attenuation values in hypo- and hyperdense artifacts due to CM in the axillary and subclavian veins in conventional CT images (CI) and virtual monoenergetic images (VMI, 40–200 keV). VMI between 90 and 200 keV significantly reduce hypo- and hyperdense artifacts. With rising keV levels, HU values in the hypodense artifacts increase and HU values in the hyperdense artifacts decrease, thus both approximate their true value. At 150 keV, the HU values of the hypodense artifacts become positive and at 160 keV hyperdense artifact HU values become negative indicating overcorrection of the initial artifacts.

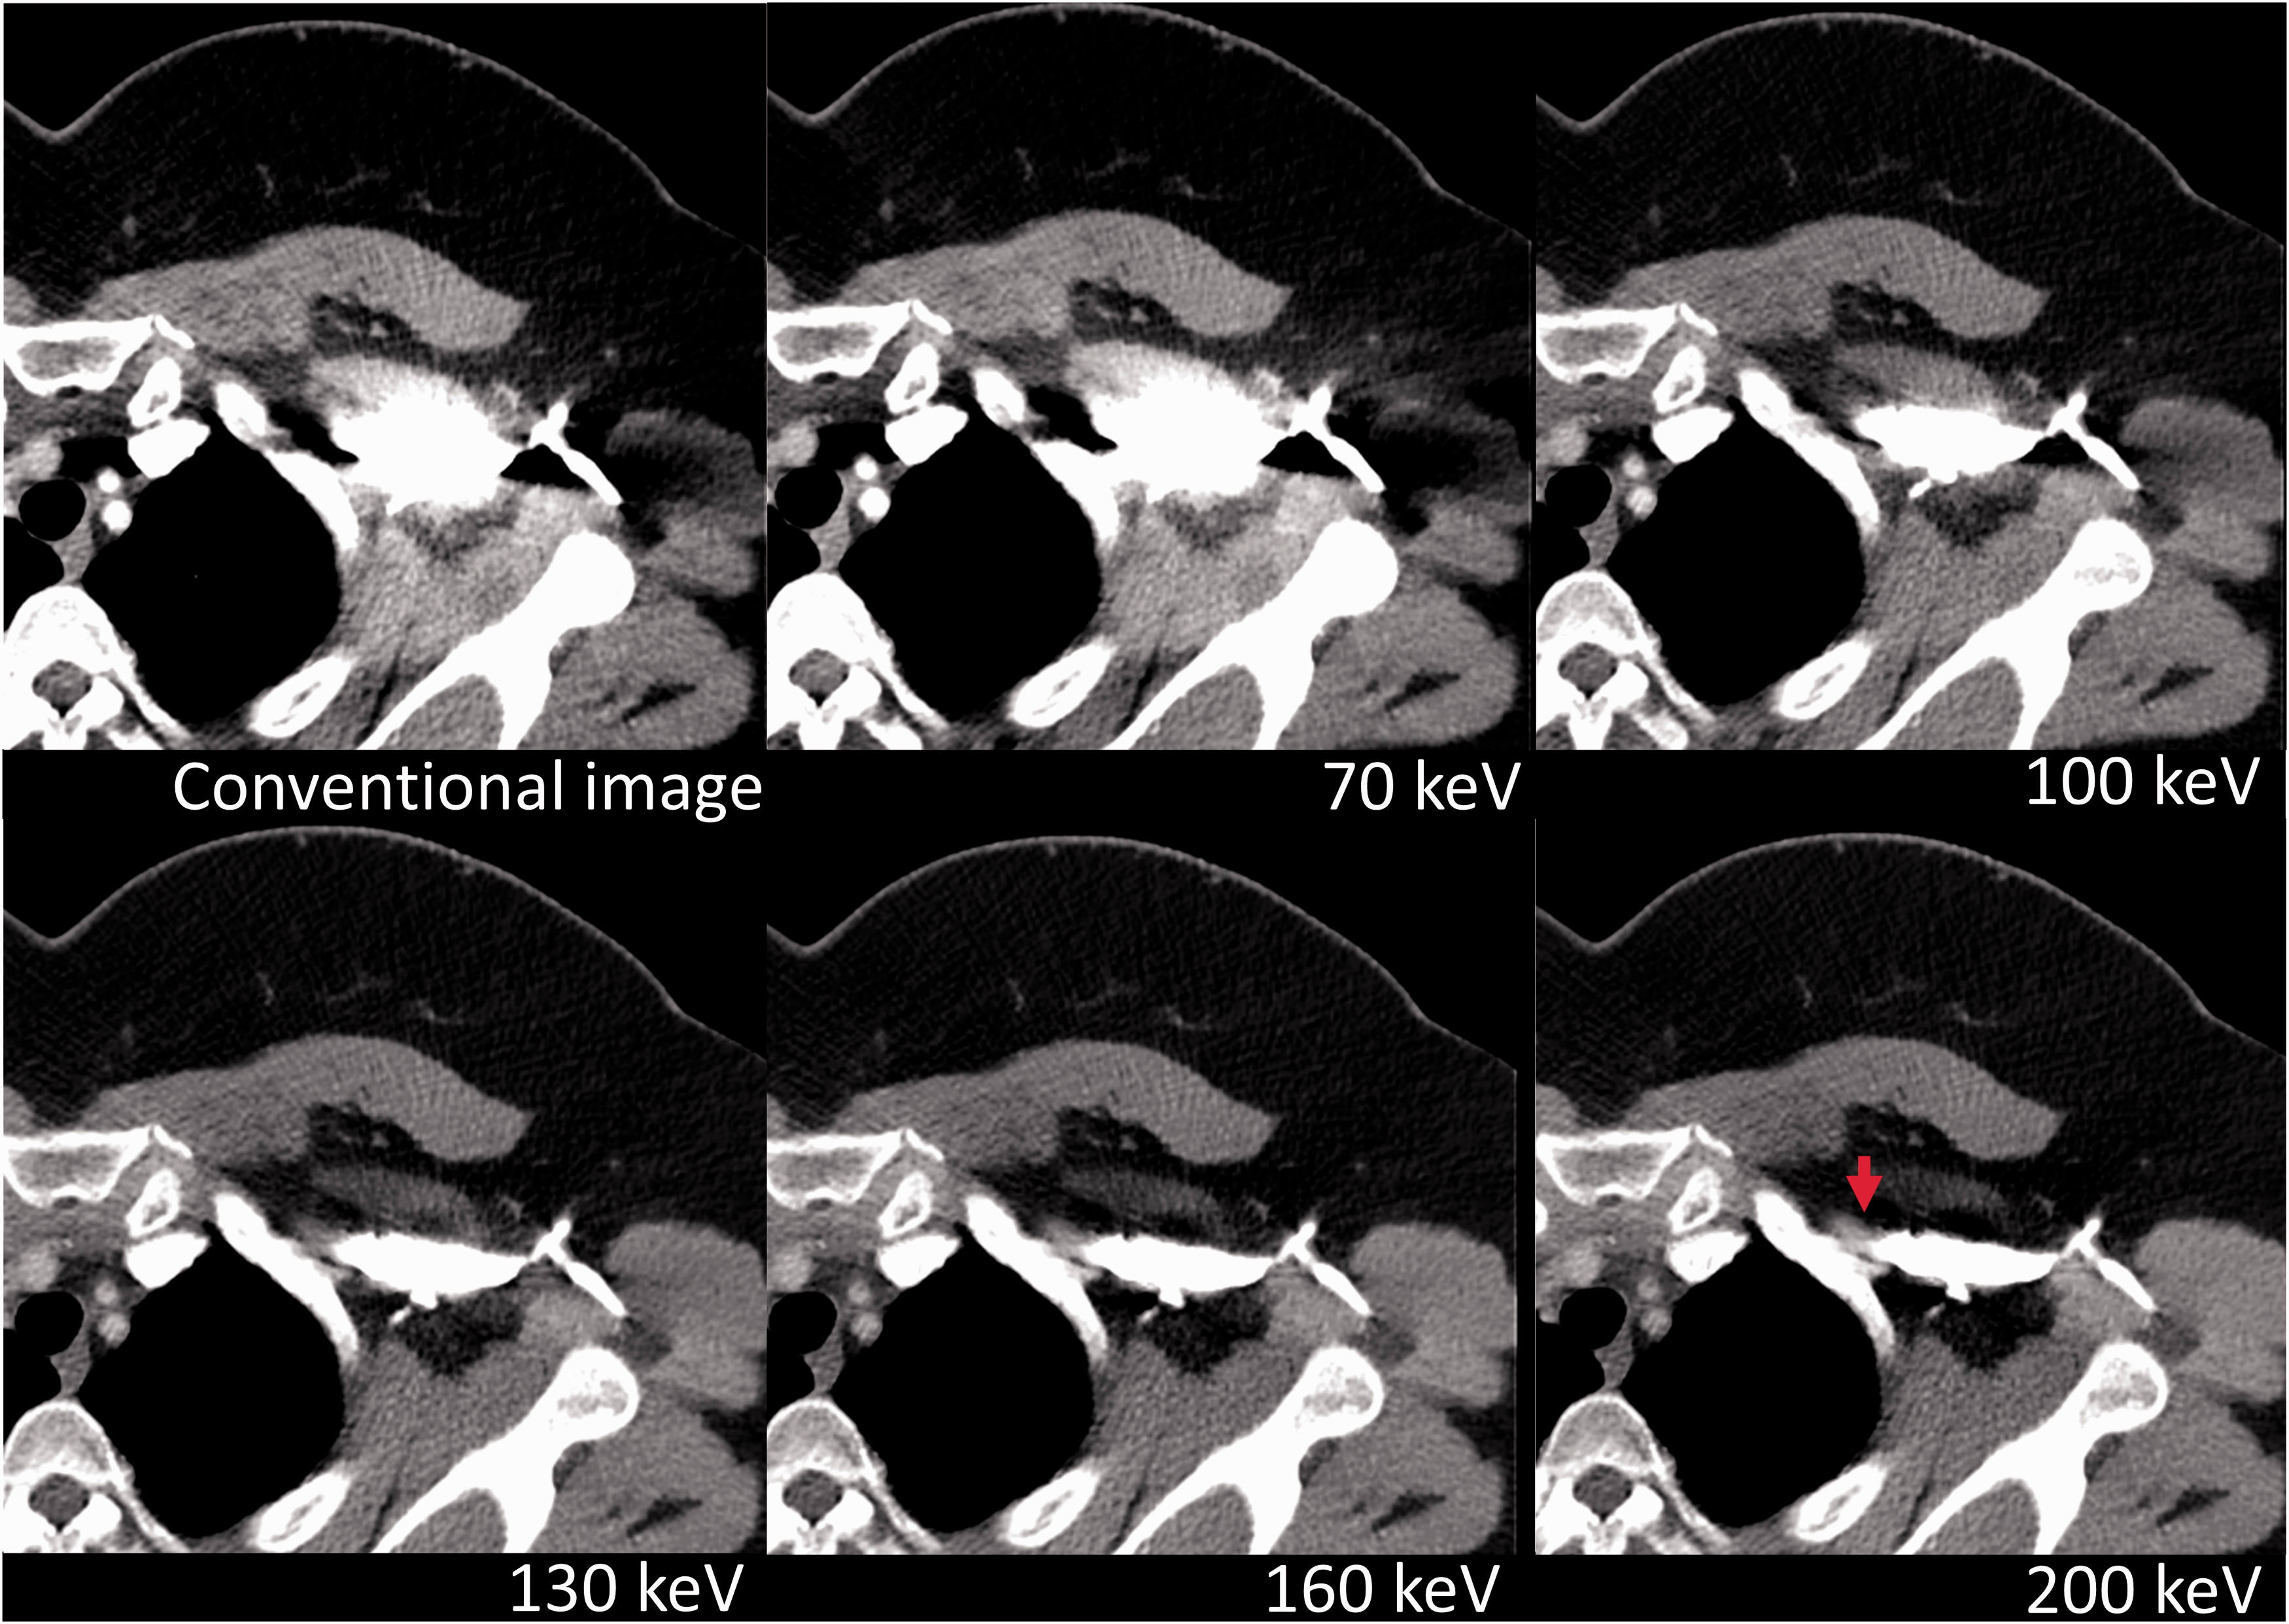
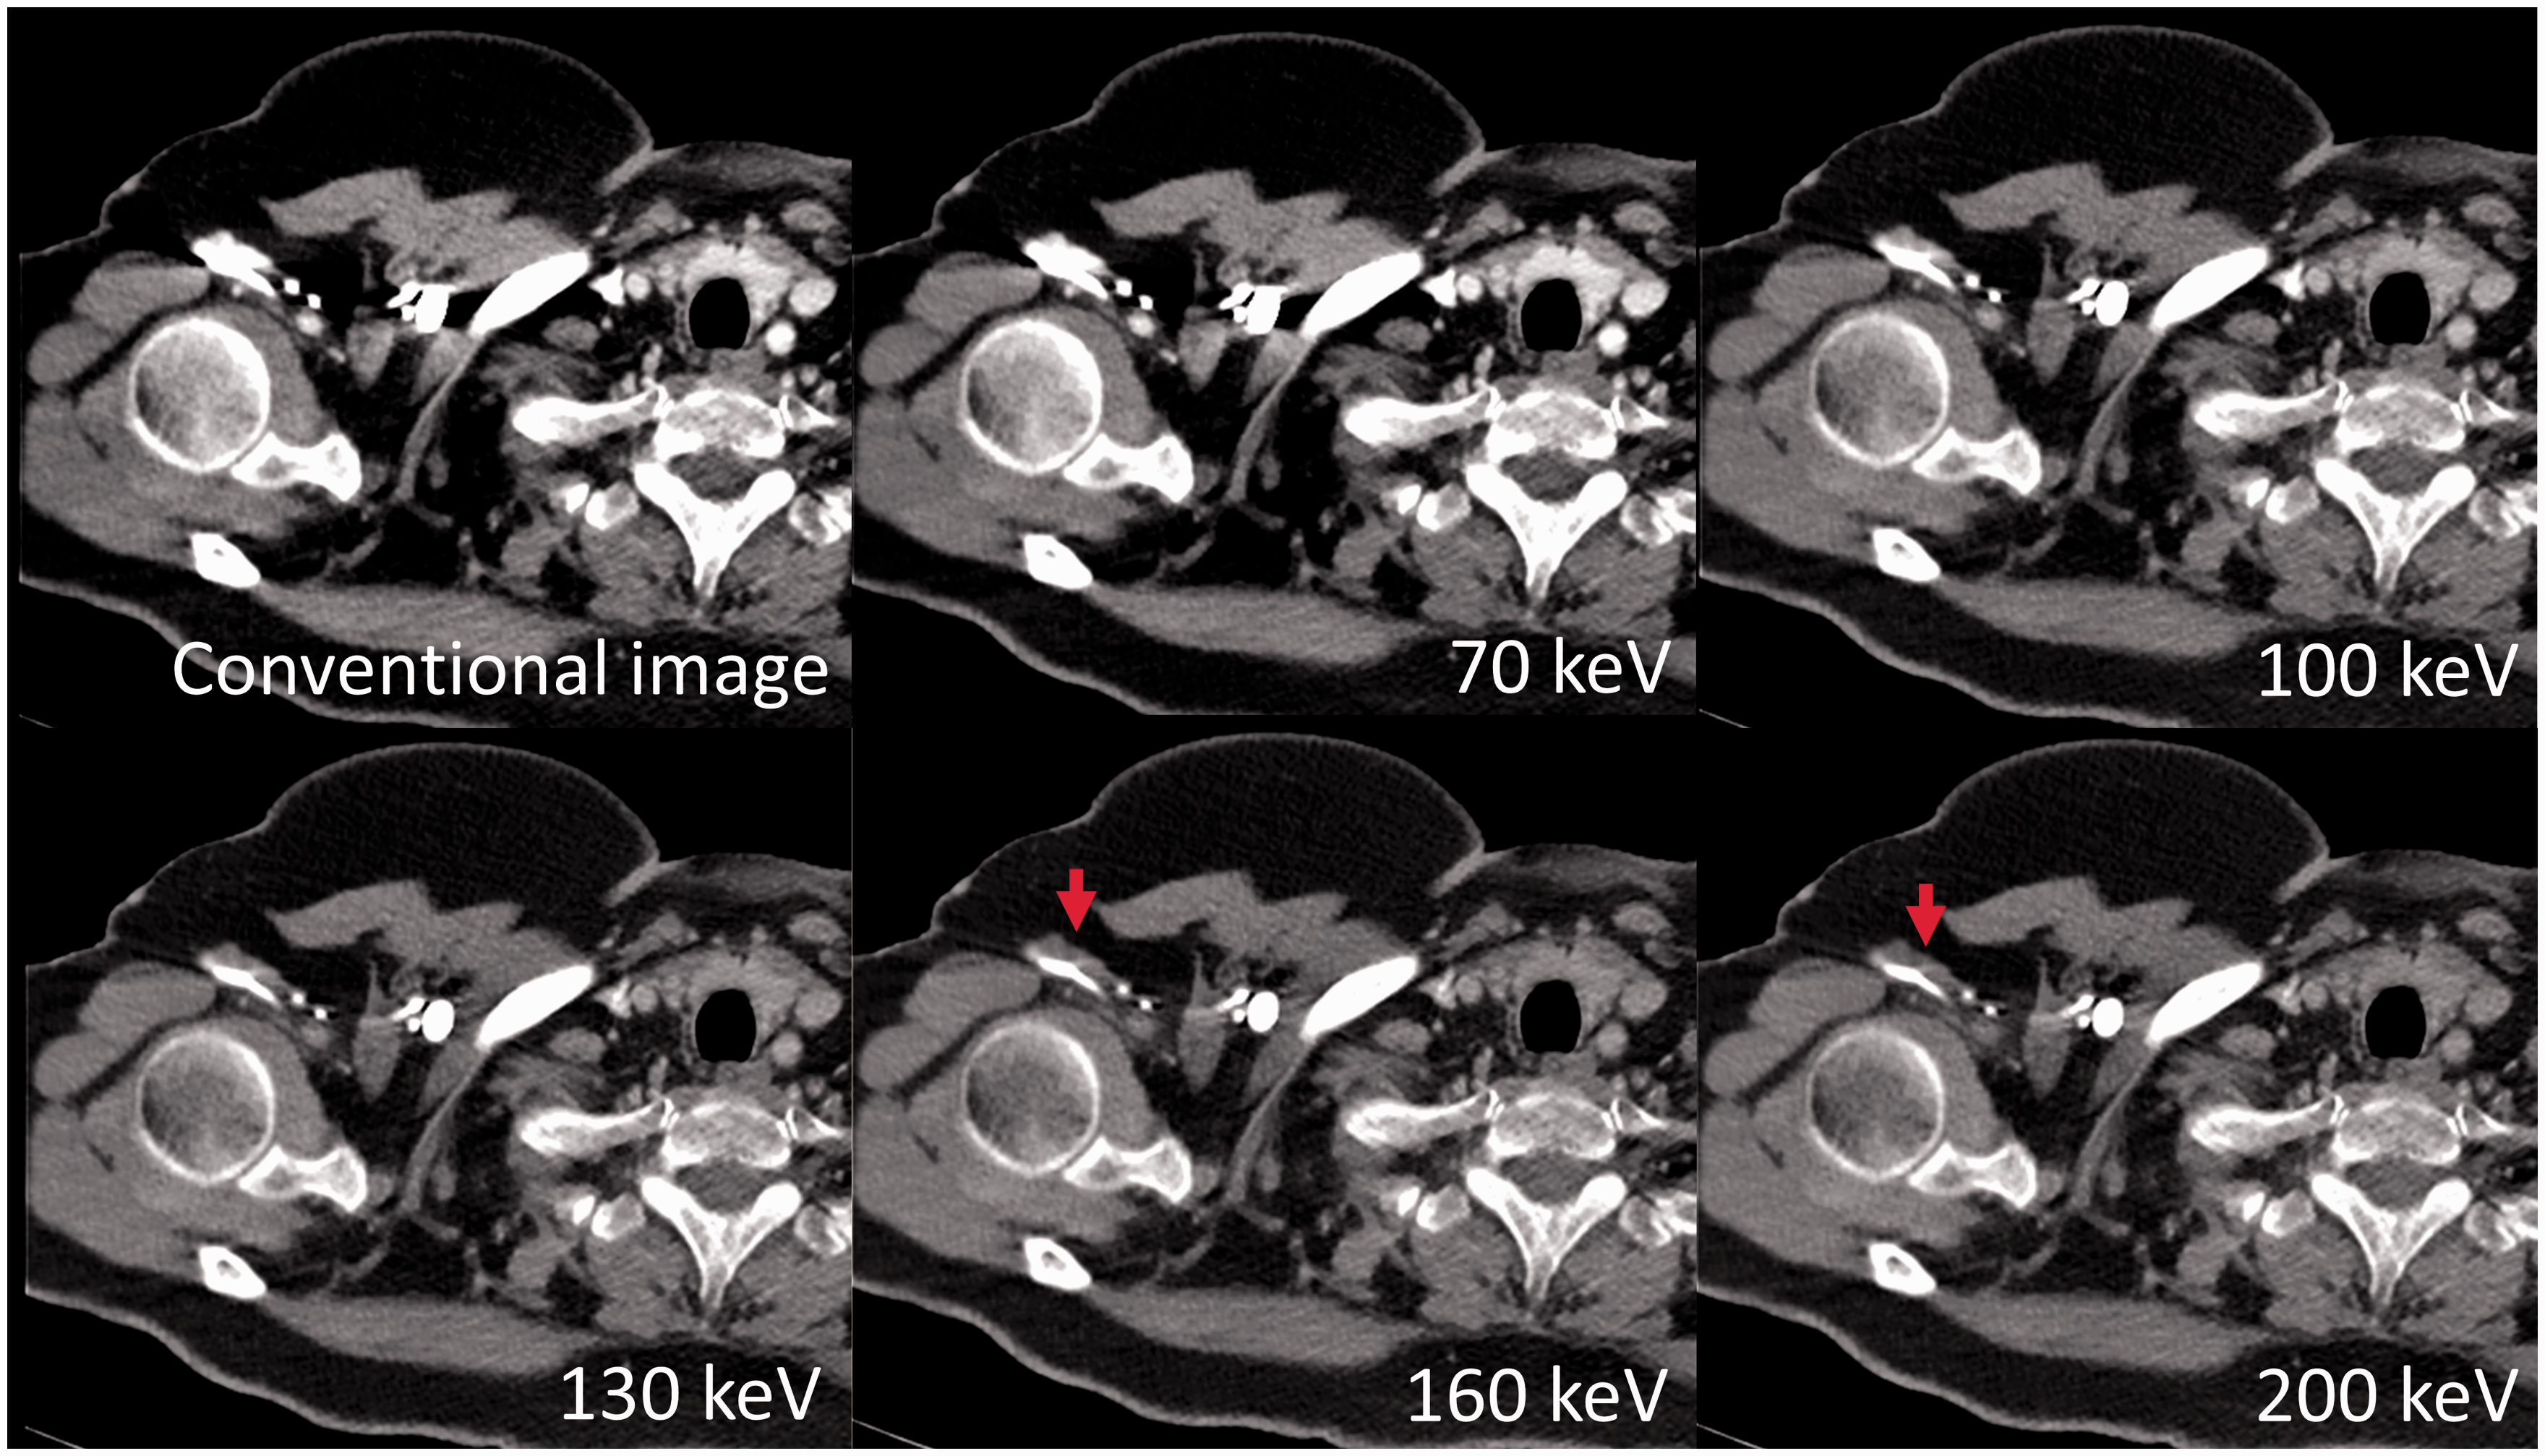
Reduction of severe artifacts from CM in the left subclavian vein. CI and VMI (70, 100, 130, 160, and 200 keV) of a 64-year-old male patient. VMI at 100 keV almost completely reduce the hypodense artifacts and strongly reduce hyperdense artifacts; however, with VMI ≥ 130 keV, an overcorrection of the initial artifacts occurs (red arrows, initial hyperdense artifacts turn in hypodense artifacts, and the other way around initial hypodense artifacts turn hyperdense, e.g. hypodensity areas next to the subclavian vein at high keV values; therefore, the muscle ventral to the subclavian vein appears thinner) which at highest keV values were even found to impair diagnostic assessment additionally to CI (green arrow) and was therefore rated as a new artifact at the 200 keV VMI.
Effective reduction of artifacts from CM in the axillary and subclavian veins by VMI. Comparison of artifact reduction and diagnostic assessment in CI and VMI (70, 100, 130, 160, and 200 keV) of a 54-year-old female patient. Hypo- and hyperdense artifacts from CM in the left axillary and subclavian veins impair diagnostic assessment of the surrounding soft tissue (muscle, fat, lymph nodes). Further differentiation between vein (lumen is overestimated in conventional image) and the medial adjacent subclavian artery is now possible in higher keV VMI (red arrow).
Objective assessment of artifact reduction and surrounding tissue.
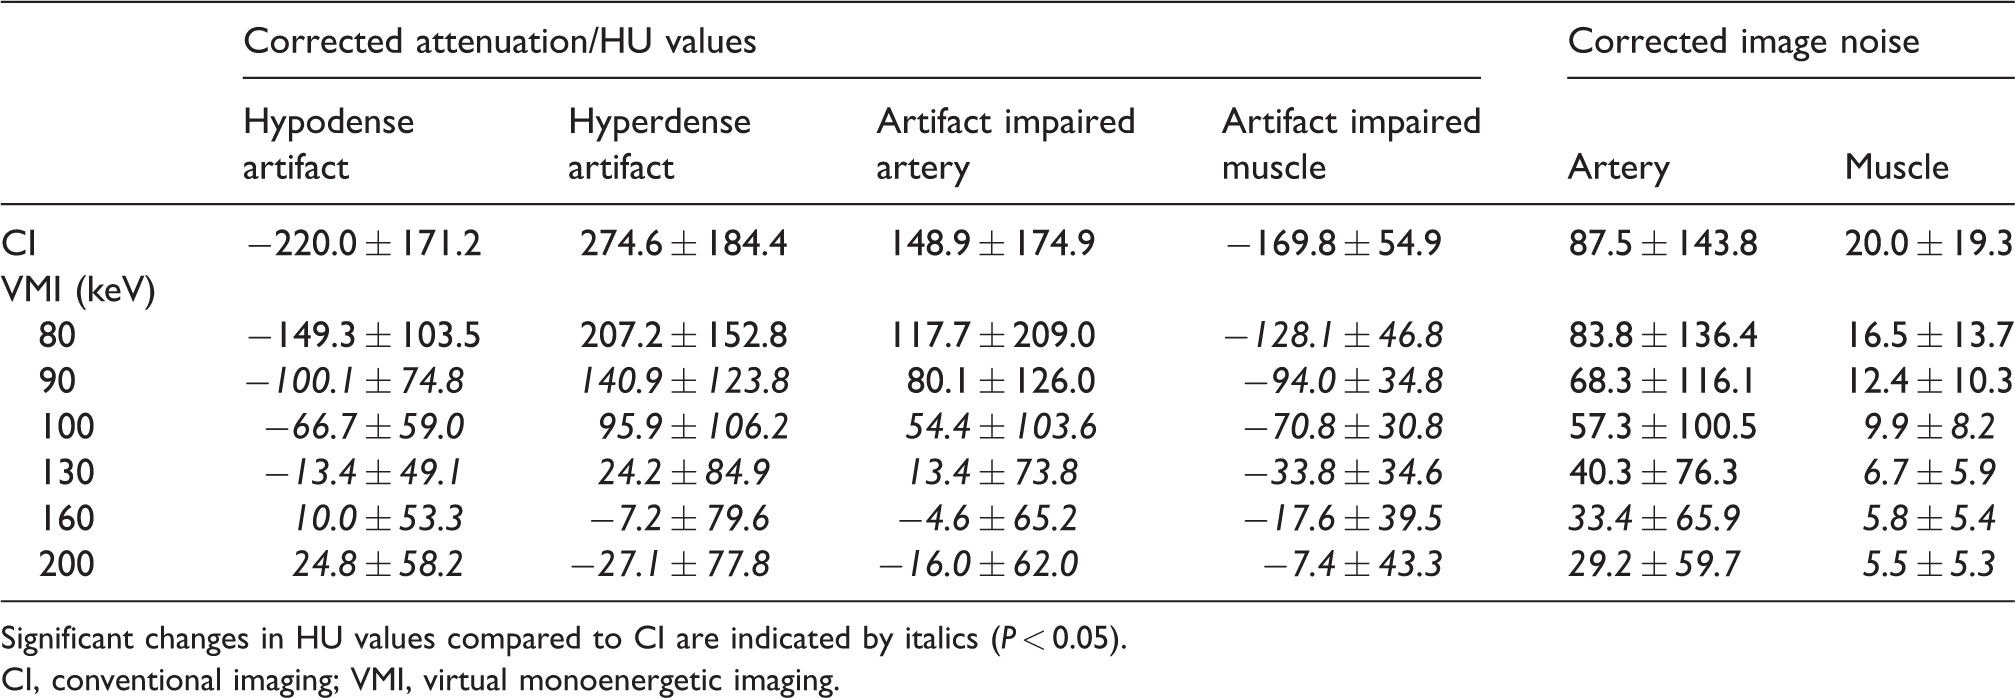
Significant changes in HU values compared to CI are indicated by italics (P < 0.05).
CI, conventional imaging; VMI, virtual monoenergetic imaging.
Axillary and subclavian arteries were affected by strong hyperdense streaks. VMI with keV levels of ≥100 keV did show a significant reduction of these artifacts (Table 2, Figs 4a and 5). Again, between 150 and 160 keV, HU values reached 0 HU, indicating that artifacts were eliminated, while in images ≥160 keV an overcorrection occurred. Adjacent muscle showed strong hypodense artifacts which could be significantly reduced by VMI ≥80 keV, thus approximating their true value and HU values, and nearly reached 0 HU at 200 keV. Corrected image noise was found lower in VMI with higher keV levels. This difference was significant for axillary and subclavian arteries ≥140 keV and for muscles ≥100 keV (Table 2, Fig. 4b).
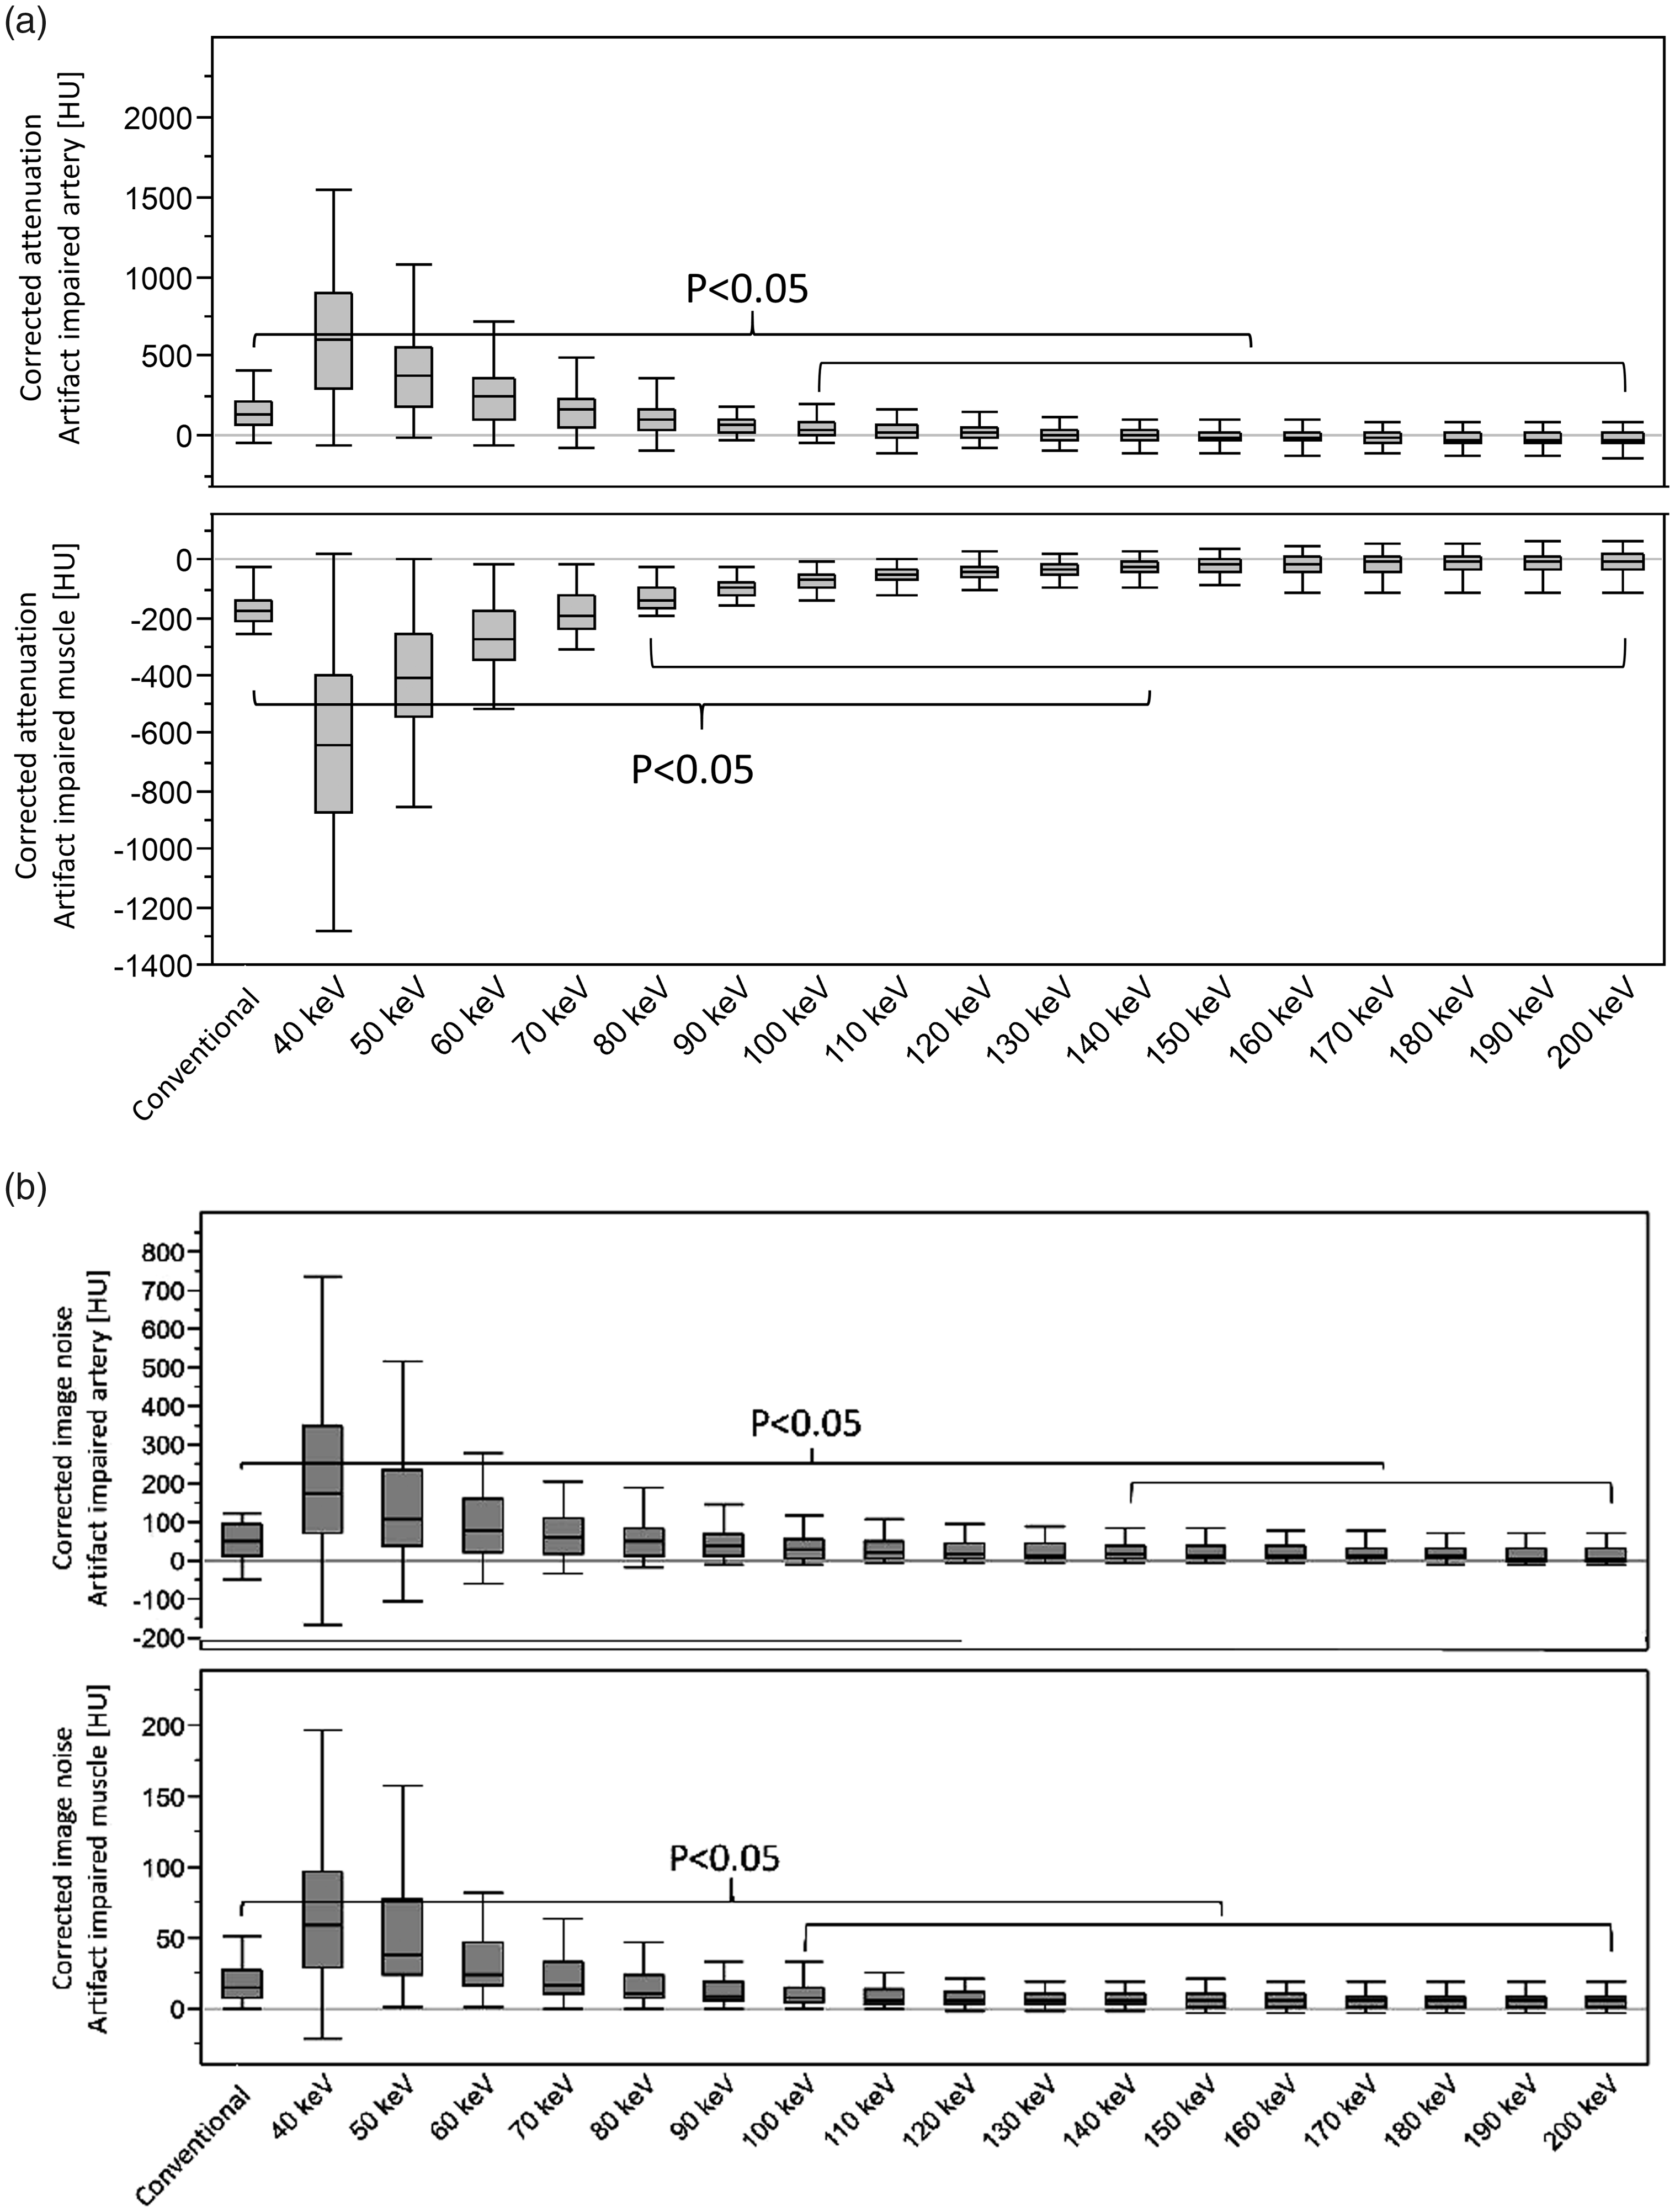
(a) Box plot displaying corrected attenuation of hyperdense perivenous artifacts impairing axillary and subclavian arteries and hypodense artifacts impairing adjacent muscle in CI and VMI (40–200 keV). VMI at 100 keV and VMI ≥ 80 keV lead to a significant artifact reduction in the arteries and muscles, respectively. (b) Box plot displaying corrected image noise in adjacent arteries and muscle impaired by hypo- and hyperdense perivenous artifacts. Image noise, as an indicator of artifacts is significantly improved in both arteries and muscles at higher keV VMI.
VMI reveal adjacent axillary artery and enable vessel delineation by reducing hyperdense artifacts of the right axillary vein. CI and VMI (70, 100, 130, 160, and 200 keV) of a 61-year-old female patient with, at this level, relatively mild artifacts impairing the assessment and delineation of the adjacent axillary artery. In high keV VMI, the axillary artery anterior and lateral of the axillary vein is clearly delineable (red arrows).
Visual assessment
Subjective analysis confirmed the results from objective analysis. It revealed a significant reduction of hypo- and hyperdense artifacts for VMI of 100 keV and higher, each reaching a plateau between 130 and 200 keV (Table 3). Diagnostic assessment of axillary and subclavian vessels and adjacent soft tissue (muscle, fat, and lymph nodes; Fig. 6) improved significantly for VMI at ≥100 keV and was rated best for VMI at 130 keV. Remarkably, diagnostic confidence between 160 and 200 keV decreased due to overcorrection of artifacts and loss of soft tissue contrast (Table 3). Optimal keV values for diagnostic assessment were 124.0 ± 16.6 keV (range = 88–160 keV). In the subjective reading, overcorrection of initial artifacts as compared to conventional images were noticed for VMI at ≥100 keV (VMI at 70 keV 0%, 100 keV 5%, 130 keV 45%, 160 keV 64%, and 200 keV 73%). These artifacts resembled an overcorrection and did not lead to an impairment of diagnostic assessment as compared to conventional images because they occurred in the location of the initial artifacts. Nevertheless, in some patients, the new artifacts impaired diagnostic assessment additionally to conventional images (VMI at 70 keV 0%, 100 keV 0%, 130 keV 3%, 160 keV 16%, and 200 keV 28%). Overall interrater agreement was excellent (ICC = 0.89; Table 3).

VMI reveal an adjacent axillary lymph node by reducing hyperdense artifacts of the left axillary vein. CI and VMI (70, 100, 130, 160, and 200 keV) of a 41-year-old female patient with severe artifacts impairing the assessment and delineation of the adjacent axillary soft tissue, including lymph nodes. In high keV VMI, a lymph node anterior of the left axillary vein becomes clearly delineable (red arrows).
Subjective assessment of artifact reduction and surrounding tissue.
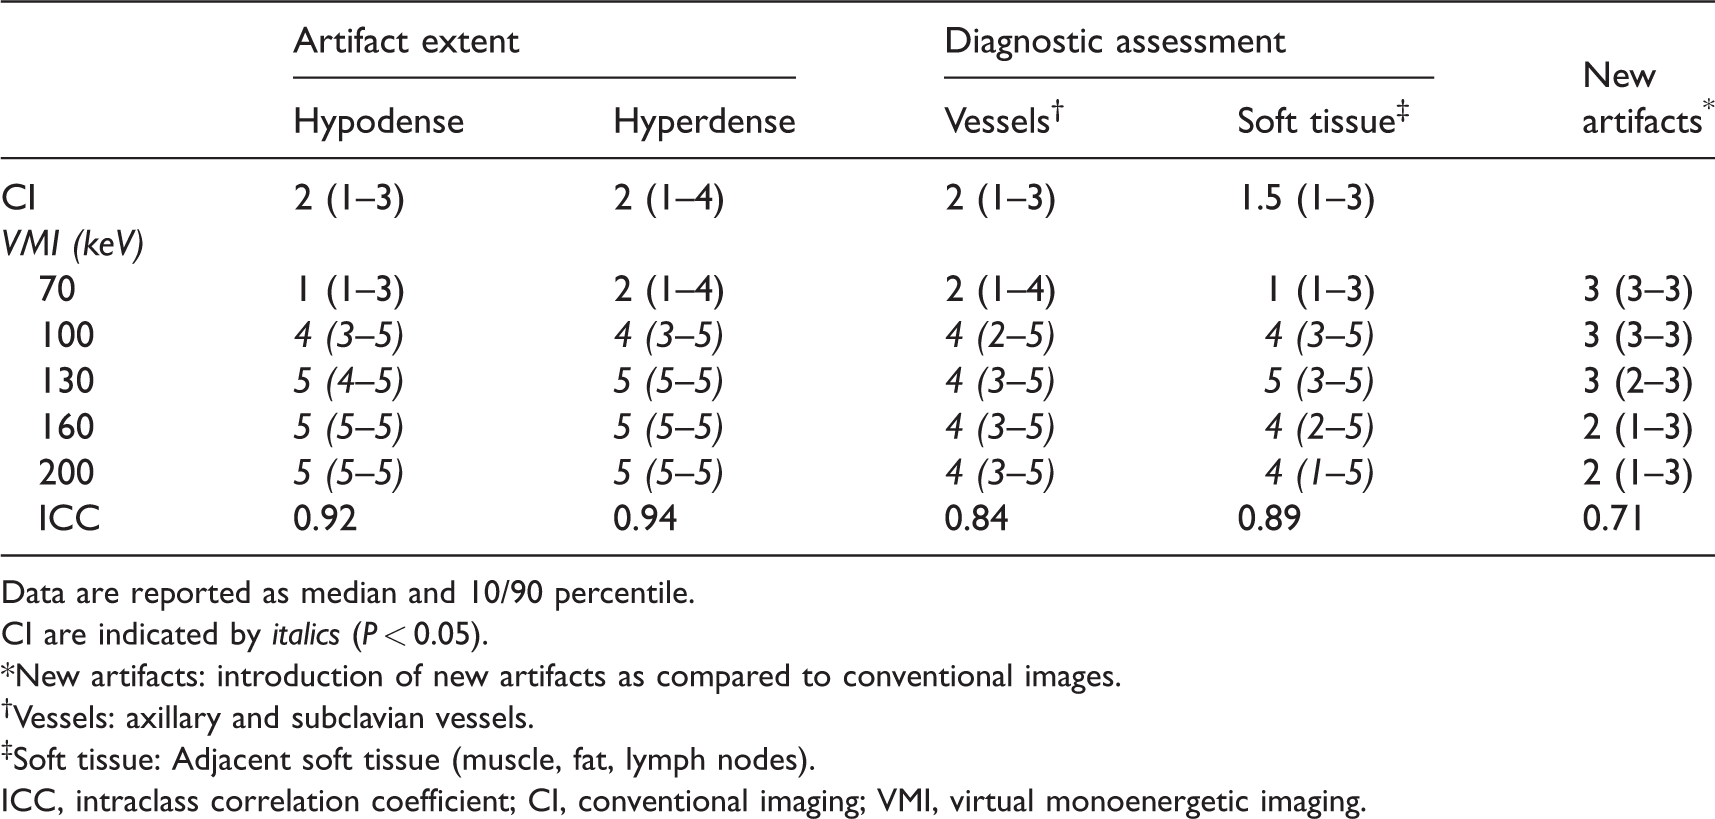
Data are reported as median and 10/90 percentile.
CI are indicated by italics (P < 0.05).
*New artifacts: introduction of new artifacts as compared to conventional images.
†Vessels: axillary and subclavian vessels.
‡Soft tissue: Adjacent soft tissue (muscle, fat, lymph nodes).
ICC, intraclass correlation coefficient; CI, conventional imaging; VMI, virtual monoenergetic imaging.
Discussion
VMI from SDCT allow for a significant and effective reduction of hypo- and hyperdense artifacts caused by CM in the axillary in subclavian veins leading to higher image quality and improved assessment of local vessels and adjacent soft tissue. Optimal keV values for best diagnostic assessment and artifact reduction differ between patients and therefore need individual adjustment.
From a physical perspective, VMI should be ideal to reduce artifacts from CM as distance to k-edge energy of iodine (∼33 keV) increases and attenuation of iodine decreases with higher keV values (13,23). In areas of complete photon starvation, the image information should be lost entirely and make recovery by VMI impossible, selective consideration of high-energy photons for image reconstruction (as performed in high keV VMI) may help to recover information in areas where only few and greatly hardened photons are registered (19). Correspondingly, both the objective and visual analysis showed a strong reduction of hypo- and hyperdense artifact reduction as well as improved diagnostic assessment of local vessels and adjacent soft tissue. In staging and restaging examinations, artifact reduction and improved assessment of surrounding soft tissue would be highly valuable for evaluation and detection of potential axillary and periclavicular soft tissue and lymph node metastases. Further, the improved evaluation of local vessels could facilitate detection of vessel pathologies, such as venous thrombosis or arterial stenosis.
Effectiveness of artifact reduction and the optimal keV value for artifact reduction differed between patients. This was probably caused by intravascular differences of CM concentrations (e.g. different dilution in blood, anatomical differences). Therefore, VMI keV values should be adjusted individually for every patient to obtain optimal results, as has also been suggested in earlier studies focusing on metal artifact reduction (13,15,19,24). To account for this variability, the subjective readers determined for each patient the keV value with best overall diagnostic assessment; optimal keV values for diagnostic assessment were in the range of 88–160 keV (average = 124.0 ± 16.6 keV). Best diagnostic assessment of axillary and subclavian vessels as well as soft tissue was rated for VMI at 130 keV, probably due to the fact that with rising keV levels artifacts can be reduced; however, on the other hand, an overcorrection of artifacts and loss of soft tissue contrast may also occur (13).
In line with previous studies, especially in severe artifacts and at higher keV values, overcorrection and, in some cases, even the introduction of new artifacts was noted (Fig. 2). These artifacts mostly occurred in areas where artifacts were present in the initial conventional image; therefore, diagnostic assessment was then not additionally impaired (25,26). This overcorrection is an interesting finding and demonstrates the virtual nature of the VMI as they should not occur in true monoenergetic imaging. The appearance in VMI might be caused by the image reconstruction algorithms as the VMI are extrapolated from two energy levels that do not cover the whole range of different keV values available (40–200 keV). Therefore, overcorrection was only described in VMI ≥100 keV and was more frequent at higher keV values. Consequently, conventional images should remain the standard for image interpretations and VMI should be used as additional image information rather than a replacement.
Secchi et al. investigated VMI for artifact reduction from high iodine concentration in the superior vena cava in cardiac DECT imaging. Similar to our study, higher keV VMI reduced artifact size and improved image quality scores at higher keV values in the range of 80–120 keV (27). Recently, a similar study by Kim et al. also investigated reduction of perivenous artifacts by CM and showed that VMI between 100 and 130 keV from DECT offer a potent approach for artifact reduction in chest imaging; however, we feel that our evaluation is a valuable addition to the literature as there are the following differences and advantages. This study was focused on a defined patient population in an oncologic setting receiving only dedicated staging and restaging examinations. A more detailed subjective analysis was applied, separately differentiating between hypo- and hyperdense artifact reduction as well as diagnostic assessment of local vessels and surrounding soft tissue, rather than just evaluating the overall image quality. Further, we reported that optimal keV values are different in each patient and need individual adjustment. We also introduced the measure corrected attenuation and corrected image noise to account for general changes in attenuation and image noise that appear with changing keV values, thereby minimizing the potential of false-positive results. This measure also allowed us to detect the phenomena of overcorrection, which occurred in higher keV values and offered us the opportunity to better perceive as well as explain the virtual/extrapolated properties of VMI and their potential risks. We also discussed why VMI should be particularly ideal for reduction of artifacts from CM as distance to k-edge energy of iodine (∼33 keV) increases.
In clinical practice, optimization of injection protocols, e.g. including a saline flush as well as two or three phasic injection protocols, should be the first choice to reduce perivenous artifacts from CM (2,4,28). Yet, if these artifacts occur, VMI comprise a reasonable and efficient mean for their reduction, that are available retrospectively, as dual-energy acquisitions are always enabled in SDCT due to the detector-based separation of photons, which is not the case for all tube-based DECT systems (10,13,19,26).
The following limitations need to be discussed. First, although all patients received a standard CM injection protocol, extents of artifacts varied broadly. Varying patient weight impacted total injection duration, so patients with a higher body weight were injected with CM right until the acquisition started, which might have been a main reason for occurrence and aggravated perivenous artifacts. This was supplemented by our finding that patients with diagnostic impairing artifacts showed higher body weight. Further, individual patient characteristics related to circulation and anatomical differences could have also impacted artifact severity. Different methods have been used to measure CT artifacts, for example, broadly applied measures are HU values or artifact widths (24,29). Nevertheless, more complex methods have also been applied using sophisticated algorithms for artifact quantification (30). Iterative reconstructions themselves have a significant impact on image noise and thereby limit the meaningfulness of the applied analysis. To address possible limitations of the objective analysis, we applied a detailed subjective evaluation by two experienced and independent readers visually assessing artifact reduction and diagnostic assessment.
In conclusion, virtual monoenergetic images from SDCT are a potent and effective tool for reduction of hypo- and hyperattenuating perivenous artifacts from CM in the axillary and subclavian veins. This improved diagnostic assessment of surrounding soft tissue might be particularly relevant in staging and restaging examinations to detect soft tissue and lymph node metastases. Recommended keV values are in the range of 100–160 keV but need individual adjustment for optimal artifact reduction and diagnostic assessment.
Footnotes
Acknowledgements
The authors thank David Zopfs, Natalie Vick, Simon Lennartz and Jan Borggrefe for their contribution to this study and the review of this manuscript.
Declaration of conflicting interests
The author(s) declared the following potential conflicts of interest with regard to the research, authorship, and/or publication of this article: NGH is on the speaker’s bureau of Philips Healthcare.
Funding
The author(s) disclosed receipt of the following financial support for the research, authorship, and/or publication of this article: This research was supported in part by Philips Healthcare under a research agreement with University Hospitals Cleveland Medical Center and Case Western Reserve University.