



Abstract
In music listening, limitations on visual experience affect a listener’s abstract information processing and conceptualization of the music. The aim of this study is to examine the differences in emotional responses to music between adults with visual impairment (VI) and adults with normal vision (NV). By using specific, emotion-inducing music reflecting happiness, sadness, anger, and fear, this study considers factors such as music emotion identification, emotional valence, arousal, intensity, and musical preference. A total of 120 participants (60 VI and 60 NV) listened to sixteen 15-second music excerpts and reported which emotion and to what extent they perceived it, using a self-reported music emotion evaluation scale. The results indicated that both of the groups showed high congruence in music emotion identification. However, the VI group showed significantly higher arousal, intensity and preference for sadness, while showing the lowest score for the intensity of fear. The main factor affecting emotion identification was preference for the VI group, and valence for the NV group.
Keywords
In music listening, visual imagery which includes visual information inputs is reported to be one of the most important modes by which listeners experience emotions elicited by music (Darrow & Novak, 2007; Juslin & Västfjäll, 2008). Some brain imaging studies have provided evidence that the brain structures activated by visual stimulation are similarly activated when listening to music (Farah, 2000; Zatorre & Halpern, 2005). The visual experience is affected by the listener’s personal characteristics (Juslin, Liljeström, Västfjäll, Barradas, & Silva, 2008; Wagner & Darrow, 1981), not only in terms of the content of imagery (Lyman & Waters, 1989; Trainor & Trehub, 1992), but also in terms of the pattern of physiological reactions that the music arouses (Lundqvist, Carlsson, Hilmersson, & Juslin, 2008; Rickard, 2004). Furthermore, listeners can perceive music emotion in various ways according to their ability to process music and organize the experience into concrete visual images (Darrow & Novak, 2007). It has been found that music reliably triggers visual imagery (Bishop, Karageorghis, & Loizou, 2007; Quittner & Glueckauf, 1983) and that the visual imagery induced by music enhances mood (Västfjäll, 2002).
People with visual impairment, who actively use other senses (especially hearing) to compensate for their lack of vision, are able to listen to and enjoy music to the same extent as those with normal vision (Tuttle & Tuttle, 2004). Visually impaired people can also use music as a tool for social communication as well as a source of personal enjoyment (Robb, 2003; Wolffe, Koenig, Sacks, & Lewis, 2003; Wolffe & Sacks, 1997). Some of them enjoy participating in group music activities, such as choirs, vocal bands, wind ensembles, and karaoke singing (Park, Chong, & Kim, 2015). Music can facilitate social connections, build mastery and competence, and provide solace in adversity (Werner & Smith, 2001). Music listening can induce multifaceted and profound emotional responses (Molloy-Daugherty, 2013) and music can be a useful means for visually impaired people to increase social interaction (Park et al., 2015; Rostohar, 2006).
One of the factors that influence a visually impaired individual’s experience in listening to music includes his/her ability to interpret a piece of music as representing a certain concept or situation (Darrow & Novak, 2007). Some studies suggest that the tactile senses of people with visual impairment coincide with the visual senses of those with normal sight (Walker, 1985). However, other studies on the different amounts of imagery utilized by visually impaired and normally sighted people using similar measuring tools imply that limited visual experience hinders their ability to create the aforementioned concept or situation induced by a certain piece of music (Madsen & Darrow, 1989). Moreover, the study, which revealed limitations to their processing of abstract data, reported that when asked to freely comment about music after listening to it, the participants with visual impairment tended to present more data-driven descriptions, including instruments used and musical elements presented, while giving fewer analogical or metaphorical descriptions than those with normal sight (Flowers & Wang, 2002). These findings can be interpreted as showing that visual experience limitation is one of the factors which affect visual images during music perception and processing.
Because listeners’ emotional responses are affected by numerous psychological and situational factors, multifaceted and systematic approaches based on psychology are required to measure induced music emotion (Scherer, 2004). Traditionally, discrete and dimensional models of induced emotion have been used to examine music listening (Eerola & Vuoskoski, 2011; Juslin & Sloboda, 2010; Zentner & Eerola, 2010). In studies using the discrete model of music emotion, four common basic emotions are induced via music listening (regardless of the listener’s background): happiness, sadness, anger and fear (Eerola, 2010; Fritz et al., 2009; Nawrot, 2003; Resnicow, Salovey, & Repp, 2004; Schellenberg, Krysciak, & Campbell, 2000; Thayer & Faith, 2001). The dimensional model explains the extent of the pertinent emotion’s spatial location in several major dimensions, rather than classifying induced music emotions by individual characteristics (Gomez & Danuser, 2004; Schubert, 1999; Withvliet, & Vrana, 2006). This approach mainly uses a two-dimensional model consisting of emotional valence (positive–negative) and arousal (active–relaxed) (Russell, 1980; Tellegen, Watson, & Clark, 1999; Thayer, 1989; Vieillard et al., 2008), but it also includes a three-dimensional model, which classifies emotional arousal according to the level of intensity and energy (Schimmack & Grob, 2000).
The purpose of this study was to compare the perceptions of music emotion between adults with visual impairment (VI) and normal vision (NV), and to investigate whether the limited visual experience of people with visual impairment affects their ability to perceive and identify the emotions in music. This study used an operational definition of “induced music emotion” wherein the listener identified the type of emotion by evaluating the expressed valence of music excerpts and by rating (via digitization) the level of the perceived emotional state. The listener’s emotional perception was analyzed via a self-reported evaluation scale developed by the authors that assessed five measures: emotion identification (labeling), emotional valence (positive vs. negative), emotional arousal (active vs. relaxed), emotional intensity (strong vs. weak) and musical preference. These five measures were based on discrete (emotion identification) and dimensional (emotional valence, arousal, and intensity) models. Self-reported measures are widely used in studies on induced music emotion (Eerola & Vuoskoski, 2011; Gabrielsson & Lindström, 2001; Juslin & Västfjäll, 2008; Schubert, 2001). Based on the claim that emotion is a subjective means of communication with others, these measurement tools are considered to be effective for measuring and interpreting the personal experience of emotional response to music (Juslin & Laukka, 2003; Masson & McCarthy, 1995; Scherer, 2004; Watson, 2000).
The scope of this study was restricted to four basic emotions (happiness, sadness, anger, and fear). This was done to improve the study’s reliability in analyzing the patterns of music emotion response attributable to visual limitations by minimizing variables. Expert-verified music excerpts were used to induce specific emotions, particularly the four emotions selected for the study. Each emotion has exclusive properties (Eerola, 2010; Fritz et al., 2009; Nawrot, 2003; Resnicow et al., 2004; Schellenberg et al., 2000; Thayer & Faith, 2001); thus, the use of music excerpts is effective for analyzing the differences between the emotional responses of the VI and the NV groups. Considering these issues, the following research questions were developed:
Is there any difference between the VI and the NV groups in identifying intended music emotion?
Is there any difference between the VI and the NV groups in emotional valence, arousal, intensity, and musical preference?
Method
Participants
The study included adults with and without visual impairment, aged 20 to 40, residing in five provinces in South Korea. Participants voluntarily took part in the study and were guaranteed anonymity. The inclusion criteria were as follows:
Participants could have no hearing impairments.
Participants in the VI group were required to have official documentation of disabilities between levels 1 and 3. 1
Participants could have no disabilities other than visual impairment.
To determine the number of participants for the study, a t-test was used with a p-value of .05 and an effect size of 0.8. A minimum of 104 participants was necessary to satisfy these criteria. Taking the possibility of participants dropping out of the study into consideration, 120 participants were selected (60 in the VI group and 60 in the NV group).
Equipment
The experiment was carried out in secluded and soundproof spaces. The speaker used for listening to music (Model name: BOSE Soundlink) was placed in front of the participants. The music volume was set at an average level of loudness of 60 dBA by referring to measurements from a noise meter. This figure has been cited as an optimal volume for music listening (Evans, 2009; Ladinig, Honing, Hááden, & Winkler, 2009; Staum & Brotons, 2000). As employed in Vuoskoski and Eerola’s (2011) study, the participants were able to adjust the volume to levels that best suited them. The noise meter used was a JTS1357 model. It was placed on a wooden music stand at a height of 1.4 m, from the bottom of the stand to the floor. Both the music stand and the participants were 1.2 m from the speaker.
Music excerpts
Prior to this study, a pilot study was administered to select music excerpts. Initially 60 music excerpts (15 for each of the four emotions) were selected as a pool. Each of the music excerpts was 15–20 seconds long based on features such as phrasal structure, changes in harmony and length of motive. This was based on the results of a previous study by Bigand, Filpic, and Lalitte (2005), which found that 15 seconds of excerpted music was sufficient to induce a specific emotion. Additionally, music including vocals was excluded to prevent any emotional effects from lyrics (Zentner, Grandjean, & Scherer, 2008); therefore, only instrumental music was selected (Bigand et al., 2005). Among the musical selections, there were various types of performances, including solos, duets, ensembles, and orchestra performances, each of which included a broad variety of instruments, such as winds, strings, and percussion. In order to select excerpts to use for this study, experts in music psychology, music theory and music therapy rated the degree of suitability for inducing for the intended emotions. Among the initial 60 excerpts, 16 (four happiness, four sadness, four anger, and four fear excerpts) were selected. The intraclass correlation coefficient (ICC) was between .90 and .92.
Music emotion assessment tool
To measure emotional perception, the authors developed a music emotion assessment tool (MEAT) comprised of five measures: emotion identification, emotional valence, arousal, intensity and musical preference. Similar collections of measures have been employed by other researchers (Bradley & Lang, 1999; Eerola & Vuoskoski, 2011; Russell, 1980; Schubert, 2013; Yorke, 2001), with the study and assessment of music emotions by their bodies of work, forming a base of knowledge and references in the development of our own MEAT.
The measure of the discrete model of music emotion is emotion identification. The MEAT included four basic emotions (happiness, sadness, anger, and fear), and participants were instructed to choose the emotion that they thought matched the music (Eerola, 2010; Fritz et al., 2009). Questions related to the dimensional model of music emotion focused on emotional valence, arousal, and intensity. These were the general elements used to explain the dimensions of emotions in previous studies (Russell, 1980; Thayer, 1989; Vieillard et al., 2008; Xu, Jin, Luo, & Duan, 2008). This study applied them in a similar fashion, using a 9-point Likert scale. The grading scale of emotional valence was expressed in a range between very negative (-4) to very positive (+4), emotional arousal was graded from very relaxed (-4) to very active (+4), and emotional intensity was evaluated as being from very weak (-4) to very strong (+4; Eerola & Vuosloski, 2011; Gabrielsson & Lindström, 2001).
Prior musical preference was assessed, since previous studies have established that emotions induced by music are affected by the listener’s prior preference (Coffman, Gfeller, & Eckert, 1995; Radocy & Boyle, 1997; Robazza, Macaluso, & D’urso, 1994; Terwogt & Grinsven, 1991; Thaut & Davis, 1993). The 9-point Likert scale was also used to assess how much the listener liked the music ranging from strongly dislike (-4) to strongly like (+4). The reliability of the participants’ responses was determined by Cronbach’s alpha at .82, which exceeds the conventional threshold, 0.7 (Chang & Chuang, 2011; Gruber, Heinemann, Brettel, & Hungeling, 2010).
Current emotional state
Previous studies have shown that the listener’s current emotional state can impact how he/she perceives the emotion in music (Clements-Cortés, 2004; Tajadura-Jiménez, Pantelidou, Rebacz, Västfjäll, & Tsakiris, 2011). Therefore, participants were asked to indicate their current emotional valence and arousal on a 5-point Likert scale just before the experiment.
Procedure
The experiment was performed in three steps. First, the authors explained the objective of the study to compare the perception of music emotion between adults with and without visual impairment. Following the description and procedures of the study, participation consent was obtained. For the VI group, explanatory notes and consent forms in braille were printed under the supervision of a state-certified braille transcriber. Second, the participants filled out questionnaires which inquired about their current emotional state, valence and arousal. Lastly, the MEAT questionnaires for music excerpts were distributed and they were asked to fill them out for each music excerpt. A total of 16 music excerpts were played; however, prior to the actual experiment, two practice excerpts were given to help the participants understand how to respond to the music excerpts. The practice excerpts used were “Capriccio Italien” by Tchaikovsky and “Hungarian Dance No. 20” by Brahms. Music excerpts were played in random order. After each excerpt, participants marked the emotional valance, arousal, intensity and degree of their preference. After listening to all the excerpts, the participant answered a questionnaire of demographic information. The whole procedure for each participant lasted for about 30 minutes. The experiment was carried out individually.
Analysis
For data analysis, SPSS 21.0 was used to calculate descriptive statistics. An independent samples t-test was employed to examine differences between the VI and the NV groups with regard to emotion identification and emotional valence, arousal, intensity and musical preference. Additionally, a discriminant analysis was conducted to investigate how the predictor variables of emotional valence, arousal, and musical preference (except for intensity which the participants scored after identifying emotion) contribute to the participants’ emotion identification.
Results
Of the 120 participants, 42 (35%) were male and 78 (65%) were female. The age of the participants ranged from 20 to 40, with a mean age of 28.7 (SD = 21.1). There was no significant difference between the two groups regarding music activities, experience of playing instruments, and preference of musical genre. Regarding current emotional state, a homogeneity test was administered to see if there was any difference between the groups. It showed that there was no significant difference between them (p > .05).
Identification of intended music emotion
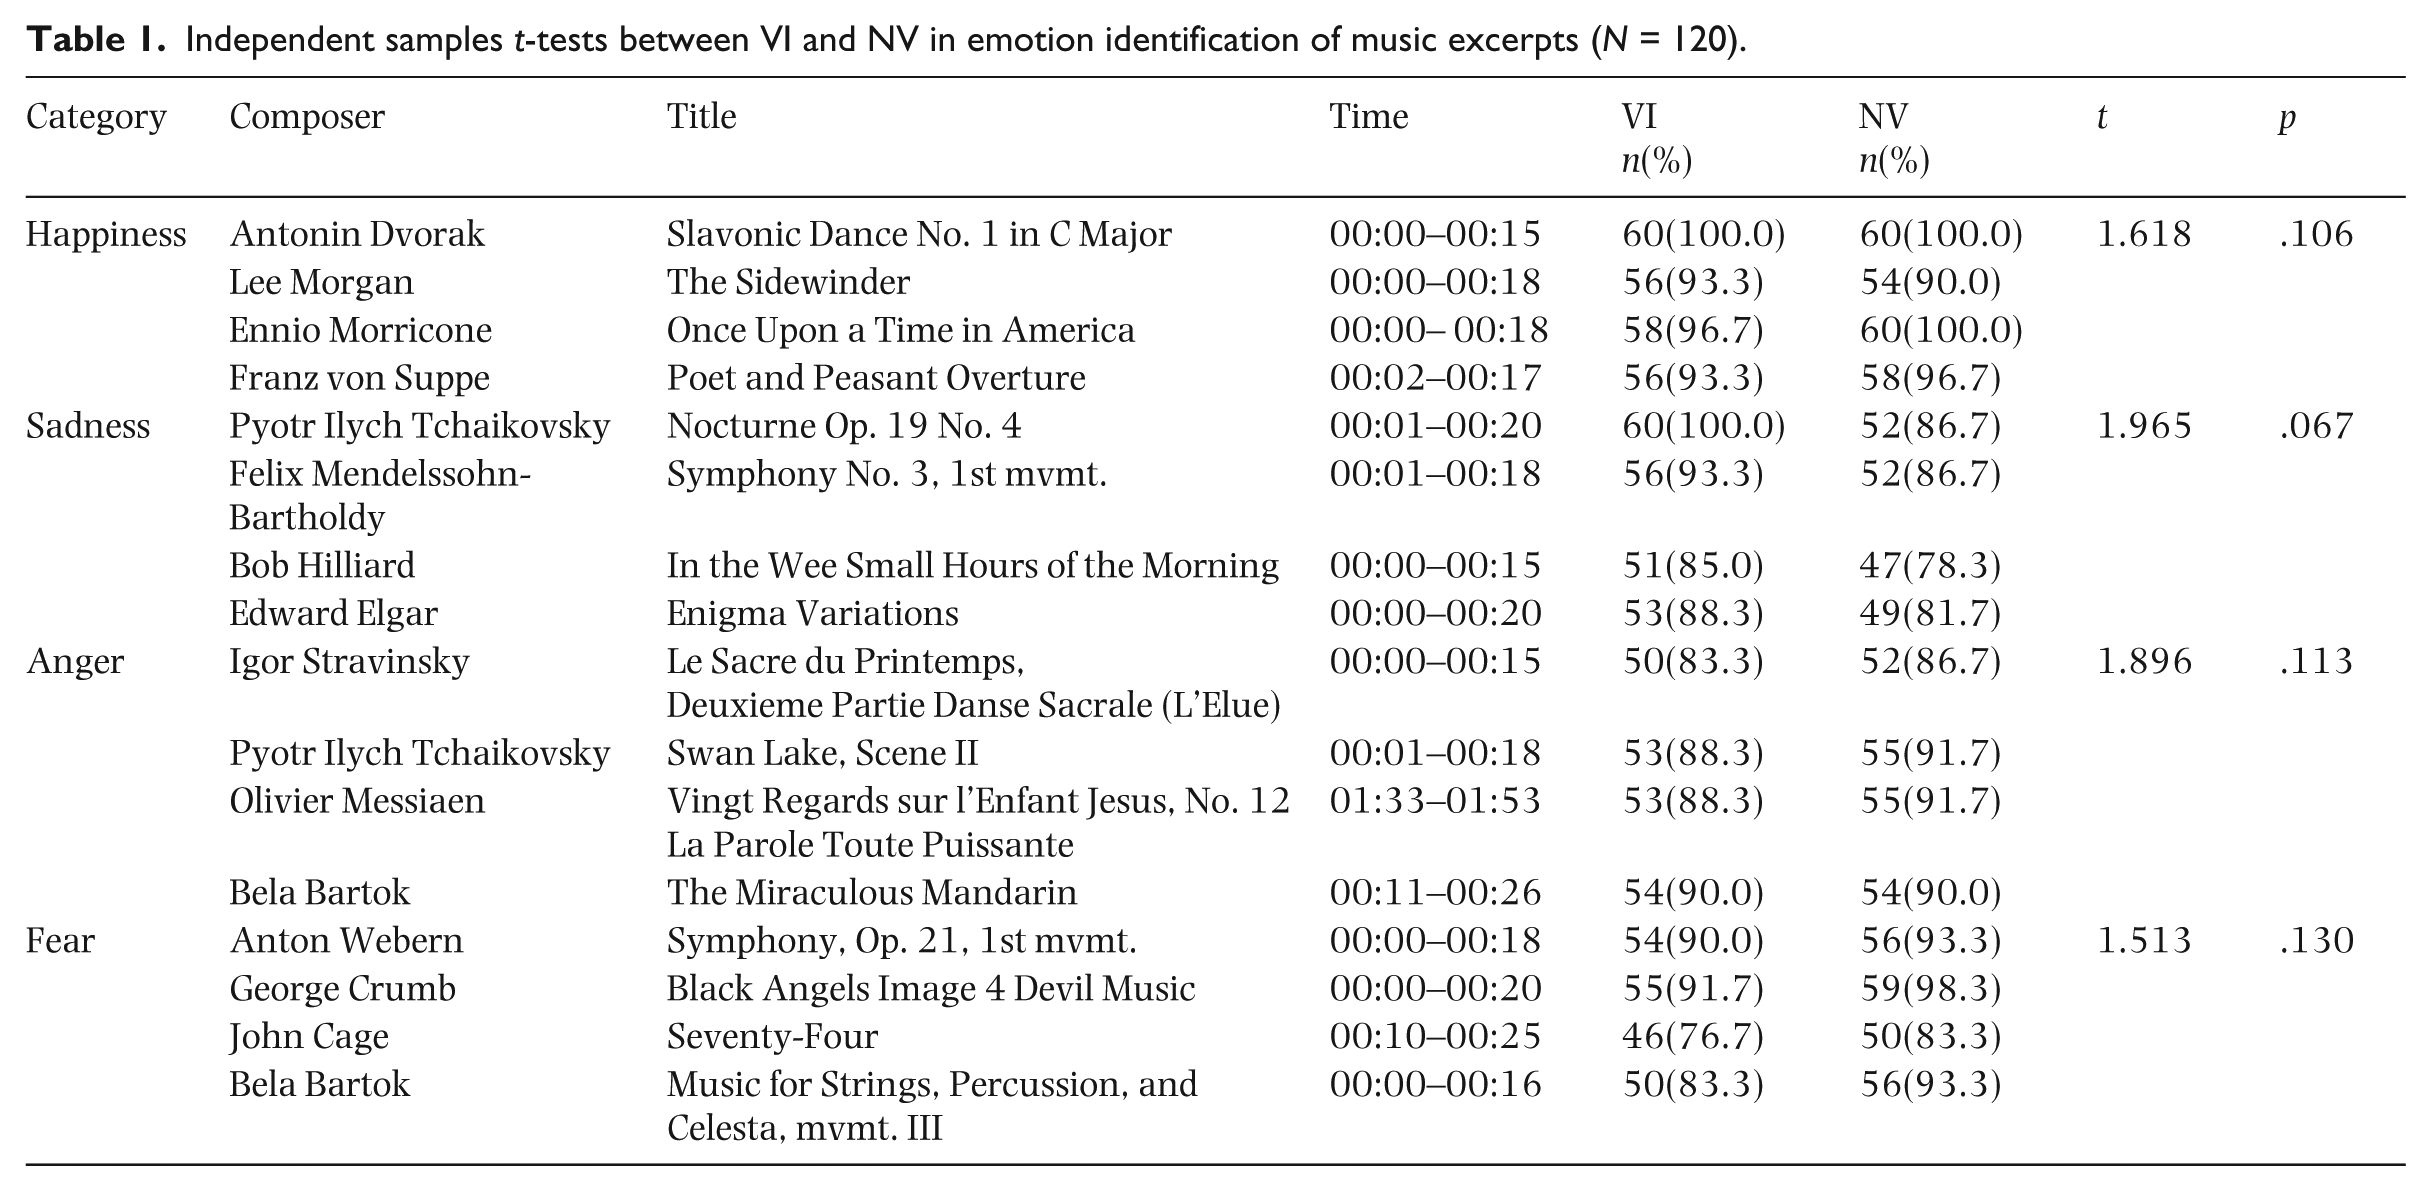
To examine the differences in how music emotion is perceived by the VI and the NV groups, five measures of emotional perception were investigated using the MEAT: emotion identification, emotional valence, arousal, intensity, and musical preference. The emotion identification results showed that there was agreement in the rating of four basic perceived emotions between the two groups; VI (happiness: 95.8%, sadness: 91.6%, anger: 87.4%, fear: 85.4%), NV (happiness: 96.6%, sadness: 83.3%, anger: 90.0%, fear: 92.1%). These results show that there was no significant difference in emotion identification between the two groups (see Table 1).
Independent samples t-tests between VI and NV in emotion identification of music excerpts (N = 120).
Emotional valence, arousal, intensity, and musical preference
The measures of emotional valence, arousal, intensity and musical preference differed significantly between the two groups (see Table 2). The average values of emotional valence for the VI were: happiness (6.59); anger (3.90); sadness (3.65); fear (2.54). For the NV group, the values were: happiness (6.95); sadness (4.03); anger (3.99); fear (2.62). The emotions of the two groups, in terms of valence, were statistically analyzed as follows. The emotions of “anger” and “fear” were perceived as negative and showed no significant difference between the two groups, while “happiness” was significantly positive in the NV group and “sadness” was significantly negative in the VI group. The intensity of sadness (7.73) for the VI group was the strongest, followed by happiness (6.92), anger (5.57), and fear (5.35). For the NV group, that of fear (7.22) was the strongest, followed by happiness (7.13), anger (6.82), and sadness (5.85).
Independent t-tests between VI and NV in emotional valence, arousal, intensity, and preference according to types of emotion (N = 120).

p < .05; **p < .01; ***p < .001.
There were significant differences between the two groups; the intensity of the VI group was significantly higher in “sadness”, while that of the NV group was significantly higher in the other three emotions. Emotional arousal for the VI group scored as follows: happiness (6.32); sadness (6.30); anger (5.46); fear (5.15). For the NV group, the order was: happiness (6.70); fear (6.08); anger (6.01); sadness (4.95). Examining the differences between the two groups, the arousal of the VI group was significantly higher in “sadness”, while that of the NV group was significantly higher in the other three emotions. Preference results for the VI group were as follows: sadness (7.27); happiness (6.80); anger (3.40); fear (2.14). For the NV group, they were: happiness (7.15); sadness (5.68); anger (4.19); fear (3.04). Although “happiness” was more preferred among the NV, there was no significant difference between the two groups. The VI’s preference for “sadness” was significantly higher, whereas the NV’s preferences for “anger” and “fear” were significantly higher. To summarize, there were no significant differences between the two groups in emotion identification.
Regarding emotional valence, arousal, intensity and preference, the authors first used descriptive statistics to rank the four emotions for each group in each measure. The VI group had the highest levels of “sadness” in emotional intensity (7.73) and preference (7.27); the NV group showed high levels of emotional intensity for “fear” (7.22) and preference for “happiness” (7.15). This provided grounds for inferential statistical analysis when comparing both groups within each measure. The emotional valence showed that “happiness” and “sadness” significantly differed between both groups, while “anger” and “fear” showed no significant difference. As for the measures of arousal and intensity, both groups showed significant differences in all four emotions. The VI group was significantly higher in “sadness”, whereas the NV group was significantly higher in the other three emotions. For musical preference, both groups differed in all emotions except for “happiness”.
Discriminant analysis
A discriminant analysis was performed to determine the extent to which each measure (valence, arousal, and preference) exerted influence on emotion identification. The parameter of emotional intensity was excluded from the predictor variables of discriminant analysis because the participants indicated their felt intensity after their identification. The independent variables (valence, arousal, and preference) in the discriminant analysis were measured as interval variables, and the dependent variable (identification) as a categorical variable.
In order to carry out the discriminant analysis, the independent variables constitute a multivariate normal distribution as a precondition; the mean difference between the two groups appears in the identification of the four emotions, and variance-covariance matrices of the groups, which are categorized by the dependent variable, should be the same. To ensure that the prerequisite is satisfied, the authors revealed the significant mean differences through Wilks’ lambda, which is the dispersion ratio of population and F-value (Wilks’ lambda = .235, F = 21.665, p < .001). In addition, based on the results of Box’s M test for the homogeneity test of the covariance matrix, the assumption that the covariance matrix is equal could not be dismissed (Box’s M = 15.526, p >. 05); therefore, the multivariate approaches were satisfied. All the prerequisites for the discriminant analysis were met, and the discriminant analysis was carried out with simultaneous estimations.
Through the discriminant function, the authors were able to identify the extent to which the variables affect the discriminant score. The absolute value of the discriminant coefficient portrayed the correlation between the variables. In terms of emotion identification, the VI group showed discriminant scores of preference (W3) > valence (W1) > arousal (W2). Discriminant scores for the NV group showed valence (W1) > preference (W3) > arousal (W2) (see Table 3). Relatively high values for valence and preference were seen in both groups, in addition to relatively low values for arousal. However, preference was the most influential variable for the VI group when identifying emotion, whereas valence was the largest factor for the NV group. The discriminatory power of the function was determined using Wilks’ lambda and χ² (VI: Wilks’ lambda = .057, χ²(9) = 675.041, p < .001; NV: Wilks’ lambda = .097, χ²(9) = 549.760, p < .001), therefore, the discriminant function proved to be useful.
Discriminant functional formula for the VI and the NV.

Note. Discriminant score Z: Emotional identification; Discriminant coefficient W1: Valence, W2: Arousal, W3: Preference.
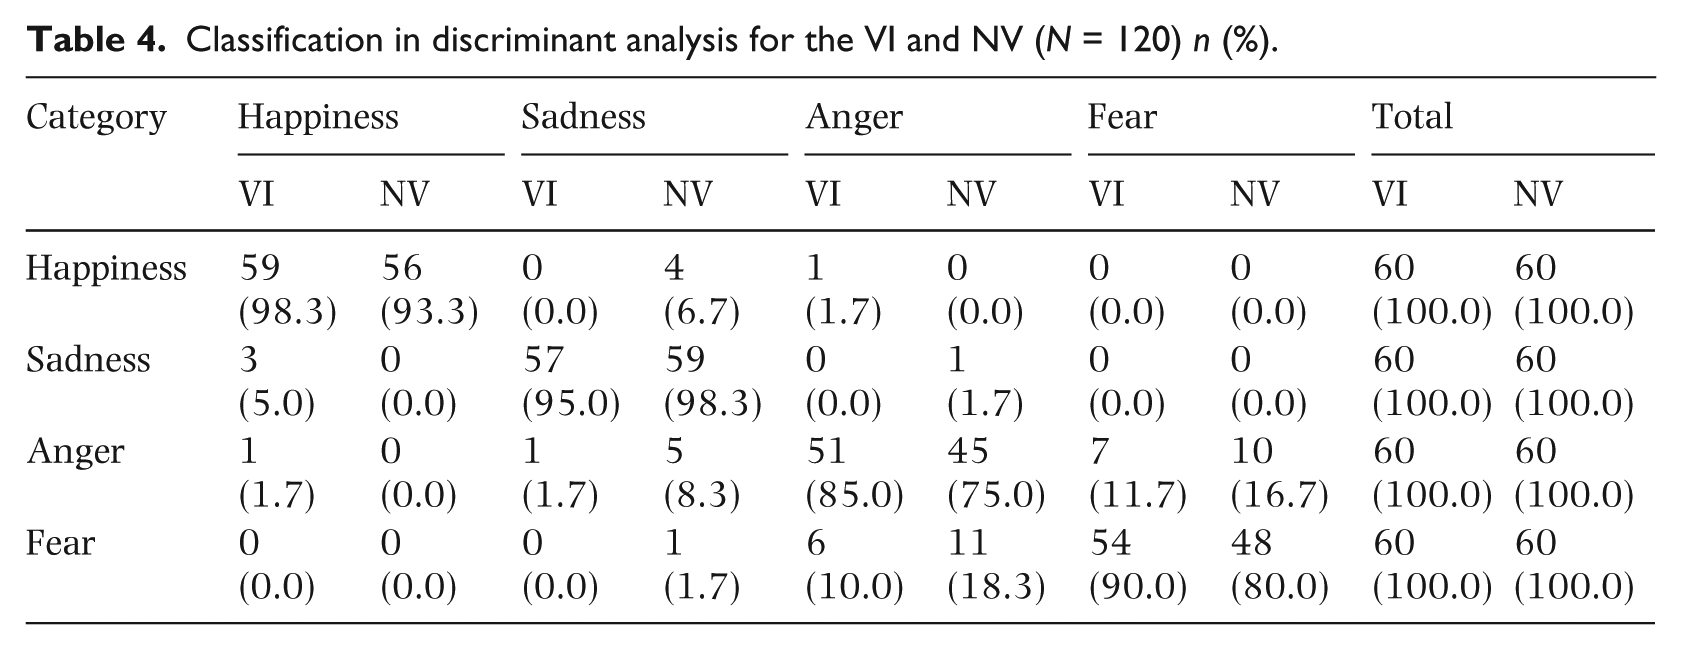
In the results of the discriminant function classification, each of the four emotions was clearly categorized as shown in Table 4 (happiness: 98.3% of the VI group and 93.3% of the NV group; sadness: 95.0% of the VI group and 98.3% of the NV group; anger: 85.0% of the VI group and 75.0% of the NV group; fear: 90.0% of the VI group and 80.0% of the NV group). However, there were misclassifications in anger and fear when identifying emotion. For the VI group, 78% of misclassifications in “anger” were categorized as “fear”, and 100% of misclassifications in “fear” were categorized as “anger”. For the NV group, 67% of misclassifications in “anger” were categorized as “fear”, and 92% of misclassifications in “fear” were categorized as “anger”.
Classification in discriminant analysis for the VI and NV (N = 120) n (%).
Discussion
From this analysis of the perception of music emotion, we can conclude first that there was no significant difference between groups in emotion identification. This result indicates that visual impairment does not affect a person’s ability to identify the intended emotion in a piece of music. This coincides with previous studies (Balkwill & Thompson, 1999; Grewe, Nagel, Kopiez, & Altenmüller, 2007; Juslin & Sloboda, 2013) showing that music has universal characteristics, which allow for a particular emotion to be identified correctly regardless of the presence or absence of visual impairment.
Second, there was a clear contrast between the two groups in emotional valence, arousal, intensity, and musical preference, most notably in “happiness” for the NV group and “sadness” for the VI group. According to Park and Chong (2015), “happiness” and “sadness” have relatively strong intrinsic characteristics, demonstrating that the inner representations of the two emotions are closely related to musical stimuli (Kwon, 2008). The results showed that “happiness” and “sadness” are thus more easily induced emotions than “anger” and “fear” (Juslin & Laukka, 2004). In the majority of ratings for emotional categories, average ratings were higher for the NV group than for the VI group. However, this pattern was reversed for “sadness” (except for valence). The VI group indicated that they not only feel sadness with more intensity but also feel more aroused. Their preference rating for sadness was also higher than that of the NV.
Although sadness is generally viewed as a “negative emotion” (Huron, 2011), music intended to induce sadness can create a sense of kinship with the listener and evoke feelings of strong empathy and gratification. Sadness is generally conceptualized through experiences in life (Ungerer, 1995). It is felt through social interactions (Cooley, 1992) and can be described as a loss or discouragement (Kim, 2008; Lee & Hwang, 2003). One can speculate that this sense of loss and frustration can be linked to the various difficulties and limitations often faced by the VI group due to their impairment (Gold, Shaw, & Wolffe, 2010; Jindal-Snape, 2004; López-Justicia & Pichardo, 2001; Wagner, Newman, Cameto, Garza, & Levine, 2005). When this inner sadness of people with visual impairment is induced by sad music, sadness can be perceived on a magnified scale; thus, their reaction to sad music is intensified (Gabrielsson, 2002).
Also, sad music can amplify and appeal to the inner emotion of the listener, which in turn increases the listener’s preference for that music (Levinson, 1982; Murry & Dacin, 1996; Schubert, 1996). The characteristics of how the VI group respond to sadness can be seen in a previous study, by comparing how totally blind and normally sighted college students verbally describe their respective reactions to hearing music excerpts (Park, Chong, & Park, 2015). Analysis showed that students with visual impairment use words associated with sadness more often than their peers with normal vision. They also said that if their anger was not addressed and solved, the emotions would eventually morph into sadness. This is another example of the VI group’s tendency to react more strongly to sadness.
Third, significant differences were found between the two groups regarding “anger” and “fear”, which are affected by external stimuli and thought to be dependent on the degree of visual experience (Jessup, Cornell, & Bundy, 2010). There was a difference in the emotional intensity of “fear”, which is triggered by external stimuli rather than by the intrinsic characteristics. This result supports previous studies (Chung & Chung, 2014), which suggest that fear has an elevated level of visual inclination. Fear is perceived considerably through visual cues such as facial expressions, behaviors, scenes, images, symbols, and pictures of certain animals including snakes, spiders, or lizards (De Gelder, Pourtois, & Weiskrantz, 2002; Öhman & Mineka, 2001). Even if the NV group had not previously listened to the music excerpt before, they were still able to mentally draw out images that corresponded to fear (Bishop et al., 2007). Fear, which the VI group experienced through verbal and textual information, and other senses, except for vision, had a lower level of emotional clarity compared to that of the NV group. The emotional intensity, arousal, and preference for anger and fear for the VI group were also significantly low according to the results of the present study, while the NV group reported significantly high scores.
Unlike happiness or sadness, which one can feel internally without external stimuli, the deliberate inducement of anger and fear is strongly dependent on external stimuli, since these emotions are difficult to internalize (Kwon, 2008). While happiness and sadness are easily elicited, there is a difference in the degree of anger and fear that listeners feel, though both groups could still perceive whether the music conveyed those two emotions (Juslin & Laukka, 2004). In contrast with the cases of happiness and sadness, perceptions of anger and fear exhibited notable differences not only in emotional intensity but also in the emotion-inducing mechanism of the relevant music.
The music emotion assessment tool (MEAT) and the discriminant function showed that there were similarities between the intensity and arousal of “anger” and “fear” within each of the two groups. In the MEAT, the VI and the NV groups showed low values in the degree of congruence of emotion identification in those two categories compared to the categories of “happiness”and “sadness”. Further, in the discriminant analysis, the results of misclassification showed that in over 84% of misclassifications of the two emotions, “fear” was identified as “anger” and vice versa. This supports the previous studies’ findings, which indicated that it is difficult to identify the two emotions when listening to music (Chong, Jeong, & Kim, 2013; Darrow, 2006; Kreutz, Schubert, & Mitchell, 2008) because these two emotions commonly occur in the amygdala (Scott et al., 1997).
Fourth, according to the result confirmed by the coefficient of the discriminant function, which indicates how much emotional valence, arousal, and preference exerted influences on identifying emotions, preference had the greatest impact in identifying emotions for the VI group, whereas it was valence for the NV group. This coincides with previous findings wherein the most influential measures to identify emotions were valence and preference (Schellenberg, Peretz, & Vieillard, 2008). With regard to valence and preference, it was reported that music which expressed or induced unpleasant emotions could be preferred (Schubert, 1996), and that listeners often enjoyed listening to music expressing “negative” emotions such as sadness, gloom, anger or distress (Levinson, 1982; Murry & Dacin, 1996; Schubert, 1996). The results of the above studies were supported by findings of the present study, which confirmed that the VI group scored the highest value in the preference for sadness in music, despite the comparatively lower value in the valence for that emotion.
Lastly, between the discrete model (identification) and the dimensional model (valence, arousal, and intensity), the latter was more informative in showing the perception of music emotion of people with visual impairment. Both groups demonstrated a high congruence rate in emotion identification when using the discrete model, indicating that the group differentiation could not be shown. This is because the traits of certain musical components induce specific emotions, regardless of the listeners’ visual experience or lack thereof.
On the other hand, using the dimensional model, the differences among emotional valence, arousal and intensity were compared. The comparison indicated that the differences between both groups were statistically significant. These group differences indicate that the emotion response measures were greater when the dimensional model was used. It showed the characteristics of the perception of music emotion for people with visual impairment.
One limitation of this study was that convenience sampling was used, rather than random sampling, due to practical difficulties. If random sampling had been used, it could have provided a firmer basis for the study’s conclusions since it would have better represented visually impaired people. More parallel sampling between two groups and regional balance would be helpful.
Another limitation was in the self-reporting method. The present study was performed to investigate the perception of music emotion; thus, all variables used in the study were measured using the self-reporting method. The drawback of the self-report is subjectivity. Therefore, any form of objective quantifiable measurements of emotional response to music in future studies may add more weight to the findings. This indicates that there is a great need to develop more objective measurement methods for music emotion studies.
Footnotes
Acknowledgements
The role of the authors in this study is as follows: Hye Young Park – first author, experimental procedure, critical discussion, manuscript writing; Hyun Ju Chong – corresponding author, interpretation of the results, manuscript writing.
Funding
The author(s) received no financial support for the research, authorship, and/or publication of this article.
Ethical approval
Ethical approval for this project was given by Institutional Review Board of Ewha Womans University [IRB No. 86-12].