
Abstract
Kinetic curves describing the processes of vulcanisation and pore formation of foam rubbers based on nitrile butadiene rubbers were studied. The curves were obtained using a D-MDR 3000 rheometer (MonTech) equipped with MonControl analytical software, which makes it possible, simultaneously with the measurement of the torque and tg δ, to determine the pressure in the chamber. The rubber compounds were noted for different stearic acid contents. The results of quantitative interpretation of the kinetic curves of processes of vulcanisation and pore formation in elastomeric materials are presented. Mathematical models for approximation of the curves of vulcanisation and pore formation, distinguished by high goodness of ft, are proposed. The relationship between the parameters of the models and the vulcanisation characteristics and the parameters of pore formation is established. The influence of the stearic acid content on processes of formation of the porous structure of foam rubbers based on blends of nitrile butadiene rubbers containing 27–30 wt% acrylic acid nitrile and polyvinyl chloride is shown.
Keywords
The production of non-moulded porous rubber products by the continuous method is widely used in the rubber industry. The formation of a porous structure in rubber compounds occurs as a result of a combination of physicochemical processes accompanying the formation of the three-dimensional structure of the vulcanisates and thermal breakdown of the pore-forming agents with the release of gaseous products.
The formation of a porous structure in vulcanisates has a number of specific features. Above all, the nature of the pores formed and the properties of the porous rubbers depend on the ratio of the rates of vulcanisation and pore formation [1,2]. It must be borne in mind that, if the pore formation rate does not keep pace with the vulcanisation rate, then rubbers with fine pores and with increased density, rigidity, and residual strain are obtained, while the surface of the article is noted for the presence of a thick outer film. In the case of the vulcanisation rate lagging behind, a non-uniform porous structure is formed, and because of the thin outer film a degree of deformation of the surface through its partial incomplete vulcanisation is observed, and there is an increase in residual strain. Therefore, when choosing the formulation of rubbers and the production process parameters, it is preferable to ensure that pore formation occurs in the initial period of vulcanisation, and that vulcanisation ends quickly after the formation of pores so that their walls do not collapse.
It must be pointed out that, in recent time, there have been practically no studies of pore formation in elastomeric materials. And there has been absolutely no mathematical description of the kinetics of pore formation in the Russian literature, with the exception of Dvornikov et al. [3], nor any comparison with the vulcanisation kinetics of rubber mixes. Earlier [4], we tested a procedure for approximating kinetic curves when describing processes of vulcanisation of non-porous rubbers. Such analysis of rheometric curves makes it possible effectively to solve problems associated with the modelling of the vulcanisation process, and also to monitor and control the processes of mixing and vulcanisation.
As the production of foam rubbers is accompanied with the occurrence of two processes – the formation of a vulcanisation network and the breakdown of the blowing agent, the kinetics of formation of such materials is described using two kinetic curves – the curves of vulcanisation and pore formation. Here, the mechanism of change in the viscous flow, elastic, and high-elastic properties of the elastomer matrix differs from that of non-porous materials. In view of this, rheometric investigations of the processes of vulcanisation and pore formation were conducted from the viewpoint of seeking mathematical models that with high goodness of ft would describe the processes indicated, while their parameters could be interpreted on the basis of physicochemical concepts [5].
At present, for effective monitoring and control of the processing of elastomeric materials, different production process analysers are widely used in the rubber industry. In the present work, in the solution of problems associated with the development of formulations for porous elastomeric thermal insulation materials and with the quality control of products, vulcanisation and pore formation processes were investigated using a rotorless D-MDR 3000 rheometer (MonTech) equipped with MonControl analytical software [6].
The investigation was conducted on elastomer foam materials based on blends of home-produced nitrile butadiene rubber (content of bound acrylic acid nitrile 27–30 wt%) and polyvinyl chloride. Rubber compounds based on nitrile butadiene rubbers (NBRs) are needed in different sectors of modern industry owing to their optimum combination of mechanical characteristics ensuring efficient operation of NBR-based products in a fairly wide range of temperatures and media [6], to the extensive range of different grades of rubbers produced by domestic enterprises, and to attractive economic indices.
By way of example,
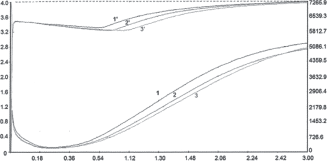
The kinetic curves of vulcanisation and pore formation for porous elastomeric materials based on NBR (stearic acid content per 100 parts rubber: 1, 1′ – 1.0 part; 2, 2′ – 0.75 parts; 3, 3′ – 0.5 parts). Left-hand vertical axis: S′, dN m; Right-hand vertical axis: p, kPa; Horizontal axis: τ, min
Rheometers for monitoring the processes of mixing and vulcanisation make it possible to describe the vulcanisation kinetics as dependences of components of the complex response function of torque S*, the elastic torque S′ and the viscous torque S″, and also the phase angle tangent tg δ on the duration of vulcanisation [2,4]. In the present work, the kinetics of the vulcanisation process was investigated on the basis of an analysis of the time dependences of torque S′ according to GOST R 54547–2011.
The kinetic curves of the vulcanisation process were compared by determining the combination of vulcanisation characteristics such as the minimum torque (S′min), the maximum torque (S′max), and the torque increment (ΔS′), the times of achievement of degrees of completion of the process of 10, 50, and 90% – tc(10), tc(50), tc(90), and the rate of the process (
The quantitative characteristics of vulcanisation and pore formation processes
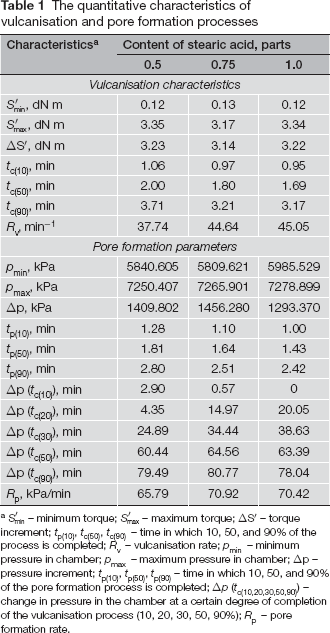
S′min – minimum torque; S′max – maximum torque; ΔS′ – torque increment; tp(10), tc(50), tc(90) – time in which 10, 50, and 90% of the process is completed; Rv – vulcanisation rate; pmin – minimum pressure in chamber; pmax – maximum pressure in chamber; Δp – pressure increment; tp(10), tp(50), tp(90) – time in which 10, 50, and 90% of the pore formation process is completed; Δp (tc(10 20 30 50 90)) – change in pressure in the chamber at a certain degree of completion of the vulcanisation process (10, 20, 30, 50, 90%); Rp – pore formation rate.
The D-MDR 3000 rheometer makes it possible, simultaneously with torque measurement, to determine the pressure in the chamber (
Analysing the influence of the stearic acid content on the nature of the rheometric curves (
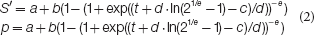
For quantitative interpretation of the kinetic curves of vulcanisation and pore formation, we selected two mathematical models [5].
The dependence of the torque S′ and the pressure in the chamber p on time t can be characterised by a four-parameter model (8013 in the Table Curve 2D program catalogue):

and a five-parameter model (8092 in the Table Curve 2D program catalogue):
The quality criteria of models (1) and (2) were calculated. By way of example,
The quality criteria of models 8013/8092 a
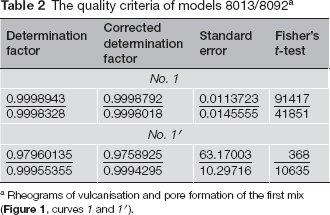
Rheograms of vulcanisation and pore formation of the first mix (
It was established that, to describe the process of pore formation in all three mixes, it is most expedient to use model (2), which is noted for a better goodness of fit according to indices such as the determination factor, the standard error, and Fisher's variance ratio.
The parameters of model 8092 when describing rheograms of vulcanisation/pore formation a
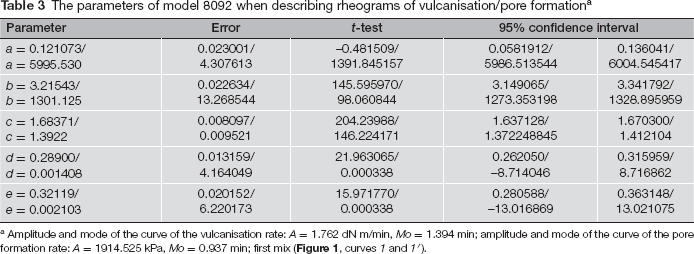
Amplitude and mode of the curve of the vulcanisation rate: A = 1.762 dN m/min, Mo = 1.394 min; amplitude and mode of the curve of the pore formation rate: A = 1914.525 kPa, Mo = 0.937 min; first mix (
In interpretation of the kinetic curves, models (1) and (2) were chosen because of their high goodness of fit, but mainly, as shown elsewhere [4,5], because the parameters of the studied models have a physical significance and are related to the vulcanisation characteristics.
In model 8013 (1), parameter a is numerically equal to the minimum torque S′min. Parameter b corresponds to the torque increment ΔS′. Parameter c is equal to the median Md = tc(50), i.e. the time when 50% of the vulcanisation process has occurred. In order to gain some idea of the essential nature of parameter d, it is expedient to find an expression for the degree of vulcanisation β = (S′ – a) using model (1):

Using 0.9 and 0.1 in place of β in expression (3), we will obtain

and hence

In model 8092 (2), all the parameters are positive. In this case, it is assumed that at t = 0 the torque S′min = a. Given the above analysis of the reproducibility of the rheometric curves, this assumption is justified.
On such an assumption, b = ΔS′ = S′max – S′min, c = tc(50),
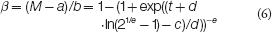
The expression for parameters d and e is as follows:

According to experimental data on vulcanisation characteristics and pore formation parameters and the results of approximation of the rheograms using equations (1) and (2), by way of example
The parameters of model 8092 when describing the rheograms of vulcanisation and pore formation
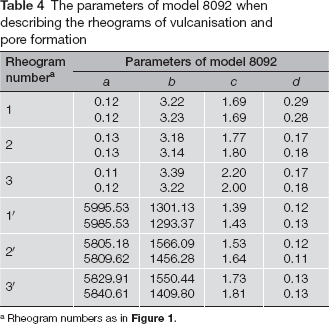
Rheogram numbers as in
The divergence of the parameters of equation (2), calculated on the basis of experimentally determined vulcanisation characteristics and pore formation parameters, amounts to no more than 10% compared with the calculated values of the parameters; this can be considered to be acceptable if the reproducibility of the rheograms is taken into account.
In this way, the possibility of interpreting the kinetic curves of the process of vulcanisation and pore formation of foam materials with the use of models (1) and (2) has been shown. Analysis of the results of determining the parameters of the given models when describing the kinetics of pore formation and their comparison with the proposed parameters of pore formation has shown that the relations given above can be used in the interpretation of rheograms of pore formation processes in rubber mixes. The obtained results may be useful when selecting the process parameters for the vulcanisation of elastomer foam materials.