
Abstract
This article presents a method for incorporating the effect on expected annual energy production of a wind farm caused by asymmetric uncertainty distributions of the applied losses and the nonlinear response in turbine production. The necessity for such a correction is best illustrated by considering the effect of uncertainty in the oncoming wind speed distribution on the production of a wind turbine. Due to the shape of the power curve, variations in wind speed will result in a skewed response in annual energy production. For a site where the mean wind speed is higher than 50% of the rated wind speed of the turbine (in practice all sites with sufficiently high wind speed to motivate the establishment of a wind farm), a reduction in mean wind will cause a larger reduction in annual energy production than a corresponding increase in mean wind would increase the annual energy production. Consequently, the expected annual energy production response when considering the uncertainty of the wind will be lower than the expected annual energy production based on the most probable incoming wind. This difference is due to a statistical bias in the industry standard methods to calculate expected annual energy production of a wind farm, as implemented in tools in common use in the industry. A method based on a general Monte Carlo approach is proposed to calculate and correct for this bias. A sensitivity study shows that the bias due to wind speed uncertainty and nonlinear turbine response will be on the order of 0.5% – 1.5% of expected annual energy production. Furthermore, the effect on expected annual energy production due to asymmetrical distributions of site specific losses, for example, loss of production due to ice, can constitute additional losses of several percent.
Keywords
Introduction
Wind resource assessment is a field that is constantly improving as more research, methodology development, new measurement techniques and computational capacity open up new possibilities and increase the quality of wind farm yield estimates. However, experience still shows a systematic over-prediction of average wind farm yield on the order of
These effects are typically not accounted for in the current industry standard methods for calculating the expected annual energy production (AEP) of a wind farm (Clifton et al., 2016). In common industry-standard tools (such as WindPRO, WindSim and WindFarmer), the gross energy yield of each wind turbine is calculated based on the expected wind regime at the location of the turbine. Furthermore, it is common to assume that all losses (e.g. availability, wake losses and ice losses) that enter the yield estimation assume their modal value and that any uncertainty is treated as Gaussian uncertainty around an expected P50 value of AEP. In doing so, the distributions of the input parameters and the turbine response thereof are not accounted for. The consequence of this is that if either the distribution of the input parameter or the turbine response is asymmetrical, this assumption will lead to AEP estimates that deviate significantly from an estimation where these asymmetries have been taken into account. The intuitive reason for this is that the mean and mode of a probability distribution coincide only if the distribution is symmetric. Consequently, any form of asymmetry induces a bias.
There are different methods available for treatment of the asymmetries in the distribution of the AEP. Lackner et al. (2007) have presented an analytical framework for handling the nonlinear relationship between uncertainties in the wind regime and in AEP uncertainty; however, the method does not consider the bias the asymmetries introduces in the AEP itself.
Due to the nonlinearities, Monte Carlo applications are ideal for quantifying how uncertainties impact the bias and distribution of the AEP. Several studies using Monte Carlo methods are found in the literature; however, the resulting AEP distributions in these studies deviate significantly. Some authors (e.g. Gaß et al., 2011) confirm the misconception that the AEP is generally normally distributed, while others (Hrafnkelsson et al., 2016; Jung et al., 2013) report that the AEP distribution is skewed so that the probabilistic estimate is higher than the deterministic. Others again (Afanasyeva et al., 2016; Lund, 2015; Ucar and Balo, 2009) report that the AEP distribution is skewed towards lower production.
According to Mortensen et al. (2012), a framework for estimation and calculation of uncertainty must be ‘established, disseminated and employed’. Efforts have been made, for example, by a group of companies in the wind industry (DVN KEMA, 2013). The framework presented categorizes losses and uncertainties and mentions briefly that losses (or biases) due to the nonlinear relationship between wind speed and energy should be considered. However, the framework still describes losses and uncertainties as two different aspects. As common methods in use in the industry today do not consider uncertainty when estimating the AEP, we will refer to that as a deterministic estimate. When uncertainties and their distributions are considered in the AEP estimate, we will refer to this as a probabilistic estimate.
As wind turbine technology develops, we see that the capacity factor of new wind farms increase (Weir, 2015). This reduces the difference between the mean wind speed and rated wind speed of the turbines, causing the difference between probabilistic and deterministic estimates to increase. Thus, we believe that it is of utmost importance that methods for calculating the insintric bias caused by the nonlinear relationships between wind speed and energy are implemented in the industry standards. This article presents a simple yet rigorous methodology for estimating the probabilistic AEP of a wind farm.
Using the methods proposed in this article, this bias effect is found to be on the order of
Description of concept
As outlined in section ‘Introduction’, taking into account asymmetrical sources of uncertainty of the input parameters in AEP estimation can lead to pronounced bias effects when compared to basing the AEP estimation on the modal values of the input parameters alone. In this section, we detail the origin of asymetrical uncertainty sources and discuss their influence on AEP estimation. Furthermore, we present generic estimation approaches that take these asymmetries into account when estimating AEP.
Types of asymmetric uncertainties
Generally speaking, there are two types of asymmetries in uncertainty distributions.
The first type originates in the nonlinear relation between input and output parameters. The most obvious example is the effect on AEP due to uncertainty in mean wind speed at site. According to DVN KEMA (2013), these uncertainties fall in category 1 through 5 (Site measurement, Historic Wind Resource, Vertical Extrapolation, Future Wind Variability and Spatial Variation) and generally contribute to a majority of the total uncertainty (Afanasyeva et al., 2016; Mortensen et al., 2012). The most common assumption is to base the yield assessment directly on the modal value for mean wind speed. However, due to the logistic shape of the power curve, linear variations in mean wind speed at the site will result in a nonlinear response in AEP. At sites where the mean wind speed is higher than
The second type originates in skewed and/or truncated loss distributions. As a consequence, extreme values on one tail are receiving larger probability mass and are thus more likely to occur. Such symmetric uncertainty distributions arise whenever there is a physical (or practical) limit in either direction of the input domain. This can be, for instance, ice loss where the loss distribution is truncated to the right at 0; or production-based turbine availability in the warranty period where the uncertainty distribution can be truncated to the left at the warranty level if the risk is mitigated contractually. An exemplary illustration of how these asymmetries introduce a bias is given in Figure 1 where the induced (relative) bias is defined as the ratio between mean and mode of the asymmetric uncertainty distribution.

Exemplary illustration of bias effects due to asymmetric distributions: (a) skewed normal distribution and (b) truncated normal distribution.
Bias calculation with Monte Carlo methods
In this section, we present a general approach based on Monte Carlo methods to take the two types of asymmetries into account when estimating AEP. In both cases, we base our approach on the fact that an integral with respect to some suitably defined probability distribution F can be accurately approximated by a sample average of random variables drawn from the distribution of interest. As we are interested in the mean of some distribution F over its domain Ω we approximate the integral

with the Monte Carlo sum

where
A Monte Carlo approach has many desirable characteristics in the problem setting considered here. Most prominently, when calculating the bias which is due to nonlinear turbine response functions, the advantage is that a precise mathematical formulation of the asymmetry considered is not required and that it can be defined implicitly. Similarly, when dealing with asymmetries due to skewed and/or truncated AEP loss distributions, a Monte Carlo approach allows for a very general specification of the uncertainty distribution which would otherwise be impossible to integrate in closed form. All that is required is that one may generate random draws from the distribution of interest.
Implementation and discussion
In this section, we detail the implementation of each step of our suggested Monte Carlo estimation approaches and discuss the sensitivity of the bias estimates with respect to variations in the key input parameters.
Implementation
Calculating bias effects due to nonlinear response
In the case of asymmetric uncertainty distributions due to nonlinear turbine response functions, we suggest to calculate the bias via the following Monte Carlo algorithm:
Define the distribution of the mean wind speed at site. For the remainder of the article, we assume a Gaussian distribution for mean wind speeds with mean
Generate an independently and identically distributed sample of size N of mean wind speeds
For each

where
For each
Denote by

Panel (d) of Figure 2 shows the bias effect as calculated by the above Monte Carlo algorithm for an onshore wind farm with measured mean windspeed of
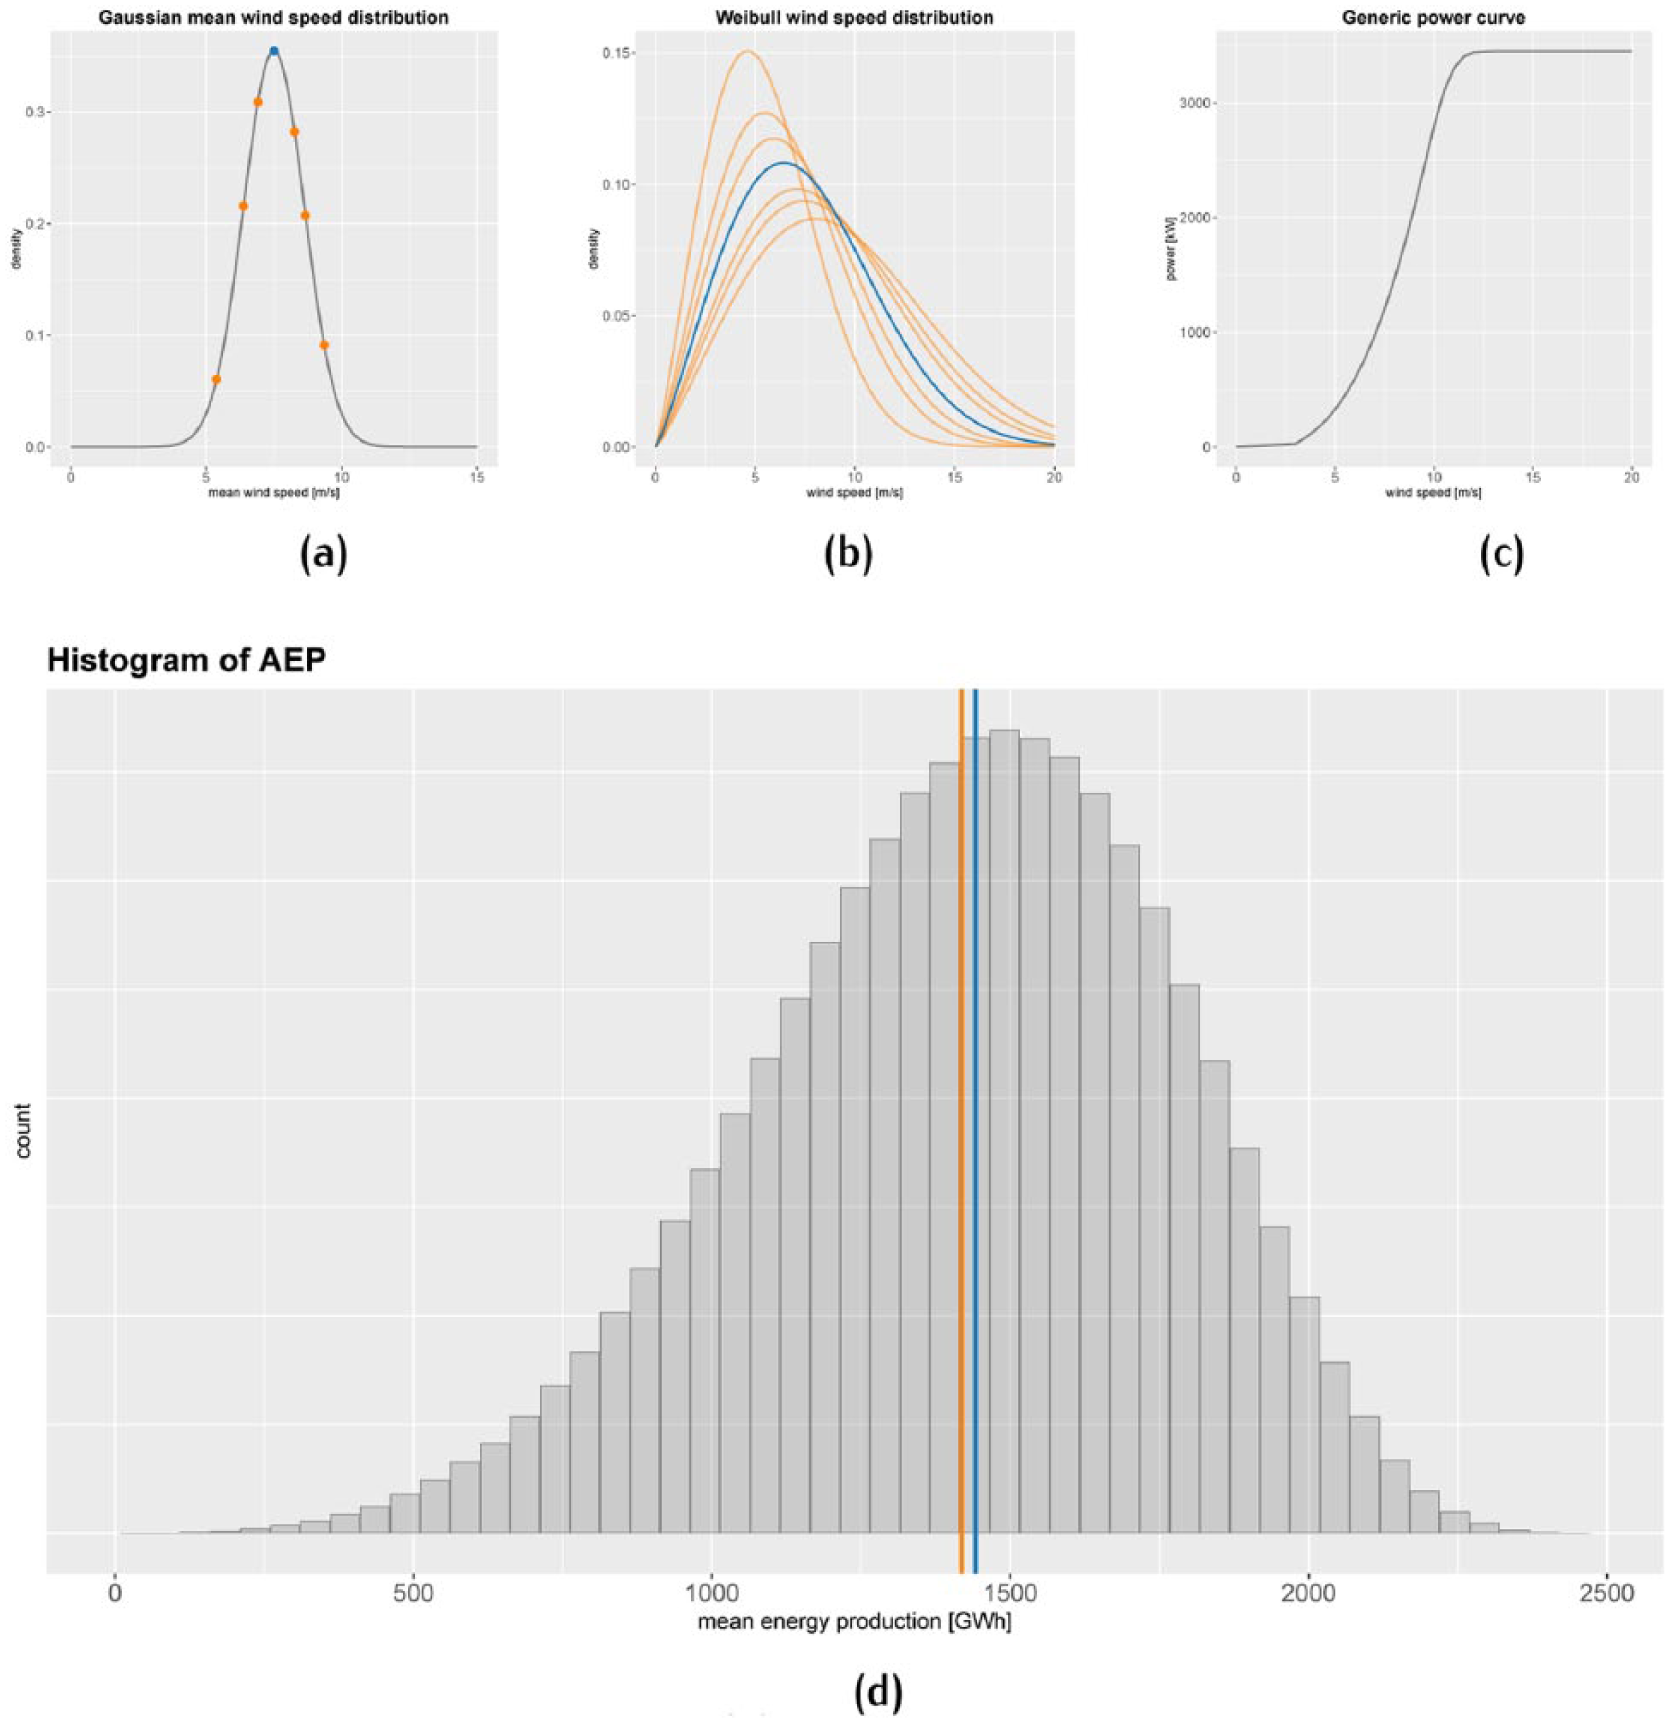
Illustration of Monte Carlo steps in AEP estimation that are due to nonlinear turbine response functions. The blue vertical line in panel (d) indicates the estimate
Calculating bias effects due to skewed and/or truncated loss distributions
The main challenge when calculating bias effects that are due to skewed and/or truncated loss distributions is how to define these distributions in mathematically precise terms. In most real-world applications, loss distributions are assumed to be Gaussian and identified with their location and scale parameters µ and
The Monte Carlo approach we suggest is robust against such distributional complexities and allows us to estimate the mean and mode as long as one can generate a sample of random variables from the distribution of interest. In what follows, we illustrate our approach with skew and truncated normal distributions to simplify our exposition and note that more general distributions can be easily incorporated:
(a) Consider a skewed normal distribution with probability density function
(b) Consider a (right) truncated normal distribution with probability density function
Generate a large sample of size
Estimate the mean by

Several estimators for the mode are available (see Bickel, 2006 and the references therein). One estimator that is directly computable is due to Grenander (1965) and takes the form

where one takes
The (relative) bias is then calculated as


Illustration of varying shape parameters: (a) skewed normal distribution and (b) truncated normal distribution.
Figure 4 shows the skewed (left panel) and truncated (right panel) AEP loss distributions based on a sample of
Illustration of bias effects: (a) skewed normal distribution and (b) truncated normal distribution.
Discussion
In this section, we discuss the effect that different parameters have on the magnitude of AEP bias estimates.
Consider first the case of nonlinear turbine response functions. The two panels in Figure 5 show how the AEP bias varies with the wind speed ratio (i.e. the ratio of mean to rated wind speed). In panel (a) of Figure 5, the shape factor for the Weibull distributions of wind speeds is kept fixed to show the effect different standard deviations of mean wind speeds have on AEP bias. We note first that the higher the standard deviation, the higher the AEP bias, irrespective of the wind speed ratio. Second, the AEP bias attains a global maximum for a certain mean to rated wind speed ratio. While in panel (a) this maximum is attained for a wind speed ratio of 1, we see in panel (b) that the location of this maximum actually depends on the shape factor
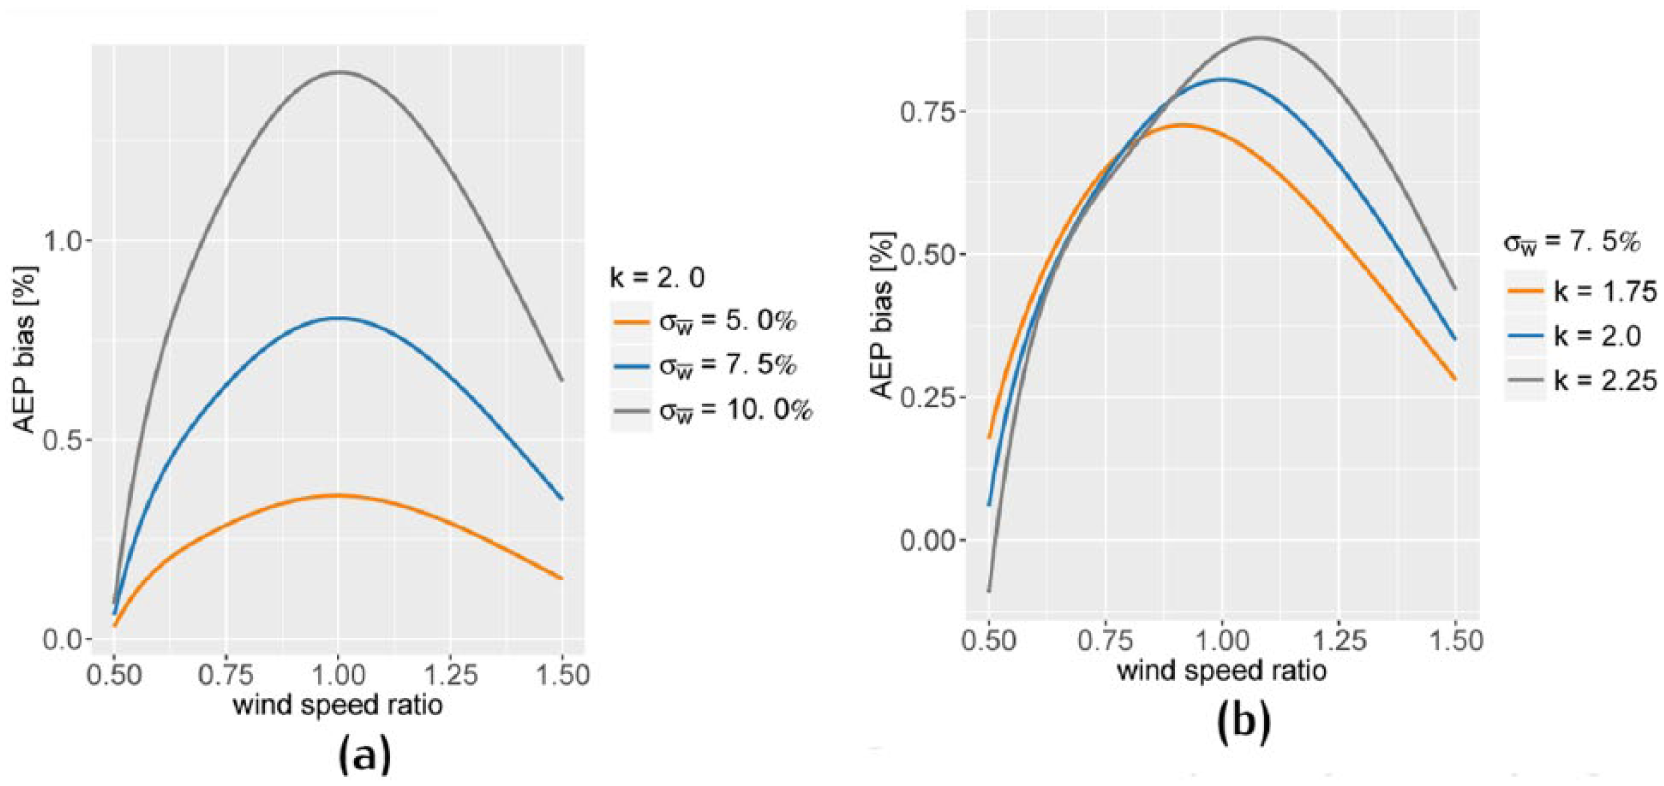
Sensitivity analysis of bias effects: (a) sensitivity analysis: varying
Consider next the case of skewed or truncated uncertainty distributions. To facilitate the interpretation of the sensitivity analysis, we consider three different scenarios defined by the relative standard deviation relative to its mean. In the case of the skew normal distribution, the amount of asymmetry imposed is increasing with the (absolute) value of the parameter
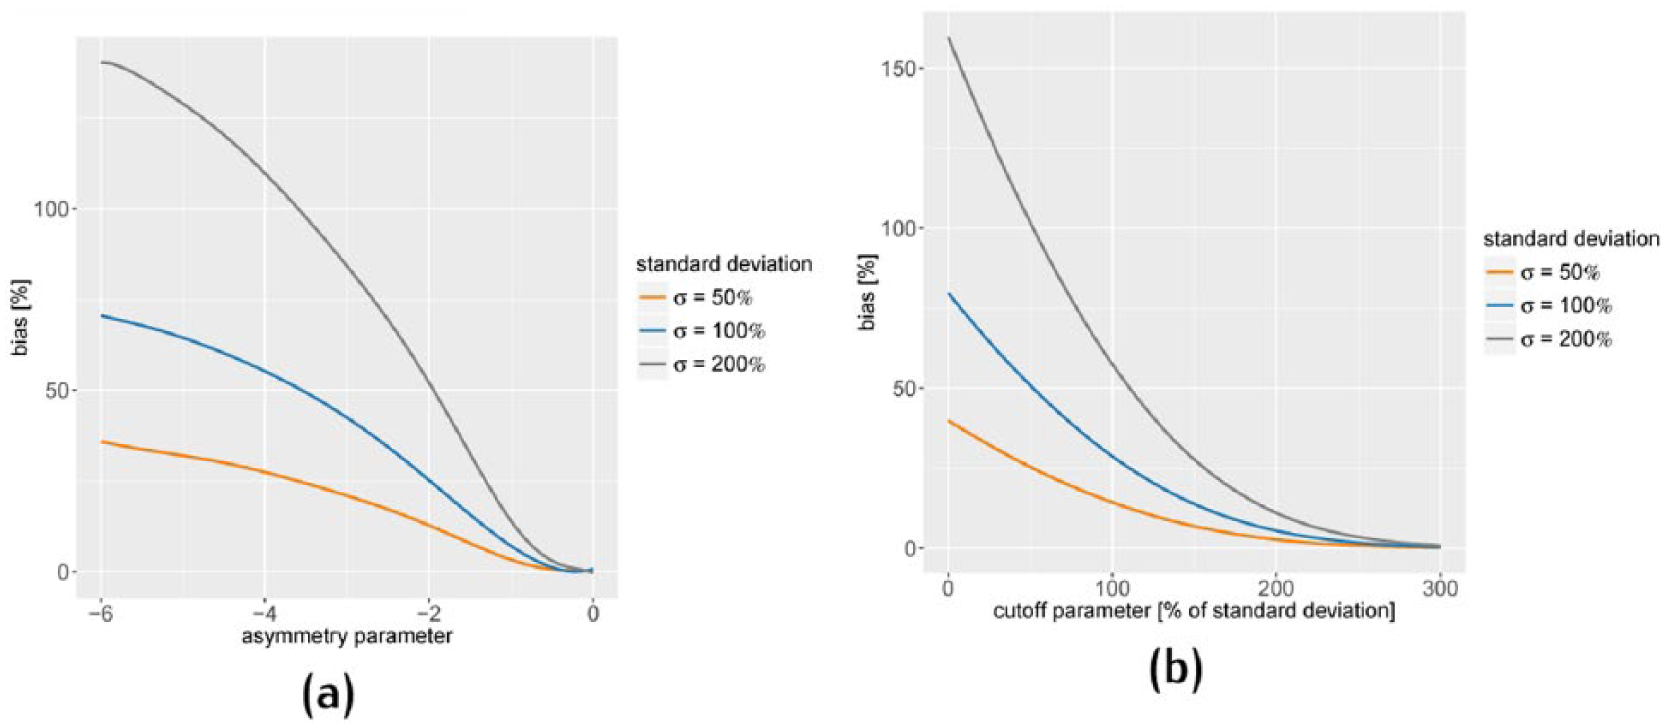
Sensitivity analysis of bias effects: (a) sensitivity analysis: varying asymmetry parameter α and (b) sensitivity analysis: varying cut-off parameter c.
Conclusion
A method for incorporating the effect of asymmetric uncertainty distributions and nonlinear turbine response in wind turbine yield assessments has been presented. It has been shown that the bias introduced by the current standard method for estimating the expected AEP, where the expected mean AEP is calculated based on the modal value of the input parameters and the Gaussian uncertainty about the mean is assumed, is on the order of
Footnotes
Declaration of conflicting interests
The author(s) declared no potential conflicts of interest with respect to the research, authorship and/or publication of this article.
Funding
The author(s) received no financial support for the research, authorship and/or publication of this article.