
Abstract
The current study presents a wind resource assessment (WRA) approach by combining existing approaches, including wind probability density estimation based on hourly wind speed frequency, wind power density (WPD) and wind energy density (WED), wind turbine (WT) power output and power curve modeling, and annual energy production (AEP). Wind probability density investigation employed various probability density functions (PDF), including parametric probability density functions such as Weibull, Normal, and Gamma, and non-parametric distribution, including Kernel Density Estimator (KDE). The present study also models the influence of humidity on air density for estimating WPD, WT power output, and AEP. The current study validated the proposed approach by conducting case studies for selected sites of remote Indonesian archipelago islands. AEP estimation proposed by this study can assist the site-turbine fitting design, especially for relatively moist locations.
Introduction
Changing climate drives global society for the energy transition, from fossil-fueled energy to renewable-clean energy. Driven by various factors such as policy support, innovation, technological advancement, and sharp cost reductions, renewable energy usage remarkably progressing over the past decade (IEA, IRENA, UNSD et al., 2019). Moreover, the energy transition aligns with United Nations Sustainable Development Goals (UN SDGs) – Goal 7: Affordable and Clean Energy.
Wind energy is one of the renewable energies projected to grow. In 2020, 154.3 MW of wind power generation had been installed in Indonesia (Kementerian ESDM, 2020). Two wind farms, both in Sulawesi Island, have already been operated since 2018. Based on data collected from 166 sites, about 35 sites have good wind energy potential, with an average annual wind speed is above 6 m/s. In addition, about 34 sites also have sufficient wind energy; the annual wind speed ranges between 4 and 5 m/s (Martosaputro and Murti, 2014). However, for precise estimation of wind energy potential and optimum wind power generation, in-depth assessments considering various factors and the mixture of various approaches would be required.
WPD is an essential indicator for WRA since it shows the available energy in the wind regime for a unit surface of the WT rotor over time (Serban et al., 2020). AEP is the primary indicator in evaluating the WT performance, serving as the optimum turbine-site fitting foundation (Song et al., 2021). Both WPD and AEP are affected by the ambient condition. Specifically, WPD and AEP depend on the assumed air density at standard atmosphere at sea level (Serban et al., 2020; Udoakah and Ikafia, 2017). At the same time, the latter parameter relies on the weather parameters, including atmospheric pressure, temperature, altitude, and moisture (Lawrence, 2005). Accordingly, the ambient condition is a non-negligible factor of WRA. Hence, the constant air density value assumption may be imprecise, especially at a relatively humid site.
The current study explores the effect of moist air density on estimating WPD, WT power output, and AEP to improve the WRA. This study includes various PDFs, parametric (Weibull, Normal, and Gamma), and non-parametric (KDE), to estimate critical parameters from the obtained hourly wind speed data. Along with other approaches, the existing WT power curve modeling complements the proposed approach to precisely assess wind energy potential and turbine-site fitting at relatively humid sites.
Proposed WRA approach considering moist air properties
Influence of humidity on air density
Assessing the energy available is an essential step in planning a wind energy project (Huang and Wan, 2012). Thus, the main goal of WRA is to assess the potential of wind energy of a site. The energy content of wind is in the form of kinetic energy Ek can be expressed as

is proportional to its mass m and velocity v (Wagner and Mathur, 2018). Where mass is defined by

The change of air density ρ and volume V would give a significant change to the mass. By taking into account, the rotor area A and velocity, the change in volume concerning the length l and the time t, kinetic energy is now defined as

The power Pw a WT can extract from the wind is defined as energy over time, expressed as

Based on (4), the possible extracted power will vary for the same WT, depends on the air density. According to Georgantopoulou and Georgantopoulos (2018), the pressure p and standard temperature T are known for a given altitude. With R as the real gas constant, the standard air density can be calculated from the ideal gas law, expressed as

The pressure, temperature, and humidity of a site affect the air density (Sohoni et al., 2016), yet (5) neglects the effect of water content. Moist air is dry air-water vapor mixtures (Vestfálová and Šafařík, 2018). The humid air density varies with water content and temperature. The density of moist air ρma is the addition of dry air density ρa and water vapor density ρw. The density of dry air, water vapor, and their mixture can be calculated with the ideal gas law (Engineering Toolbox, 2004a), defined by

for dry air density. pa and Ra indicated partial pressure of dry air and gas constant for dry air, respectively.

The water vapor density is defined by (7), where pw and Rw indicated partial water vapor pressure and gas constant for water vapor, respectively.
Water vapor amount in air influences its density. Water vapor is lighter than air, based on its dominant components (Engineering Toolbox, 2004a). The density of moist air is the ratio of the mass of moist air to its volume (Vestfálová and Šafařík, 2018) or the inverse of the specific volume Vma of moist air (Engineering Toolbox, 2003), expressed as

where x is specific air humidity, the ratio of the mass of water to the dry air mass (Vestfálová and Šafařík, 2018). The air-vapor mixture’s specific air humidity or humidity ratio can be obtained from the relative humidity RH parameter collected from a specific site using (9), where p is the ambient pressure (Vaisala, 2013). The specific air humidity is calculated by

The water vapor pressure pw, ambient pressure p, and temperature T for a given altitude halt, standard temperature T0, and standard pressure p0 (Engineering Toolbox, 2004b; Georgantopoulou and Georgantopoulos, 2018) are defined by (10)–(12), respectively.


Wind speed distribution and WPD calculation
Wind speed distribution for a particular site determines the wind energy available and the performance of an energy conversion system (Chang, 2011). PDF is the most used method to model wind variation on a particular location (Jangamshetti and Rau, 1999). Wind energy potential can be determined once the probability distribution of wind speed is obtained using PDF.
The current study utilizes several PDFs, including Weibull, Normal, Gamma, and KDE. Weibull is most widely adopted with its two parameters (Chang, 2011). Weibull fw of wind speed v is expressed by

where k and c are the shape parameter and the scale parameter, respectively. Weibull parameters were estimated using maximum likelihood estimation (MLE) as shown in (14) and (15).


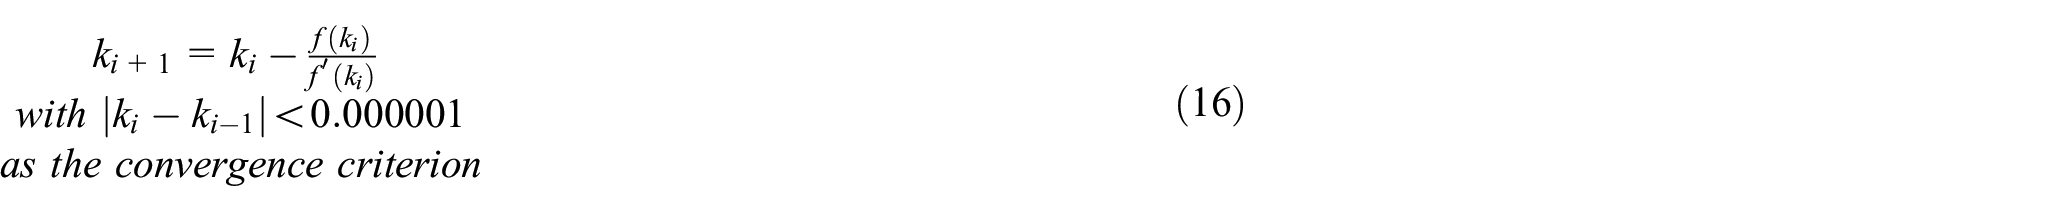
The scale parameter c can be obtained using (14). However, (15) is used as the initial point of the iteration to estimate the shape parameter k. Newton-Raphson method as shown in (16) will be used to get the iteration value until a convergent estimator is achieved (Ikbal et al., 2022).


Gamma fg that employs the gamma function Γ is given by

where α and β are the shape parameter and the scale parameter, respectively. The initial estimator for Gamma is shown in (20).

The distribution of monthly or yearly mean speeds is likely to be normally distributed around a long-term mean wind speed. Thus, Normal is the best known and most widely used distribution for a continuous random variable (Johnson, 2006). Normal fn is expressed by

where σ and

KDE is a non-parametric probability distribution that outperforms some parametric PDFs in fitting, accuracy, and operational simplicity (Aghbalou et al., 2018; Wang et al., 2015). KDE estimates the PDF from conditional quantiles obtained by quantile regression models. KDE sums a smooth kernel function at each data point to get a density estimate (Zhang et al., 2020). The basic kernel estimator is given by

where K(.) and h are the kernel function and the bandwidth, respectively. The current study employs KDE from OriginLab (n.d.) to estimate the kernel density at v for a given vector

where n is the size of a vector

where n, yi, and xi are the number of observations, frequency of observations, and estimated frequency, respectively.
Besides RMSE, the coefficient of determination (R2) is also performed to check the accuracy of each PDFs. R2 is expressed as (Zhang et al., 2018)

The WPD is an essential index, where WPD indicates how much energy is available for WT conversion (Huang and Wan, 2012). The higher the WPD of a site, the higher the power output of the installed WTs (Saxena and Rao, 2016).
The total power Pw, defined by (4), is the total power that could be extracted from the wind. Hence, the total power presented by all possible wind speeds in a site complies with wind speed distribution f(v), available for the unit swept area of WT (Huang and Wan, 2012) can be expressed by

WED can be estimated once the WPD of a site is calculated. WED can be obtained by multiplying time t (t is taken as 8760 hours for yearly basis WED) with previously given WPD (Huang and Wan, 2012) as follows

WT power curve modeling
The power curve of WT indicates its performance. It reflects the power response of a WT to various wind speeds (Sohoni et al., 2016). Therefore, the WT power curve can be utilized to assess wind power. First, WRA, in terms of wind speed and WPD, needs to be done to identify a site suitable for a wind energy project (Mathew, 2007). Then the available wind data and WT power curve are selected to estimate the energy production.
The present study models the power curve of variable speed WT, which relies on the wind speed and works on three modes (idle, partial power, and rated power), based on the existing approach (Aghbalou et al., 2018; Song et al., 2021). The power output P(v) of variable speed WT is defined by

where v is the wind speed; Pp(v) and Pr are the partial power and the rated power, respectively; vi, vr, and vo are the cut-in, rated, and cut-out wind speeds, respectively (Song et al., 2021). The rated power of a WT is tested under standard atmosphere, including standard air pressure and air density. Based on (4), the power of a WT can extract from wind is dependent to the air density. Hence, moist air density ρma may affect the rated wind speed and power coefficient of a variable speed WT. The power coefficient and rated wind speed of a WT are represented by (30) and (31), respectively. Power coefficient Cpr equation is defined by

where the denominator represents the power available in the air (Burton et al., 2001).
The rated wind speed is expressed by

Based on (31), the rated wind speed is increased for the high-moisture site with decreasing air density. On the other hand, based on (30), the power coefficient of a WT is decreased, which further increases the rated wind speed (Song et al., 2021).
The partial power depends on several parameters. It includes wind speed v, cut-in wind speed vi, rated wind speed vr, and shape parameter k. Various approximations to calculate partial power, including linear, quadratic, general, and cubic (Akorede et al., 2013; Hu and Cheng, 2007; Yang et al., 2003; Yeh and Wang, 2008), are defined by


The knowledge of selected WT and site are required to estimate WT power output precisely using (32)−(35). It includes the power coefficient for fitting parameters, WT rated power, and the selected site’s humidity.
AEP estimation
The AEP of a specific WT (Hrafnkelsson et al., 2016) can be estimated after obtaining the WT power curve by adapting (28) as follows

where the hourly mean power production Pm based on wind speed distribution (Song et al., 2021) is defined by

Application of proposed approach
The proposed WRA approach can be applied based on preparations described by sub-sections A to D, as shown in the flowchart in Figure 1.

Flowchart of proposed WRA approach.
Results and discussions
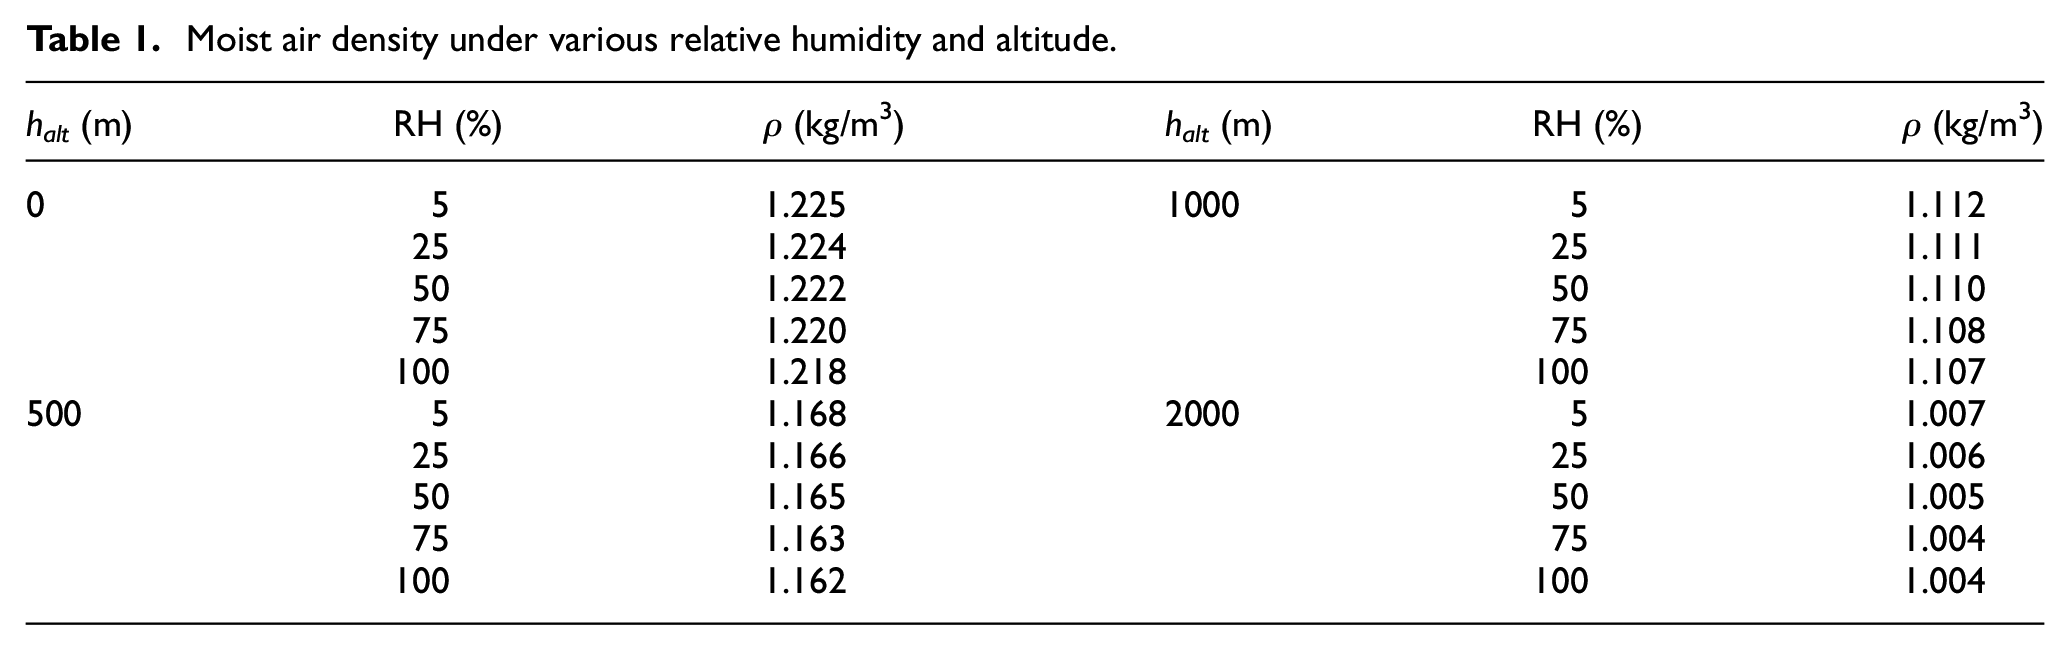
In terms of relative humidity and altitude, the air density under various situations was calculated using (8) to check the humidity effect on the wind energy potential of humid sites. The changes in air density influenced by humidity are presented in Table 1. It is obvious that there is low air density for a site (Song et al., 2021) under humid condition. Based on (4), the wind power density is decreased with the decreasing air density. Neglecting the decreased moist-air density could overestimate the wind energy potential of a specific site.
Moist air density under various relative humidity and altitude.
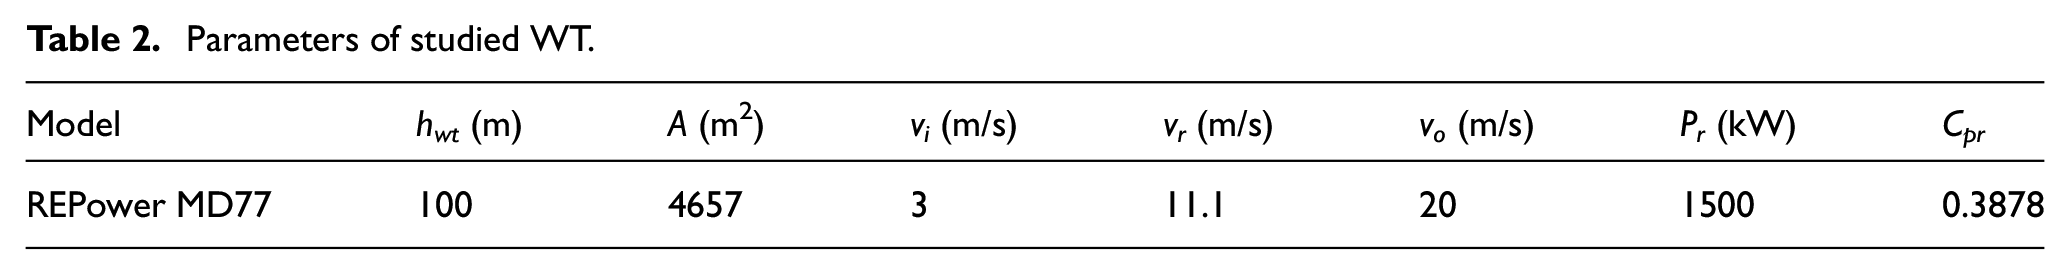
The proposed WRA approach considering the influence of humidity is applied to assess wind resources of two sites in the eastern part of the Indonesian archipelago. The AEP estimation is obtained by applying data of both sites to a variable speed WT. The parameters of investigated WT are listed in Table 2. Table 3 shows the parameters of selected sites, including latitude, longitude, and altitude.
Parameters of studied WT.
Parameters of studied sites.

The air density of humid air based on existing relative humidity data was investigated using (8). The calculated moist air density ρma based on measured parameters of the selected sites is presented in Table 4. Table 5 shows the estimated site parameters based on each wind speed distribution. The data of two selected sites were obtained from A/s (n.d.) and PDFs’ parameters were estimated for each PDF using statistical method. Then each distribution was calculated using (13), (19), (21), and (23).
Moist air density of studied sites.

Estimated sites parameters based at 100 m hub-height.
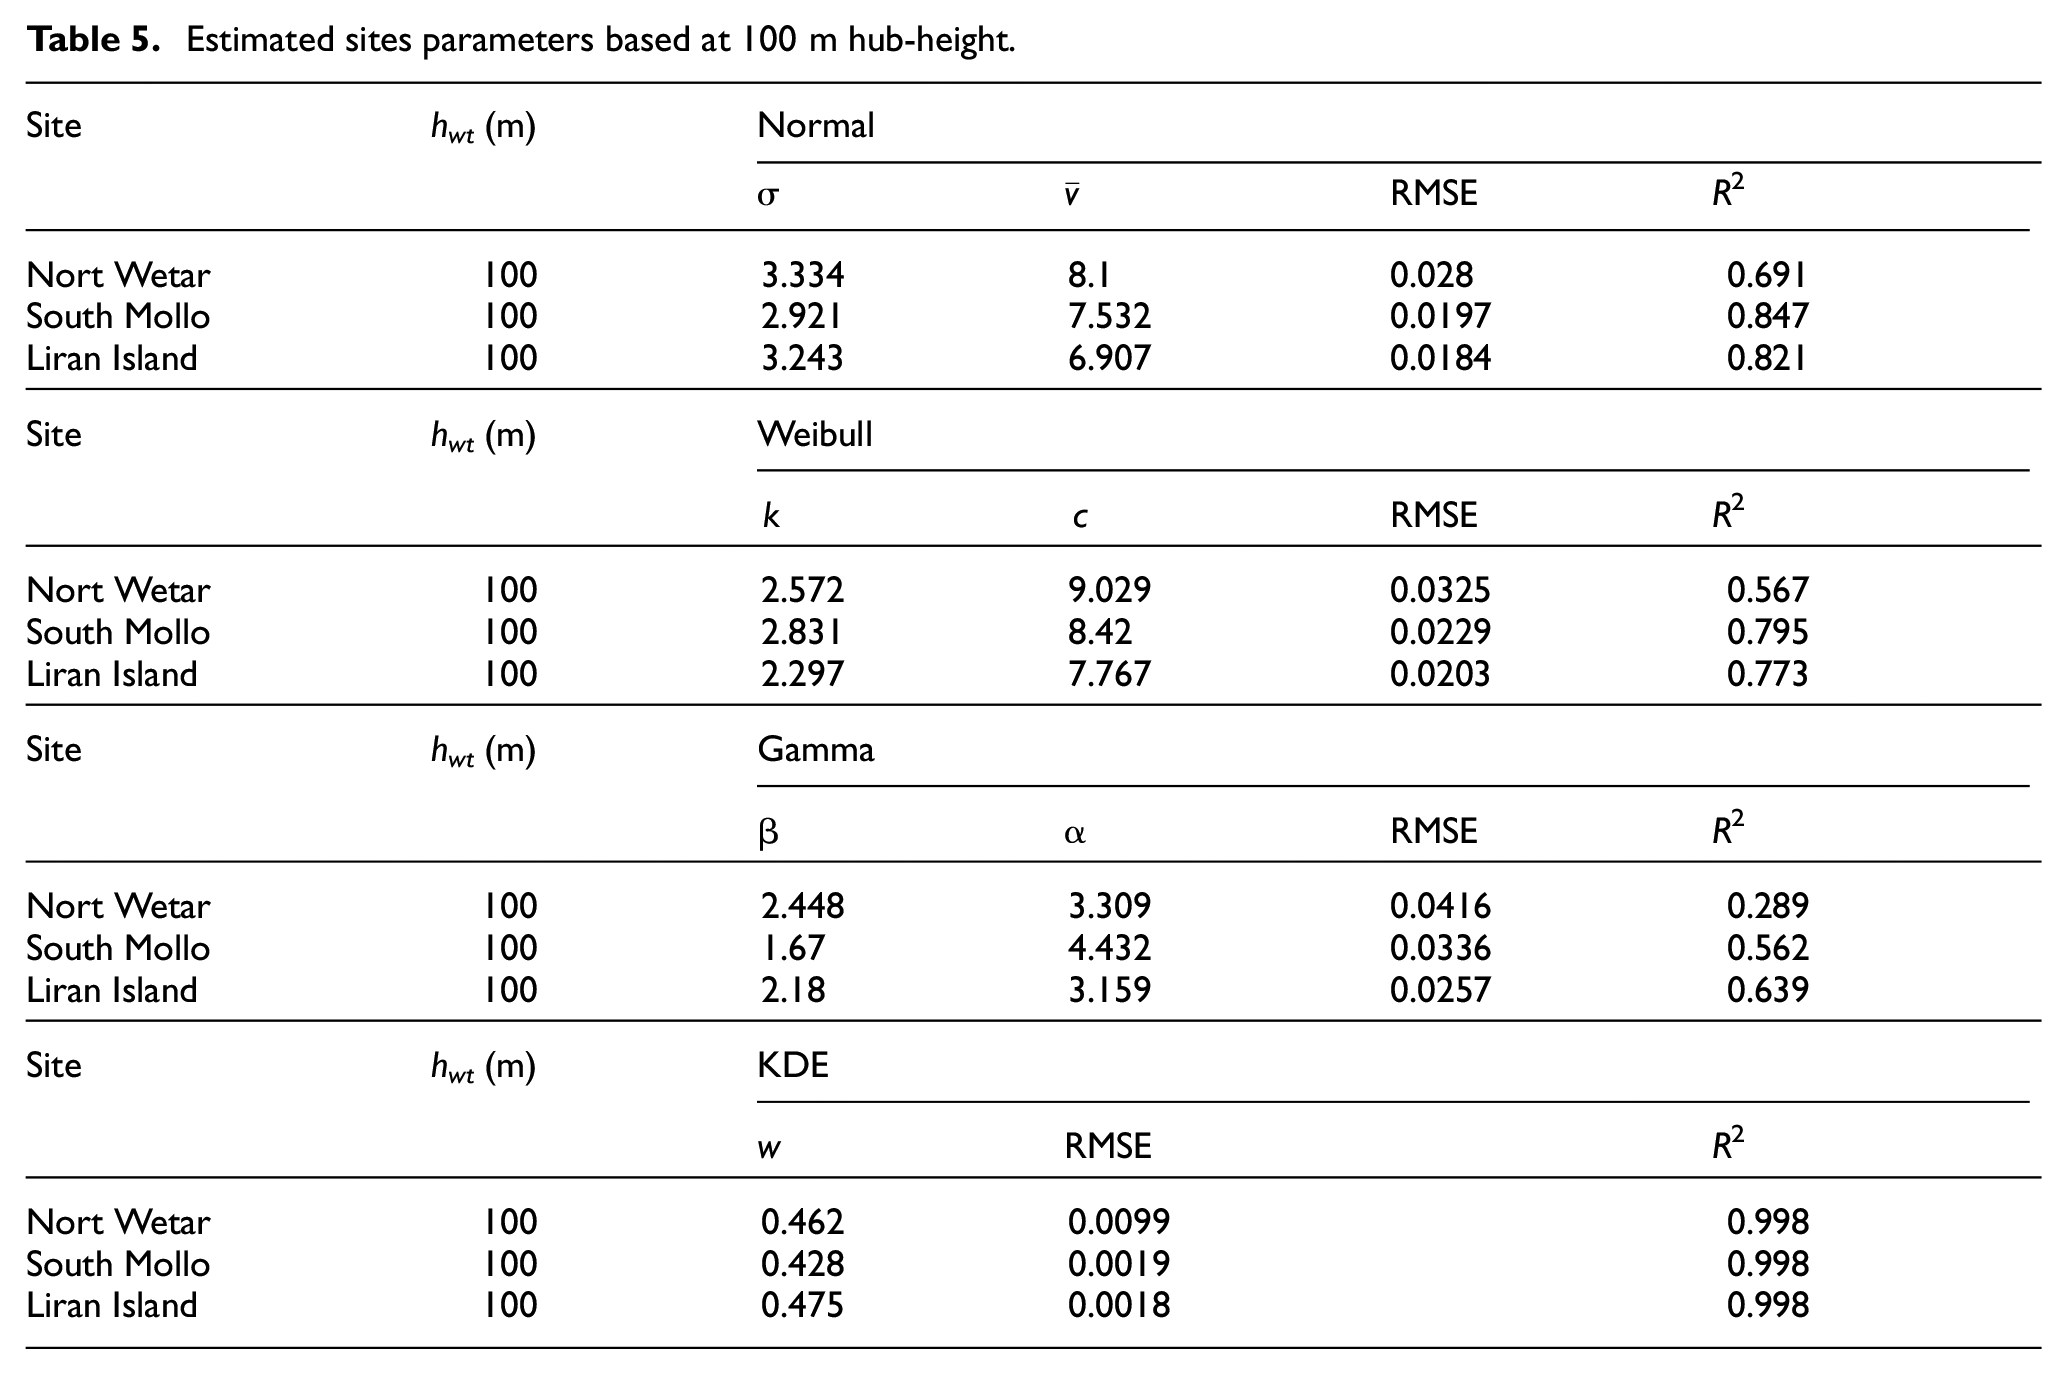
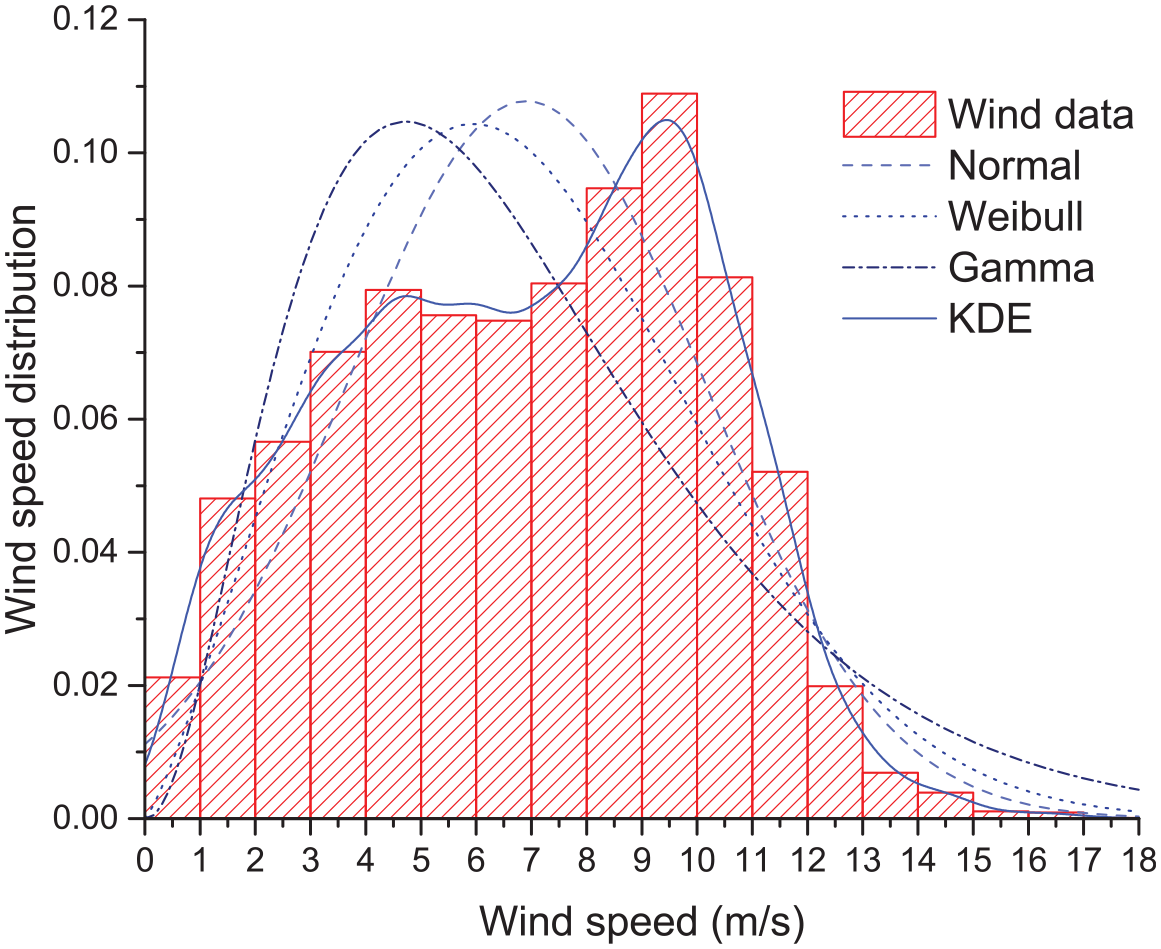
RMSE and R2 were investigated to evaluate the accuracy of estimated parameters. Based on RMSE and R2 goodness of fit, KDE, with the lowest RMSE and the highest R2, is the most accurate and most precise distribution estimation for North Wetar site and South Mollo site. Figures 2 and 3 show the wind speed distribution of selected sites at various hub height using various PDFs. Then PDFs are validated by visually observing Figures 2–4. KDE obviously outperforms other PDFs.
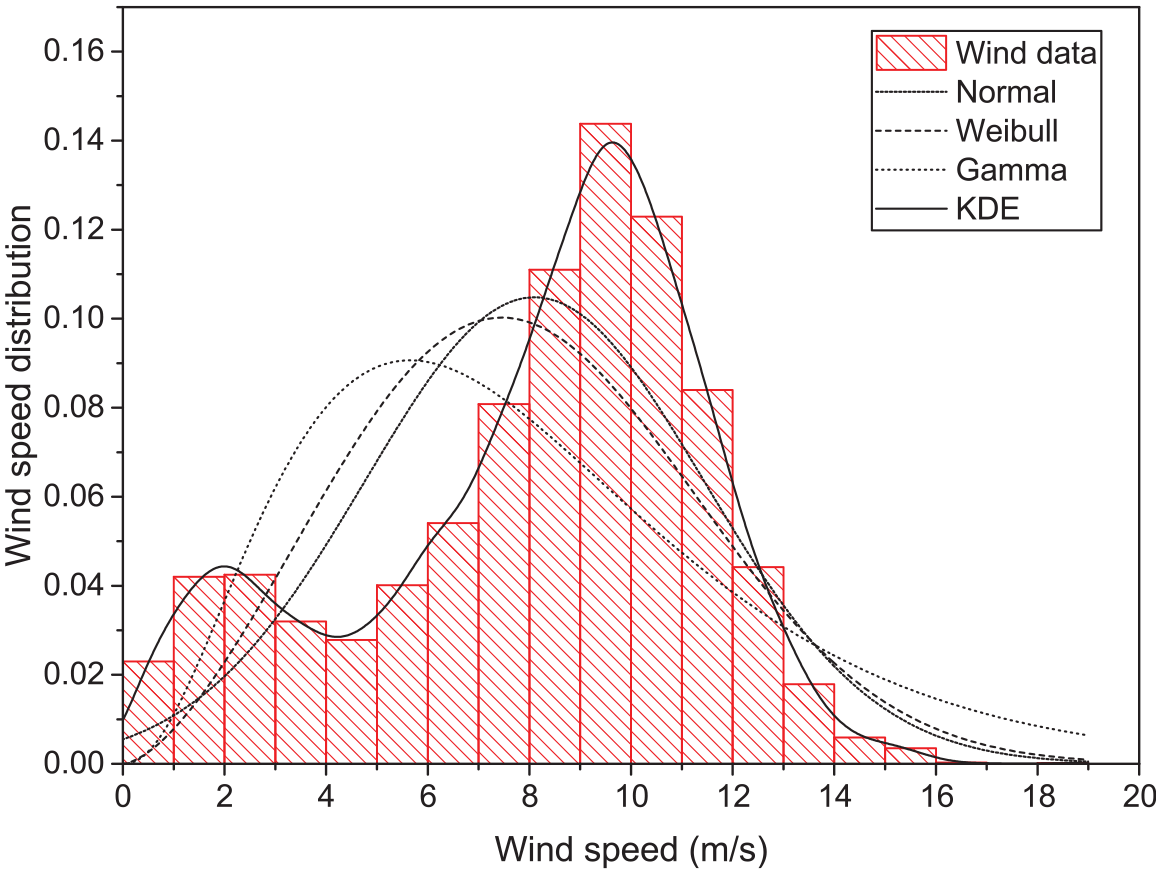
Wind speed distribution of North Wetar site at 100 m hub height.

Wind speed distribution of South Mollo site at 100 m hub height.
Wind speed distribution of Liran Island site at 100 m hub height.
Figure 5 shows that the WPD of moist air is lower than the WPD of dry air. The WPD of moist air are about 7% lower than the WPD of standard air for all sites. It shows that humidity affects not just the air density but also WPD. Even the lower density of moist air will affect WED. Based on (28), WED of all sites is shown in Figure 6. With the proposed approach, the WED of North Wetar is 3.53, 3.48, 3.64, and 3.48 MWh estimated using Normal, Weibull, Gamma, and KDE, respectively. The WED of South Mollo is 3.54, 3.48, 3.78, and 3.5 MWh estimated using Normal, Weibull, Gamma, and KDE, respectively. On the other hand, the WED of Lirand Island is 3.24, 3.21, 3.38, and 3.21 MWh estimated using Normal, Weibull, Gamma, and KDE, respectively.
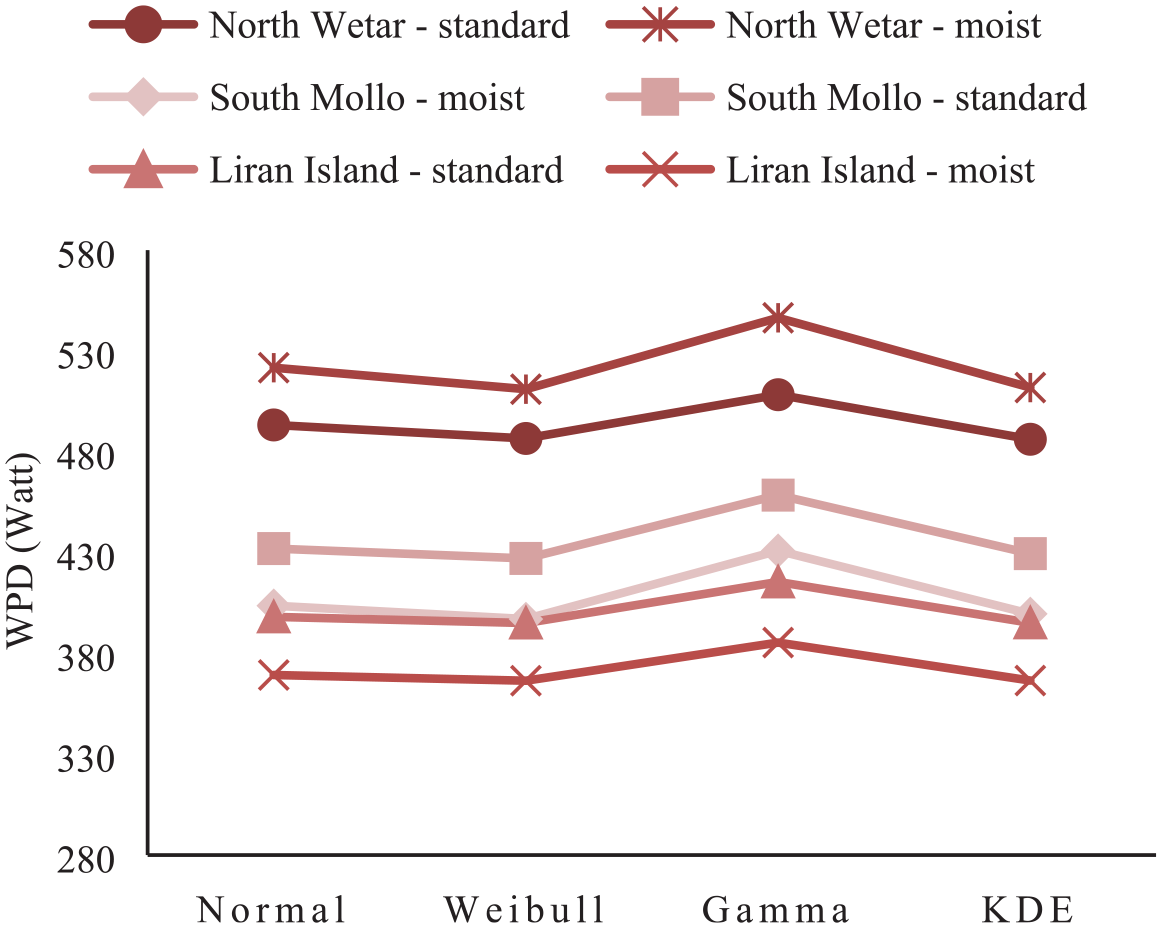
Comparison of estimated WPD based on moist air density and standard air density for North Wetar site, South Mollo site, and Liran Island site at 100 m hub height.
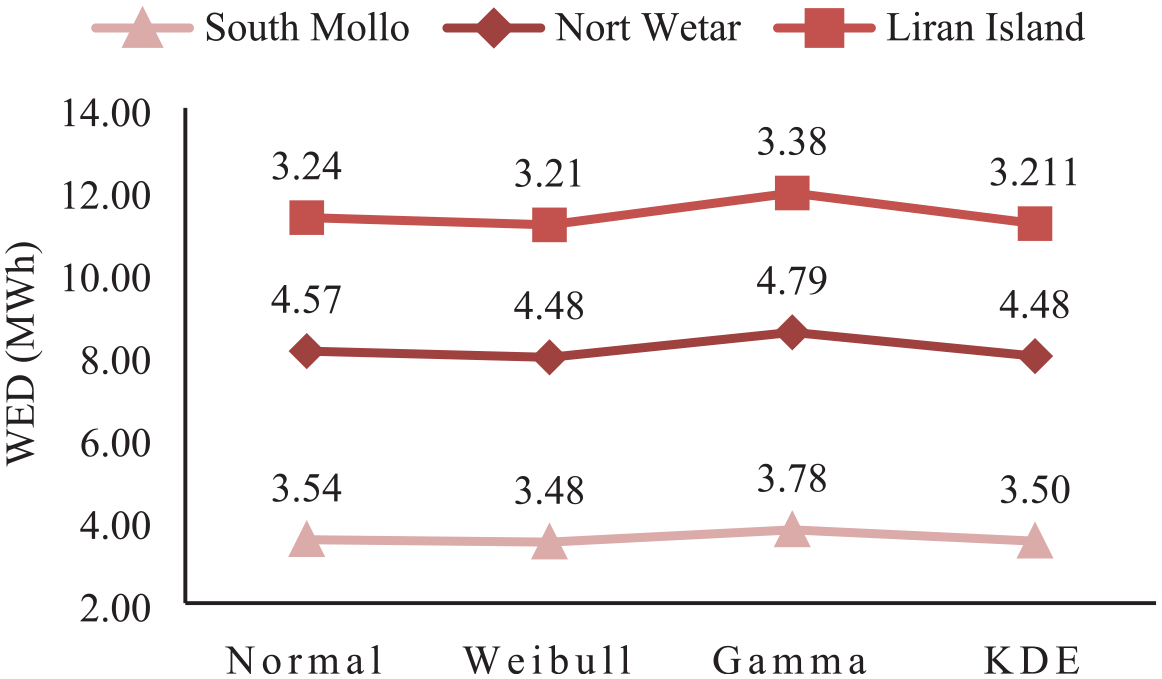
Comparison of estimated WED of North Wetar site, South Mollo site, and Liran Island site at 100 m hub height using various PDFs.
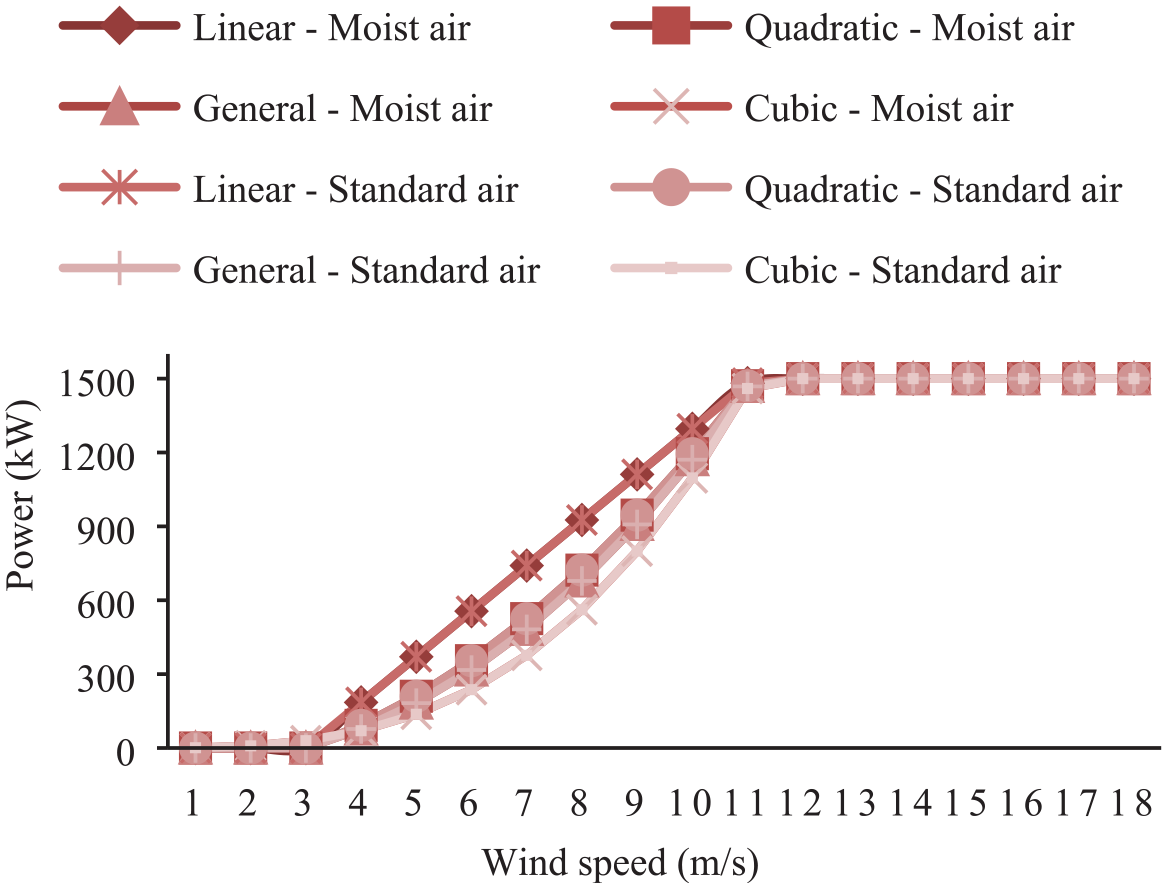
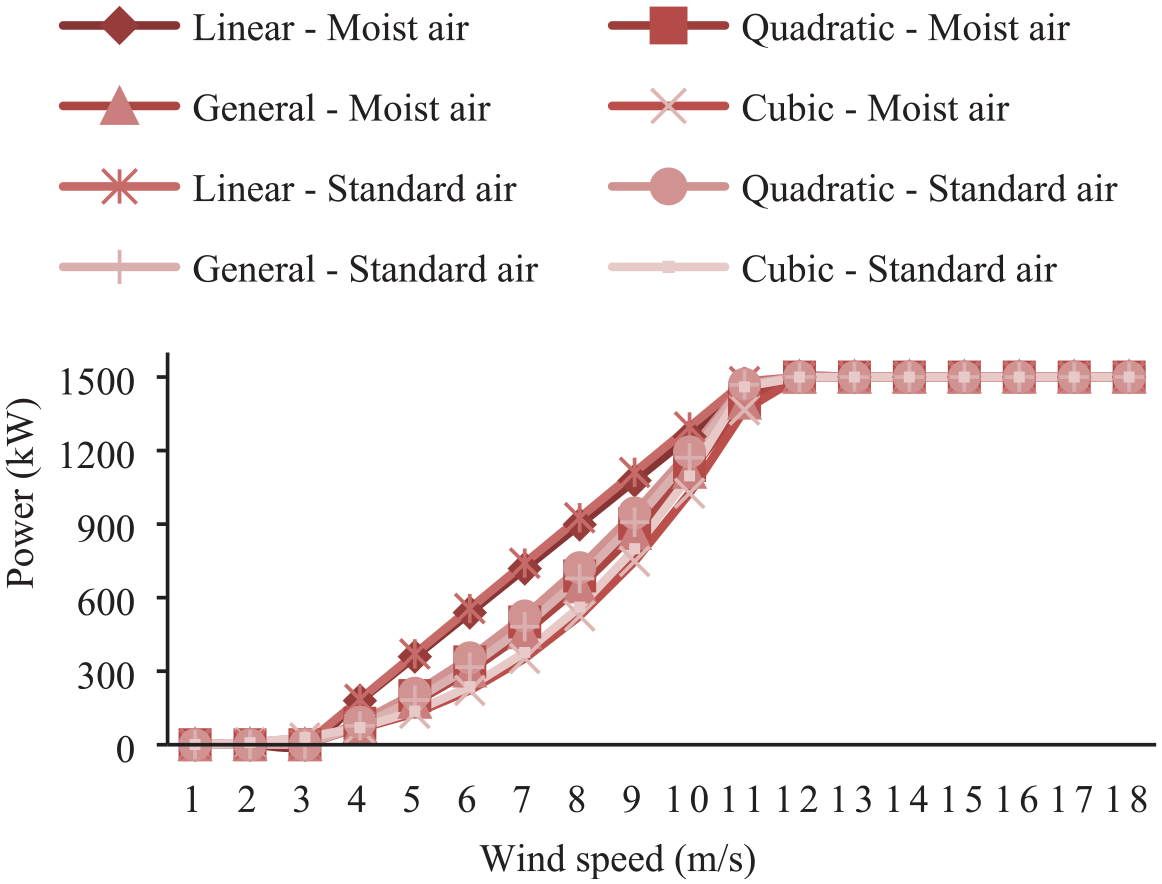
Figures 7–9 show the power curve comparison of studied WT modeled using empirical power curve models, including the linear model with standard air density, the quadratic model with standard air density, the general model with standard air density, the cubic model with standard air density, the linear model with moist air density, the quadratic model with moist air density, the general model with moist air density, and the cubic model with moist air density for North Wetar and South Mollo site, respectively.

Comparison of studied WT power curve modeled using various approximations at North Wetar site.
Comparison of studied WT power curve modeled using various approximations at South Mollo site.
Comparison of studied WT power curve modeled using various approximations at Liran Island site.
Considering humidity, the air density of the North Wetar site is 1.1247 kg/m3, lower than the standard air density, 1.225 kg/m3. Hence, the rated wind speed of WT is also changed from 11.1 to 11.38 m/s. On the other hand, the air density of the South Mollo site, considering humidity, is 1.115 kg/m3. Therefore, the rated wind speed of WT is increased to 11.42 m/s. Lastly, the air density of Lirand Island site is 1.1363 kg/m3, lower than the standard air density. This increases the rated wind speed of WT to 11.34 m/s.
Figures 10–12 show the AEP estimation results using various models, PDFs, and both standard air density and moist air density at the North Wetar, South Mollo, and Lirand Island, respectively. By taking moist air density-based results as the reference, it is concluded that standard air density-based models invariably overestimate the AEP for all four PDFs. For the moist air density-based models, it is obtained that KDE constantly estimates the highest value. With KDE, the estimated AEP is 7204, 6353, 5915, and 5702 MWh for linear, quadratic, general, and cubic models, respectively. On the other hand, Gamma estimates the lowest value, that is 5992, 5092, 4667, and 4500 MWh for linear, quadratic, general, and cubic models, respectively. While Weibull and Normal estimate the AEP value between KDE and Gamma for all four models. The above results indicate that the humidity effect needs to be considered in conducting WRA, and the range of more precise AEP estimation can be obtained by combining various approximations.
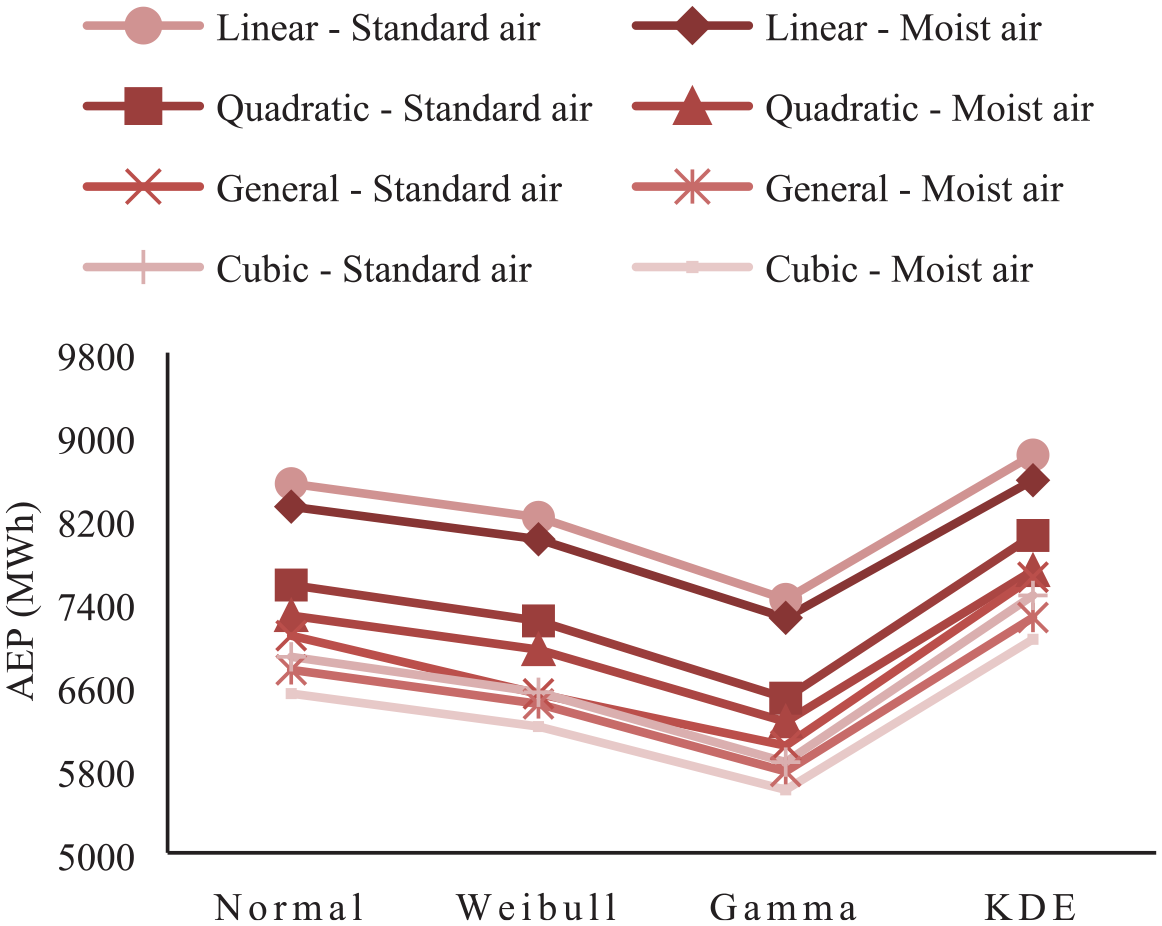
AEP comparison of studied WT using various approximations for standard air density and moist air density of North Wetar site.
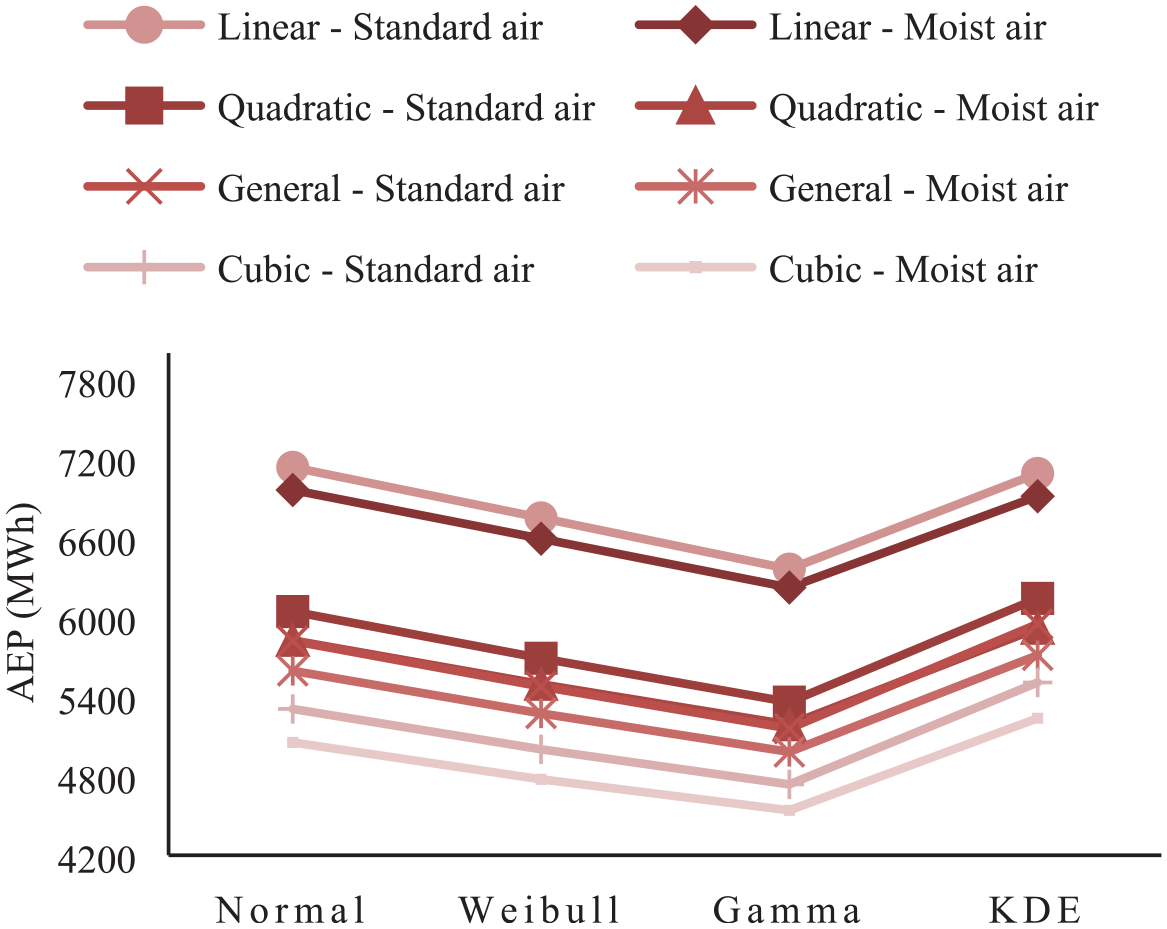
AEP comparison of studied WT using various approximations for standard air density and moist air density of South Mollo site.

AEP comparison of studied WT using various approximations for standard air density and moist air density of Liran Island site.
Conclusion
This study presents a WRA approach for WT situated in a relatively humid area. The influence of the low air density at relatively humid locations is considered in the presented WPD and WT power output model. This approach achieved a better precise AEP estimation than other approaches that neglect the humidity factor. AEP estimation proposed by this study can assist the site-turbine fitting design for other relatively moist locations.
Footnotes
Declaration of conflicting interests
The author(s) declared no potential conflicts of interest with respect to the research, authorship, and/or publication of this article.
Funding
The author(s) received no financial support for the research, authorship, and/or publication of this article.