




Abstract
Using the eXtensible Business Reporting Language (XBRL) mandate as a pseudo-natural experiment, we provide empirical evidence that reduction in information processing costs (IPC) leads to more informative stock price through two channels, the firm-specific information incorporation, and increased disclosures. We also find that younger firms with relatively shorter public disclosure history benefit more than older firms, supporting the conjecture that XBRL accelerates the information incorporation process and expedites market’s learning about younger firms faster. Our results are robust to alternative measures of price informativeness, individual batch tests, placebo tests, and potential bias from financial industry.
JEL Classification:
1. Introduction
A stock market with prices promptly reflecting all information generated, transmitted, and aggregated is essential to the allocation of resources and the welfare of market participants. Sometimes, only partial information is captured in prices when information processing is costly (Grossman and Stiglitz, 1980). Owing to the difficulty in quantifying information processing costs (IPC), prior studies on this issue have been primarily conducted in theoretical or experimental frameworks, associating IPC with the complexity of the information environment (Miller, 2010), the amount of information to be processed (Lurie, 2004), or the processing capacity (Van Nieuwerburgh and Veldkamp, 2010). They collectively postulate that high IPC impairs price efficiency. Motivated by recent evidence that the mandate of eXtensible Business Reporting Language (XBRL) directly reduces IPC (Hodge et al., 2004; Premuroso and Bhattacharya, 2008), we add to this line of research by providing further empirical evidence on the causal relationship between IPC and stock price informativeness through two distinct channels.
The XBRL mandate for financial report filing is an application of computer technology to financial markets with the objective of purportedly reducing IPC and improving financial information usability. The use of interactive data through XBRL filers (firms) supports substantial increase in the speed, accuracy, and usability of financial disclosure statements, which leads to reduction in the cost of processing information (Securities and Exchange Commission (SEC), 2009). XBRL formatted financial statements are tagged and standardized, and thus, users can obtain and process information more efficiently at lower costs. For example, Hodge et al.’s (2004) experimental study finds that XBRL-enhanced search engine is easier for acquiring and processing information. Premuroso and Bhattacharya (2008) argue that the machine-readability and detailed tagging characteristics of XBRL enables information to be processed automatically, and hence, the time as well as costs associated is largely reduced.
The close association between the XBRL adoption for reporting and IPC enables examining IPC in an empirical setting. Current literature documents that the reduction of IPC after XBRL enhances market liquidity (Lee and Liu, 2011), improves analyst forecast accuracy (Felo et al., 2018; Liu et al., 2014), decreases cost of equity (Li et al., 2012), and restrains manager from earnings management (Kim et al., 2019a). In particular, Kim et al. (2019b) find that the XBRL adoption is associated with wider breadth of share ownership due to improved information environment. Confirming this is the study of Efendi et al. (2014), which documents a decline in post earnings announcement drift for good news. Dong et al. (2016) also find that reduced IPC increases the acquisition of firm-specific information and lowers return synchronicity. Furthermore, Blankespoor (2019) investigates firm disclosure choice before and after the XBRL adoption, and uncovers that reduction in IPC induces firms to disclose more in financial reports. These studies collectively allude to greater market efficiency after the adoption, pointing toward more informative stock prices. This motivates the current paper to directly investigate the relationship between IPC and stock price informativeness.
Specifically, we address two research questions in this study. First, does reduced IPC after the XBRL implementation enhance stock price informativeness, and how? We identify two distinct channels—the information flow channel and the information disclosure channel. The first channel is built upon the finding of Dong et al. (2016) that lowered IPC facilitates the acquisition of firm-specific information, and thus information flows more easily into stock prices, reducing return synchronicity. Our results support this conjecture, indicating that after the XBRL adoption stock prices are more informative, reflected in the increased fraction of return variation due to firm-specific information, lower price impact and narrowed analyst forecast dispersion. The second channel is built upon the finding of Blankespoor (2019) that the adoption of XBRL reporting encourages firms to disclose more in their financial reports because the lowered IPC increases firms’ benefits of disclosure (or cost of non-disclosure). Our results support this conjecture, showing that increased disclosure enhances price informativeness.
Furthermore, it is reasonable to expect the above two channels relating to firm-specific information flow and production to affect price informativeness differently depending on firms’ individual characteristics. We form our second research question in accordance with the following assumption: does the benefit of XBRL adoption vary for firms with shorter periods of public disclosure history? We expect a more salient effect in younger firms with shorter trading and disclosing history since XBRL adoption accelerates their disclosure process within a shorter period of time, compared with mature firms that have been listed with longer history of public trading and disclosure. Our empirical findings are consistent with this conjecture.
Dong et al.’s (2016) study on IPC and return synchronicity does not preempt our finding on price informativeness. Some studies that focus on how share prices reflect firm-specific versus market- and industry-wide information tend to suggest a negative relationship between price informativeness and stock synchronicity (Jin and Myers, 2006; Piotroski and Roulstone, 2004). They argue that if firms’ information environment has improved to enable better aggregation of firm-specific information, the portion of stock price due to market- and industry-wide information would be smaller, leading to lower stock return synchronicity. This view is, however, challenged by Dasgupta et al. (2010), which postulates that in a more transparent and informative market, stock return can be more synchronized as there is less surprise when events happen in the future. Xing and Anderson (2011) report a non-monotonic relationship between proxies of firm-specific information and synchronicity. Therefore, despite our initial conjecture derived from Dong et al. (2016), in what direction IPC impacts on price informativeness remains an empirical question.
In addition, this study is different to Dong et al. (2016) in that we examine price informativeness from three independent perspectives. Apart from the commonly used idiosyncratic volatility for firm-specific information acquisition (De Cesari and Huang-Meier, 2015; Ferreira et al., 2011; Gul et al., 2011; Yu, 2011), we also consider a illiquidity measure using price impact (Blankespoor et al., 2014; Li et al., 2012; Pastor and Stambaugh, 2003), and a measure for analysts forecast accuracy (Felo et al., 2018; Lee and Liu, 2011). Finally, in addition to the information acquisition channel documented by Dong et al. (2016) that leads to more informative prices, we incorporate the recent finding of Blankespoor (2019) to show the information disclosure as a parallel channel also attributable to greater price informativeness.
The contribution of this study is threefold. First, it adds to the growing literature on the role of IPC in capital markets by examining how it influences price informativeness in an empirical setting (Luo, 2008; Peng, 2005; Sims, 2003). Our findings not only provide empirical support to the theoretical link between IPC and price informativeness, but also incorporate an exogenous shock to establish a causal relationship between the two.
Second, this study has important implications to regulatory bodies in countries calling for reports on the effects of XBRL adoption on capital markets. Thus far, XBRL is mandated in major economies including the United States, China, and Japan. While the SEC claims that market participants can benefit from XBRL adoption, the initial implementation costs are high. 1 This is because XBRL is a complex technology that has raised concerns in relation to the cost of compliance. Therefore, although the XBRL reporting aims to reduce administrative burden (Troshani et al., 2018) and enhance data transparency and accessibility (Robb et al., 2016), it suffers from significant setup, implementation, education and training costs (Shan et al., 2015). This study therefore provides pertinent evidence to economies which are evaluating the feasibility of mandating XBRL reporting, such as Australia and New Zealand, that despite its high costs, the XBRL reporting reduces users’ IPC and can result in more informative prices and more efficient market.
Third, this study broadly contributes to literature on the benefit of technology advancement to financial markets. Following the studies of Bushee et al. (2003) and Blankespoor et al. (2013), which argue that technology can influence capital markets by transforming the traditional business activities and communications between firms and investors, the present study extends this research stream by exploring the impact of search-facilitating technology (i.e. XBRL) on market efficiency.
The remainder of this paper is organized as follows: Section 2 reviews the literature and develops hypotheses. Section 3 explains data sources, defines variables, and specifies analysis methods. Section 4 reports results. Section 5 conducts robustness checks, and Section 6 concludes the paper.
2. Literature and hypothesis development
The price informativeness is determined by the fraction of firm-specific information contained in the stock price. For example, Durnev et al. (2003) show that stocks with lower market-model r-square statistics are more informative as they can better predict the future earnings. In the following sections, we identify two channels through which the reduced IPC influence stock price informativeness—the information flow channel and the information disclosure channel.
2.1. Information flow and stock price informativeness
The flow of firm-specific information into stock prices is dependent on the cost of acquiring and processing it. For example, the early study of Grossman and Stiglitz (1980) argue that when the acquisition of new information is costly, the stock price only partially reflects the information of informed individuals, so that these individuals can be compensated for the costs of acquiring information during the temporary mispricing. More recently, Veldkamp (2006) shows that rational investors would always weigh the value of information against the cost of processing it (or IPC). The costliness of information acquisition and processing limits rational investors’ capacities, consequentially they can only focus on a subset of information, and that leads to partial information incorporation into stock prices.
With the implementation of XBRL, information in financial statements is tagged with elements in the accounting taxonomy. The information can be machine “read” and “understood,” and processed automatically. This lowered IPC has been shown to enhance firm-specific information flow. Evidence on the first wave of XBRL filers in the United States suggests that post-earnings announcement drift declines after the XBRL adoption (Efendi et al., 2014), owing to the reduced costs associated with information processing and analysis. Using the XBRL adoption, Dong et al. (2016) directly examine the effect of IPC on investors’ firm-specific information acquisition. They report that XBRL adopters experience a significant decrease of stock return synchronicity with the market and the industry related factors, an indication of enhanced firm-level information flow after the adoption. In light of this evidence, we hypothesize that
2.2. Information disclosure and price informativeness
Although it is intuitive to expect increased firm disclosure to improve price informativeness because the stock price can immediately reflect all new information at the disclosures, the link between IPC and disclosures is not as straight forward. Prior studies suggest that the ability of market participants to acquire, assess and integrate information disclosed by firms is limited by the cost of processing it (Bloomfield, 2002; Hirshleifer and Teoh, 2003). For example, there are generally higher costs associated with processing information of more complexity or of larger volume. This can result in partial processing of information (Drake et al., 2016; Hirshleifer et al., 2009), reduced trading by investors (Miller, 2010), and consequently, a delay in information incorporation into price. Therefore, because IPC affects the amount of information processed by investors, and hence their response to firm disclosure, it should also affect firms’ benefits of disclosure or their disclosure choices. In an information environment of low IPC, investors pay more attention to firm disclosure as they are able to process information at low costs, increasing firms’ benefit to disclosure or cost of non-disclosure. Conversely, if processing costs are high, investors are less responsive to disclosure and essentially unable to identify non-disclosure. Blankespoor (2019) shows that, after the XBRL adoption, the reduced IPC induces firms to disclose more in their financial statements. In light of this evidence, we expect the increased disclosure to improve price informativeness, and thus formally hypothesize that
2.3. Effects of public disclosure history on stock price informativeness
Barry and Brown (1985) suggest that a firm’s age is closely related to the amount of firm-specific information available in the market. For instance, investors of newly listed firms are more likely be uncertain about those firms’ fundamentals and future outlook. Such an uncertainty issue is due to limited historical information disclosure made by those firms. This issue, however, can be mitigated with regular disclosure over longer periods so the market gradually learns more about them. 2 The counterfactual is firms which have been listed for a long period. The market is able to incorporate more firm-specific characteristics into stock price of these firms from their past and present disclosure (Dasgupta et al., 2010; Lee and Liu, 2011). Given that XBRL supports more timely and accurate disclosure by firms that enables faster information incorporation at lower costs to reduce information asymmetry, we expect a stronger effect in relatively younger, new-to-market firms that have not had a long disclosure history in the past. It is formally stated as
3. Data and methods
3.1. Data and sample
We collect XBRL filing data from the EDGAR database of Interactive Data Filings and RSS Feeds. For each firm, the initial XBRL filing date is considered the adoption date. For each 10 K filing, a firm discloses its registrant and public float as the end of the most recently completed second fiscal quarter, which become the criteria to determine whether it is required to mandatorily adopt XBRL in the following fiscal year. In the data refining process, we exclude all voluntary filers and foreign firms. 4 For each firm-year observation, we select a balanced time window within a 3-year pre- and post-XBRL adoption period. The whole sample covers the period of 2006–2015. The first batch of adoption was in 2009 and the last batch was in 2012. The data on annual accounting figures, stock prices, and analyst forecasts are obtained from COMPUSTAT, the Center for Research in Security Prices (CRSP), and Institutional Brokers’ Estimate System (I/B/E/S), respectively. The final sample consists of 12,119 firm-year observations after removing missing firm-specific data.
3.2. Dependent variables
Following prior studies, idiosyncratic volatility (e.g. Becchetti et al., 2015; De Cesari and Huang-Meier, 2015; Ferreira et al., 2011; Gul et al., 2011) is the first variable used here to proxy for price informativeness. It captures the component in stock return variation that is not attributable to any market-wide or industry-wide factors, but rather, to the firm-related fundamentals. Thus, this component (idiosyncratic volatility–IV) is linked to how much the price varies with firm-specific information. To computer this measure, we employ the method used by Crawford et al. (2012) and Dong et al. (2016) to regress the return variation on the basis of both weekly market and industry returns to measure the IV as follows

where

We also follow past studies to use price impact as a second proxy for price informativeness. These studies (e.g. Lee and Liu, 2011) document that informative price is reflected in lower level of information asymmetry in the stock market trading, and hence, the market impact of trades is lowered when price becomes more informative. The Price impact (PIM) is the estimated coefficient from regressing the absolute daily stock return on daily trading volume (Blankespoor et al., 2014; Pastor and Stambaugh, 2003)

where

Analyst forecast quality/forecast dispersion is the third measured considered as a proxy for price informativeness (Balkanska, 2018; Beekes and Brown, 2006; Felo et al., 2018; Lee and Liu, 2011; Li and Chen, 2016). Intuitively, a more informative stock price should reflect better analyst forecast quality, and smaller dispersion among these estimates. The analyst forecast quality (F_DISP) is measured as analyst earning forecast dispersion, calculated as the standard deviation of forecasted earnings per share (

where
3.3. Independent variables and the controls
The staggered XBRL phase-in procedure is a quasi-natural experiment that creates treatment and control groups within the full sample across periods. This enables estimation of the treatment effect in a pooled difference-in-differences (DID) framework (Brugler et al., 2018). The main independent variable for the analysis is POST, coded as 1 if the firm-year is post-XBRL adoption, and 0 otherwise. 5 In addition, To account for firms’ quantitative disclosure as outlined in H2, we follow Blankespoor (2019) to adopt the same variable, the number of “numbers” included in the footnotes within the SEC annual filing by firms, scaled by firm size times 100, denoted as NUM_FN.
The firm-specific control variables used in relevant literature (Crawford et al., 2012; Dasgupta et al., 2010; Dong et al., 2016; Gul et al., 2011; Hutton et al., 2009; Kim et al., 2012; Kim and Shi, 2012; Piotroski and Roulstone, 2004) are also included in the regression analysis: the firm size (SIZE), measured as the natural logarithm of a firm’s market capitalization for the fiscal year end; the market-to-book ratio (MB), measured as market capitalization scaled by the book value of equity for the fiscal year end; the leverage ratio (LEV), measured as total long-term debt divided by total assets; the profitability (ROA), measured as income before extraordinary items divided by total assets; the volatility of profitability (V_ROA), measured as the standard deviation of the ROA ratio in the past 5 years; and the analysts following (N_ANA), measured as number of analysts following the firm in that fiscal year. In addition, some industry-specific factors are included, that is, the industry size (IND_SIZE), measured as natural logarithm of the number of firms in the industry to which firm i belongs, and the industry competition (IND_COMP), measured as sum of the squared terms of the proportion of a firm’s revenue to total revenue in the industry to which firm i belongs. The variable definitions are summarized in Table 1.
Variables definitions.
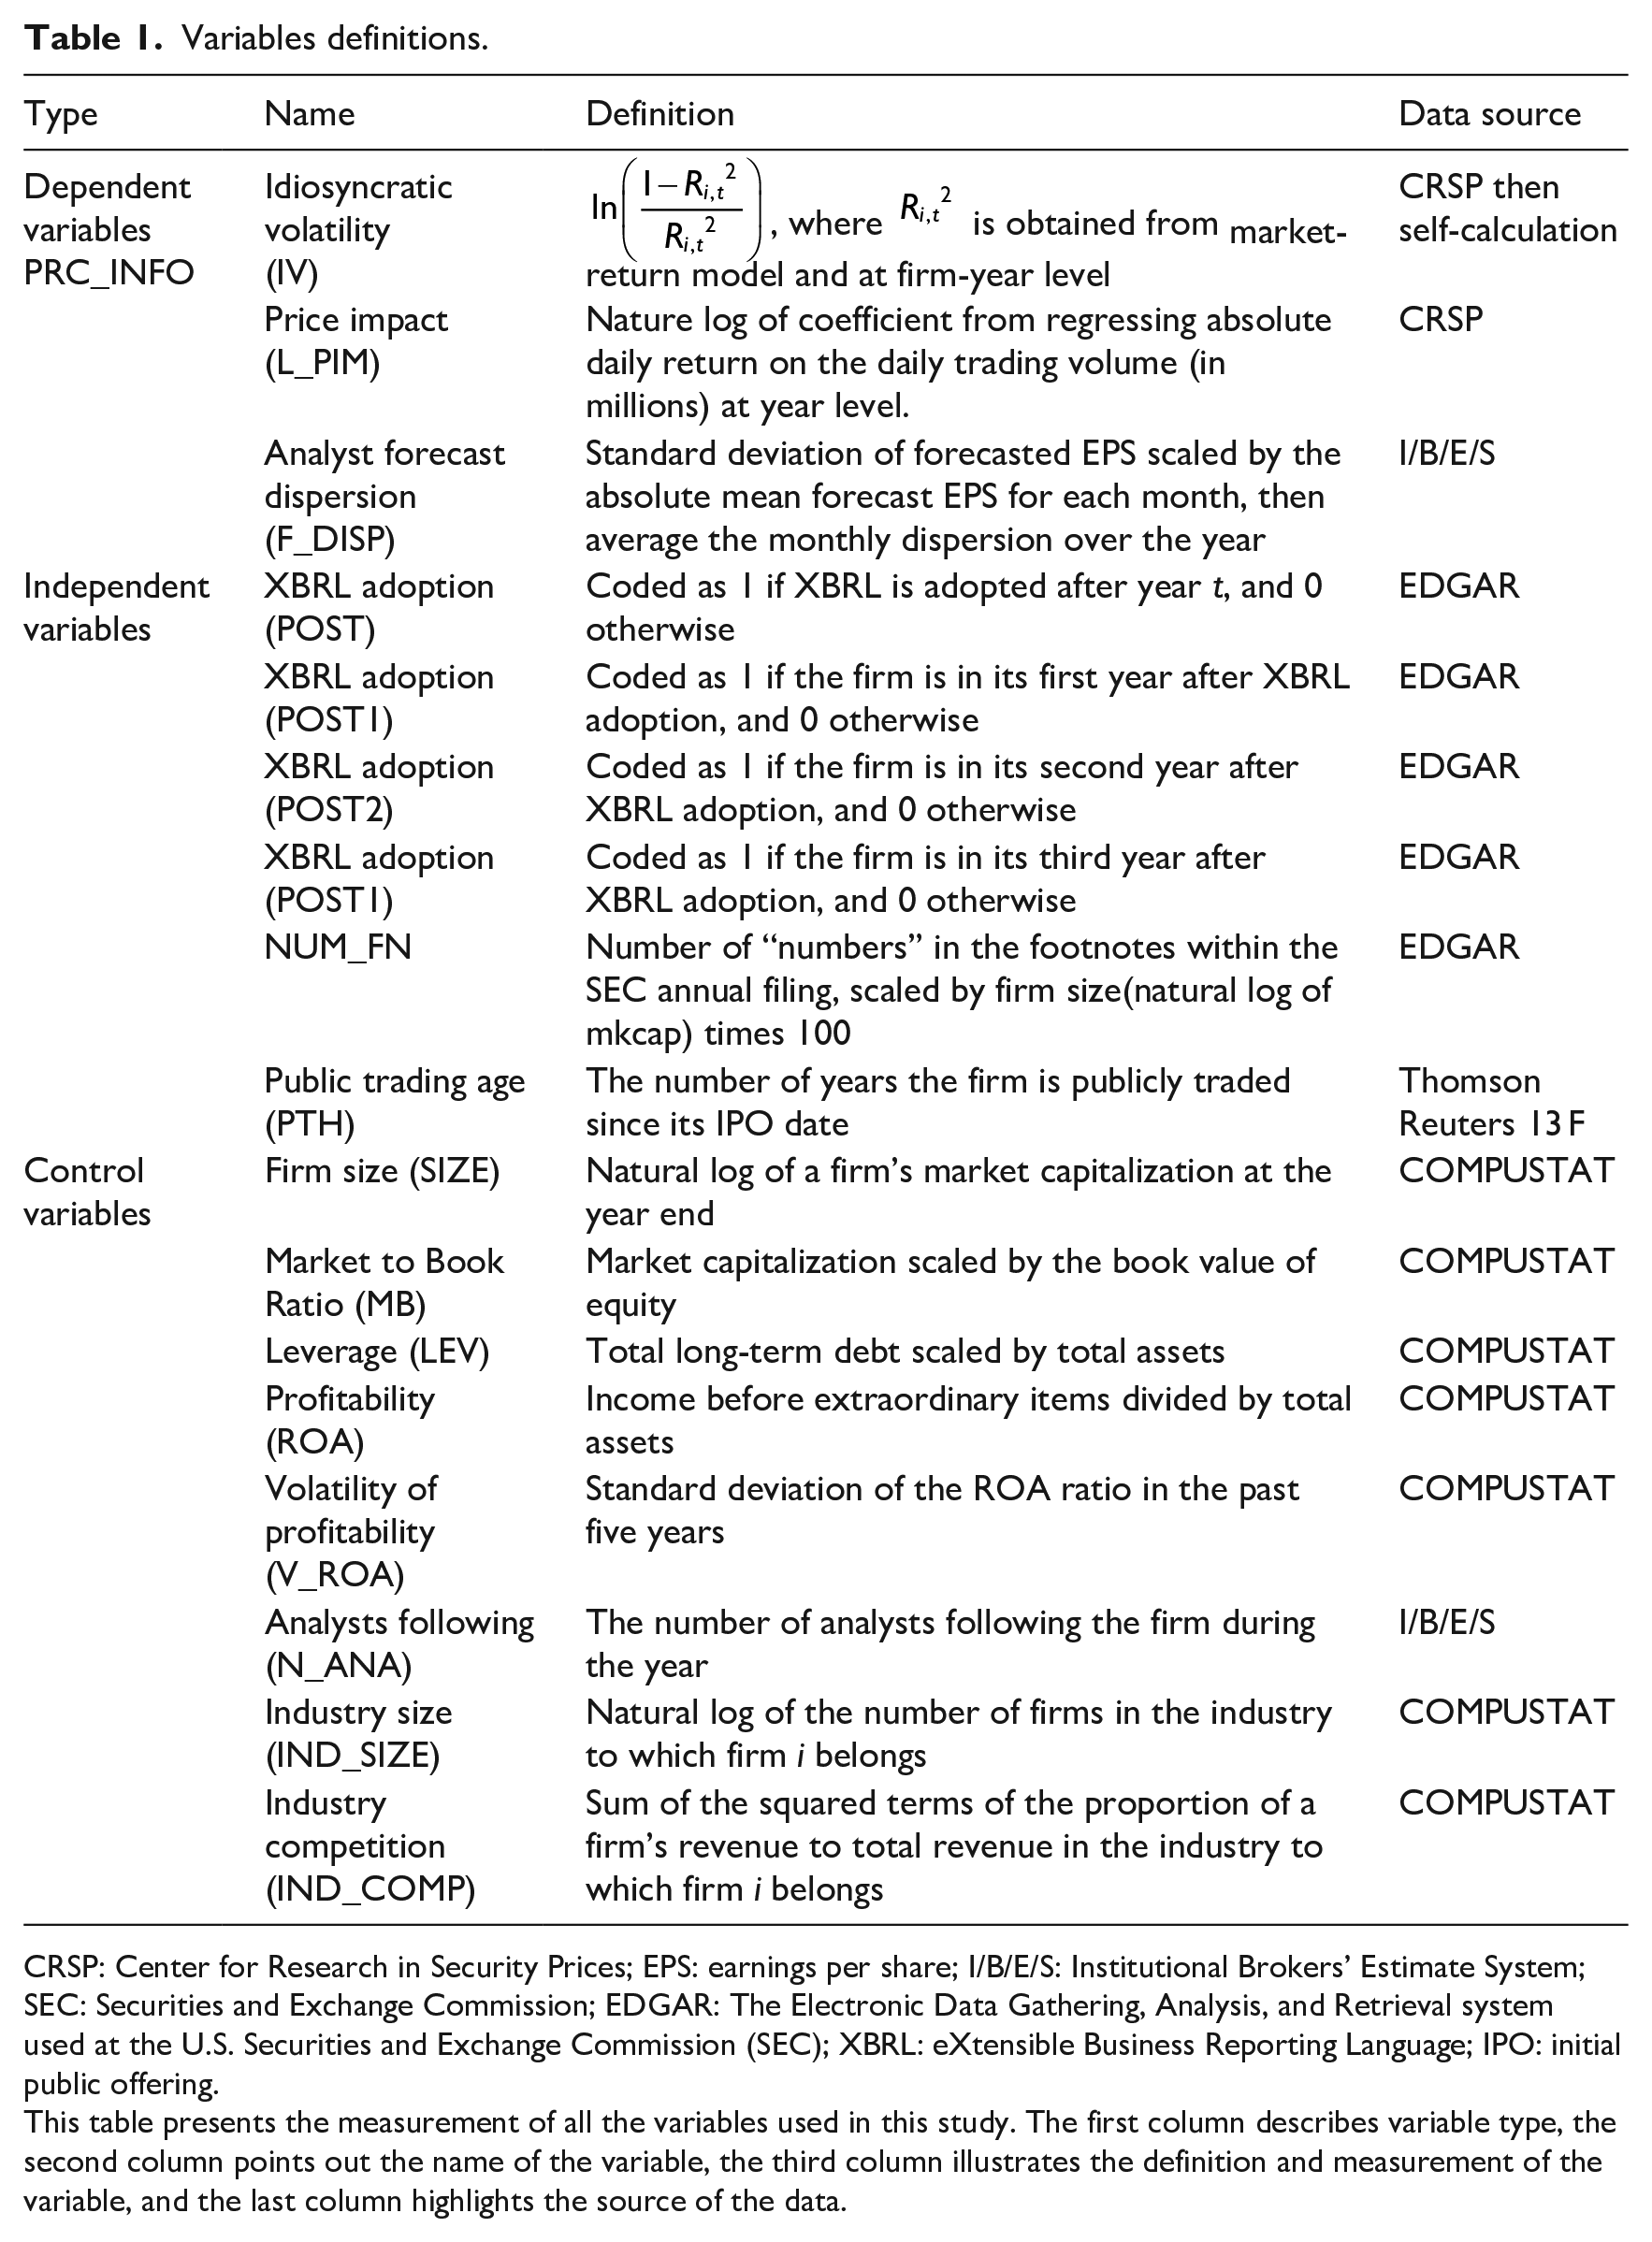
CRSP: Center for Research in Security Prices; EPS: earnings per share; I/B/E/S: Institutional Brokers’ Estimate System; SEC: Securities and Exchange Commission; EDGAR: The Electronic Data Gathering, Analysis, and Retrieval system used at the U.S. Securities and Exchange Commission (SEC); XBRL: eXtensible Business Reporting Language; IPO: initial public offering.
This table presents the measurement of all the variables used in this study. The first column describes variable type, the second column points out the name of the variable, the third column illustrates the definition and measurement of the variable, and the last column highlights the source of the data.
3.4 Research design
To test our hypotheses, we estimate panel regressions with firm and year fixed effects, and robust standard errors clustering at firm level to control for within-cluster correlation of the residuals. 6 The baseline model for Hypothesis 1 is given as

where PRC_INFO stands for one of the three price informativeness measures, IV, PIM and F_DISP, for the firm in year t. The coefficient on POST captures how XBRL affects price informativeness in periods before and after the adoption.
To examine whether XBRL adoption has a progressive impact on price informativeness, we substitute variable POST in Model 1 for POST1, POST2, and POST3, each of which is coded one if the firm is in the first, second or third year of the adoption, respectively, and zero otherwise. This enables us to differentiate the adoption effect on PRC_INFO in each of the first 3 years after the adoption. If there is a learning curve until a firm can fully capitalize the benefit of XBRL, the magnitude of coefficients on POST1, POST2, and POST3 should exhibit an upward trend, that is,|βy3| >|βy2| >|βy1|

The next model is used to investigate the association between information disclosures and price informativeness outlined in H2. Specifically, we use the same measure as Blankespoor (2019), the quantitative disclosure in the footnotes (NUM_FN), as the key independent variable. Then the following model is constructed to examine whether increased disclosures since the XBRL adoption are associated with greater price informativeness

Last, we test whether the impact of XBRL adoption varies among firms of different public disclosure history. We measure firms’ public disclosure history as the number of years since the initial public offering (IPO) date. A univariate analysis is first undertaken in a DID method. Specifically, we divide the whole sample into two subsamples of long and short disclosure history using the median value. For each stock, we first compute the average difference in PRC_INFO variables between pre- and post-XBRL periods. Then, we compare the differences across two subsamples. If the XBRL impact is more pronounced for the group of firms with a short disclosure history, then the PRC_INFO increment should be significantly larger for those firms, relative to the group with a long disclosure history. In the regression analysis, we include disclosure history (PTH) as a continuous variable, and interact it with the post-XBRL dummy variable, POST×PTH, as shown in Model 4 below

4. Results
4.1. Descriptive statistics
Table 2 presents the descriptive statistics of the main variables in our empirical analysis. This study focuses on US firms that mandatorily adopted XBRL from 2009, and the sample consists of 12,119 firm-year observations for 2006–2015. The variable of interest is price informativeness, for which we use three proxies: IV, PIM and F_DISP. The mean (median) of IV is 0.833 (0.741) with values of 1.534 and 3.072 at 75th and 95th percentile, respectively. This distribution is consistent with Durnev et al. (2004) that IV is usually skewed. Similarly, the statistics for PIM and F_DISP are also influenced by the skewness of distribution, that is, the mean (median) for PIM is 0.132 (0.034) and the mean (median) for F_DISP is 0.232 (0.056).
Descriptive statistics.
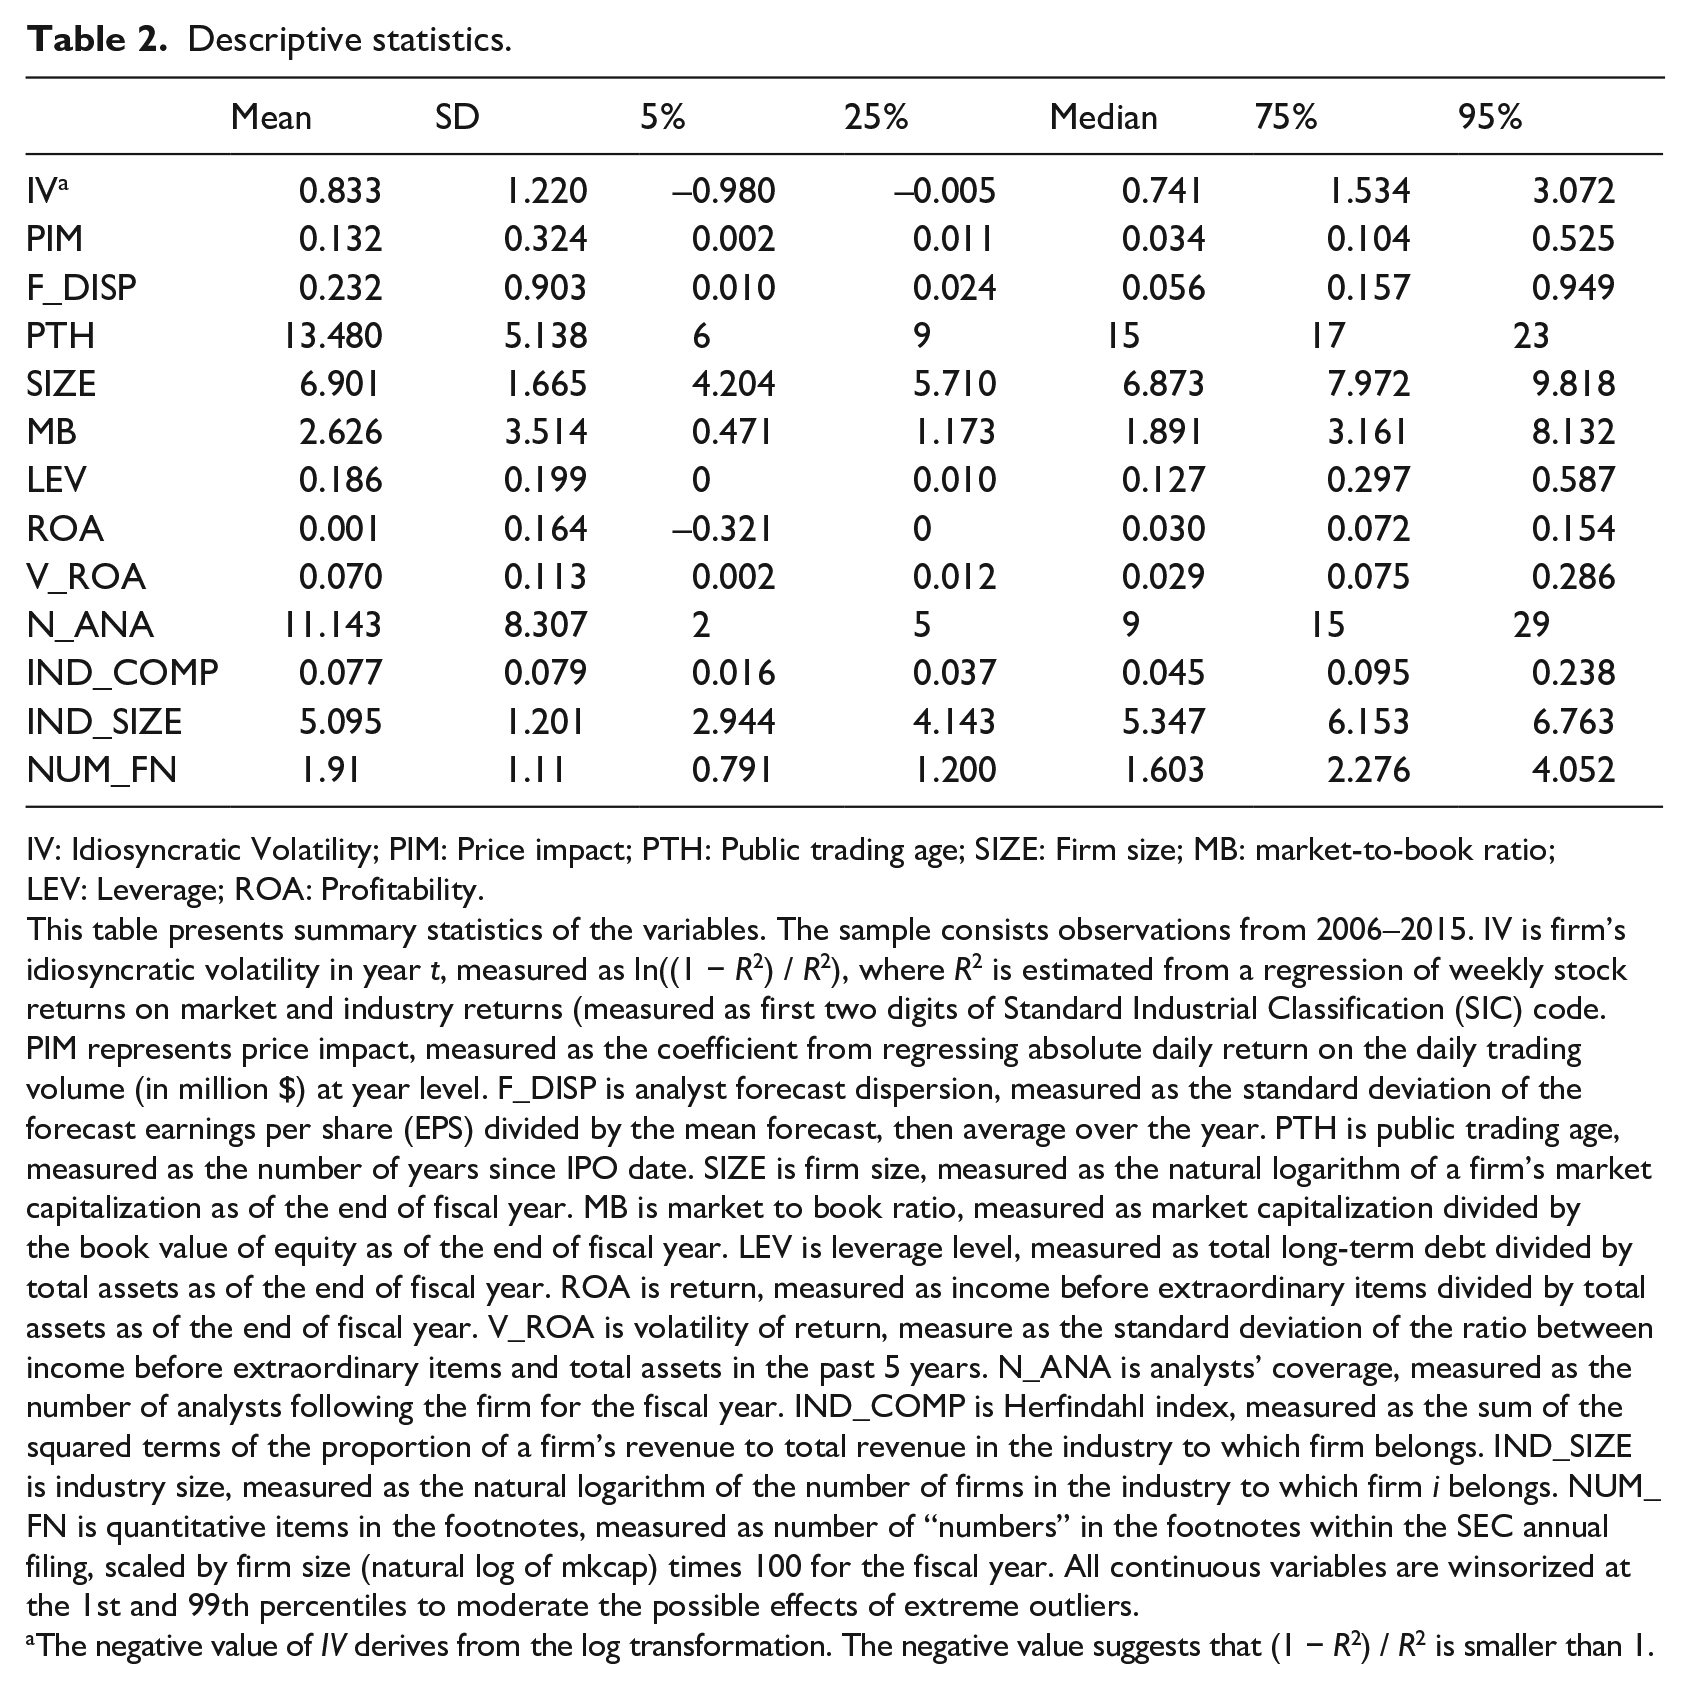
IV: Idiosyncratic Volatility; PIM: Price impact; PTH: Public trading age; SIZE: Firm size; MB: market-to-book ratio; LEV: Leverage; ROA: Profitability.
This table presents summary statistics of the variables. The sample consists observations from 2006–2015. IV is firm’s idiosyncratic volatility in year t, measured as ln((1 − R2) / R2), where R2 is estimated from a regression of weekly stock returns on market and industry returns (measured as first two digits of Standard Industrial Classification (SIC) code. PIM represents price impact, measured as the coefficient from regressing absolute daily return on the daily trading volume (in million $) at year level. F_DISP is analyst forecast dispersion, measured as the standard deviation of the forecast earnings per share (EPS) divided by the mean forecast, then average over the year. PTH is public trading age, measured as the number of years since IPO date. SIZE is firm size, measured as the natural logarithm of a firm’s market capitalization as of the end of fiscal year. MB is market to book ratio, measured as market capitalization divided by the book value of equity as of the end of fiscal year. LEV is leverage level, measured as total long-term debt divided by total assets as of the end of fiscal year. ROA is return, measured as income before extraordinary items divided by total assets as of the end of fiscal year. V_ROA is volatility of return, measure as the standard deviation of the ratio between income before extraordinary items and total assets in the past 5 years. N_ANA is analysts’ coverage, measured as the number of analysts following the firm for the fiscal year. IND_COMP is Herfindahl index, measured as the sum of the squared terms of the proportion of a firm’s revenue to total revenue in the industry to which firm belongs. IND_SIZE is industry size, measured as the natural logarithm of the number of firms in the industry to which firm i belongs. NUM_FN is quantitative items in the footnotes, measured as number of “numbers” in the footnotes within the SEC annual filing, scaled by firm size (natural log of mkcap) times 100 for the fiscal year. All continuous variables are winsorized at the 1st and 99th percentiles to moderate the possible effects of extreme outliers.
The negative value of IV derives from the log transformation. The negative value suggests that (1 − R2) / R2 is smaller than 1.
4.2. The information flow channel
To investigate the impact of IPC on price informativeness using XBRL adoption, we begin with a univariate analysis. Split the full sample into two subsamples in accordance with the time of firms’ XBRL adoption, we compare the difference between the mean values of each PRC_INFO variable during the pre- and post-XBRL periods. If after the XBRL mandate, the reduced IPC facilitates information exchange and improves information quality, PRC_INFO should improve significantly in the period after XBRL adoption. The results presented in Table 3 show that all PRC_INFO variables have significantly improved since XBRL. For instance, the mean value of IV increased from 0.609 in the pre-XBRL period to 1.031 in the post-XBRL period, a significant increment of 0.421 (Table 3).
The information flow channel: univariate analysis.

XBRL: eXtensible Business Reporting Language; IV: Idiosyncratic Volatility; PIM: Price impact.
This table presents the results of the t-test for price informativeness proxies between pre-XBRL and post-XBRL period. The sample consists observations from 2006–2015. IV is firm’s idiosyncratic volatility in year t, measured as ln((1 − R2) / R2), where R2 is estimated from a regression of weekly stock returns on market and industry returns (same industry is measured as first two digits of Standard Industrial Classification (SIC) code. PIM represents price impact, measured as the coefficient from regressing absolute daily return on the daily trading volume (in million $) at year level. F_DISP is analyst forecast dispersion, measured as standard deviation of the forecast EPS divided by the mean forecast then average over the year. Mean (pre) is the mean of the variable in pre-XBRL period (when POST is coded as 0). Mean (post) is the mean of the variable in post-XBRL period (when POST is coded as 1). PRE minus POST is the difference between the mean of variable in pre-XBRL period and post-XBRL period (mean of pre-XBRL minus mean of post-XBRL).
, **, and * indicate significance at the 1%, 5%, and 10% levels, respectively, using two-tailed tests.
To incorporate the firm-specific control variables, we conduct panel regression in a pooled DID setting with firm-year fixed effects and firm-level cluster standard errors. The results are presented in Table 4. In Models (1), the coefficients on the dummy variable, POST, capture how reduced IPC impacts each of the three measures of price informativeness in the period after the XBRL adoption. Specifically, the coefficient on POST for IV (idiosyncratic volatility) is significantly positive, suggesting that after XBRL adoption, the extent to which the stock price is explained by firm’s fundamental information, increases by 0.16%. This coincides with Dong et al. (2016) on the decreased synchronicity, and supports H1 that after the adoption, lowered IPC induces more information flow into prices that leads to a greater extent of stock return variation due to firms-specific information.
The information flow channel.

IV: idiosyncratic volatility; PIM: price impact; SIZE: firm size; MB: market-to-book ratio; LEV: leverage; ROA: profitability; V_ROA: volatility of profitability; N_ANA: number of analysts following; IND_COMP: industry competition; IND_SIZE: industry size.
The regression results of the effect of XBRL adoption on price informativeness. The dependent variables are IV, PIM and F_DISP. The variable POST equals 1 if a firm-year is after a firm’s XBRL adoption, and 0 otherwise. POST1/POST2/POST3 equals 1 if the firm is in its first/second/third year after XBRL adoption, and 0 otherwise. The control variables are defined in Table 1. All continuous variables are winsorized at the 1st and 99th percentiles to moderate the possible effects of extreme outliers. t-statistics (reported in parentheses) are computed based on standard errors clustered at the firm level.
, **, and * indicate significance at the 1%, 5%, and 10% levels, respectively, using two-tailed tests.
Model (2) tests whether there is a learning effect on the XBRL adoption given its technical complexity. Echoing Dong et al.’s (2016) finding on synchronicity, the statistically significant coefficients on POST1, POST2, and POST3 suggest that price becomes more informative each year in the first 3 years after firms file XBRL. In addition, our results uncover that the magnitude of these coefficients increases over time (i.e.|βy3| >|βy2| >|βy1|). 7
4.3. The disclosure channel
The estimated results in Table 5 verify the disclosure channel. Blankespoor (2019) shows an increase in the number of quantitative footnotes included in firms’ financial reports since they adopt XBRL filing. The significant and positive coefficient on NUM_FN in Model (1) suggests that the increased information disclosure is also associated with higher IV, that is, return variation due to firm-specific factors, supporting H2 that more informed stock price is also through greater amount of information production and disclosure by firms after the XBRL.
The information disclosure channel.

IV: idiosyncratic volatility; PIM: price impact; SIZE: firm size; MB: market-to-book ratio; LEV: leverage; ROA: profitability; V_ROA: volatility of profitability; N_ANA: number of analysts following; IND_COMP: industry competition; IND_SIZE: industry size.
This table presents regression estimates on the effect of increased disclosure on price informativeness. IV is firm’s idiosyncratic volatility in year t, measured as ln((1 − R2) / R2), where R2 is estimated from a regression of weekly stock returns on market and industry returns (same industry is measured as first two digits of Standard Industrial Classification (SIC) code). PIM represents price impact, measured as the nature logarithm of the coefficient from regressing absolute daily return on the daily trading volume (in million $) at year level. F_DISP is analyst forecast dispersion, measured as standard deviation of the forecast EPS divided by the mean forecast then average over the year. We use NUM_FN to stand for quantitative disclosure in the footnotes, measured as number of “numbers” in the footnotes within the SEC annual filing, scaled by firm size (natural log of market cap) times 100 for the fiscal year. The control variables are defined in Table 1. All continuous variables are winsorized at the 1st and 99th percentiles to moderate the possible effects of extreme outliers. t-statistics (reported in parentheses) are computed based on standard errors clustered at the firm level.
, **, and * indicate significance at the 1%, 5%, and 10% levels, respectively, using two-tailed tests.
4.4. Regression analysis on disclosure history and price informativeness
In this section, we test whether firms with short disclosure history benefit more from reduced IPC after the XBRL mandate. The univariate analysis in a DID method defined in Section 3.4 is presented in Table 6. The predictions for this analysis are twofold. First, we expect a significant improvement in PRC_INFO from the pre-XBRL to post-XBRL stage in each group with short and long disclosure history. Second, we also expect the difference of the improvement between the two groups (SHORT–LONG) to be significantly positive to support our hypothesis that firms with a shorter disclosing history experience greater improvement. Confirming our predictions, our results show prices more informative after XBRL adoption (DIFF), and the improvement is significantly greater in the group of firms with shorter disclosure history (DIFF in DIFF).
The XBRL effect and firm disclosure history: univariate difference-in-difference analysis.

IV: idiosyncratic volatility; PIM: price impact.
The results of comparing the impact on price informativeness between firms with relatively short trading age and long trading age are presented. IV is firm’s idiosyncratic volatility in year t, measured as ln((1 − R2) / R2), where R2 is estimated from a regression of weekly stock returns on market and industry returns (same industry is measured as first two digits of Standard Industrial Classification (SIC) code. PIM represents price impact, measured as the nature logarithm of the coefficient from regressing absolute daily return on the daily trading volume (in million $) at year level. F_DISP is analyst forecast dispersion, measured as standard deviation of the forecast EPS divided by the mean forecast then average over the year. SHORT represents the group of firms which have relatively short trading age (below the mean), and LONG represents the group of firms which have relative long trading age (on or above the mean). PRE is the mean in pre-XBRL adoption period (when POST = 0). POST is the mean in post-XBRL adoption period (when POST = 1). DIFF in portfolio SHORT (LONG) is the difference in mean between pre-XBRL and post-XBRL period in firms with relatively short (long) trading age (post–pre). DIFF IN DIFF is the difference of difference, measured as the difference of mean difference between SHORT and LONG group (DIFF in SHORT—DIFF in LONG). t-statistics is reported in parentheses.
, **, and * indicate significance at the 1%, 5%, and 10% levels, respectively, using two-tailed tests.
We next undertake regression analysis to test the interactive effect of XBRL adoption and public trading age (PTH) with control variables for firm- and industry-specific characteristics. 8 Estimated results in Table 7 show that the coefficients on POST and on the interactive term POST×PTH are both significant and of opposite signs, suggesting that the benefit of XBRL adoption reduces for firms with a longer disclosure history. In other words, new-to-market firms with short disclosure history benefit more from XBRL adoption, supporting our initial conjecture.
The XBRL effect and firm disclosure history: regression for XBRL and public disclosure history.

IV: idiosyncratic volatility; PIM: price impact; PTH: public trading age; SIZE: firm size; MB: market-to-book ratio; LEV: leverage; ROA: profitability; V_ROA: volatility of profitability; N_ANA: number of analysts following; IND_COMP: industry competition; IND_SIZE: industry size.
Results of the interactive effect of XBRL adoption and public trading age on price informativeness are provided. The sample consists observations from 2006–2015. IV is firm’s idiosyncratic volatility in year t, measured as ln((1 − R2) / R2), where R2 is estimated from a regression of weekly stock returns on market and industry returns (same industry is measured as first two digits of Standard Industrial Classification (SIC) code. PIM represents price impact, measured as the nature logarithm of the coefficient from regressing absolute daily return on the daily trading volume (in million $) at year level. F_DISP is analyst forecast dispersion, measures as standard deviation of the forecast EPS divided by the mean forecast then average over the year. POST equals 1 if a firm-year is after a firm’s XBRL adoption, and 0 otherwise. PTH is disclosure history, measured as the years since this firm is publicly traded (since IPO date). The control variables are defined in Table 1. All continuous variables are winsorized at the 1st and 99th percentiles to moderate the possible effects of extreme outliers. t-statistics (reported in parentheses) are computed based on standard errors clustered at the firm level.
, **, and * indicate significance at the 1%, 5%, and 10% levels, respectively, using two-tailed tests.
5. Robustness checks
5.1. The additional measures
Two alternative measures of price informativeness are employed to test the robustness of our results—the price impact and the analyst forecast dispersion, in Table 3. The price impact is adopted as a second measure to investigate the impact of IPC on price informativeness from market liquidity perspective. The univariate analysis shows a significant decrease in the price impact since the adoption of XBRL (Table 3). We also find negative and significant coefficients on PIM in Model (3) and (4), Table 4. These results are consistent with prior literature (Lee and Liu, 2011; Li et al., 2012) that reduced IPC leads to lower price impact and thus improves market liquidity.
Given that stock price changes around informative events such as earnings announcements to reflect the degree of price informativeness, it is important to include a measure for price informativeness that takes into account of such event. Comparing the analyst forecast dispersion from before and after the XBRL adoption, we show in Table 3 a significant increase of analyst forecast accuracy post-XBRL. This corroborates with the negative significant coefficients of F_DISP in Model (5) and (6) of Table 4. For instance, the coefficient in Model (5) indicates that analyst forecast dispersion after the XBRL adoption is reduced by 0.067%.
The effect of XBRL via disclosure channel for these two measures are shown in Models (2) and (3) of Table 5. While a negative significant coefficient on PIM suggests that increased disclosure improves liquidity and reduce price impact, the analyst forecast accuracy remains insignificant as a result of more disclosure. This implies that the increased disclosure in the footnote of XBRL reporting is not substantial enough to improve analyst forecast accuracy. As the most attentive group of investors, analysts have powerful resources to process information. The marginal benefit of increased disclosure seems un-noticeable in terms of improving their forecast accuracy.
5.2. Analysis on individual batches
As XBRL is rolled out in three phases, it is reasonable to expect the impact on price informativeness to be different between batches (Blankespoor, 2019). To test this, we focus on the first two batches 9 during their year of adoption, and hence constructing two subsamples over 2008–2009 and 2009–2010. In a pooled DID setting, the adopters form the treatment sample and all the non-adopters form the control sample. 10 This method eliminates factors such as the Global Financial Crisis that significantly affected firm performance over the 2008–2009 period. For instance, in the subsample of 2009 XBRL adoption, we limit our sample period to 2008 and 2009, and only include firms with XBRL adoption in 2009 or later. Therefore, firms that adopted in 2009 form the treatment sample, marked by a dummy variable Treat coded 1 for the treatment sample, and 0 for the otherwise. 11 A year indicator variable Yr_DUM is defined to equal 1 for year 2009, and 0 for 2008. Then, the interaction between these two dummy variables, Treat × Yr_DUM, captures the behavior of 2009 adopting firms as a result of XBRL, relative to the control sample. We apply the same approach to form the second subsample over 2009–2010 for firms that adopted XBRL in 2010. The model specification is 12

The results for individual batches are reported in Table 8 for IV. 13 It shows that coefficients on the interactive term are insignificant for the first batch (Model 1 and 2), while they are statistically significant for the second batch (Model 3 and 4), indicating that after controlling for all other factors, the second-batch adopters benefit more than first-batch adopters in the year of their adoption.
Regression on individual batches.

SIZE: Firm size; MB: market-to-book ratio; LEV: Leverage; ROA: Profitability; V_ROA: volatility of profitability; N_ANA: number of analysts following; IND_COMP: industry competition; IND_SIZE: industry size.
This table presents regression estimates on the effect of XBRL adoption on price informativeness for individual batch of stocks that adopted in 2009 and 2010, respectively. The dependent variable IV is firm’s idiosyncratic volatility in year t measured as ln((1 − R2) / R2), where R2 is estimated from a regression of weekly stock returns on market and industry returns (same industry is measured as first two digits of Standard Industrial Classification (SIC) code. The 2009 adoption has a sample of 2008–2009 using stocks that adopted in 2009. The 2010 adoption has a sample of 2009–2010 using stocks that adopted in 2010. TREAT is treatment dummy, equals 1 for a treatment firm, and 0 for the rest that form the control sample. Yr_DUM is year dummy, coded 1 for the adoption year 2009 or 2010 for each sample, and 0 for the control (pre-XBRL) year. The control variables are defined in Table 1. All continuous variables are winsorized at the 1st and 99th percentiles to moderate the possible effects of extreme outliers. t-statistics (reported in parentheses) are computed based on standard errors clustered at the firm level.
, **, and * indicate significance at the 1%, 5%, and 10% levels, respectively, using two-tailed tests.
5.3. Placebo test
Although our findings confirm that firms with XBRL adoption are better off, we find that some firm-specific control variables, such as firm size, leverage, the number of analysts following, and industry competition and size, are consistently significant in the regression estimation (see Tables 3 to 8). One concern arising herein is whether our results could be driven by these firm characteristics. For example, a more informative price could be due to increase in number of analysts following, which might have occurred by chance in the same year that the firm adopted XBRL. To disentangle firm-characteristic effects from that of XBRL, we conduct a placebo test using the real adopting and control firms in the 2009 and 2010 adoption batches, and estimate regressions over a period prior to adoption assuming the adoption was in that year.
Specifically, we choose a 2-year period, 2007–2008, for 2009 adopters and control firms, and 2008–2009 for 2010 adopters and control firms. The results presented in Table 9 show that coefficients on the interactive terms (Treat×Yr_DUM) are insignificant for all three proxies of price informativeness in both batches. These findings suggest that there is no improvement in price informativeness in the absence of XBRL implementation over the estimated periods, and the causal effect of XBRL on price informativeness is unlikely to be driven by firm-specific characteristics.
Placebo tests.
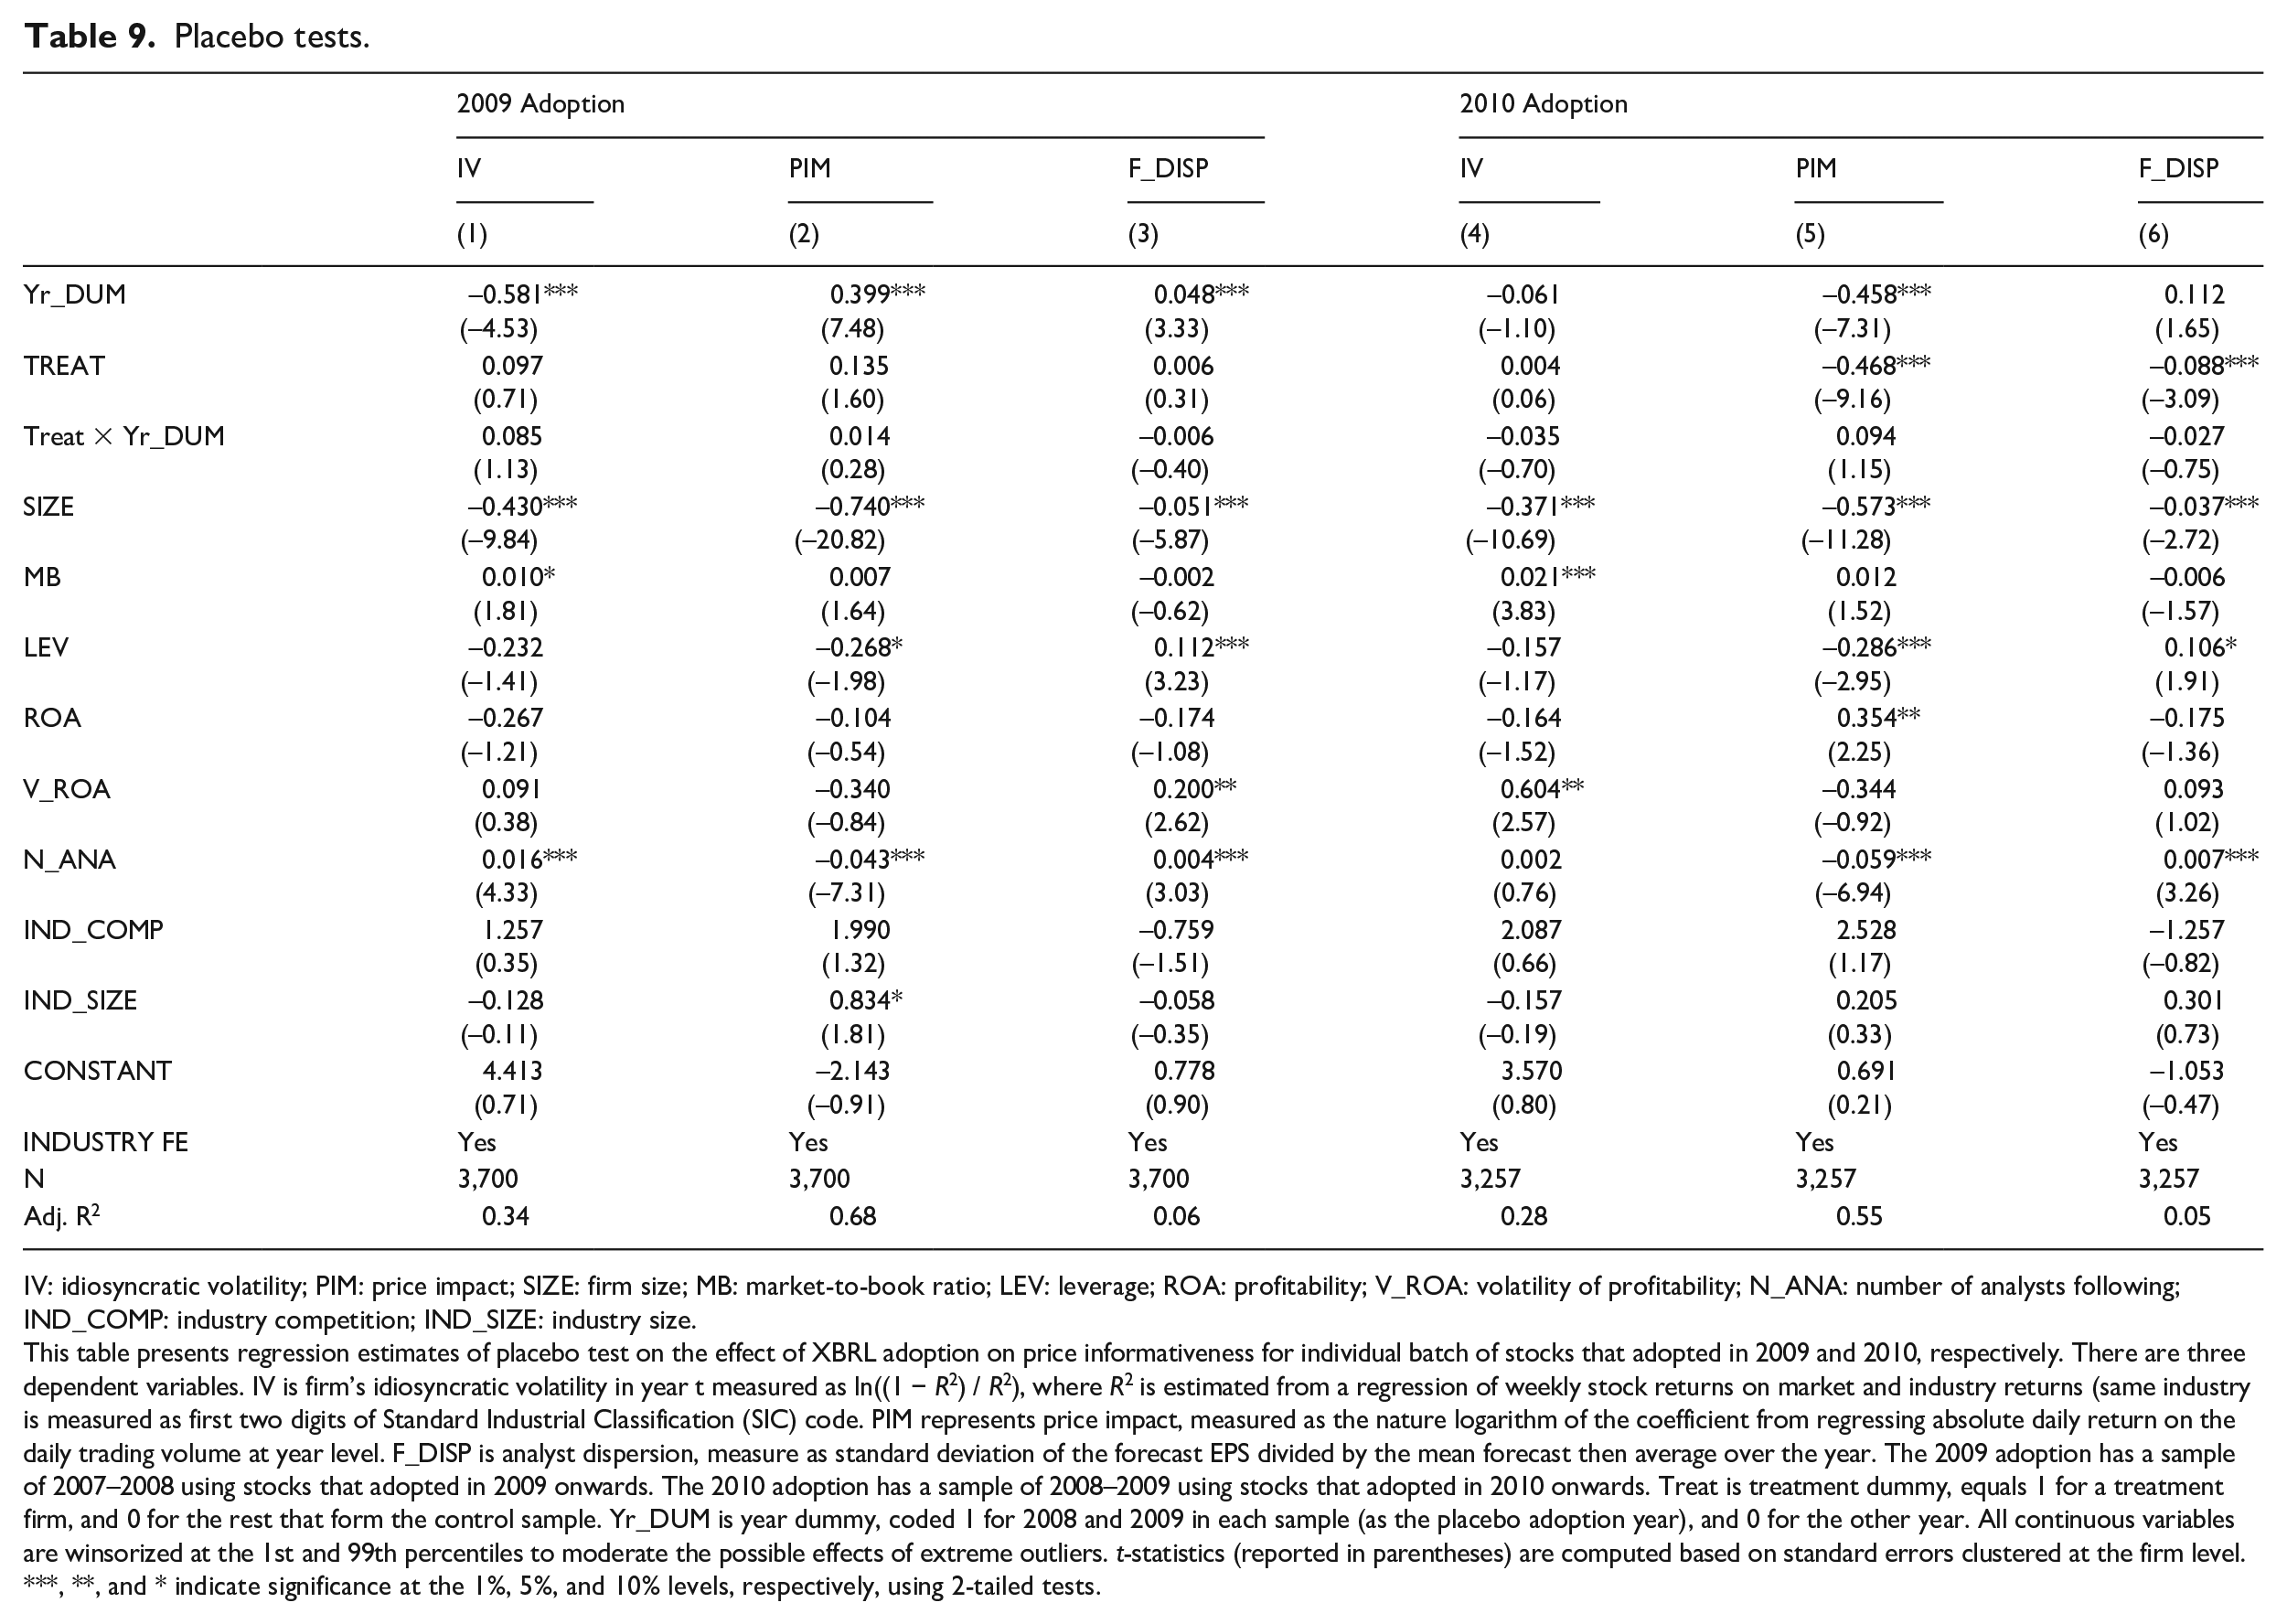
IV: idiosyncratic volatility; PIM: price impact; SIZE: firm size; MB: market-to-book ratio; LEV: leverage; ROA: profitability; V_ROA: volatility of profitability; N_ANA: number of analysts following; IND_COMP: industry competition; IND_SIZE: industry size.
This table presents regression estimates of placebo test on the effect of XBRL adoption on price informativeness for individual batch of stocks that adopted in 2009 and 2010, respectively. There are three dependent variables. IV is firm’s idiosyncratic volatility in year t measured as ln((1 − R2) / R2), where R2 is estimated from a regression of weekly stock returns on market and industry returns (same industry is measured as first two digits of Standard Industrial Classification (SIC) code. PIM represents price impact, measured as the nature logarithm of the coefficient from regressing absolute daily return on the daily trading volume at year level. F_DISP is analyst dispersion, measure as standard deviation of the forecast EPS divided by the mean forecast then average over the year. The 2009 adoption has a sample of 2007–2008 using stocks that adopted in 2009 onwards. The 2010 adoption has a sample of 2008–2009 using stocks that adopted in 2010 onwards. Treat is treatment dummy, equals 1 for a treatment firm, and 0 for the rest that form the control sample. Yr_DUM is year dummy, coded 1 for 2008 and 2009 in each sample (as the placebo adoption year), and 0 for the other year. All continuous variables are winsorized at the 1st and 99th percentiles to moderate the possible effects of extreme outliers. t-statistics (reported in parentheses) are computed based on standard errors clustered at the firm level.
, **, and * indicate significance at the 1%, 5%, and 10% levels, respectively, using 2-tailed tests.
5.4. Non-financial and non-utility industries
So far our results are obtained for firms from all industries. Some studies (e.g. Chen et al., 2017; Dong et al., 2016; Kim et al., 2018) suggest that firms belonging to the financial industry should be removed since these firms are highly leveraged in general, and hence, their financial ratios are not comparable with that of firms from other industries. 14 Accordingly, we exclude the financial industry, which yields 9,551 firm-year observations that we analyze to re-examine all the three hypotheses. 15 The results presented in Table 10 are consistent with the main findings.
XBRL adoption excluding financial industry.
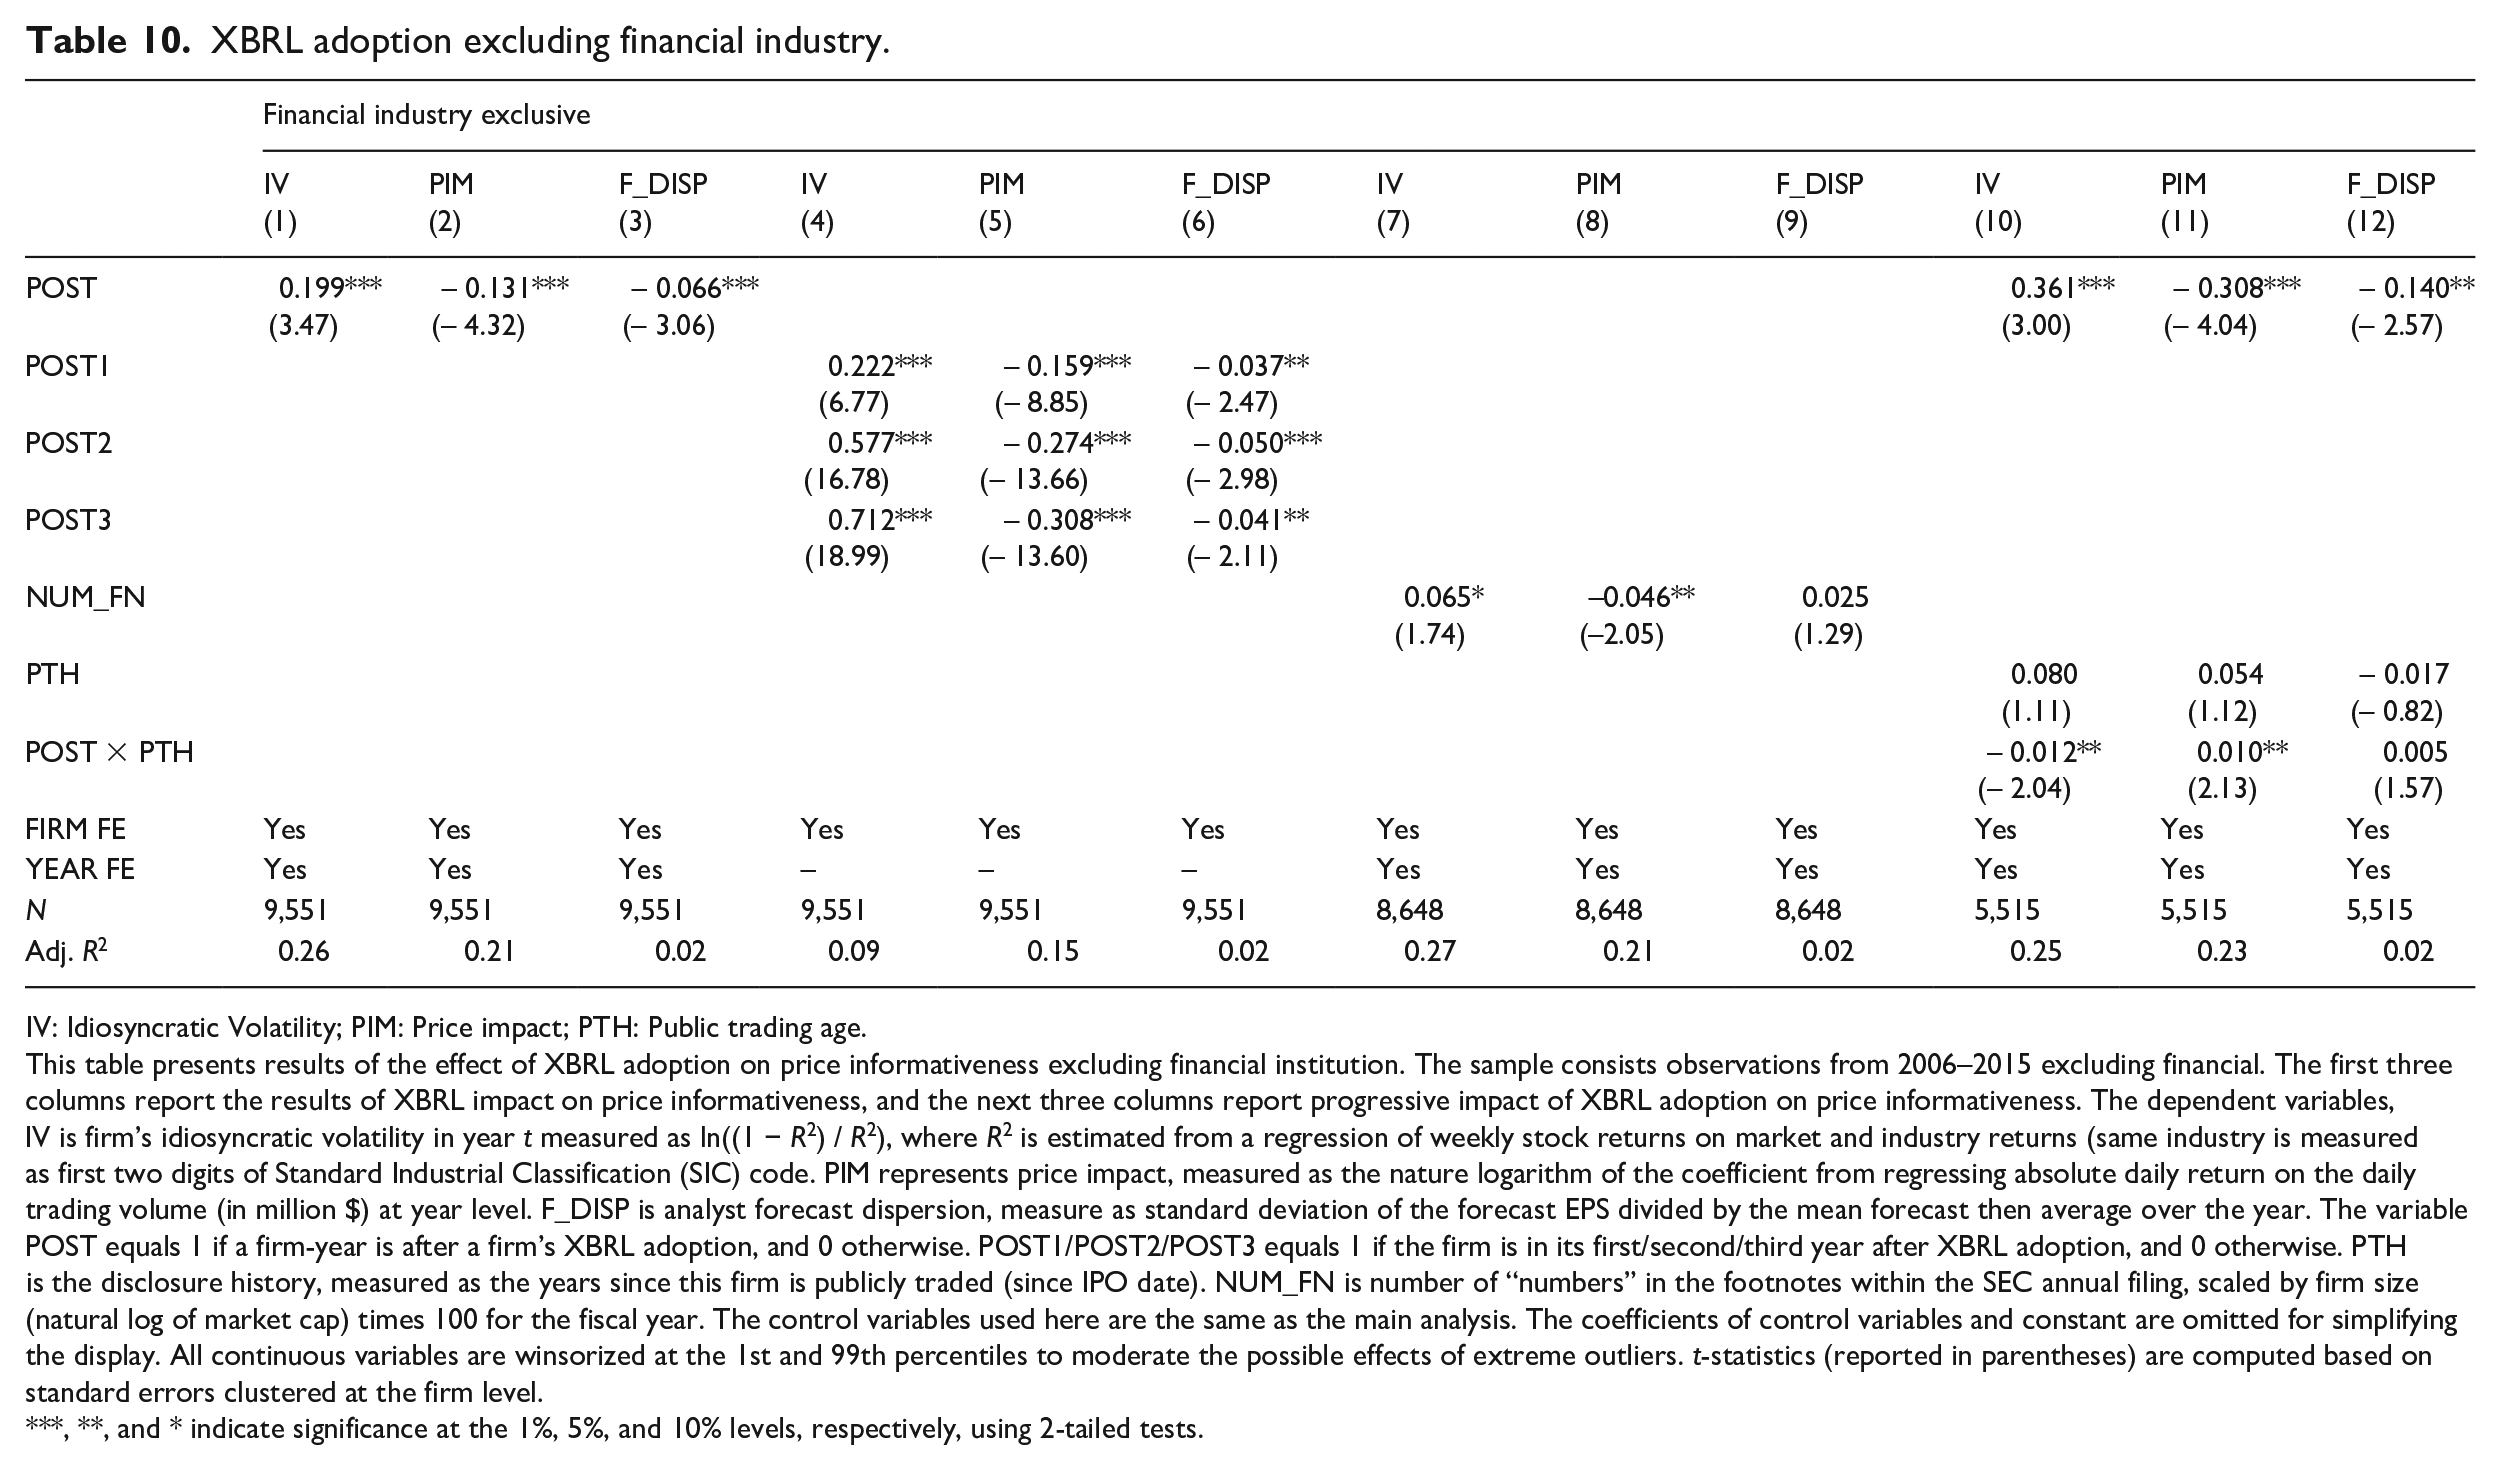
IV: Idiosyncratic Volatility; PIM: Price impact; PTH: Public trading age.
This table presents results of the effect of XBRL adoption on price informativeness excluding financial institution. The sample consists observations from 2006–2015 excluding financial. The first three columns report the results of XBRL impact on price informativeness, and the next three columns report progressive impact of XBRL adoption on price informativeness. The dependent variables, IV is firm’s idiosyncratic volatility in year t measured as ln((1 − R2) / R2), where R2 is estimated from a regression of weekly stock returns on market and industry returns (same industry is measured as first two digits of Standard Industrial Classification (SIC) code. PIM represents price impact, measured as the nature logarithm of the coefficient from regressing absolute daily return on the daily trading volume (in million $) at year level. F_DISP is analyst forecast dispersion, measure as standard deviation of the forecast EPS divided by the mean forecast then average over the year. The variable POST equals 1 if a firm-year is after a firm’s XBRL adoption, and 0 otherwise. POST1/POST2/POST3 equals 1 if the firm is in its first/second/third year after XBRL adoption, and 0 otherwise. PTH is the disclosure history, measured as the years since this firm is publicly traded (since IPO date). NUM_FN is number of “numbers” in the footnotes within the SEC annual filing, scaled by firm size (natural log of market cap) times 100 for the fiscal year. The control variables used here are the same as the main analysis. The coefficients of control variables and constant are omitted for simplifying the display. All continuous variables are winsorized at the 1st and 99th percentiles to moderate the possible effects of extreme outliers. t-statistics (reported in parentheses) are computed based on standard errors clustered at the firm level.
, **, and * indicate significance at the 1%, 5%, and 10% levels, respectively, using 2-tailed tests.
6. Conclusion
The incorporation of information into stock price is costly due to IPC. The XBRL mandate that purportedly reduces IPC presents an appropriate scenario for us to empirically examine its effect on price informativeness. Employing three measures from three independent perspectives, firm-specific information acquisition (idiosyncratic volatility), illiquidity (price impact), and analysts forecast accuracy (forecast dispersion), we find stock prices significantly more informative after XBRL adoption through two channels—the information flow and the information disclosure. The effect is more pronounced in firms with relatively shorter disclosure history, supporting the conjecture that XBRL accelerates the information incorporation process and facilitates the market to learn about younger firms faster.
From policy making perspective, the findings of this study provide important implications to regulators, investors, and analysts who are either evaluating the XBRL implementation or considering adopting XBRL. In addition, the evidence on the XBRL adoption and more informed price provides support for incorporating new information technology into financial markets to achieve better decision making at multiple levels of management to achieve greater market efficiency as a whole.
Footnotes
Acknowledgements
We thank Phil Gray, Tom Smith, and the anonymous reviewer for their useful comments. We are indebted to Dr. Elizabeth Blankespoor for sharing her data with us. We also thank Philip Brown, Bryan Howieson, Indrit Troshani, and all participants at UWA, University of Adelaide and Curtin University for their suggestions and comments.
Final transcript accepted 27 January 2020 by Tom Smith (AE Finance).
Funding
The author(s) received no financial support for the research, authorship, and/or publication of this article.
