
Abstract
Drivers’ distraction has been widely studied in the field of naturalistic driving studies. However, it is difficult to use traditional variables, such as speed, acceleration, and yaw rate to detect drivers’ distraction in real time. Emerging technologies have obtained features from human faces, such as eye gaze, to detect drivers’ visual distraction. However, eye gaze is hard to detect in naturalistic driving situations, because of low-resolution cameras, drivers wearing sunglasses, and so forth. Instead, head pose is easier to detect, and has correlation with eye gaze direction. In this study, city-wide videos are collected using onboard cameras from over 289 drivers representing 423 events. Head pose (pitch, yaw, and roll rates) are derived and fed into a convolutional neural network to detect drivers’ distraction. The experiment results show that the proposed model can achieve recall value of 0.938 and area under the receiver operating characteristic curve value of 0.931, with variables from five time slices (1.25 s) used as input. The study proves that head pose can be used to detect drivers’ distraction. The study offers insights for detecting drivers’ distraction and can be used for the development of advanced driver assistance systems.
Keywords
Globally, traffic crashes cause more than 1.3 million deaths every year. Among these road crashes, impaired driving activities, such as fatigue or drivers’ distraction, result in around 25% of road crashes ( 1 ). Numerous studies have investigated the impact of drivers’ distraction on crash occurrence, or the detection of drivers’ distraction.
To better investigate drivers’ states, naturalistic driving studies (NDS) are widely conducted. The most widely used NDS data set is the Strategic Highway Research Program 2 (SHRP2) NDS. Wood and Zhang found that drivers in crash events had longer perception-reaction time and lower deceleration rates than drivers in near-crash events ( 2 ). They also found some types of distraction could influence drivers’ perception time, thus influencing driving safety.
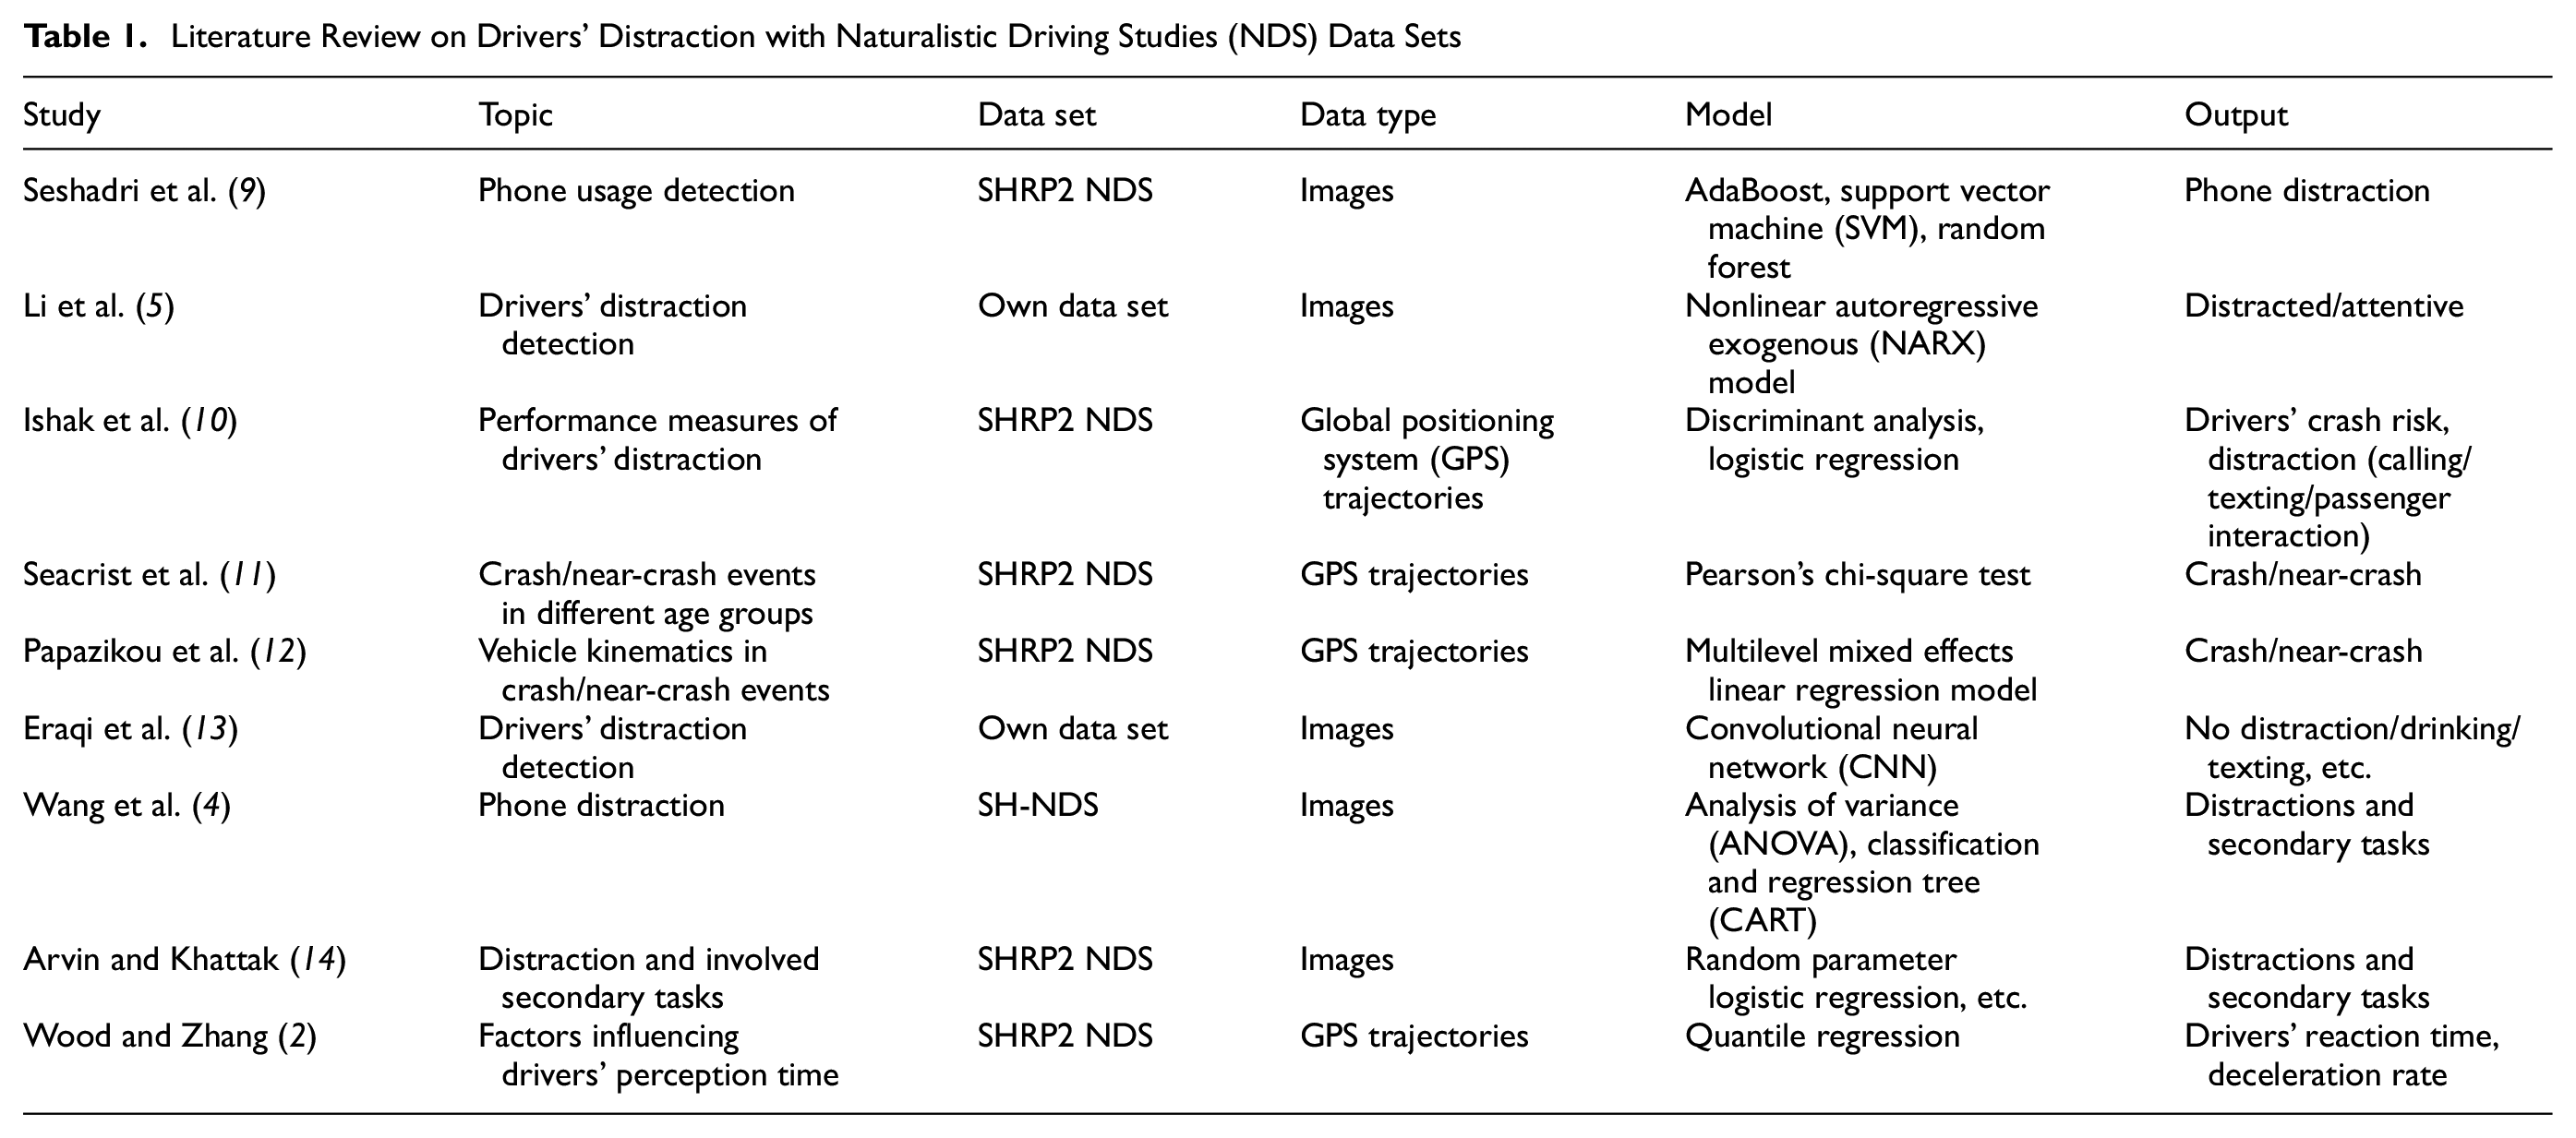
Three types of distraction were identified by the National Highway Traffic Safety Administration (NHTSA), which were: visual distraction (the driver looked away from the roadway), manual distraction (the driver took hand off the steering wheel), and cognitive distraction (the driver had mental workload associated with a task other than driving) ( 3 ). It was well acknowledged that involvement in a secondary task while driving could reduce a driver’s performance. The secondary tasks during driving included answering a mobile phone, talking, eating, adjusting mirrors, and so forth ( 1 ). Some studies investigated factors that are correlated with drivers’ distraction to propose performance measures. Wang et al. found that the standard deviations of speed, distance headway, and lane offset in 1,244 phone distraction events were lower than those values in the base cases ( 4 ). Li et al. developed a distraction detection algorithm using kinematic signals and in-vehicle units ( 5 ). It was found that steering entropy, time headway, and speed variation were correlated with drivers’ distraction. For visual distraction, eye gaze was a direct measure; that is, eye-off-road could be regarded as visual distraction. If the driver had eyes-off-road for 2 s, the crash risk doubled ( 6 ). Most existing studies used certain devices to detect eye gaze and further detected drivers’ distraction ( 7 ). Shi et al. used multiple machine learning models to detect eye gaze directions and then further detected drivers’ distraction ( 8 ). Videos were collected from 30 participants in a driving simulator, and the proposed model was tested both in a driving simulator and a natural driving environment. The literature on detecting drivers’ distraction, the related performance measures, and so forth, are summarized in Table 1.
Literature Review on Drivers’ Distraction with Naturalistic Driving Studies (NDS) Data Sets
However, it is hard to detect drivers’ eye gaze with a low-resolution camera. Also, in areas like Florida, with strong sunlight, drivers tend to wear sunglasses during driving. Thus, detecting eye gaze is conducted more in driving simulators than in a natural driving environment. Previous studies found that there were correlations between a human’s head pose and eye gaze direction (15, 16). Ahn et al. trained a multi-task deep neural network to detect head pose ( 17 ). Four data sets were used, including Biwi Kinect Head Pose (BKHP), RCVFace, Annotated Facial Landmarks in the Wild (AFLW), and SHRP2 NDS (18, 19). Paone et al. established a benchmark data set based on SHRP2 NDS, which contained drivers’ faces, heads, and head poses from videos ( 20 ). Three algorithms were used to compare the accuracy of the output, that is, pitch, yaw, and roll rates (in degree) to validate the head poses. Kashevnik et al. and Johnson and Cuijpers detected human head poses from images (15, 21). In summary, there is potential to use head pose to detect drivers’ distraction, especially when eye gaze is hard to detect. Jha and Busso estimated head pose using a commercial headband device ( 16 ). Zhao et al. used head pose to detect drivers’ distraction with two data sets: one was State Farm Distracted Driver Detection (SF3D), which contained 26 participants, and the other was collected from China and contained 90 participants ( 22 ).
Convolutional neural network (CNN) was widely used for image classification, sequential data prediction (such as travel time prediction), and so forth (23–25). Different from common neural network, CNN had convolutional layers that can better learn complex data structures. A few studies have used CNN for addressing transportation problems. For example, Du et al. and Abdelraouf et al. used CNN to predict traffic speed or travel time on freeways, and Li et al. used CNN to predict crash risk on urban arterials (24, 26, 27).
Based on the above discussion, this study is aimed at detecting drivers’ visual distraction using head pose. Cabin-view videos from around 289 drivers were collected. There were different types of drivers’ distraction, including food/drink distraction, phone distraction, and so forth. Depending on the eye states, the video frames were labeled into two classes, (visual) distraction or no (visual) distraction. A CNN model was used to detect the video frames with drivers’ distraction using head poses (pitch, yaw, and roll rates) derived from videos. Different sliding windows were tested to achieve the best result. After tuning the hyperparameters, the experiment results showed that the model with a sliding window of 1.25 s could achieve the best result, with recall value of 0.938 and area under the receiver operating characteristic (ROC) curve (AUC) value of 0.931.
The remainder of the paper is organized as follows: the data collection is illustrated in the next section. The CNN model, training, and evaluation procedures are illustrated in the section after that. The conclusion, discussion, and limitations of this study are illustrated in the final section. The study has two main highlights:
Videos are collected from 289 drivers (with cameras installed at any random position). The trips cover the metropolitan Orlando, FL, (city-wide) area. This is in contrast with most of the existing studies, which use videos collected from limited participants that drive on several specific routes.
This study derives drivers’ head pose as the input variables to detect drivers’ distraction. This is in contrast with existing studies, which mostly use eye gaze. Compared with existing work, this study does not have high requirements for the camera, standard camera installation position, and illumination level. It can be potentially used for real-time implementation.
Data Collection
Background
For monitoring risky driving behaviors, Lytx® offers the DriveCam® device to help with fleet management (28, 29). The device has two camera views: cabin view (driver’s face) and forward-facing view. Other information, such as speed, lateral acceleration (LAT), and forward acceleration (FWD) is also collected. By collecting large-scale data with installed event recorders, Lytx® determines the threshold values of the two accelerations, LAT and FWD, to be |0.5 g|. Whenever the vehicle exceeds the lateral or forward threshold, which is regarded as an event, the device will save a 20 s video clip (i.e., 10 s before the threshold being met or surpassed and 10 s after). Common reasons for recording videos include hard cornering, hard braking, hard acceleration, crash, rough/uneven road surface, and so forth. The Lytx® management system also provides diagnostic results. Also, the distraction behaviors (if there are any), which are not appropriate on business trips, are labeled.
Definitions of Head Pose
Open sourced programming packages such as OpenCV and Dlib, and a pre-trained facial landmark detection model are used to detect face and facial landmarks (30–32). Sixty-eight landmarks on one face can be detected, such as the jawline, mouth, eyebrows, nose, eyes, and so forth, as shown in Figure 1a. The head pose can be denoted by three angles, with three mutually perpendicular axes as shown in Figure 1b. The Euler angles generated between the head and the three axes (X-axis, Y-axis, and Z-axis) are defined as pitch (
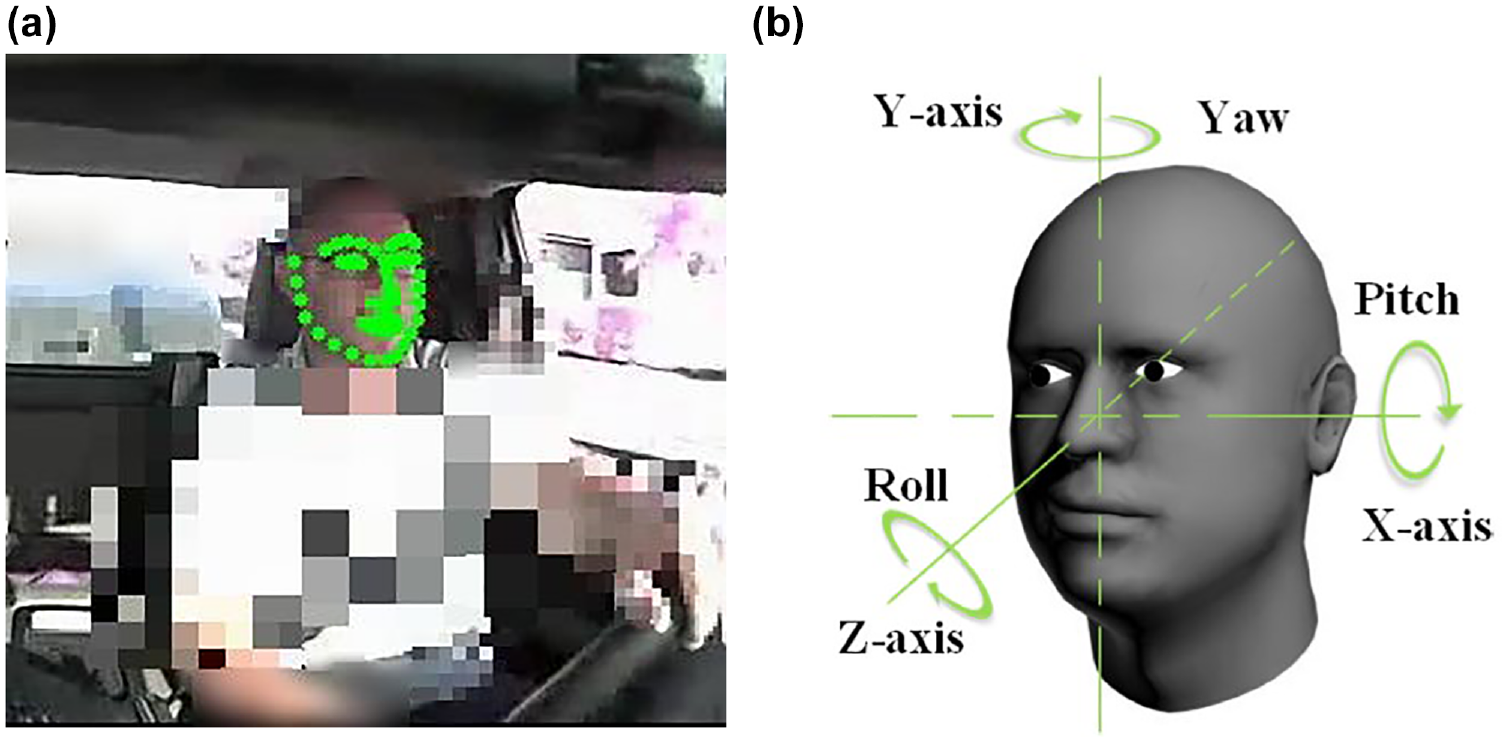
Generating head pose: (a) facial landmarks,* and (b) pitch, yaw, and roll.
When a point

Similarly, if the angles around the Y-axis and Z-axis are defined as
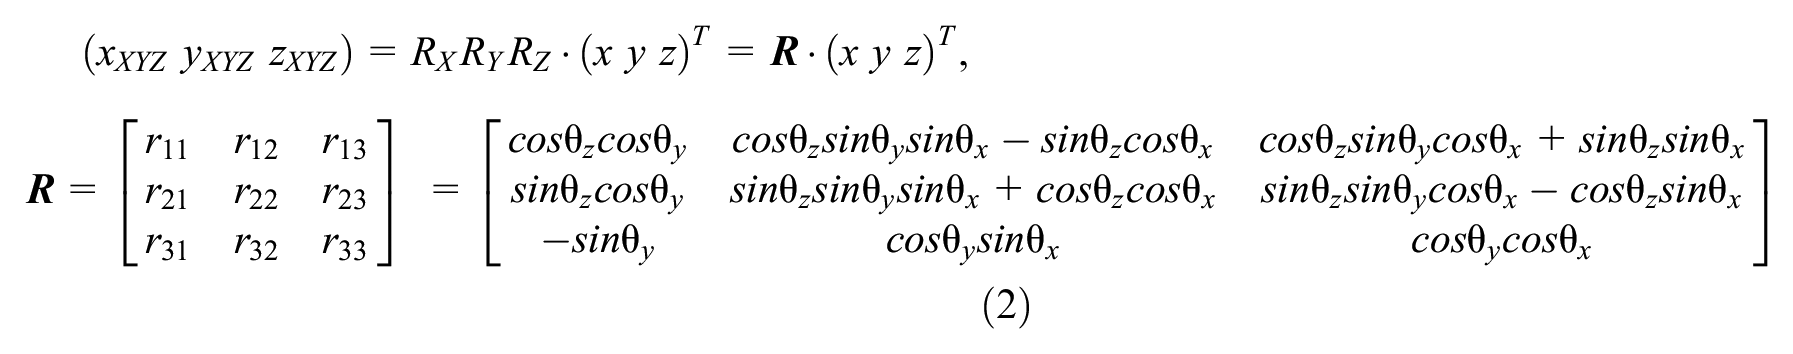
The pitch, yaw, and roll rates can be derived as:

The matrix

With the ideal camera system without distortion,
Drivers’ Distraction
The videos are collected from a fleet, with vehicle types such as van, sedan, and truck. In this study, the videos are collected from 289 drivers representing 423 events happening on 133 different days during the daytime from April 11, 2020, to May 14, 2021. The trips cover the Orlando, FL, area. The locations where the videos are collected are shown in Figure 2. Most drivers are males in middle age. Concerning the roadway types, 39% of the videos are collected from urban arterials, 30% from intersections, 12% from freeways, and so forth. The details of the collected videos are listed in Table 2.
Video Data Description

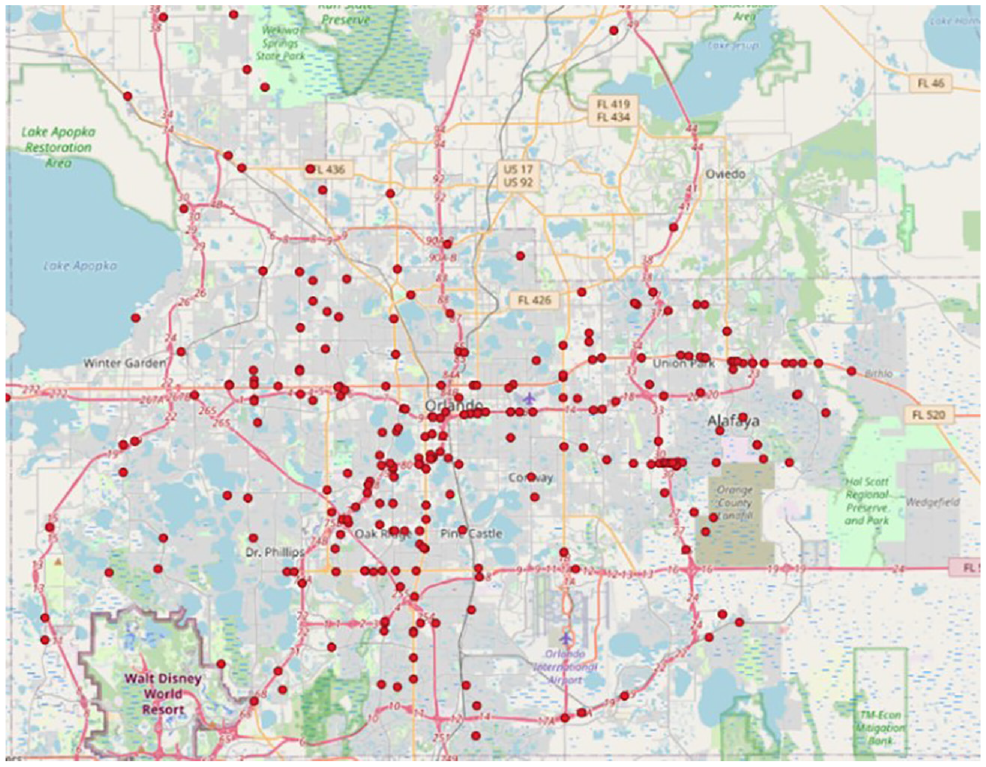
Video collection locations.
Lytx® provides labels (drivers’ activities) for videos. Most of the time, for these distraction activities (texting/calling on the phone, having food/drink, etc.), the drivers’ hands are involved, which means at least one hand is off the wheel manipulating something. Currently, in no videos do the drivers have both hands off the wheel. To better label the drivers’ distraction, every frame of the video is further labeled. It should be noted that the video frames are only taken from the situations under which the drivers are driving under normal conditions. The invalid video frames are removed for reasons listed as below:
In the middle of the video, the driver may get alerted from the onboard device that at least one acceleration threshold is violated. In this case video frames after this timestamp are removed.
The driver is not driving on the road. Instead, the vehicle is parked or just starts from a parking lot.
The video frame has poor illumination conditions, or the camera lens is covered.
Basically, there are four frames per second (fps) (video frame rate is 4 fps). For each frame, if the distraction involves eye activity (driver has eyes off road), it is identified as distraction; if not, the frame is identified as no distraction. Besides, the frames from normal driving videos are labeled as no distraction. The labeling process is shown in Figure 3. An example of the labeled frames is shown in Figure 4. All the frames are manually checked to ensure accuracy.
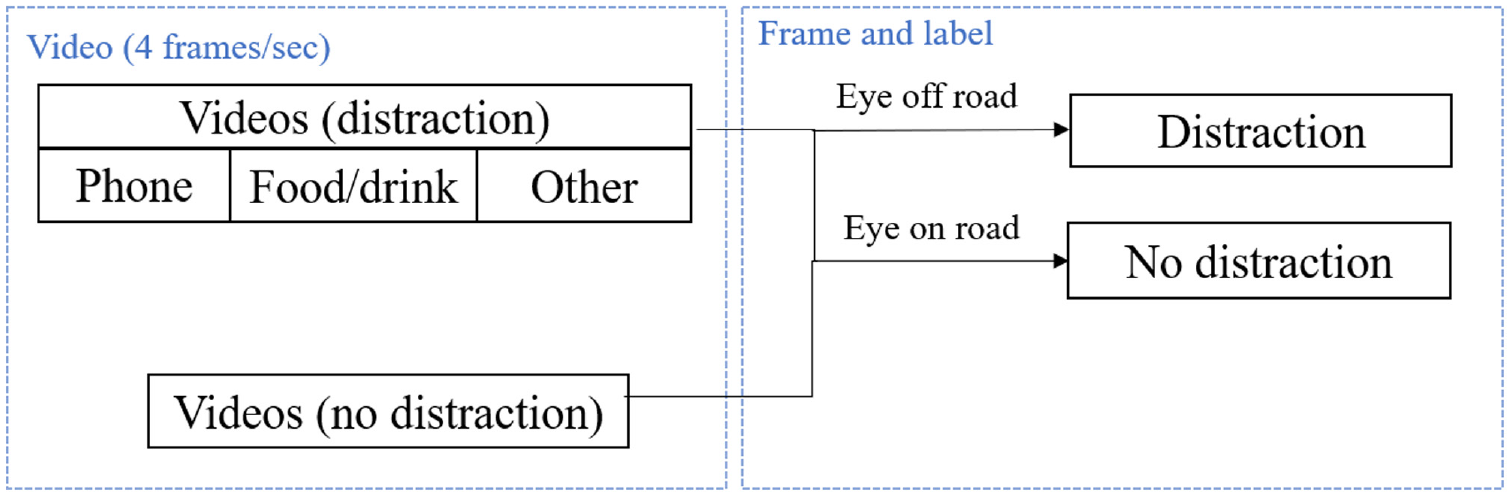
Labeling the video frames.

Examples of labeled video frames: (a) frame with (visual) distraction, and (b) frame with no (visual) distraction.
After labeling the video frames, the detailed information of the two classes (distraction/no distraction) is shown in Table 3.
Data Overview
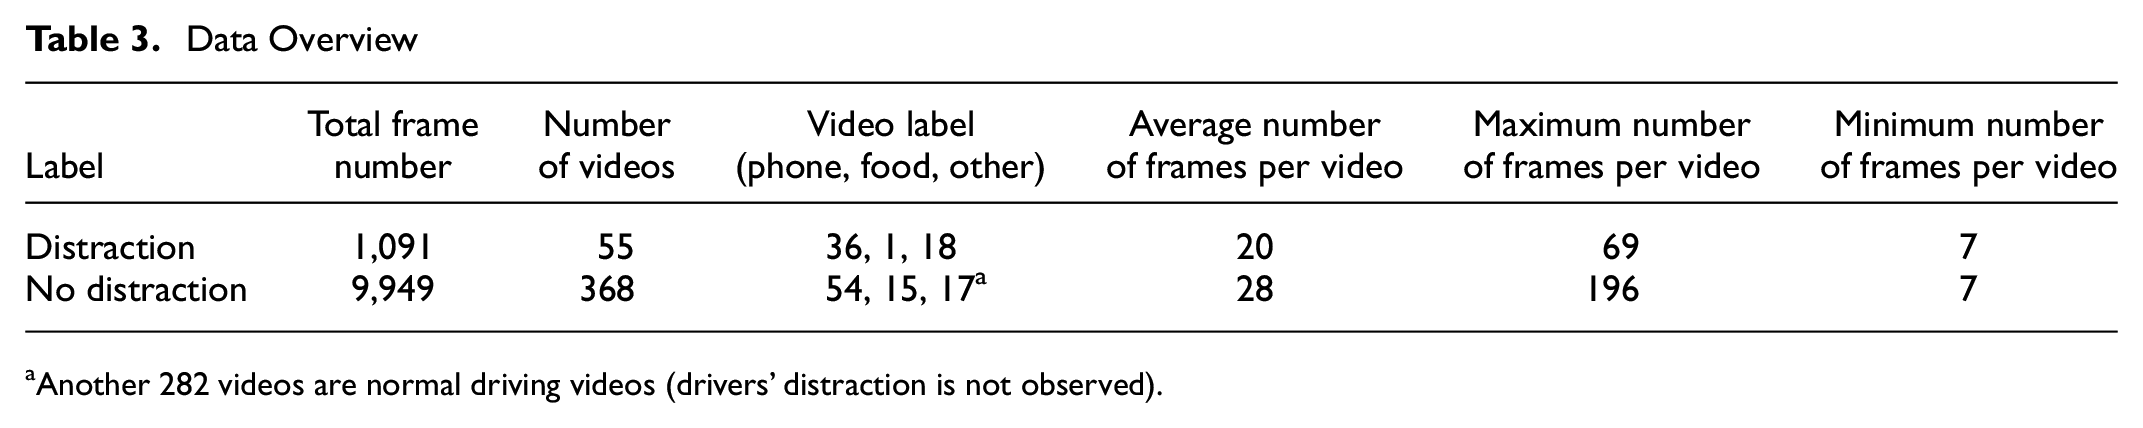
Another 282 videos are normal driving videos (drivers’ distraction is not observed).
The descriptive statistics of the collected variables are shown in Table 4. Besides pitch, yaw, and roll angles, the differences of these angles between two consecutive frames are also used as input variables.
Variable Descriptive Statistic a

Unit: degree.
Experiment and Result
CNN Model
The CNN is widely used in the studies related to sequential data. The proposed model in this study contains two convolutional layers. The dropout layers are added after each convolutional layer to avoid overfitting. One max pooling layer and one fully connected (FC) layer are also added. The overall architecture of the used model is shown in Figure 5.

Model architecture.
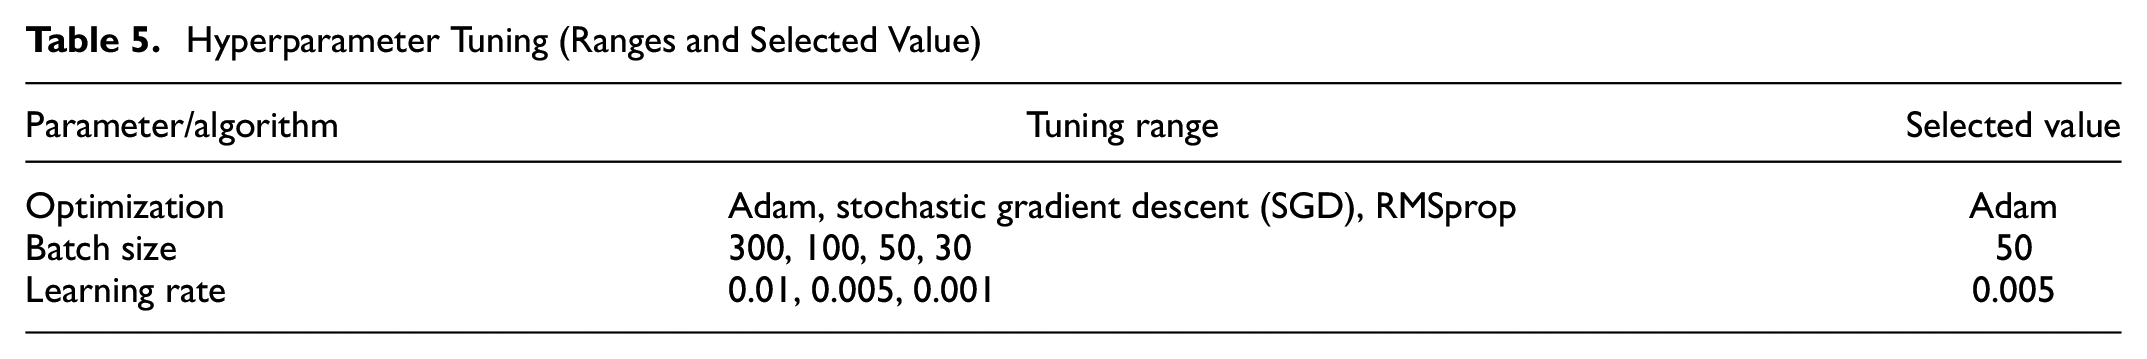
The commonly used hyperparameters, such as optimization algorithm, batch size, and learning rate, are tuned. The tuning ranges and selected values are shown in Table 5. The optimization functions are selected between Adam, stochastic gradient descent (SGD), and RMSprop. Finally, the selected optimization function is Adam (with learning rate as 0.005), and the batch size is selected to be 50. The training epoch number is 250.
Hyperparameter Tuning (Ranges and Selected Value)
Sliding Window
The frame rate of collected videos is 4 fps, which means one video frame stands for 0.25 s. For sequential data, the sliding window method is usually used to learn historical information. A sliding window of 0.75 s is first used, as shown in Figure 6. The variables from the last three frames (samples) are used to classify the dependent variable for the current frame.
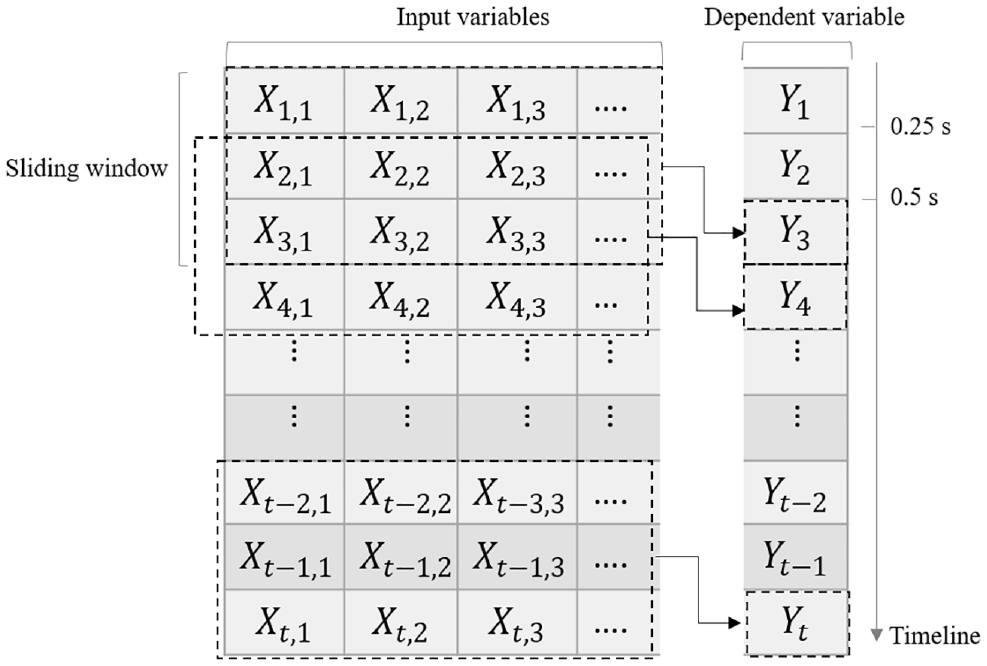
Sliding window.
Data Set Splitting, Oversampling, and Experiment
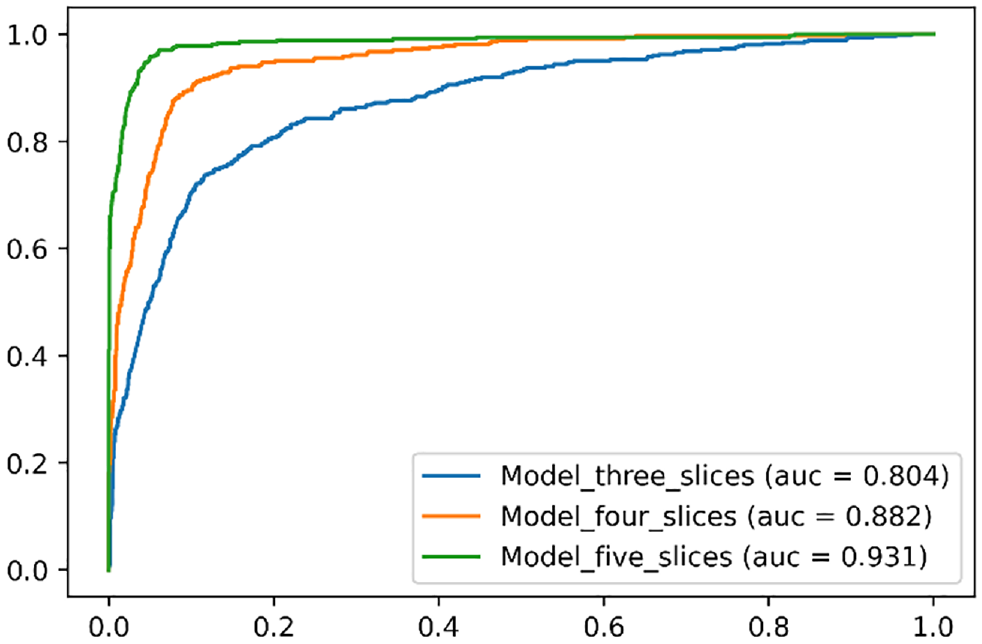
The diagram for metrics calculation is shown in Table 6. True negative (TN) is the number of actual negative samples (no distraction) that are correctly classified. False positive (FP) is the number of actual negative samples (no distraction) that are wrongly classified. False negative (FN) is the number of actual positive samples that are wrongly classified. True positive (TP) is the number of samples in the distraction class that are correctly classified.
Confusion Matrix of Binary Classification Problem
Using these four numbers, the following metrics are calculated: recall, false alarm rate (FAR), accuracy, and AUC.
Recall (or sensitivity): the proportion of correctly classified samples among actual positive samples, as shown in Equation 5.
FAR: the proportion of the falsely classified samples among the actual negative samples, as shown in Equation 6.
Accuracy: the proportion of correctly classified samples among all the samples, as shown in Equation 7.
AUC (area under the ROC curve): the ROC curve is used as a comprehensive metric to evaluate the model’s performance ( 34 ). This curve plots two parameters, recall and FAR, at different classification thresholds. The AUC value, which ranges from 0.5 to 1, is the area under the ROC curve. For imbalanced data sets, the AUC value is more reliable than accuracy.


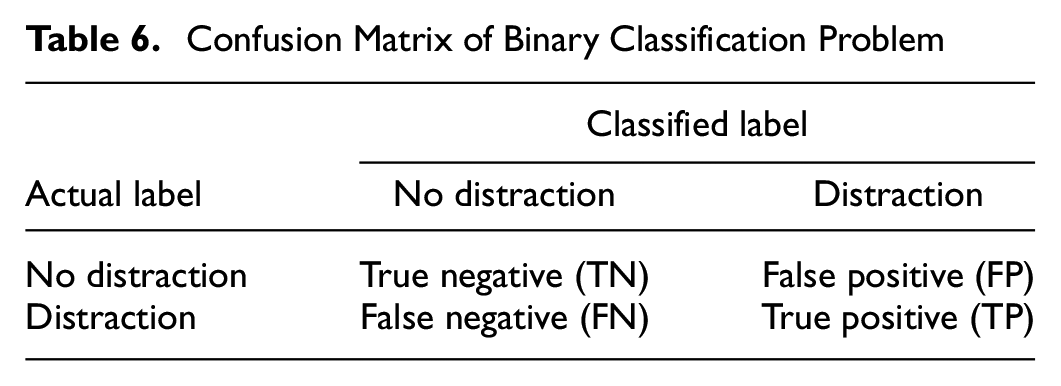
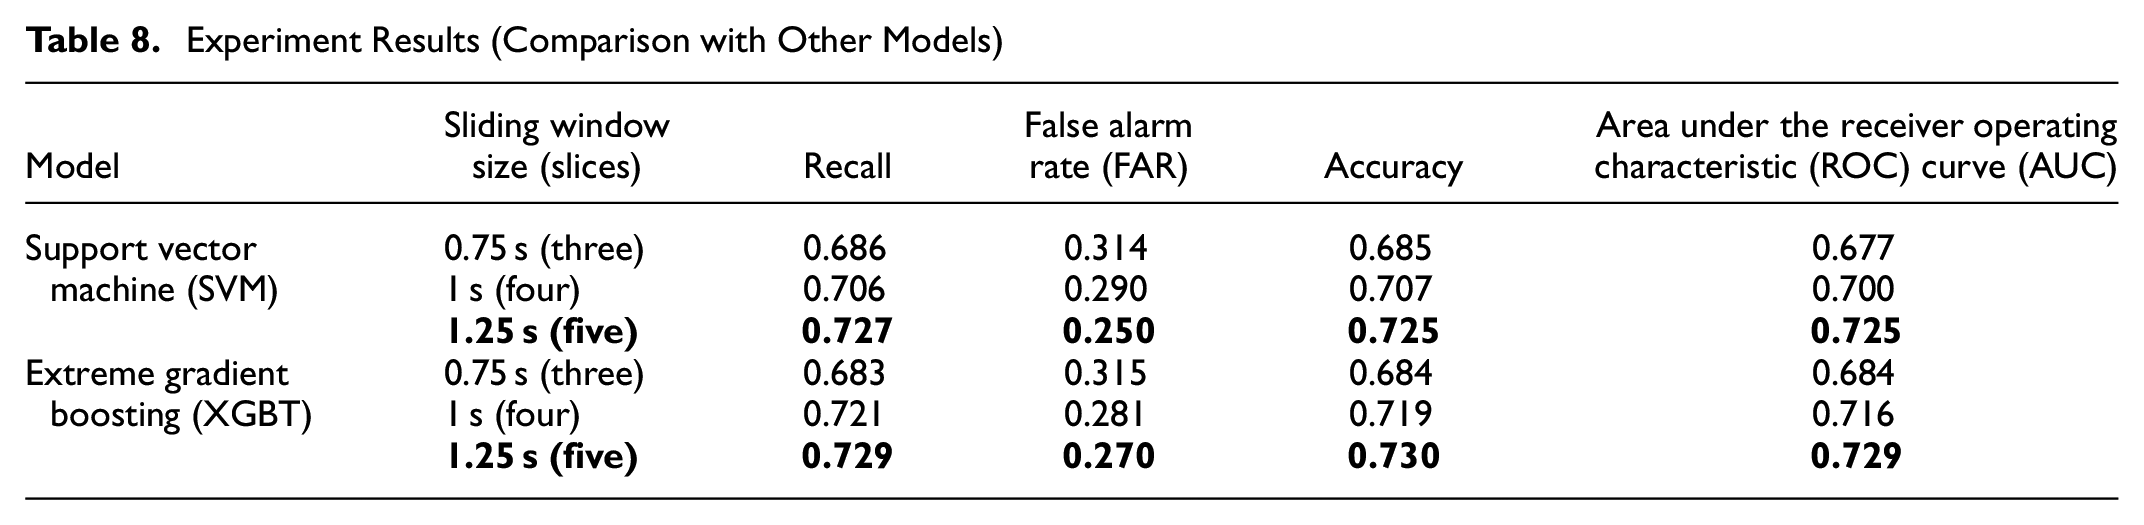
With the experiment, 70% of the data set is used as the training data set and 30% of the data set is used as the test data set. The synthetic minority oversampling technique (SMOTE) is used to increase the samples in the minority class (distraction class) to balance the data samples on the training data set ( 35 ). SMOTE is widely used in the transportation safety field because of the rareness of critical events such as crash or conflict (36, 37). With three time slices (each containing variables from 0.25 s), the proposed CNN model achieves the recall value of 0.811 (it can identify 81.1% of the samples in the distraction class), and an AUC value of 0.804. As the sliding window gets larger, the model’s performance improves. With five time slices, the model achieves a recall value of 0.938, and an AUC value of 0.931. Taking into consideration the computational cost for real-time implementation, the authors do not further increase the size of the sliding window. The evaluation metrics are calculated using the sklean.metrics package. Table 7 shows the above-mentioned metrics, with the best model marked in bold. Figure 7 shows ROC curves and AUC values from the three models.
Experiment Results (Test Data Set)

Receiver operating characteristic (ROC) curves of convolutional neural network (CNN) models (test data set).
The confusion matrix is usually a good method to show a model’s performance on all classes. Figure 8 shows the confusion matrix on the test data set, using the best model (the model with five time slices). It is found that the model can classify the samples in both classes successfully.
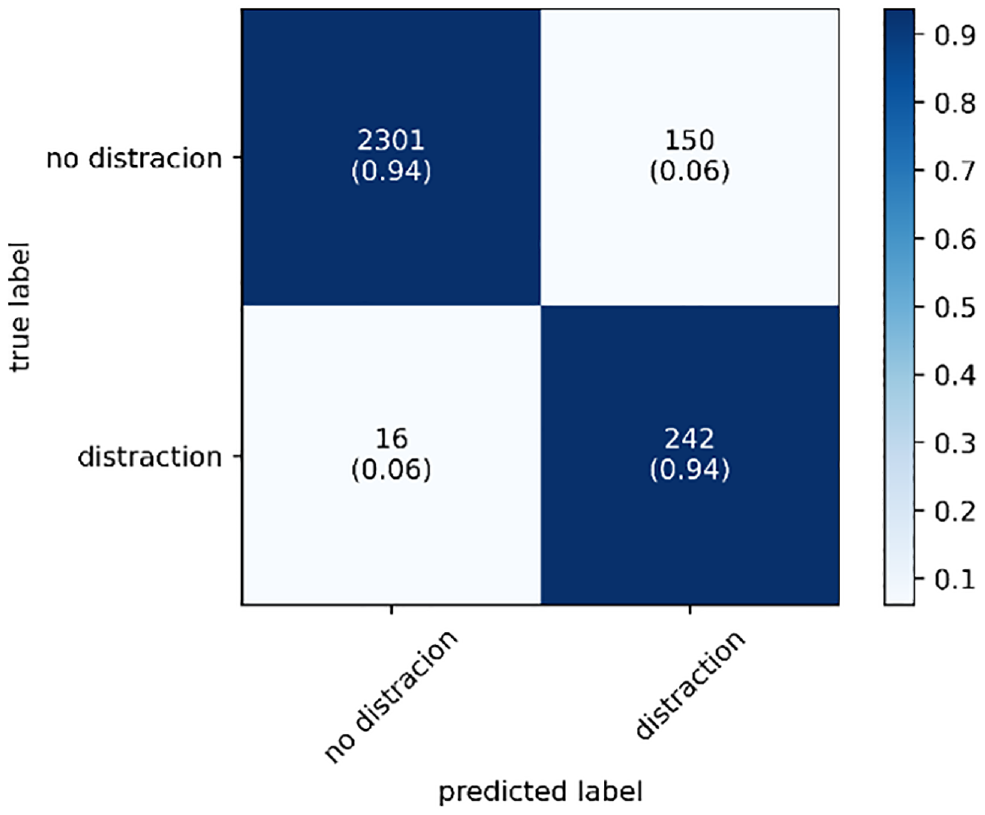
Confusion matrix of convolutional neural network (CNN) model with five time slices (test data set).
For comparison, the study also uses two machine learning models: support vector machine (SVM) and extreme gradient boosting (XGBT) (38, 39). SVM is a supervised learning algorithm that is widely used. Given a data set
Experiment Results (Comparison with Other Models)
Conclusion and Discussion
This paper uses head pose to detect drivers’ distraction using onboard videos. The head pose is derived from the drivers’ facial landmarks. A 3D morphing human head model is used to obtain the ground truth 3D points. Through the perspective-n-transformation method, the head pose (three angles, pitch, yaw, and roll rates) is generated. Based on these angles, six variables are used to input into a CNN. The experiment result shows that the model can detect 93.8% of drivers’ distraction frames, with AUC value as 0.931, when the sliding window is taken as five time slices (1.25 s). The machine learning models, XGBT and SVM, are used for comparison. It should be noted that the videos in this study are collected city-wide with different vehicles, which results in different camera installation positions. This is in contrast with existing studies which usually collect videos from driving simulators, or from limited participants driving on several specific routes. These kinds of settings, with varying camera resolutions, illuminations, faces, and camera positions, are regarded as “in-the-wild” conditions. Increasingly, research interests are focused on these kinds of head pose data sets, such as Annotated Faces in the Wild (AFW), AFLW, and Labeled Face Parts in the Wild (LFPW) ( 19 ). These studies can be further applied to NDS and implemented in advanced driver assistance systems (ADAS).
For this study, the errors of the generated head pose are mainly from two perspectives: the misdetection of facial landmarks, and the errors from perspective-n-transformation algorithm. The authors eliminate the misdetections by removing video frames that have bad detections. However, for solving the second problem, some studies use more advanced techniques, such as neural networks, to estimate head pose. Future work can be extended to use better models for better head pose detection. Also, in this study, all the videos are collected during the daytime to ensure the accuracy of the facial landmark detection model. With new types of cameras (such as infrared camera) becoming popular on the market, more onboard videos with different illumination levels can be collected to test the performance of the proposed model.
Footnotes
Acknowledgements
The authors would like to acknowledge Lytx® and Orange County for providing the videos.
Author Contributions
The authors confirm contributions to the paper as follows: study conception and design: S. Zhang, M. Abdel-Aty; data collection: S. Zhang, M. Abdel-Aty; analysis and interpretation of results: S. Zhang, M. Abdel-Aty; draft manuscript preparation: S. Zhang, M. Abdel-Aty. All authors reviewed the results and approved the final version of the manuscript.
Declaration of Conflicting Interests
The author(s) declared no potential conflicts of interest with respect to the research, authorship, and/or publication of this article.
Funding
The author(s) received no financial support for the research, authorship, and/or publication of this article.
All results and opinions are those of the authors.