
Abstract
The mission of state Departments of Transportation (DOTs) has evolved, and their perception has shifted from focusing on constructing new assets to managing and maintaining existing transportation assets and optimizing asset performance. In response to this change, state DOTs began adopting a “transportation asset management” approach, an intensive data-driven decision-making process to maintain and extend the serviceability of transportation assets throughout their lifecycle. However, state DOTs continue to face challenges in conducting cross-asset system analysis and integrating data across systems throughout the asset lifecycle. Conversely, emerging technologies, namely Digital Twins, have the potential to leverage the value of asset data and transform data into valuable insights to inform decision-making. The definition of Digital Twins in the infrastructure industry is inconsistent, and the transition toward a digitized built environment—a preliminary step required for a successful implementation of Digital Twins—has not been investigated. Thus, this paper presents the burning platform for the need for Digital Twins and defines the concept. Additionally, this study investigates the current practices of state DOTs toward the digital transition of their transportation asset data and contextualizes the DOTs’ maturity in the advancement of digital processes. This paper focuses on ancillary asset systems, particularly Roadside, Electronic, and Drainage Asset systems. A web-based survey was developed and distributed to state DOTs for data collection. For each asset, the perceived timeline for digitization was investigated, and three variables related to data digitization were explored: data format, data level of detail, and data collection technique.
Keywords
Transportation systems are critical for any jurisdiction’s development, representing the arteries necessary for connecting people, delivering goods, and providing services for economic growth, and the failure of such systems can result in considerable humanitarian and economic losses ( 1 ). The criticality of transportation systems is encouraging governments to invest in improving their operation and maintenance and develop roadmaps to achieve the vision of Digital Roads and intelligent transportation systems (ITS) ( 2 , 3 ). In the U.S. in November 2021, the Infrastructure Investment and Jobs Act (IIJA) was officially legislated. The IIJA is a $1.2 trillion investment, representing the “largest investment in the nation’s critical infrastructure systems in a generation or more” ( 4 ). The new law will allow for the investment of $110 billion in funding for roads, bridges, and major infrastructure projects. This investment will support mitigating the impact of climate change, building resilient and sustainable infrastructure, enhancing equity, and improving safety for road users of all modes ( 5 ). The federal money will be assigned to numerous projects and will either be managed by state Departments of Transportation (DOTs) through direct funding or awarded to selected applicants through competitive grant programs. The IIJA is providing funds and allocating resources to upgrade infrastructure systems, improve the delivery of infrastructure projects, and optimize their management and control. In alignment with this objective, the law dedicated $100 million to fund the Digital Construction Management Systems and Related Technologies program. This program aims to maximize interoperability with other systems and applications, improve productivity, manage complexity, support project delivery, reduce cost overruns, and enhance safety and quality. Members of the Coalition for Smarter Infrastructure Investments (CSII) anticipate that this program will support the investment in technologies and tools, including visual-based inspection technologies, construction management tools, electronic ticketing (e-ticketing), Digital Twins, and unmanned aerial vehicles (UAVs) ( 6 ).
The missions of state DOTs have evolved, and several factors contributed to this evolution, including the emergence of technologies, changing demographics, efficient land use, promotion of alternative energy policies, tolling, and a system investment gap. With this evolution, state DOTs changed their perspective on operational performance, where they focused more on operating and maintaining the existing transportation system instead of expanding it, and modified their organizational structure to include management units ( 7 ). Thus, among the duties of state DOTs is the management of highway assets, that is, collecting, storing, managing, and analyzing vast amounts of asset data to support transportation asset management (TAM). The American Association of State Highway Transportation Officials (AASHTO) defines TAM as “a strategic, systematic process of operating, maintaining, upgrading, and expanding physical assets effectively throughout their lifecycle. It focuses on business and engineering practices for resource allocation and utilization, with the objective of better decision-making based on quality information and well-defined objectives” ( 6 ).
Usually, state DOTs prioritize the management of high-value assets and highly visible ones such as pavements and bridges. However, transportation systems extend beyond pavement and bridges to include a wide variety of ancillary assets such as signs, guardrails, and culverts ( 8 ). Some state DOTs implemented maintenance quality assurance (MQA) programs to assist maintenance personnel in identifying and prioritizing maintenance requirements and considering ancillary assets. Other state DOTs took a supplementary approach and included ancillary assets in their TAM Plans (TAMPs) ( 9 ). TAM is an extensive, data-dependent decision-making process to maintain, preserve, and extend the long-term service life of transportation assets ( 10 ). State DOTs are facing several challenges integrating data across systems and throughout the asset lifecycle ( 11 ). Thus, state DOTs must focus on six significant data management practices to achieve a seamless data management approach and improve data value to enable informed decision-making. These six practices are data collection, data handling, data flow, data transfer, data governance, and data integration ( 12 ). This can be achieved by improving the state DOTs’ technological capabilities by adopting emerging technologies ( 13 ).
Among these six data management practices, data collection is the cornerstone. However, state DOTs are facing challenges in deciding what data to collect, how to collect data, and what is the necessary infrastructure for data collection preparation ( 8 ). Another challenge faced by state DOTs, which directly influences the data collection decision-making, is the need to determine three things: what work should be performed across all assets, which assets should be prioritized, and how to make cross-asset resource allocation decisions that would consider multiple objectives. A primary method employed by state DOTs to assist cross-asset resource allocation is to establish and define a set of performance targets infused with informative data to support a lifecycle management approach ( 8 ).
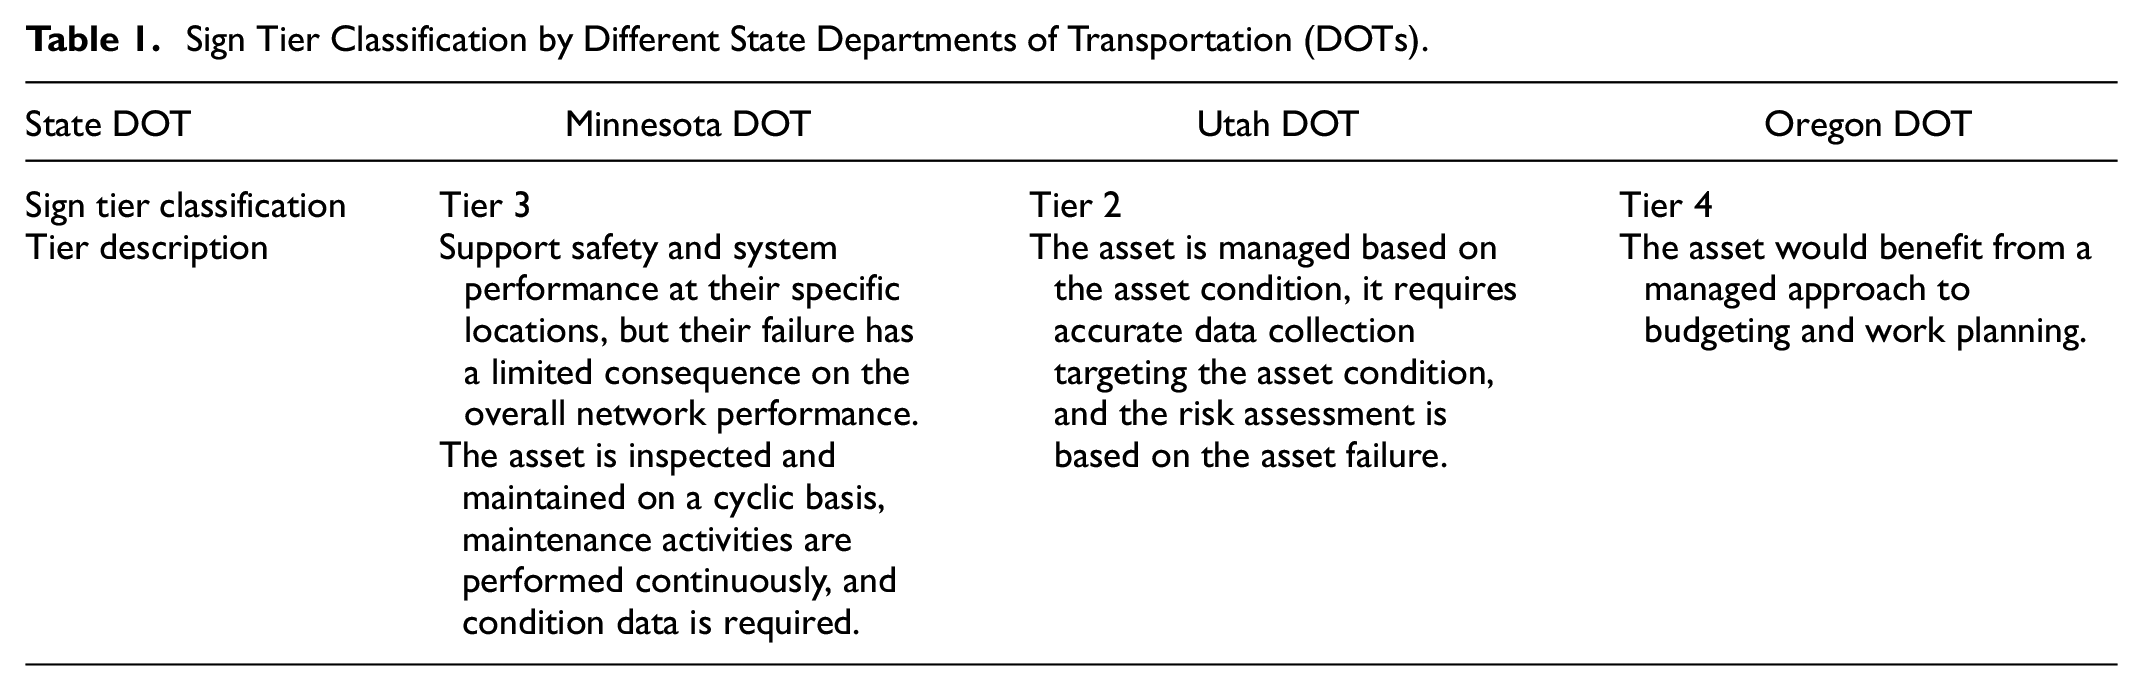
For instance, in 2019, Minnesota DOT (MnDOT) initiated the development of their Asset Management Strategic Implementation Plan (AMSIP) to support their asset management vision “to effectively manage transportation assets by mitigating risk, optimizing return on investment, and using the best available information and tools.” AMSIP emphasized the effective use of data in a proactive and holistic approach to maintain critical assets along their lifecycle, reduce costs, and improve asset value. To achieve this holistic asset management approach, AMSIP identifies 74 asset classes, including a wide variety of ancillary assets such as traffic, bike and pedestrian, hydraulic infrastructure, maintenance, and geotechnical assets. For each class, AMSIP allows MnDOT to assess the risks, identify the investment strategy, and use the available information to develop a prioritized list of data needs and recommend data collection procedures ( 14 ). To identify data needs, several state DOTs identified different tiers to support data collection and select desired maintenance approaches. For instance, MnDOT defined four levels of asset tiers, Utah DOT (UDOT) developed three TAM tiers, and Oregon DOT (ODOT) identified four data collection tiers ( 8 , 14 , 16 ). Table 1 provides the classification of a case example of an ancillary asset of a traffic sign—a critical asset for highway safety—by different state DOTs. Regardless of the used levels for classification, the three state DOTs agreed that accurate data collection conducted on a cyclic basis and targeting the asset condition is required for signs.
Sign Tier Classification by Different State Departments of Transportation (DOTs).
Moreover, UDOT took the lead and envisioned technological solutions such as Digital Twins as an information management strategy to overcome data-related challenges. UDOT believes that Digital Twins will fill the gap in asset information created by construction projects by extracting the enterprise asset information from project datasets and connecting it to a geospatial model of the individual physical assets ( 16 ). It is perceived that Digital Twins will enable UDOT to conduct complex and holistic data analyses to support comprehensive decision-making ( 17 ). The infrastructure industry can benefit from the capabilities of Digital Twins to support the design and delivery of sustainable and smart infrastructure assets and to allow for cross-asset data analysis. However, implementing Digital Twins in the infrastructure industry requires achieving a digital transition and exploring different strategies that would support this transition ( 18 ). Organizations in their current practices are trying to improve their digital capabilities and speed up the pace toward transitioning to a more digitized built environment by investing in new technologies, collecting more data, and making data-driven decisions. However, the current approach is isolated and is not very well communicated across the different divisions of the organization. An inconsistent definition of Digital Twins will lead people to reject the concept and consider it just hype, so, once the level of interest and use diminishes or reaches a plateau, the concept’s full potential will not be adopted ( 19 ). Thus, it is critical to bring more clarity to the definition of Digital Twins and awareness of their benefits to improve their adoption, set clear goals to achieve the digital transition, communicate cultural features, emphasize transparency and accountability, establish cultural risk management programs, and improve the overall working environment to attract labor ( 18 , 20 ).
Existing work has, thus, shown that state DOTs could benefit from adopting and implementing the concept of Digital Twins and improve their capacity toward digitization to support the design and delivery of smart infrastructure, leverage the value of data, and enhance data-driven decision-making necessary for cross-asset data management. However, for a successful implementation of Digital Twins, two key factors play a critical role: awareness of the Digital Twins concept and its benefits, and enhancing digital transformation and improving the organization’s digital skills. We summarize our research contributions as follows:
We investigated the existing definitions of Digital Twins in the infrastructure industry and its implementation, and we are proposing a holistic definition of the concept of Digital Twins for infrastructure assets.
We explored and captured the current practices of state DOTs toward achieving the digital transition of their transportation asset data.
We provide state DOTs with guidance toward evaluating where they stand toward achieving their Digital Twins journey.
This research paper is part of an ongoing effort to investigate innovative solutions by integrating different concepts including Digital Twins, Building Information Modeling (BIM), Geographic Information Systems (GIS), and deep learning methods to support state DOTs in achieving intelligent management of transportation assets and conducting complex analysis to support decision-making. However, cross-asset systems should be investigated to optimize the benefits of Digital Twins in attaining a holistic management approach. Thus, this paper focuses on ancillary assets, where three types of ancillary asset system were considered: Roadside Asset Systems, Drainage Asset Systems, and Electronic Asset Systems.
Digital Twins in the Infrastructure Industry
Digital Twins originated in aerospace engineering, but, with the growing interest in the capabilities of the technology, several industries investigated the concept, including the construction industry ( 21 ). The concept of Digital Twins emerged in the construction industry as a key enabler for its digital transformation and to improve the industry’s failure to embrace this transformation ( 22 ). The emerging concept of Digital Twins is the least investigated within the architectural, engineering, and construction (AEC) industry ( 23 ). This pertains to the lack of understanding of the concept within the construction industry, where the term Digital Twins was mainly used as an extension of the static BIM models generated during the design and construction phases to more dynamic ones used in operation and maintenance of complex building assets. This extension was achieved by embracing the integration with semantic web technologies, the Internet of Things (IoT), and sensors and implementing higher degrees of algorithms and artificial intelligence (AI) ( 22 , 24–26).
Sacks et al. discussed the replacement of the BIM concept and developed the concept of Digital Twins Construction (DTC), a “data-centric construction management” workflow used to monitor and control the design and construction of projects using Digital Twin information systems ( 27 ). Also, researchers believe that the adoption of cyber-physical systems (CPS) in the construction industry—that is, the adoption of multidimensional and complex systems that integrate the cyber world and the dynamic physical world—has facilitated the use of Digital Twins ( 28 , 29 ). Even though Digital Twins and CPS share the same concept of bridging the cyber model (i.e., virtual) to the physical model and the physical model to the cyber model, the nature of the cyber-to-physical bridge is different ( 30 ). For Digital Twins, the control is achieved by predicting the future state of the physical model, which allows for passively making decisions promptly. For CPS, on the other hand, the control of linking the cyber model to the physical model can be either passive or active, where devices such as actuators can control the state of the physical system ( 30 ). Ammar et al. highlighted the notion of Digital Twins for the construction project lifecycle ( 31 ). They emphasized the different capabilities of implementing the concept, including increased transparency of information, real-time monitoring, analysis and feedback, better stakeholder collaboration, advanced preventive measures, advanced what-if scenario analysis and simulation, real-time tracking, and higher accuracy.
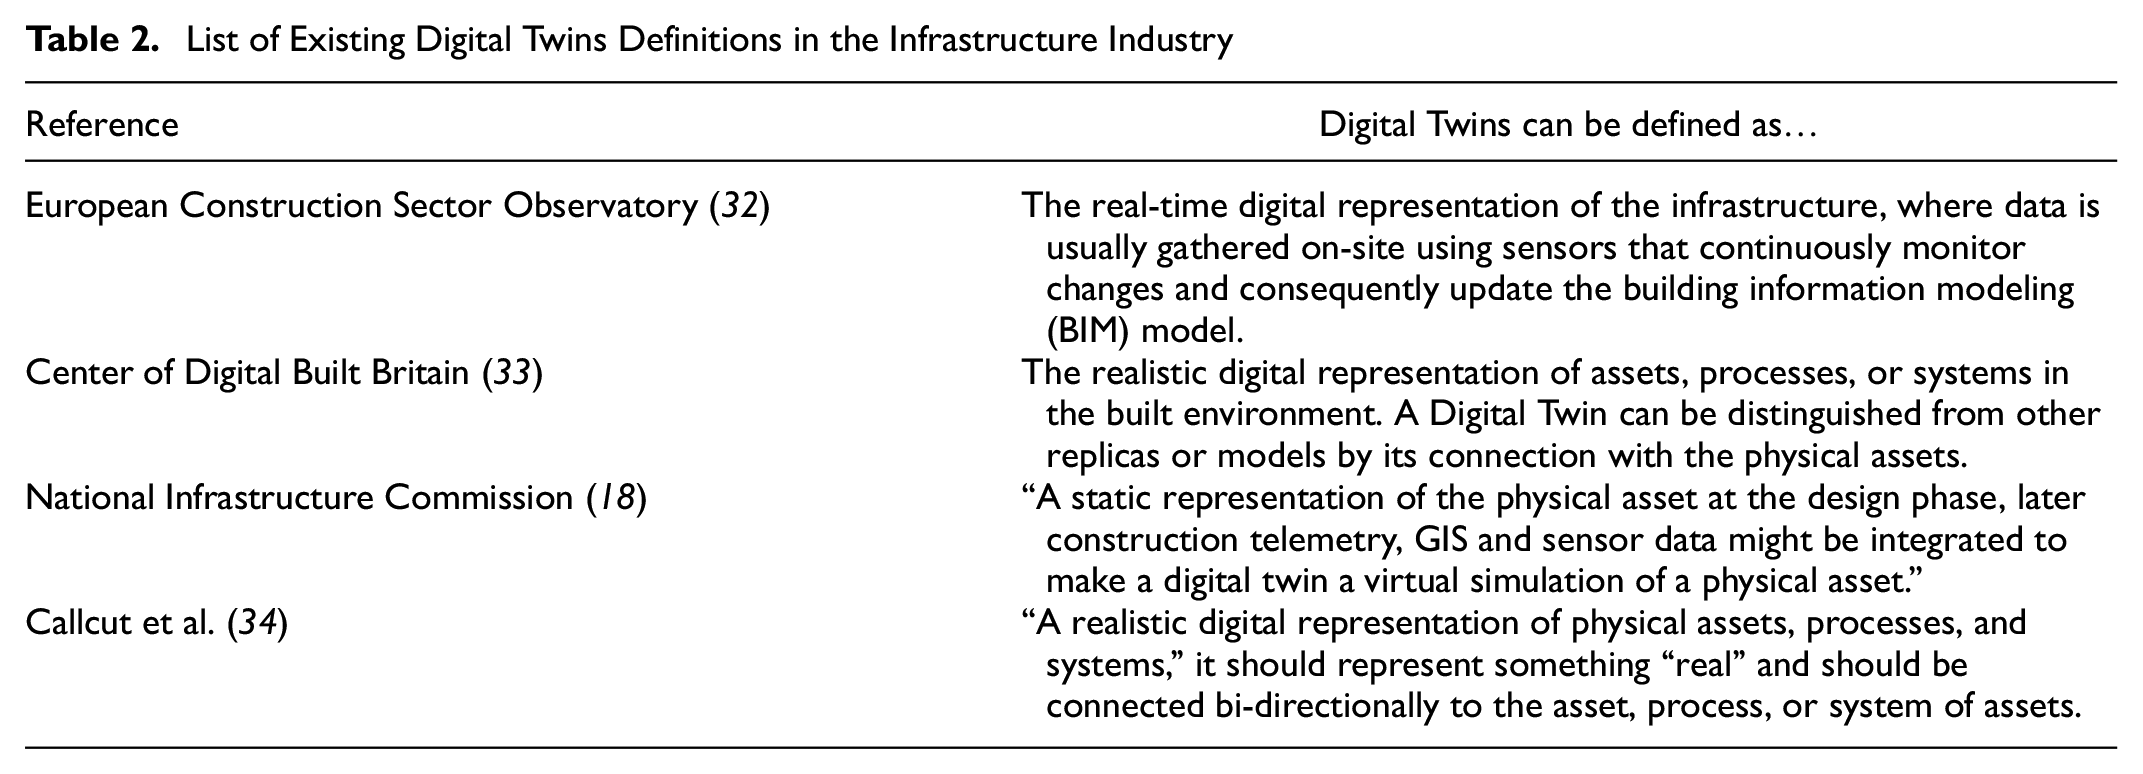
In some industries, the concept of Digital Twins has matured; however, for the infrastructure industry, it is still under development ( 18 ). Even though the concept of Digital Twins in the infrastructure industry is not clear yet, there is an agreement on its elements, where some see that BIM models or 3D Computer Aided Design (CAD) models are related to the concept, while others believe that BIM and CAD models (not necessarily 3D models) are essential to the development of Digital Twins. However, all practitioners emphasized the importance of the flow of information between the physical and digital assets as a critical element of the Digital Twins definition ( 18 , 20 ). Table 2 presents different organizations’ and practitioners’ definitions of Digital Twins in the infrastructure industry.
List of Existing Digital Twins Definitions in the Infrastructure Industry
The implementation of Digital Twins in the infrastructure industry was investigated at different spatial scales, such as the United Kingdom’s National Digital Twin (NDT) initiative ( 20 , 35 ). Also, its employment was explored on the city level to help with urban planning, such as Virtual Singapore and BRISE-Vienna ( 31 , 36 , 37 ). Broo and Schooling investigated the current practices of implementing Digital Twins through semi-structured interviews with experts and executives from the United Kingdom’s infrastructure industry ( 18 ). They found that current implementations—including 3D modeling of physical assets and real-time integration, weather forecasts, asset data, and information projects, integration of different information systems coming from several organizations (in the project’s construction phase), and contract management systems throughout the supply chain (in the project’s construction phase), procurement of a network management system and its integration with existing systems, sensor data collection, implementation of common data environments, and modeling of systems and control philosophies—are not mature and are still under development. Callcut et al. reported that the implementation of Digital Twins for civil infrastructure systems (i.e., transportation, energy telecommunication, water and waste, and smart cities) is still in the early stages of development ( 34 ). Fox-Ivey et al. also discussed a similar finding ( 38 ).
Ammar et al., and Ammar and Dadi emphasized that a successful implementation of the Digital Twins concept for transportation assets necessitates the identification of its purpose and its capabilities in leveraging the value of asset data and extracting actionable insights by integrating heterogeneous data captured from different sources, such as BIM, GIS, and asset data collected by intelligent transportation technologies such as sensing and imaging technologies ( 39 , 40 ). Also, Ammar et al. discussed the transition of the vision of Digital Twins for highway systems to action ( 20 ). They emphasized the importance of improving the digital capacity of transportation organizations and having a full data digitization lifecycle from “cradle to cradle” by enhancing digital design and construction, digital operation, and digital data integration with users, understanding the asset data architecture, establishing data management plans, and develop or integrate data with existing management systems. Table 3 presents the case studies of implementing Digital Twins in the highway infrastructure industry.
Implementation of Digital Twins for the Highway Infrastructure Industry
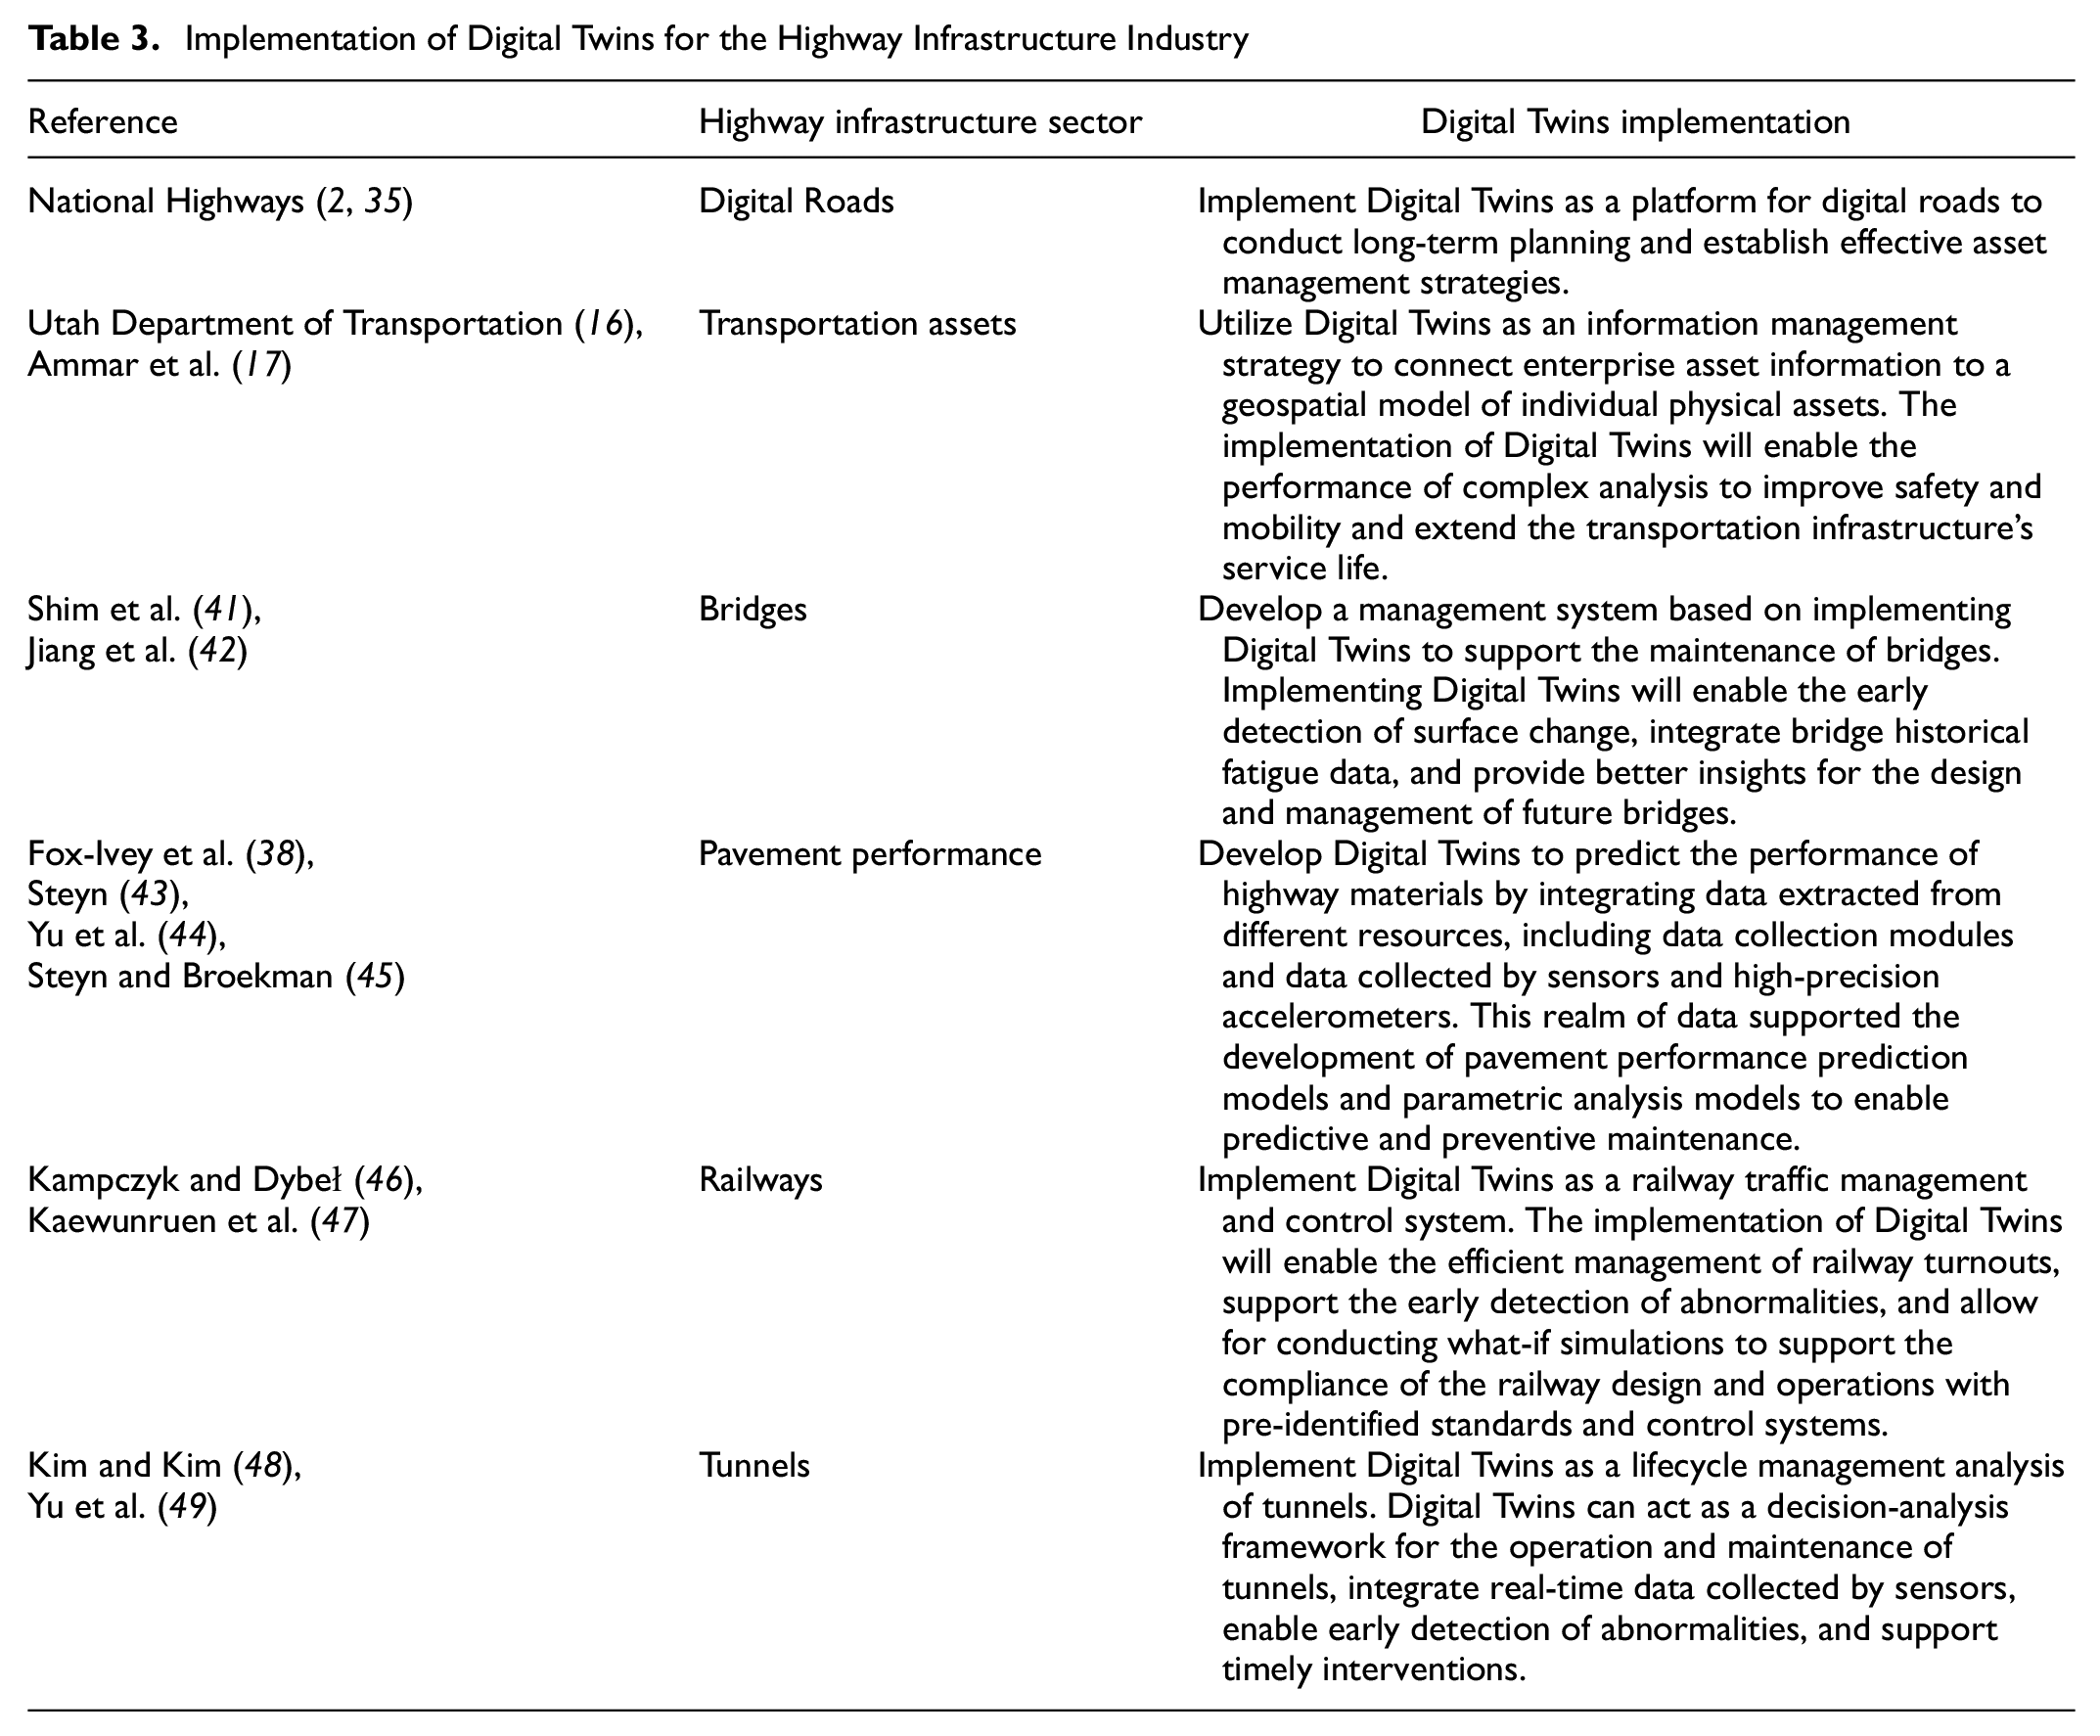
As presented in Table 3, Digital Twins was mainly adopted as a lifecycle management and maintenance system for the different transportation assets. Sinha et al. identified the elements or tasks that should be carried out by asset managers and constitute a mature TAM system, including: 1) comprehensive inventory and regular monitoring of the transportation infrastructure and their natural and operating environment, 2) database development, 3) performance assessment and modeling, 4) establishing the cost and effectiveness of standard treatments, 5) a decision-support framework that incorporates lifecycle cost and benefits analysis and multiple criteria analysis, 6) trade-off analysis and uncertainty characterization, and 7) assessment of funding needs and program prioritization/optimization ( 50 ). Thus, both Digital Twins and TAM concepts intersect, where implementing Digital Twins can leverage the value of asset information and improve the process of data-driven asset management decisions throughout the asset lifecycle. However, the impact of Digital Twins on the development of asset management programs within infrastructure organizations should be addressed, and the lack of understanding of the Digital Twins concept in the context of the infrastructure industry is limiting its adoption ( 18 , 51 ).
As such, and based on the existing discussion on Digital Twins in the infrastructure industry and the agreement on the key elements that compose it, we are proposing a holistic definition of the Digital Twin for infrastructure assets as the digital representation of an actual physical asset or system of assets (i.e., existing or to-exist asset/or system of assets) connected bi-directionally through geometric and semantic data integrated with layers of spatial data of the surrounding environment, and linked with real-time data. This realm of data integration is enabled through open data standards (e.g., Industry Foundation Classes [IFC]) and technologies, including the IoT, CPS, and AI. Data gathered in a real-time manner and historical data aggregated throughout the asset lifecycle will allow for the development of analytical models. These data-enriched models can be used to conduct what-if simulations and optimize performance management to support decision-making. The proposed definition of the Digital Twins for infrastructure assets is visually represented in Figure 1.
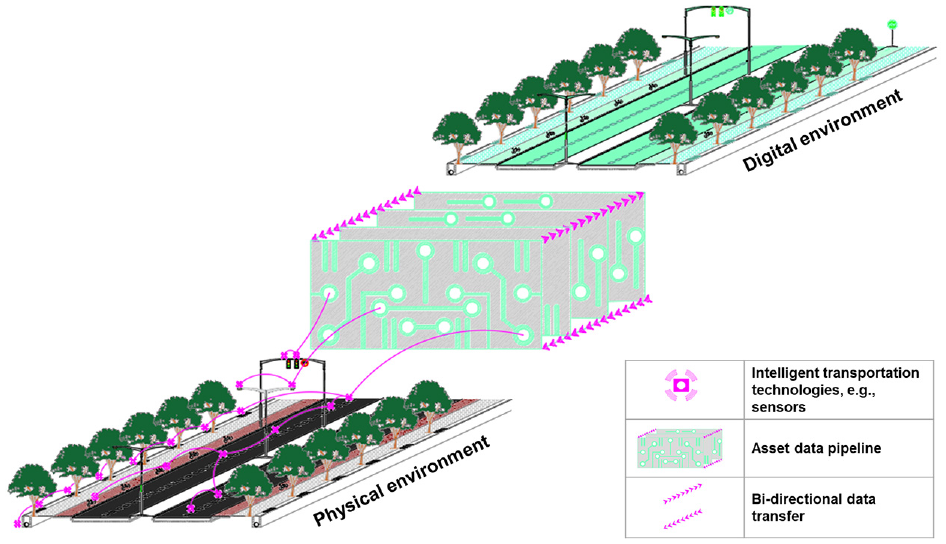
Visual representation of the proposed definition of Digital Twins for infrastructure assets.
This definition will support the implementation of Digital Twins in the infrastructure industry because of the industry’s unique features in that it requires the existence of spatial metadata with heterogenous data features coming from multiple sources. The implementation of Digital Twins in the infrastructure industry across the relatively extended asset lifecycle will require the identification and adoption of open standards to optimize the technology’s capabilities and perceived benefits and the development of a data governance framework that ensures one true source of reliable and relevant information and establishing standards that define the attributes and features that should be collected per asset.
Methods
To achieve the second intermediate objective, a web-based survey was developed, piloted with subject matter experts from the Kentucky Transportation Cabinet (KYTC) and UDOT, and approved by the Office of Research Integrity at the University of Kentucky before distribution. The survey was distributed to the AASHTO maintenance transportation committee members and the Federal Highway Administration (FHWA) asset management contact list. A total of 44 complete responses were received from 30 state DOTs, as presented in Figure 2. Responses were collected from several divisions within the surveyed state DOT personnel with knowledge of ancillary asset maintenance and operation (59% of the responses), ancillary asset data management and analysis (23% of the responses), and other expertise (18% of the responses). Examples of respondent positions include bureau chiefs, managers, directors, and state-wide engineers.
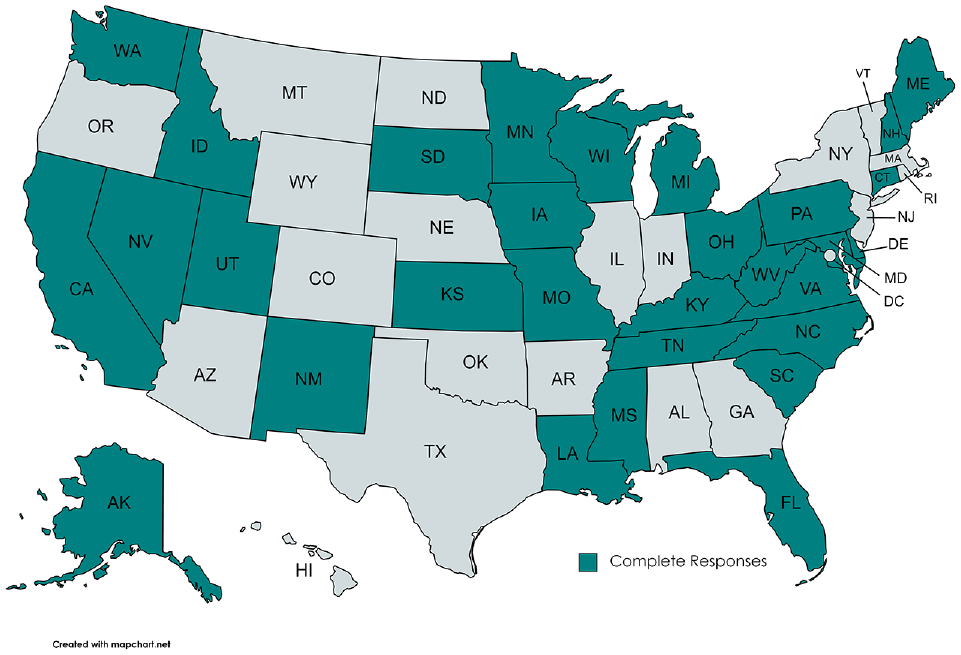
Complete responses received from state Departments of Transportation (DOTs) (created with MapChart.net).
A highway asset system within a state DOT can be classified into three categories: bridges, pavements, and ancillary assets. Ancillary assets represent a significant investment of public funds, and many are essential to the safe and efficient operation of highway facilities. Three major systems of 34 ancillary transportation assets were considered: 1) Roadside Asset Systems, 2) Drainage Asset Systems, and 3) Electronic Asset Systems. Respondents were asked to select all the assets for which their agency usually collects data for each considered system.
Roadside Asset Systems mainly include the following assets: access ramps, bike paths, brush control, fence, guardrail, guardrail end treatments, impact attenuators, landscaping, other barrier systems, pavement markings, roadside assets, roadside hazards, sidewalks, signs, and turf.
Drainage Asset Systems consist of the following assets: culverts, curb and gutter, ditches, drain inlets and outlets, edge drains, erosion control, pipes, stormwater retention systems, and underdrain.
Electronic Asset Systems comprise the following assets: communication systems, intersection control beacons, intelligent transportation system (ITS) equipment, light-emitting diode (LED)-enhanced signs, navigation lighting, roadway lighting, school speed limit beacons, traffic control signals, and warning beacons.
Data was collected for the 34 different ancillary assets. As the purpose of the paper is exploratory and not predictive, only assets with more than 10 data points (i.e., at least 10 subject matter experts reported that they collected data for the selected asset) were further considered. This is in accordance with existing literature where a minimum sample size of 10 experts is needed for reliable consensus ( 52 , 53 ). Thus, a total of 25 assets were selected, with 12 assets belonging to the Roadside Asset Systems, seven to the Drainage Asset Systems, and six to the Electronic Asset Systems. The selected assets, sorted from the highest to the lowest of the number of responses reporting that they collect data for these assets, are represented in Figure 3.
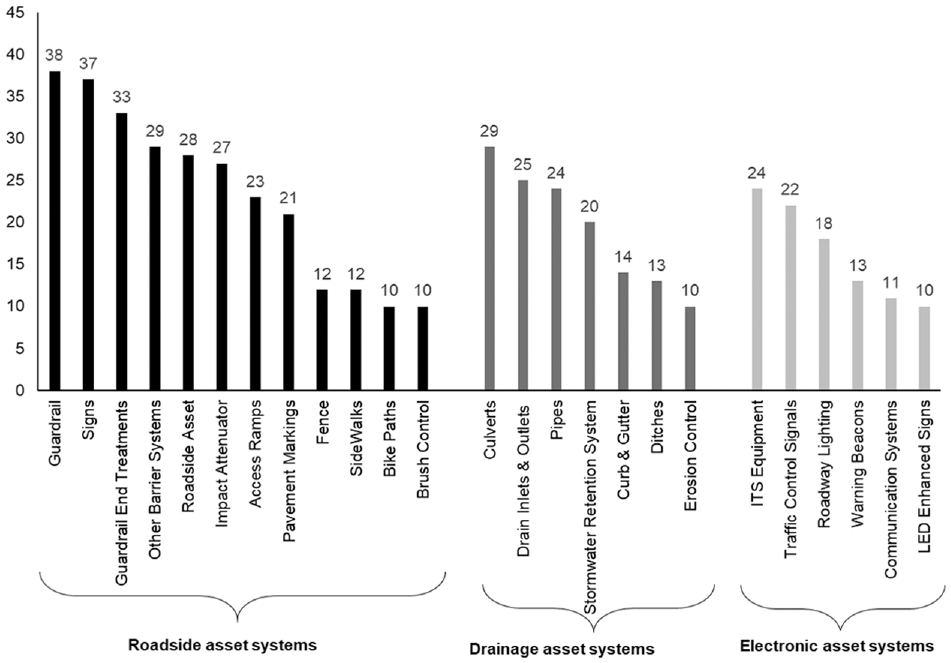
Selected ancillary assets from Roadside Asset Systems, Drainage Asset Systems, and Electronic Asset Systems.
Once the data needed to investigate and document the status quo of state DOTs and their current practices in transitioning toward the digitization of their ancillary transportation asset data were collected (i.e., the survey data), the second step was to analyze this data. Data analysis was conducted per asset and was distributed over two stages.
For each asset, respondents were asked about the timeline for when they perceive their state DOT to achieve a full digital transition. Data collected from this question was analyzed using k-means clustering—a generic yet efficient tool for finding groups or clusters in multivariate data. K-means clustering is the classification of similar data sets into different groups or clusters, where data in the same cluster share common features ( 54 ). The purpose of the k-means clustering employed in this research is exploratory and aims to identify groups to support further data analysis. In addition to k-means cluster analysis, principal component analysis (PCA) was employed.
Based on the results, assets were grouped, and descriptive and statistical analyses were employed for two purposes. The first was to further understand to what extent some assets are more digitized than other assets and to investigate the practices and factors that make those assets closer to reaching full digitization compared with others. The second was to contextualize the DOTs’ maturity in the advancement of digital processes. Thus, three major factors contributing to digitization were explored: 1) asset data format, 2) asset data level of detail, and 3) asset data collection techniques. To investigate these three factors, respondents were asked, for each asset investigated in this study, to indicate the format of the collected asset data, the quality of collected data represented with the associated level of detail, and the method used for data collection. Statistical analysis was employed to understand each variable for different levels of asset digitization. A summary of the methodology is presented in Figure 4.

The methodology adopted in this study for data collection and analysis.
Results
Digital Transformation of Ancillary Transportation Asset Data
Initially, respondents were asked to indicate, for each of the selected assets, the perceived timeline for their state DOT to achieve a full digital transition. The full digital transition of an asset was described in the survey as having the asset data within an established electronic management system. It is critical to distinguish that a full digital transition is not achieved by replacing a pen and paper with a smart screen; rather, it is an information management system with automated or semi-automated data acquisition capabilities. Respondents were given three options: 1) in the next 2 to 5 years, 2) in the next 5 to 10 years, and 3) in the next 10 to 15 years. None of the respondents chose 10 to 15 years; thus, this option was excluded from the analysis. For each asset, the number of state DOTs that perceive to achieve full digital transitioning in the next 2 to 5 years and the next 5 to 10 years is presented in Figure 5.

Number of state Departments of Transportation (DOTs) that perceive to achieve full digital transitioning of ancillary asset data in the next 2 to 5 years and the next 5 to 10 years.
To investigate the full digital transition timeline of the assets, k-means clustering was employed to classify the selected assets and break them into groups based on the respondents’ answers about when they anticipate the complete digitization of the asset data. The elbow method was used to determine the number of clusters, as shown in Figure 6. Referring to the scree plot for the k-means cluster analysis (Figure 6), and based on the elbow method, the elbow at Cluster 2 represents the optimal balance between minimizing the number of clusters and the variance within each cluster, indicating that the assets can be clustered into two groups, after which the decrease in the sum of squares (SS) is minimal or constant. Clustering results were also verified using the “Knee Locators” function in python, confirming that the 25 assets can be grouped into two digitization clusters, and the corresponding cluster for each asset was thus identified ( 17 ).

Scree plot for the k-means cluster analysis.
To visualize the perceived timeline for digitization of the data of the selected assets, Figure 7 represents the variation of the frequency of DOTs that will complete asset data digitization in the next 5 to 10 years to the frequency of DOTs that will complete asset data digitization in the next 2 to 5 years.
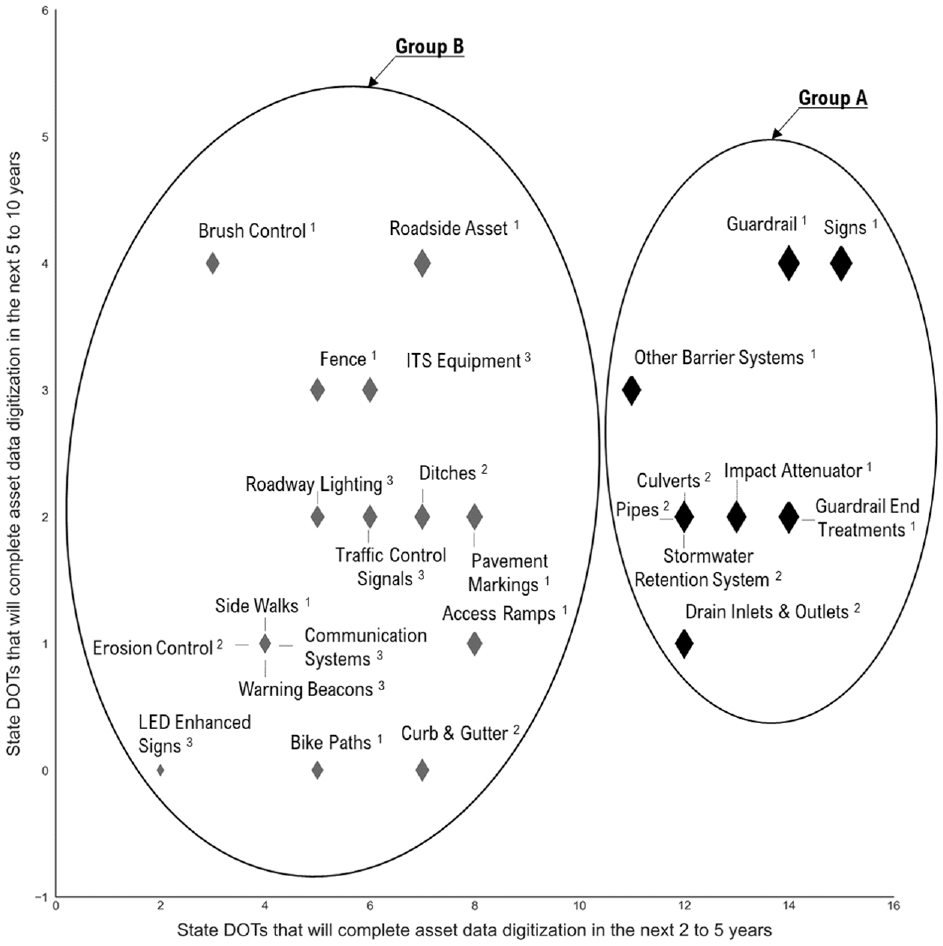
Perceived timeline for digitization of selected ancillary asset.
The results showed that, while the 25 ancillary assets are heading toward attaining full digitization, some assets are further along the process than others. Moreover, the results showed that on the spectrum of digitization, ancillary assets could be grouped into two clusters: Group A encompasses nine assets: Guardrails, Signs, Other Barrier Systems, Stormwater Retention Systems, Pipes, Culverts, Impact Attenuator, Guardrail End Treatments, and Drain Inlets and Outlets (black diamond in Figure 7), and Group B which includes 16 assets: Brush Control, Roadside Asset, Fence, ITS Equipment, Roadway Lighting, Traffic Control Signals, Ditches, Pavement Markings, Sidewalks, Erosion Control, Warning Beacons, Communication Systems, Access Ramps, LED-Enhanced Signs, Bike Paths, and Curb and Gutter (grey diamond in Figure 7). Group A is considered to be more advanced in relation to digitization because more state DOTs are anticipating the digitization timeline to be less than 5 years, and the pace to reach full digitization for those assets is faster than the pace for assets in Group B.
The asset clustering into two groups was also confirmed by employing PCA to reduce the asset data from four dimensions into two dimensions. Five of the nine assets in Group A belong to the Roadside Asset Systems, while the remaining four belong to the Drainage Asset Systems. Whereas, for Group B, seven of the 16 assets belong to the Roadside Asset Systems, three belong to the Drainage Asset Systems, and the remaining six belong to the Electronic Asset Systems. Since Group B has almost double the assets of Group A, and since some systems are more digitized than others, it is important to inspect the second aspect of this objective, which is to investigate the current practices of state DOTs toward digitizing assets in Group A versus Group B.
To properly understand and depict the current practices of state DOTs toward digitizing their ancillary transportation asset data, three major asset data collection variables that extensively contribute to data digitization were investigated. The first variable is Data Format, that is, in which format the asset data was collected for each asset. The Data Format variable consists of five different categories: 1) Paper-Based, 2) Portable Document Format (PDF), 3) Smart PDF (i.e., a fillable PDF), 4) 2D Models, and 5) 3D Models. Respondents were asked to select all the categories that applied. The second variable investigates the Level of Detail in which the asset data was collected. The associated levels are: 1) L1 (i.e., most comprehensive), 2) L2 (i.e., sufficient for comprehensive analysis), 3) L3 (i.e., sufficient detail to conduct elementary methods of maintenance), 4) L4 (i.e., basic details with summary statistics of inventory, performance, and utilization), and 5) Not Available (i.e., no identified level of detail). The description of the Levels of Detail was adopted from the report published by the FHWA, “Asset Management Data Collection for Supporting Decision Processes” ( 55 ). The third variable describes the techniques used by state DOTs to collect asset data. The options were 1) Manual Collection (i.e., can use handheld computers, GPS units, or pen-and-paper records), 2) Automated Collection (i.e., involves a vehicle equipped with technologies to identify and document transportation assets, and 3) Remote Collection (i.e., uses photo logs, video logs, and satellite images). Respondents were also asked to select options that applied. The description of the different data collection techniques was adopted from the report published by FHWA, “Roadside Safety Hardware Identification Methods” ( 56 ).
For each of the three considered variables, two types of data analysis were conducted: descriptive and statistical data analysis. The descriptive data analysis investigated the different practices of state DOTs for assets belonging to Group A and Group B. Statistical data analysis was employed to test for any statistical significance. For that purpose, standard error (SE) (Equation 1) was obtained to present the variability to estimate the corresponding proportions for each group and to compute the 99% confidence interval (CI) (Equation 2).

where
p = the sample proportion calculated as p = x/n with x denoting the number of successes out of a sample of size n, and
n = the sample size
And the general formula of the CI is:

where
point of estimate = the sample proportion p, and
Z (α/2) = the z-score.
From the standard normal distribution, for 99% CI, α equals 0.01 and, therefore, Z(α/2) = 2.576 and the 99% CI is obtained by calculating p ± 2.576 SE.
Ancillary Asset Data Format
A step toward digitizing ancillary asset data is to phase out paper-based documentation and move toward electronic documents such as PDFs, smart PDFs, or 2D/3D digital models that can be digitally collected, stored, shared, and queried. As such, for the Data Format variable, the collected data was aggregated to present state DOTs that abandoned the use of paper (i.e., for each asset, respondents did not select paper-based among the given options for this variable) versus state DOTs that are still using paper-based as an adopted data format. The distribution of the percentage of DOTs that abandoned the use of paper and those still using paper for each ancillary asset belonging to Group A and Group B are represented in Figures 8 and 9, respectively.
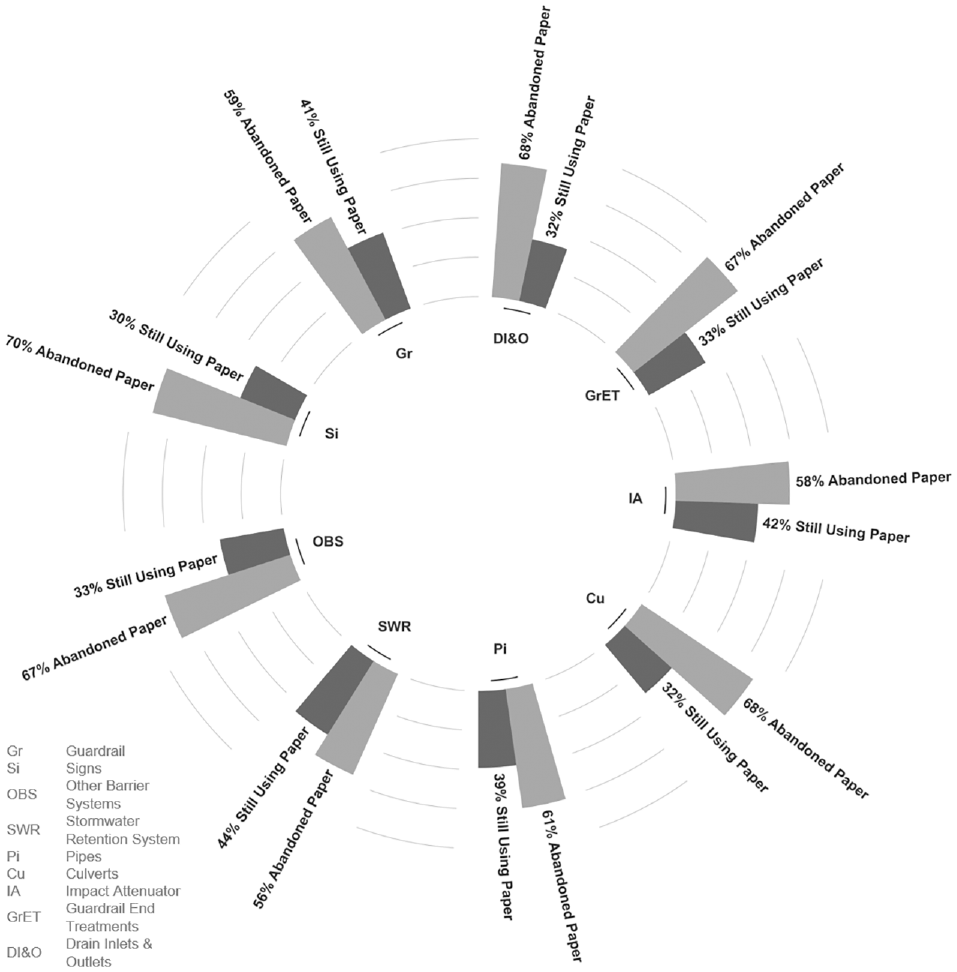
Percentage of state Departments of Transportation (DOTs) that abandoned the use of paper versus state DOTs that are still using paper-based data collection format for assets belonging to Group A.
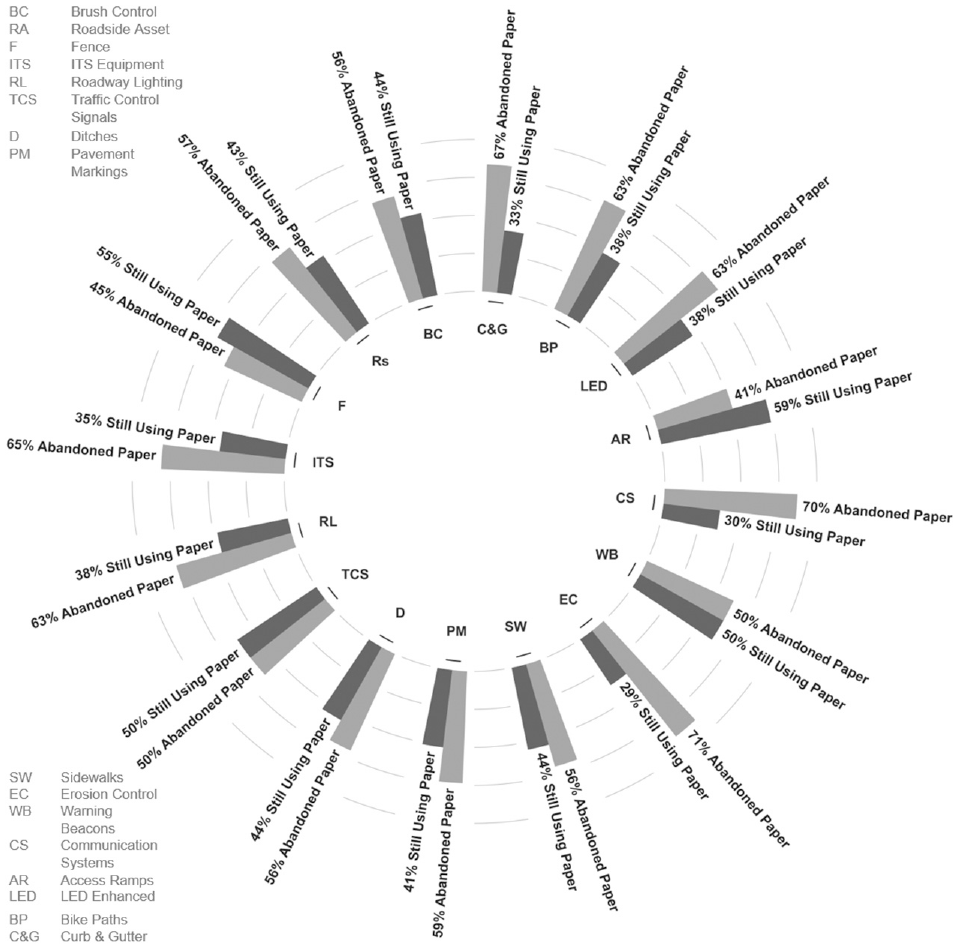
Percentage of state Departments of Transportation (DOTs) that abandoned the use of paper versus state DOTs that are still using paper-based data collection format for assets belonging to Group B.
For all assets belonging to Group A, the percentage of state DOTs that abandoned the use of paper is greater than that of state DOTs still using paper. However, for assets that belong to Group B, the difference in the percentage of state DOTs that abandoned the use of paper versus those that are still using paper is less than or equal to 30%, except for Erosion Control, Communication Systems, and Curb and Gutter. Also, for Access Ramps, Fence, and Traffic Control Signals, the difference was either negative or zero, indicating that the percentage of state DOTs that abandoned the use of paper for these assets is less than or equal to the percentage of state DOTs that are still using a paper-based format for asset data collection.
To investigate the variability associated with the continued versus abandoned use of paper of the two groups and test for any statistical significance, SE (Equation 1) and the 99% CI (Equation 2) were obtained, and the error bars are represented in Figure 10.

Average percentage of responding state Departments of Transportation (DOTs) that abandoned the use of paper-based data format versus those that are still using paper-based data format for asset Groups A and B.
The point estimates were computed using Equations 1 and 2 to accurately compare the samples presented in Figure 10 and test for statistical significance. For Group A assets, the point estimate for abandoning the use of paper-based data formats is between 55% and 73% with 99% confidence, while the point estimate for still using paper-based data formats is between 27% and 45% with 99% confidence. Since the interval (27%–45%) does not overlap with the interval (55%–73%), then the difference between the point estimates being compared is statistically significant at the <0.01 level.
As for Group B assets, the point estimate for abandoning paper-based data formats is between 49% and 67% with 99% confidence, while the point estimate for still using paper-based data formats is between 33% and 51% with 99% confidence. Since the interval (33%–51%) overlaps with the interval (49%–67%), then the difference between the point estimates being compared is not statistically significant at the <0.01 level.
This indicates that assets that belong to Group A are, on average, more digitized, because there is a statistical significance detected between the percentage of state DOTs that abandoned the use of paper-based data formats and those that are still using a paper-based data collection format. However, the same does not apply to Group B assets as no significance was detected.
Ancillary Asset Data Level of Details
The Data Level of Detail variable is highly correlated to the Data Format variable since the associated level of detail can improve or depreciate depending on the data-collected format. Thus, the distribution of the percentage of state DOTs that are using the different identified levels of detail from the most comprehensive level (i.e., L1) to the least comprehensive level (i.e., L4), or no identified level of detail (i.e., Not Available) for ancillary assets that belong to Group 1 and Group B are represented in Figures 11 and 12, respectively.

Distribution of the used level of detail by state Departments of Transportation (DOTs) for assets belonging to Group A.

Distribution of the used level of detail by state Departments of Transportation (DOTs) for assets belonging to Group B.
For assets that belong to Group A, and specifically for Guardrail, Other Barrier Systems, Impact Attenuator, Guardrail End Treatment, and Drain Inlets and Outlets, state DOTs mainly use a level of detail L3 followed by the use of a level of detail L2. While for Signs, Stormwater Retention Systems, Pipes, and Culverts, most state DOTs use a level of detail L2. However, for assets that belong to Group B, and for Brush Control, Roadside Assets, Fence, Ditches, and Curb and Gutter, most state DOTs use a level of detail L3 followed by L4, while for the assets Warning Beacons and Access Ramps, state DOTs use a level of detail L4 equal to or greater than the use of a level of detail L3. For ITS Equipment, Roadway Lighting, Pavement Markings, Communication Systems, and LED-Enhanced Signs, most state DOTs use a level of detail L3.
To investigate the variability associated with the levels of detail of the two groups and test for any statistical significance, SE (Equation 1) and the 99% CI (Equation 2) were obtained and presented in Table 4, and the error bars are shown in Figure 13.
Results for the Standard Error (SE) and 99% Confidence Interval (CI) for the Different Used Levels of Detail for Assets in Groups A and B
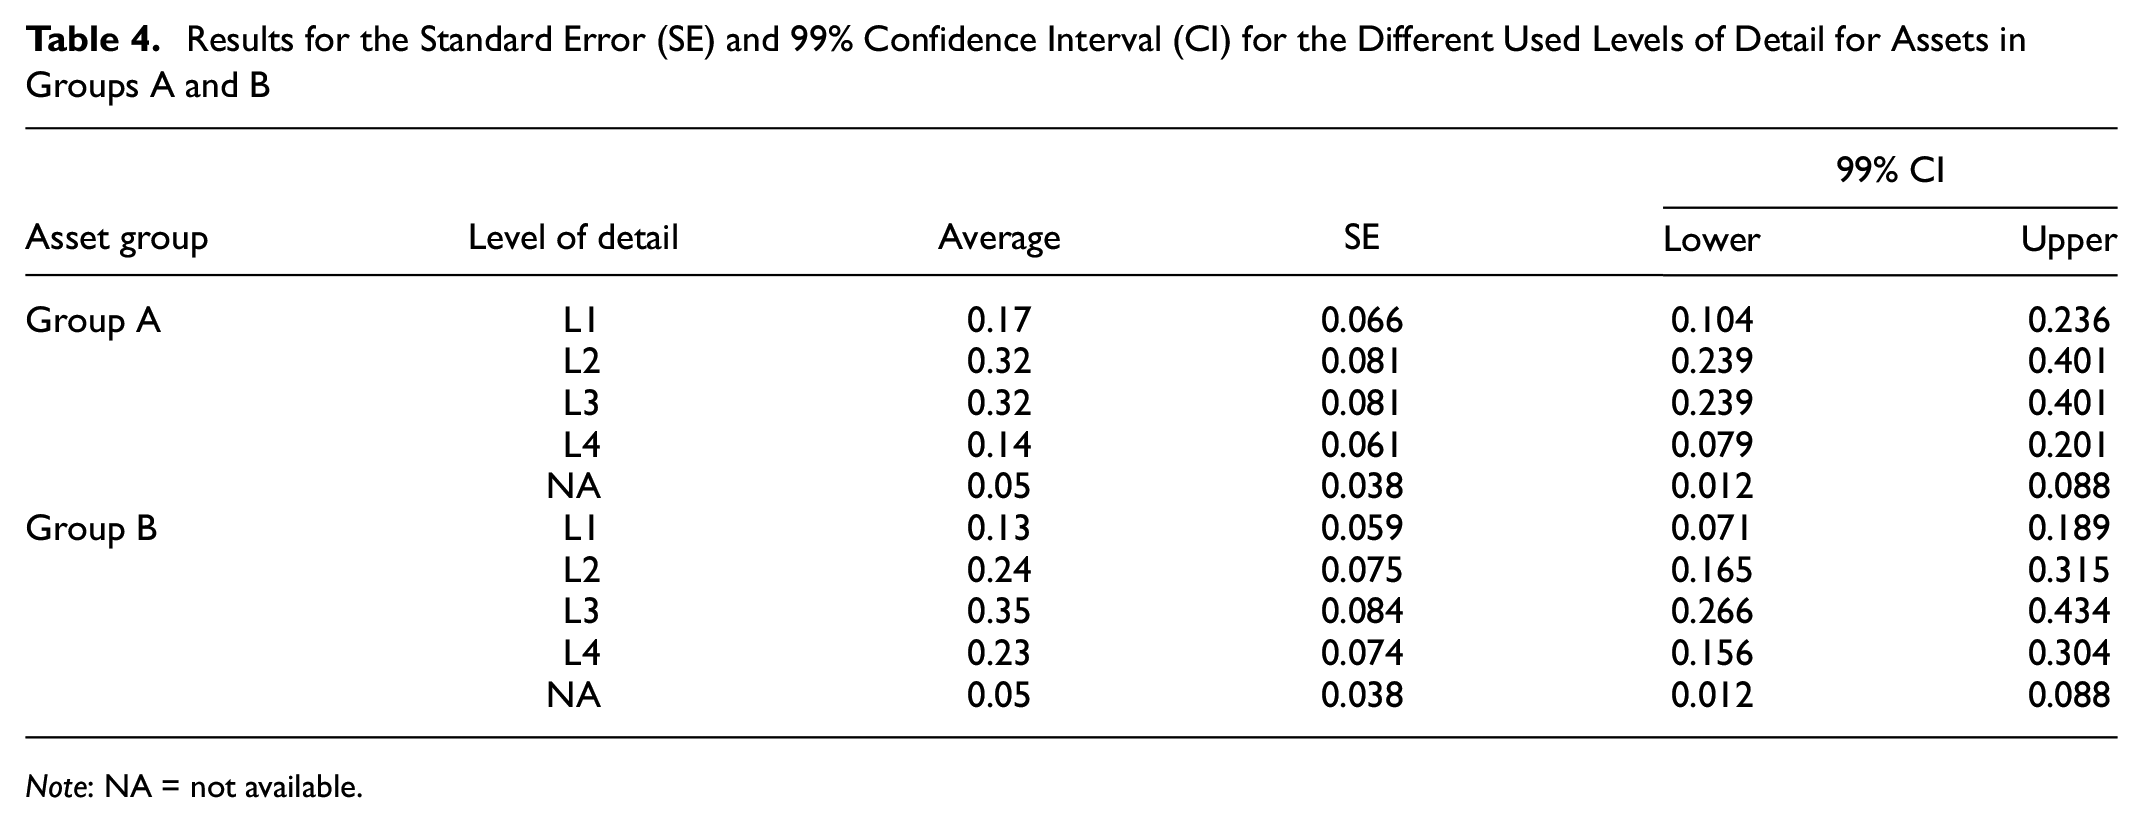
Note: NA = not available.

Breakdown of state Departments of Transportation (DOTs) use of the identified level of detail for asset Groups A and B.
For the assets in Group A, there is no statistical significance between the use of a level of detail L3 or a level of detail L2, where the point estimate for the levels of detail L2 and L3 at 99% confidence overlaps. Also, the point estimate for the level of detail L4 at 99% confidence does not overlap with that of L3 or L2, indicating a statistical significance between the use of L2 and L3 compared with L4. As for the assets in Group B, the point estimate for the levels of detail L4, L3, and L2 at 99% confidence overlaps, indicating no statistical significance between the use of the three different levels of detail.
This indicates that there is a trend to adopt a more comprehensive level of detail for assets in Group A compared with assets in Group B, where Group A tends to adopt a level of detail L2/L3 while assets in Group B are leaning more toward adopting a level of detail L3.
Ancillary Asset Data Collection Technique
The previously discussed variables, that is, Data Format and Data Level of Detail, depend on the data collection technique implemented by state DOTs. Also, with the advancement of technology, DOTs adopted innovative and emerging technologies for asset data collection to reduce cost, improve efficiency, enhance safety, and overcome the labor shortage. Additionally, adopting such techniques would improve the transition to digitization, since they support the feasible existence of digital databases that can be stored, shared, and communicated with existing systems. Thus, the distribution of the percentage of state DOTs that are using only manual data collection techniques versus state DOTs that are using a combination of data collection techniques (i.e., manual plus automated/remote) for ancillary assets belonging to Group A and Group B are represented in Figures 14 and 15, respectively.

Percentage of state Departments of Transportation (DOTs) that are using manual techniques and state DOTs that use a combination of data collection techniques for assets belonging to Group A.

Percentage of state Departments of Transportation (DOTs) that are using manual techniques and state DOTs that use a combination of data collection techniques for assets belonging to Group A.
For assets that belong to Group A, specifically for Guardrail, Signs, Other Barrier Systems, Stormwater Retention Systems, Guardrail End Treatment, and Drain Inlets and Outlets, state DOTs use a combination of manual and other techniques to collect the asset data. However, for Impact Attenuator, Culverts, and Pipes, state DOTs collect asset data mainly by adopting the manual collection technique. For assets that belong to Group B, the difference in the percentage using manual and automated/remote data collection techniques and the percentage using only manual methods for Fence, Pavement Markings, and Bike Paths is greater than or equal to 25%. For Roadside Assets and Access Ramps, the percentage of state DOTs using only manual compared with state DOTs that are using a combination of asset data collection techniques is equal. However, state DOTs mainly adopt manual data collection for the remaining assets.
Conversely, to investigate the variability of the corresponding data and test for any statistical significance, SE (Equation 1) and the 99% CI (Equation 2) were obtained, and the error bars are represented in Figure 16. For assets in Group A and Group B, there is no statistical significance between the adoption by state DOTs of manual data collection versus a combination of data collection techniques.
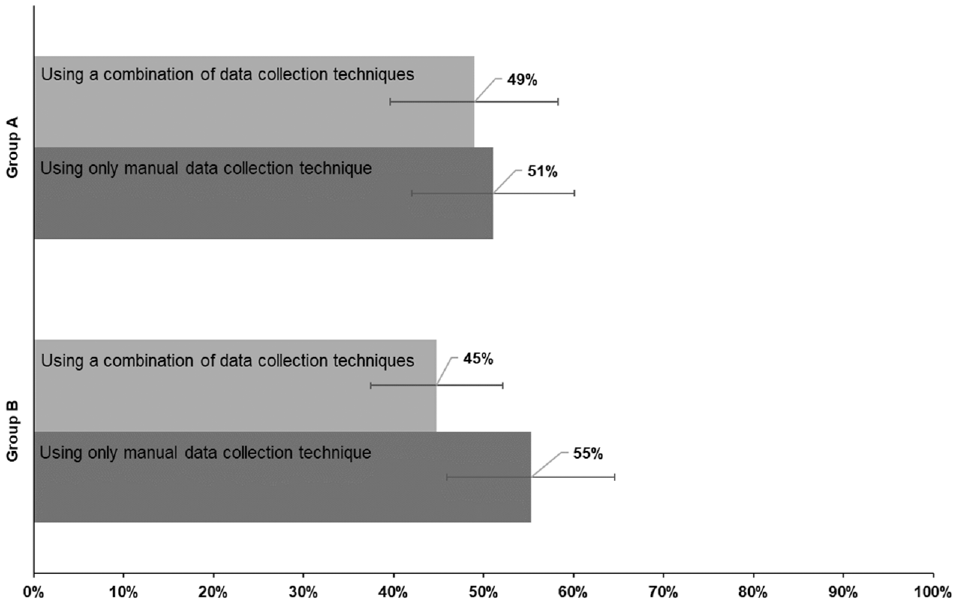
Average percentage of state Departments of Transportation (DOTs) that use manual data collection versus a combination of data collection techniques for asset Groups A and B.
The point estimates were computed using Equations 1 and 2 to accurately compare the samples presented in Figure 16 and test for statistical significance. For Group A assets, the point estimate for using a combination of data collection techniques is between 40% and 58% with 99% confidence, while the point estimate for only using manual data collection is between 42% and 60% with 99% confidence. Since the interval (40%–58%) overlaps with the interval (42%–60%), then the difference between the point estimates being compared is not statistically significant at the <0.01 level.
As for Group B assets, the point estimate for using a combination of data collection techniques is between 36% and 54% with 99% confidence, while the point estimate for only using manual data collection is between 46% and 64% with 99% confidence. Since the interval (36%–54%) overlaps with the interval (46%–64%), then the difference between the point estimates being compared is not statistically significant at the <0.01 level.
Discussion
The underpinning element of the proposed definition of the Digital Twins for infrastructure assets essential for successfully creating and implementing the concept is data—the data that connects the physical asset to its digital replica. However, the criticality of data does not necessarily imply that Digital Twins are constructed using a plethora of databases that are overwhelming to understand and process. On the contrary, Digital Twins should be created from databases of high-quality information that can be easily accessed, extracted, updated, and integrated. High-quality data is perceived as information that enriches analytical asset models—including, for instance, asset inventory data, asset geolocation, updated asset condition data, and so forth—necessary for creating predictive and preventive maintenance and providing insights into decision-making ( 39 ). As such, it is critical to understand the asset data architecture and provide state DOTs with a data blueprint to assess and evaluate where they stand on the spectrum of digitizing their asset data management. To optimize the use of Digital Twins, the ultimate objective for state DOTs is to create a global Digital Twin for the highway system. This goal aligns with the ongoing efforts of producing a global IFC standard for infrastructure ( 57 ). A global Digital Twin should include information about all assets. However, not all assets require the same type of information. For instance, some assets might require the existence of a comprehensive 3D model, and other assets need a detailed 2D model, whereas, for the remaining assets, no model is required and basic information is enough to conduct the necessary cross-asset data analysis.
By reviewing the Asset Matrix published by MnDOT’s AMSIP, all the ancillary assets considered in this study were included and classified either as Tier 1 (e.g., ITS Equipment and Traffic Control Signals), Tier 2 (e.g., Culverts), Tier 3 (e.g., Signs and Impact Attenuator), or Tier 4 (e.g., Fence) and were assigned to a desired maintenance approach ( 14 ). Also, some of the assets were considered in UDOT TAMP and ODOT TAMP ( 5 , 15 ). This indicates that all these assets contribute to public safety and improved system performance, and this contribution justifies the efforts of state DOTs toward digitizing their data. However, based on the results presented in this paper, it was found that assets belonging to Group A tend to be more digitized than those belonging to Group B.
Several factors could contribute to this classification. However, the most critical one is the extent to which reliable and high-quality data related to the asset condition are required to conduct preventive maintenance, and how feasible it is to access such data. This can be highlighted by comparing two assets—one clustered within Group A and the other within Group B. For instance, Culverts were clustered within Group A, and MnDOT classifies them as Tier 2, that is, assets that represent a significant consequence to public safety on failure for a corridor or municipality. Their desired asset management approach is “Condition Driven,” which requires that the condition of the asset should be monitored routinely and actions taken to manage the asset performance along the asset lifecycle.
Similarly, UDOT classifies Culverts as Tier 2—that is, condition-based management, where accurate data should be collected within a time frame of less than a year—and the risk assessment is primarily based on asset failure ( 15 ). This research found that, for this asset, 68% of state DOTs abandoned the use of paper-based data format, the main level of detail used is L2 (level of detail sufficient for comprehensive analysis), and 62% of state DOTs still use manual data collection techniques. These findings could be explained by the critical role that this asset plays in public safety, thus requiring high-quality and reliable asset conditions that cannot be attained using the available technologies.
Conversely, Sidewalks were clustered within Group B. MnDOT also classifies them as Tier 2, and the desired management approach is “Condition Driven,” and UDOT also assigned the same classification. However, for this asset, 56% of state DOTs abandoned the use of paper-based data format, L4 (basic details with summary statistics of inventory, performance, and utilization) is the main level of detail used, and 64% of state DOTs are using only manual data collection techniques. For both assets, most state DOTs abandoned the use of paper-based data format and the major data collection technique adopted is mainly manual either to control the quality of the collected data or because of the limited capabilities of the existing technology, but the major difference is in the required level of detail, that is, L2 for Culverts compared with L4 for Sidewalks and the complexity associated with data collection.
Most state DOTs have the intention to achieve the digital transition; however, there is scarce information related to the steps on how to accomplish this transition. The TAM guidebook and the accompanying digital tool can provide a structured approach that state DOTs can use to assess their data use and gain knowledge on exploiting the existing digital data and making it more accessible ( 11 ). Additionally, the findings of this paper offer potential guidance for state DOTs to assess where they are located in the spectrum of asset data digitization and how to select assets that require more data mining, leverage the value of existing data, and improve asset performance. A critical step before implementing Digital Twins is to achieve digitization; assets in Group A were found to be more digitized than those in Group B, making them more suitable candidates for Digital Twins.
All assets in Group A were given as desired maintenance approach of either “Cycle Driven Plus”—which requires that the condition of the asset should be inspected and maintained on a cyclical basis, where condition data is needed to make condition-based decisions—or “Condition Driven,” thus requiring a preventive maintenance investment strategy. Therefore, they can benefit from Digital Twins’ capability to improve asset performance. Accordingly, for state DOTs that envision the implementation of Digital Twins in the future, the findings of this paper can act as a resource to support them in developing asset prioritization lists, detecting information gaps, and investigating different strategies that would help leverage the value of data. Some state DOTs have already taken the lead and hired a dedicated Chief Data Officer (Ohio DOT) or a Civil Integrated Management Officer (Florida DOT) to support this data transition.
Conclusions and Future Research
The implementation of Digital Twins in the infrastructure industry is gaining attention because of the technology’s perceived capabilities and benefits. However, the concept is unclear as yet, and the existing definitions do not consider the infrastructure industry’s unique features. To bring awareness of the concept, existing definitions of Digital Twins were reviewed, and a holistic definition of Digital Twins for infrastructure assets was tailored to address this knowledge gap.
A web-based survey was developed and distributed to investigate the current practices of state DOTs toward achieving the digital transition of their ancillary asset data and contextualizing their maturity in the advancement of the digital process. A total of 25 ancillary assets were considered in this study, distributed over three systems of assets: Roadside Asset Systems, Drainage Asset Systems, and Electronic Asset Systems. The results showed that the 25 assets could be clustered into groups A and B, where assets in Group A are more digitized than those in Group B. It was found that, for assets in Group A, most state DOTs have abandoned the use of paper-based data format, the adopted level of detail is L2 or L3, and a combined method of manual plus automated and remote is employed to collect asset data. However, for assets in Group B, state DOTs are still using paper-based data formats in addition to other data formats, the adopted level of detail is mainly L3, and a combined method of manual data collection combined with automated and remote are used.
While multiple factors contribute to this classification, it was found that the required level of detail and the information related to the asset condition are the most critical. This was further explained by investigating the desired maintenance approaches adopted by several state DOTs for the different ancillary assets considered in this study.
Assets belonging to Group A were considered more suitable candidates for Digital Twins. Future research will explore the best practices implemented by state DOTS to achieve digitization and investigate the necessary data models and information requirements for ancillary assets that fulfill the “ideal” environment for a holistic Digital Twin. We will create a data architect in the form of an asset data lifecycle ecosystem and develop an asset data pipeline for data processing and analytical purposes.
Footnotes
Author Contributions
The authors confirm contribution to the paper as follows: study conception and design: A. Ammar, H. Nassereddine; data collection: A. Ammar; analysis and interpretation of results: A. Ammar, F. Maier. R. Catchings, H. Nassereddine, G. Dadi; draft manuscript preparation: A. Ammar, H. Nassereddine. All authors reviewed the results and approved the final version of the manuscript
Declaration of Conflicting Interests
The author(s) declared no potential conflicts of interest with respect to the research, authorship, and/or publication of this article.
Funding
The author(s) received no financial support for the research, authorship, and/or publication of this article.