
Abstract
Naturalistic driving data are widely used to investigate factors related to road safety. Crashes and near-crashes can be regarded as the critical events on the road. The existing studies typically modeled crash and near-crash events at the trip level. However, individual drivers may have different risk levels, and other factors such as distraction can also play a role. This study uses variables automatically derived from naturalistic driving data. Driver distraction is detected from videos using facial landmarks. Based on the collected variables, a beta regression model is developed to identify the significant variables affecting drivers’ risk levels. It is found that the average acceleration rate, number of hard accelerations, driver distraction, and age are significant variables. The findings from this study can be used to identify risky drivers and improve the design of automated vehicles by eliminating human errors and risky driving patterns. Moreover, advanced driver assistance systems (ADAS) can be promoted to alert drivers to risky driving behaviors. The proposed model is also easy to implement in real driving conditions as most of the variables can be extracted automatically. Relevant agencies can also use the model to identify risky drivers and provide proactive customized education programs.
Road fatality is a major concern that has a negative effect on economic growth and the whole society worldwide. Crashes cause 1.35 million deaths and 50 million injuries every year ( 1 ). In the U.S., 42,915 deaths were caused in 2021, which was an increase of 10.5% over 2020 ( 2 ). Numerous studies have been conducted to investigate the influencing factors, such as environmental factors, road geometrics, weather conditions, and so forth. Predictive and systemic analyses have been carried out to prevent crashes ( 3 ).
Driver factors play an important role in crash occurrence. More than 80% of road crashes are related to driver factors ( 4 , 5 ). It has been widely acknowledged that some driving behaviors, such as distracted driving (impaired driving), aggressive driving (failing to yield, speeding, hard acceleration, etc.) can pose a threat to road safety ( 6 ). The emergence of high-resolution naturalistic driving data has offered more in-depth analyses for pre-crash and post-crash scenarios. The related studies have mostly been focused on analysis of crash and near-crash events at the trip level. However, simply modeling each trip can miss some factors related to drivers. The risk level of the individual driver can be modeled instead.
The existing studies identifying risky drivers have usually been conducted in a driving simulator, or on some specific routes with limited participants. Long-term observation is needed for modeling driver risk levels.
In this paper, naturalistic driving data are collected over 2 years using event data recorders. Data from 187 drivers are used. The variables related to driving kinematics, such as speed, average acceleration rate, number of hard accelerations, average braking rate, and other driving characteristics such as percentage of distraction are automatically extracted. The driver’s risk level is derived using the number of crash and near-crash events divided by mileage. A beta regression model is established to model the risk level of each driver.
The findings from this study can be used for improving driver-training programs. The related agencies and organizations, such as insurance companies, can better identify different driving patterns and provide customized services. The findings can also be used to investigate pre-crash scenarios and improve the design of automated vehicles and road systems.
For the following part of the paper, the next section is the literature review. The third section describes the data collection procedure using onboard videos and GPS trajectory data. The fourth section presents the modeling part with the beta regression model. The fifth section are the conclusion and discussion.
Literature Review
Naturalistic Driving Data
Traditional studies have used driver behavior questionnaires (DBQs) to obtain information about driver demographics and driving habits. The DBQ is a self-reporting tool. Instead, naturalistic driving data can record high-resolution kinematic parameters during driving. The naturalistic driving data can be used to investigate different driving patterns, analyze drivers’ evasive maneuvers in pre-crash scenarios, and calibrate driving-simulation models. The data include vehicle kinematics such as speed, acceleration, lane change, the positions of surrounding vehicles, and so forth. Meanwhile, some emerging devices such as onboard event data recorders (or cameras) are used to offer the front and rear views from the vehicles. The event data recorder can record technical information about vehicles’ status for a short time when critical events happen. The recorded information can be better used for assessing vehicles’ safety performance ( 7 ). Moreover, the emerging data sets are offering more potential for safety-related studies, such as the 100-Car Naturalistic Driving Study ( 8 ), the second Strategic Highway Research Program (SHRP2) ( 9 ), the Australian 400-Car Naturalistic Driving Study ( 10 ), the Shanghai Naturalistic Driving Study ( 11 ), and so forth.
Naturalistic driving data have been widely used for investigating driver performance during normal, impaired, and safety-critical events. Important factors influencing driver behaviors and critical events were investigated. For example, reaction time, violations, speeding, and jerk rate could be used to assess driver behaviors. Lateral and longitudinal accelerations, yaw rate, and forward time to collision were used as triggers for critical events. Recently, Das, Khan and Ahmed ( 12 ) developed a deep-learning model to identify lane-change maneuvers using SHRP2. Ghasemzadeh et al. ( 13 ) investigated the extraction of weather information from SHRP2, and the potential to investigate multiple data sources such as video and radar. Khoda Bakhshi and Ahmed ( 14 ) built a generalized extreme value (GEV) distribution based on driving profiles and identified the optimal threshold values for steering and acceleration to estimate crash risk.
Risky Driver Identification Using Crash and Near-Crash Events
The crash is typically used as a direct measure for road safety. However, crashes are rare events. It may take a few years to collect a big enough sample. A near-crash is the condition in which rapid evasive action is needed to avoid a crash ( 15 , 16 ). Drivers take evasive action such as braking and turning the wheels, especially within 2 s before the crash/near-crash. Younger drivers (such as teens) were found to contribute more to crash and near-crash events, though drivers’ evasive maneuvers did not vary a lot among different age groups ( 17 ).
Traditional studies have typically modeled crash and near-cash events at the trip level. Seacrist et al. ( 18 ) used SHRP2 to compare the frequency of near-crash events of drivers in three age groups, that is, teen (16–19 years old), young adult (20–24 years old), and experienced adult (35–54 years old). Papazikou et al. ( 19 ) investigated the difference between near-crash and crash events using vehicles’ kinematic profiles. Wu and Wang ( 20 ) used crash and near-crash events to investigate factors contributing to rear-end crashes on freeways.
At the individual driver level, some studies have used driving behaviors such as tailgating, hard braking, hard acceleration, and failing to yield/stop as the indicators for risky drivers ( 21 ). And the accumulation of crash and near-crash events for each driver could help to assess the driver’s risk level. Dingus et al. ( 8 ) labeled risky drivers with a higher number of events (incidents labeled by the drivers during driving). They also concluded that risky drivers had higher lateral accelerations and longitudinal accelerations than safe drivers. Arvin, Kamrani and Khattak ( 22 ) found that higher instability in driving could increase the risk level. In addition, drivers who are assessed as more risky tend to have longer perception time, shorter following distance, larger deceleration rate, and more frequent accelerations. Seacrist et al. ( 17 ) used speed profiles collected from five European countries to identify risky drivers. The (time) percentage of tailgating, hard accelerations, and hard braking were used as indicators. The 25% top-ranked drivers were labeled as risky drivers.
Driver factors could influence driver performance, thus increasing the risk levels. For example, driver distractions, including secondary tasks such as having food and drink, talking on the phone, and so forth, could increase crash risk ( 23 , 24 ). Drivers’ eyes being off the road for 2 s could result in double the crash risk ( 25 , 26 ). Yin et al. ( 27 ) used a fuzzy inference framework to estimate risky driving patterns. The features were collected from wearable sensors, onboard devices, and road context information. Drivers’ risk levels were labeled by volunteers (30 experienced drivers). Martinussen et al. ( 28 ) used a DBQ and divided the drivers into five categories, taking into consideration traffic violations. Figueira and Larocca ( 29 ) used driver behaviors during overtaking in a driving simulation to label the drivers’ risk levels. Driver demographic factors were used as input variables. A classification and regression tree (CART) was established to classify three risk levels. Wang and Xu ( 30 ) divided the number of drivers’ critical events by the mileage and used this ratio to classify the risky drivers into three categories. It was found that inattention, aggressive driving, and violations (such as running a red light) were significant variables. These studies took into consideration the driver’s personality and demographic factors, with information from a DBQ.
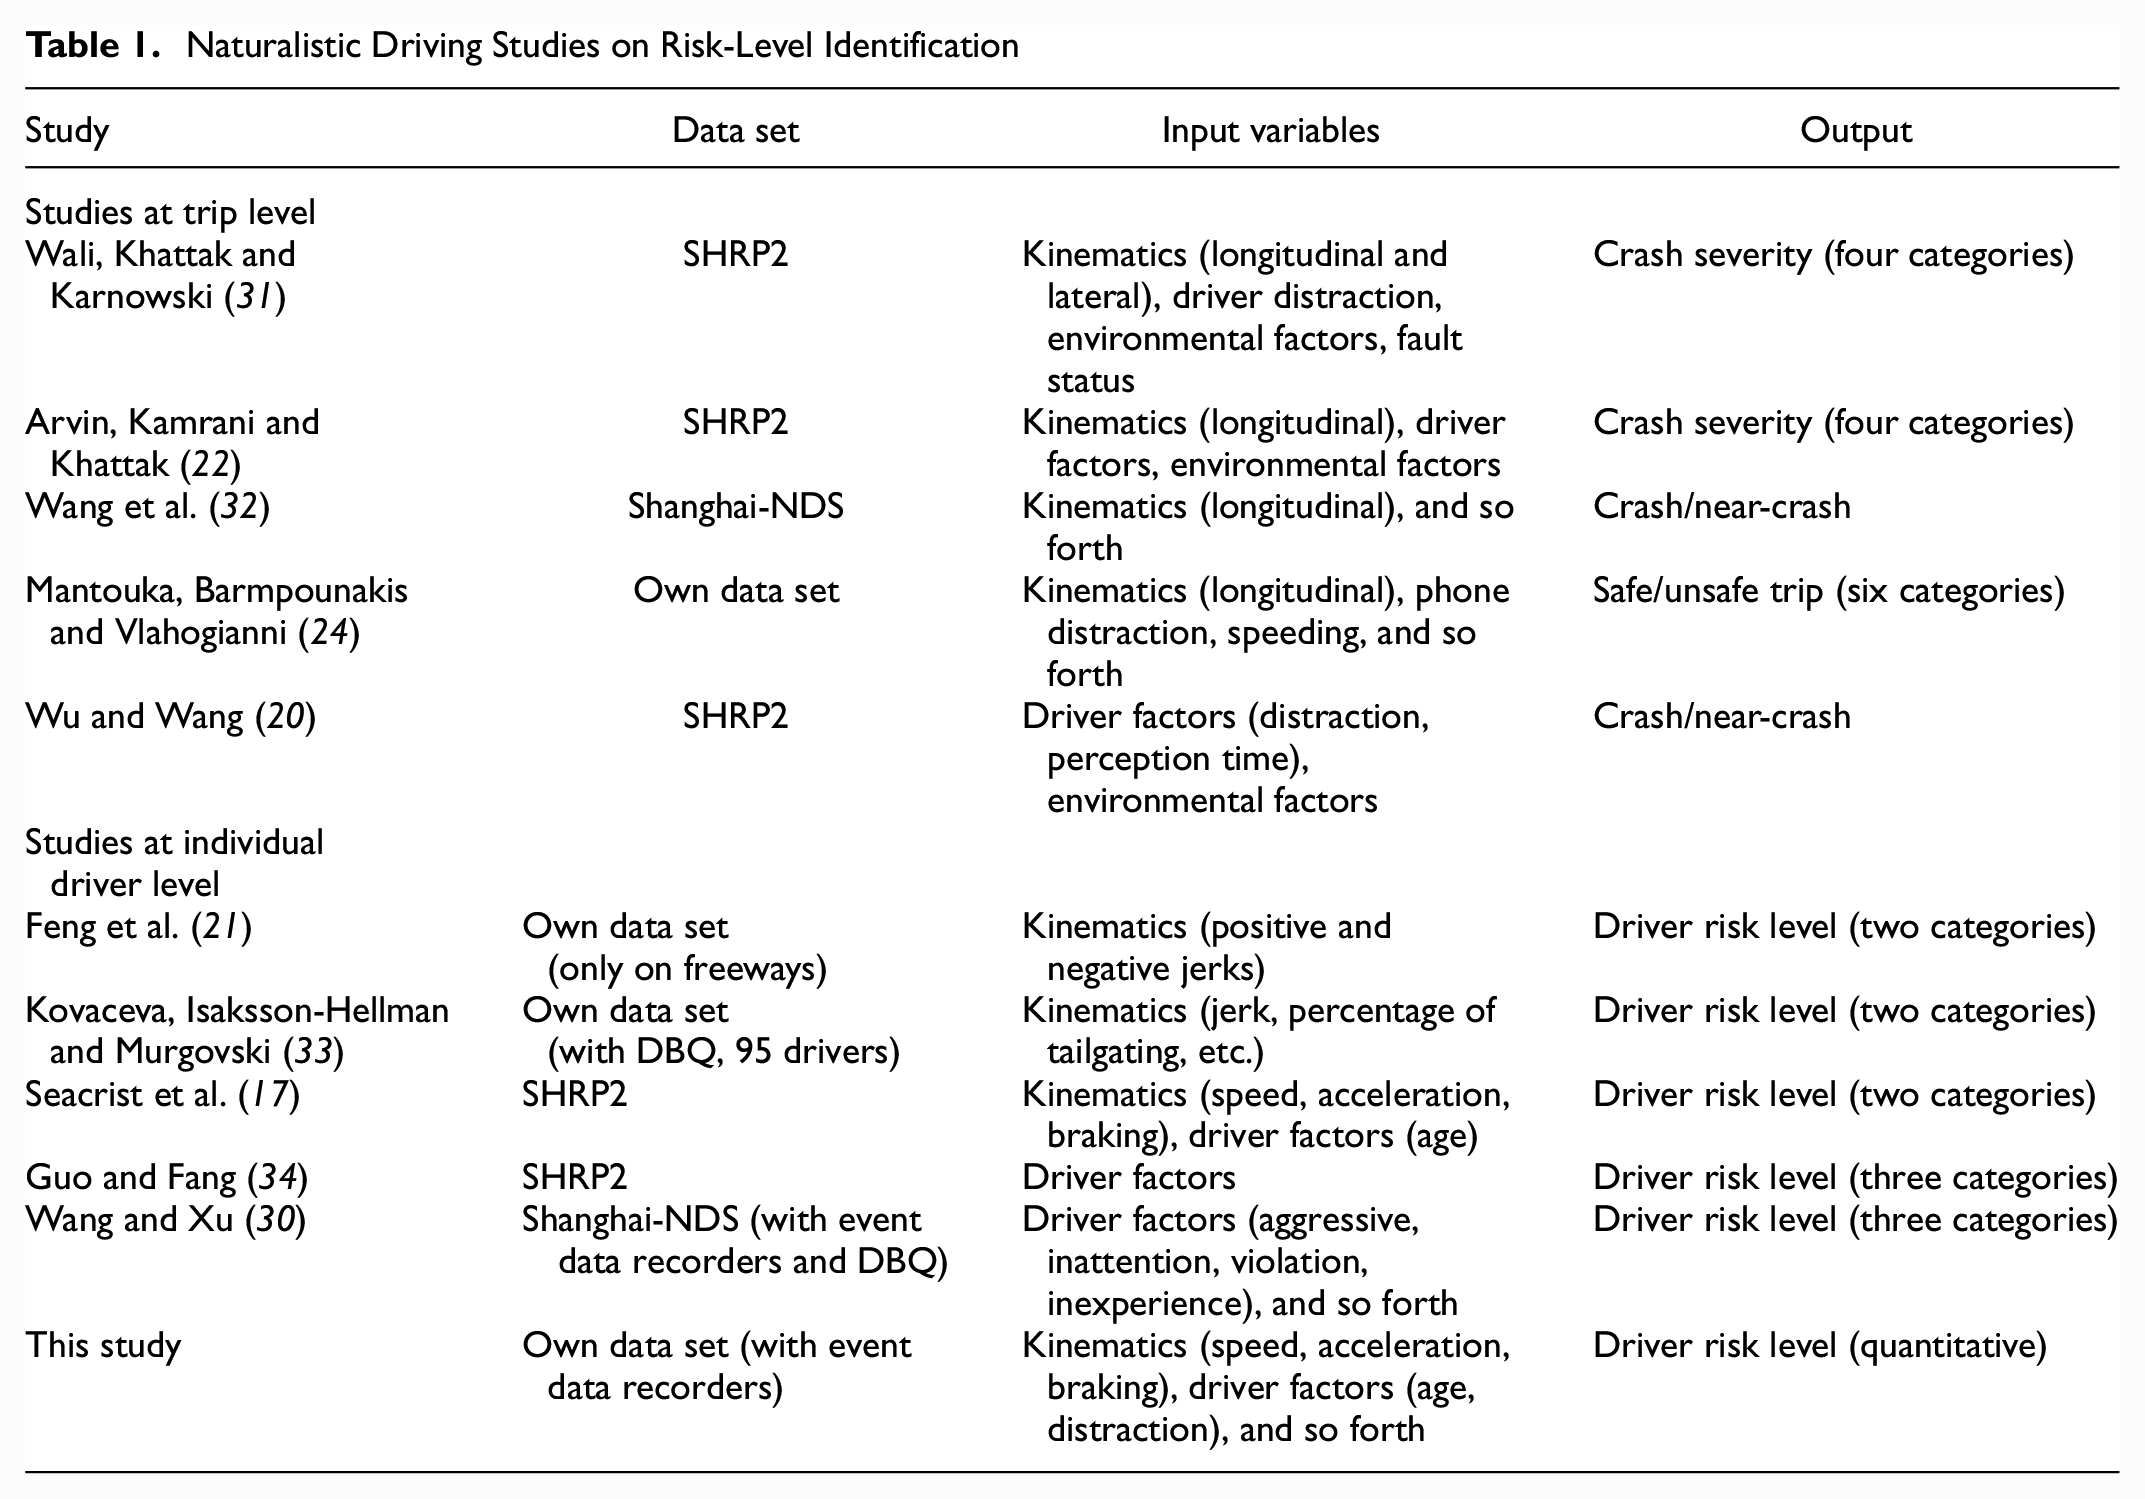
The related studies are summarized in Table 1. The first few rows are the studies conducted at the trip level, with the subsequent set of studies conducted at the individual driver level. The variables used include kinematic variables such as longitudinal variables (speed, hard acceleration, hard braking), lateral acceleration, and so forth, as well as driver factors (distraction, etc.). These studies typically classify drivers into two or three categories. In addition, existing studies related to driver-risk-level identification have mostly collected data from a few drivers in simulator studies. Long-term and citywide observations are still needed for assessing driver risk levels.
Naturalistic Driving Studies on Risk-Level Identification
Data Collection
For monitoring risky driving behaviors, Lytx® offers DriveCam® devices to help with fleet management ( 7 , 35 ). The device has two camera views, cabin view (driver’s face) and forward-facing view, as shown in Figure 1. The frame rate of the saved videos is 4 frames per second. Information such as forward acceleration (FWD), lateral acceleration (LAT), time stamp, and speed is captured. When the vehicle experiences crash and near-crash events (forward time to collision ≤4 s), the device will record a 20 s video clip (i.e., 10 s before and 10 s after the event). Thus, the time stamp on the video is between −10 and 10, with 0 as the middle point of the video. At this point, the device will alert the driver. In this study, the last 10 s of the video is removed. Only the 10 s before-event video clip is used for further analysis. Some invalid video clips are removed. For example, if the vehicle is just parked in the yard, this video is not representing a normal driving condition.

Examples of Lytx® video frame.
Overall, the study collected data from January 2020 to December 2021 in the Orlando, Florida area. Lytx® also provides complete GPS trajectories. There were 367 events from 187 different drivers that were collected. Among them, there were 22 crashes and 345 near-crash events, with 105 drivers experiencing one event, and 44 drivers experiencing two events. The number of events per driver ranged from 1 to 10. There were in total 51,168 trips, with a total mileage of 2,828,841 mi. On average, each driver made 1.24 trips every day, with a mileage of 22.27 mi. Each driver had a total mileage ranging between 3,000 and 30,000 mi. Figure 2 shows a random sample of the trips from 20 drivers plotted on the map. Each driver is marked with a different color.
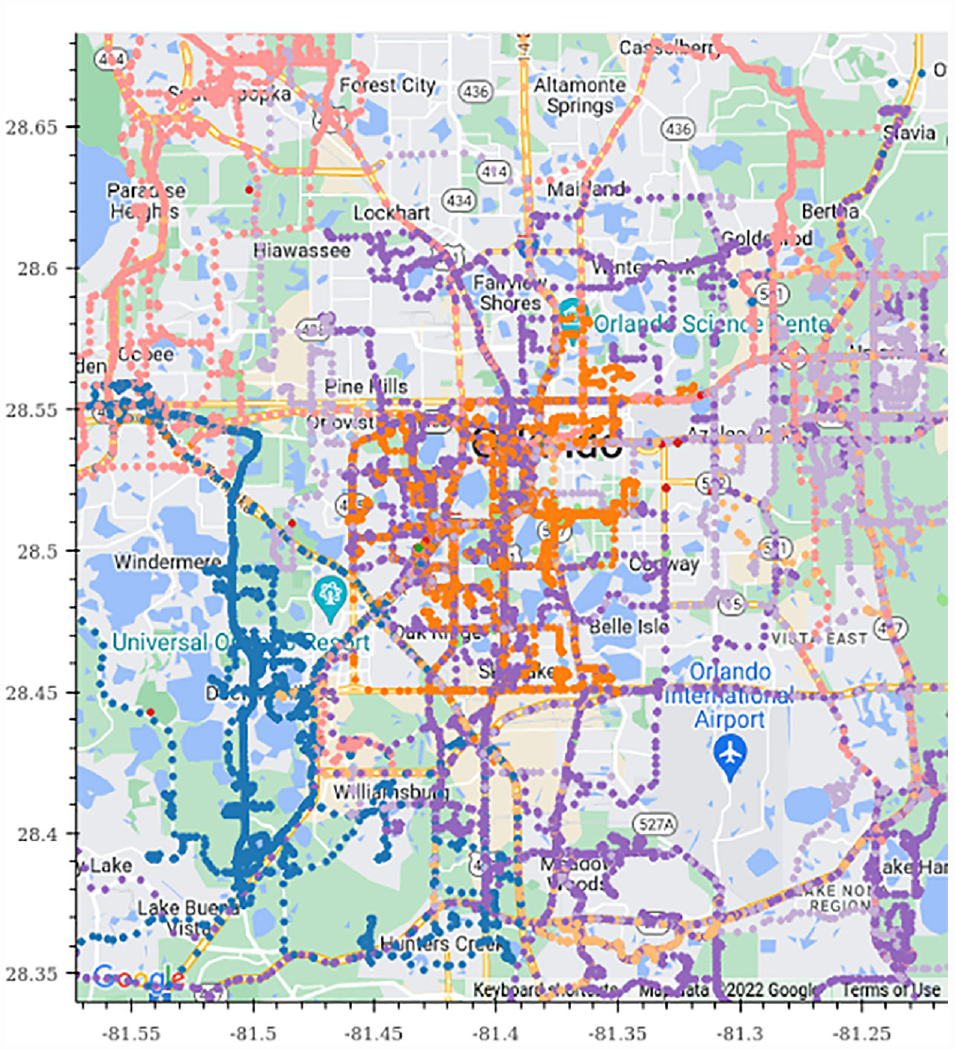
Plot of citywide trips.
The collected variables from videos and GPS trajectories are shown in Figure 3. For each driver, information such as FWD, LAT, and speed is extracted automatically using text detection from the OpenCV package. Driver distraction (eyes off the road) is also detected. The GPS trajectory will mark the start and end of each trip.
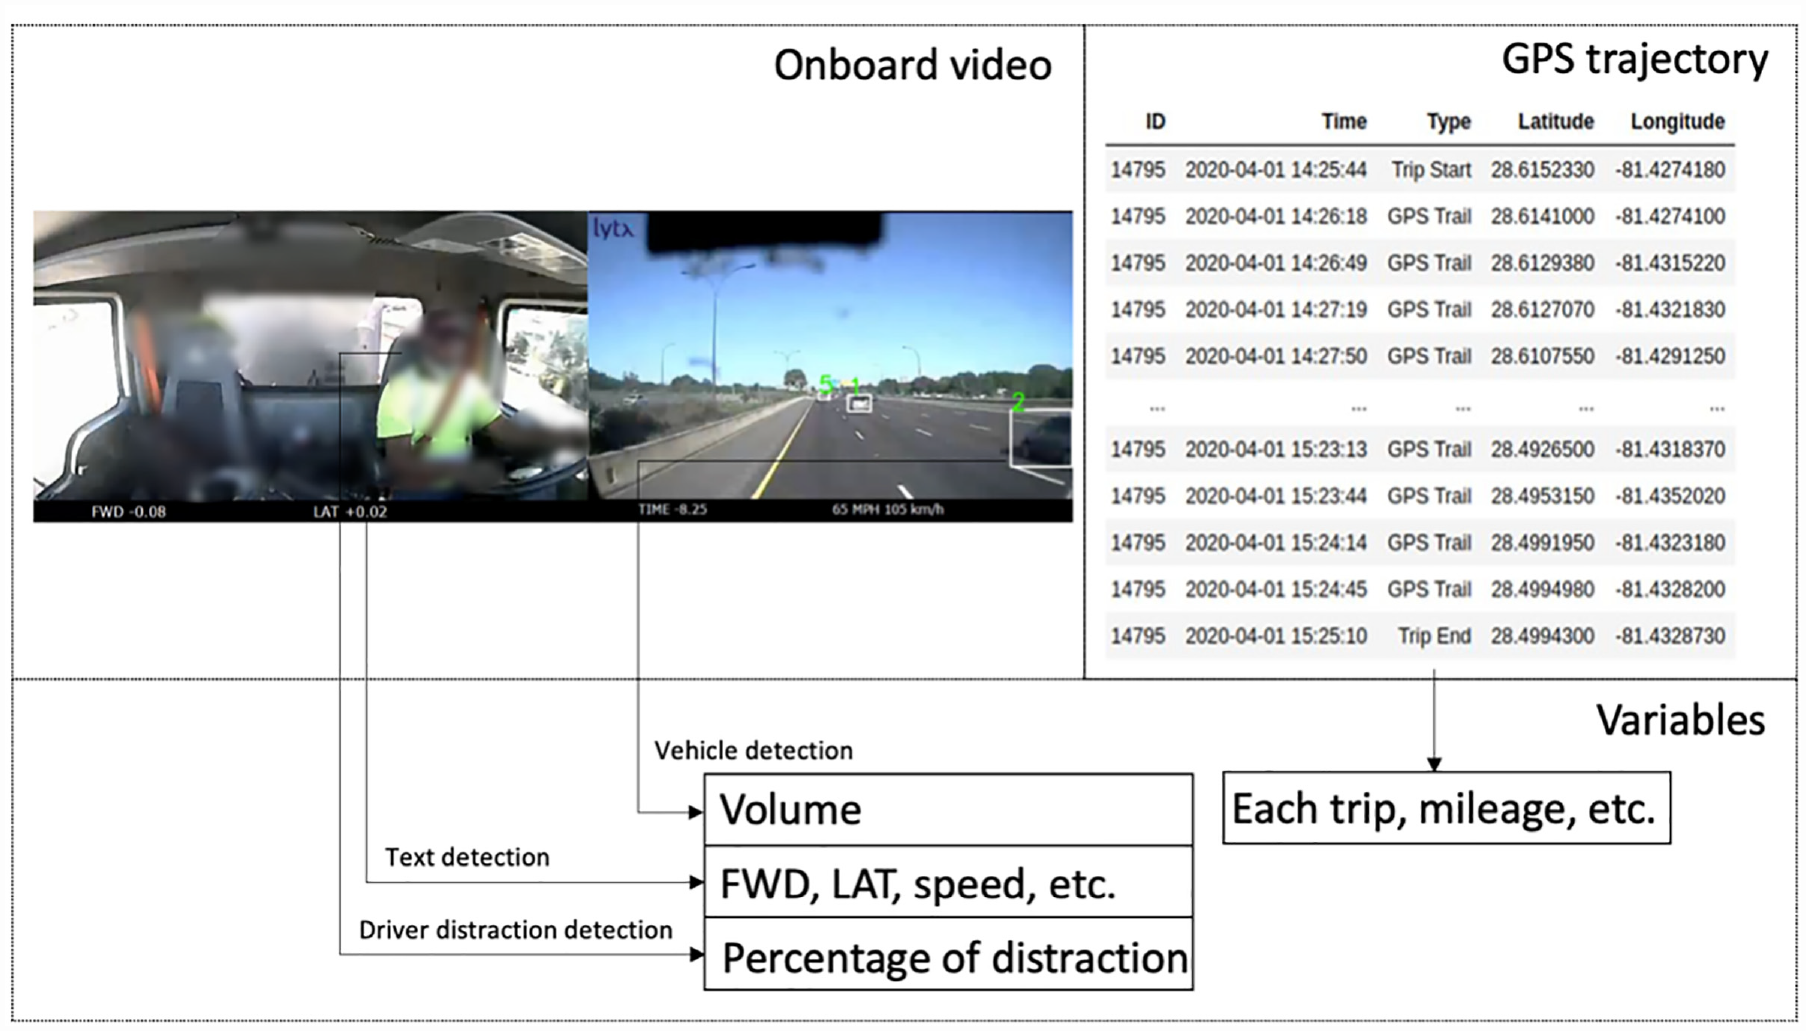
Data collection.
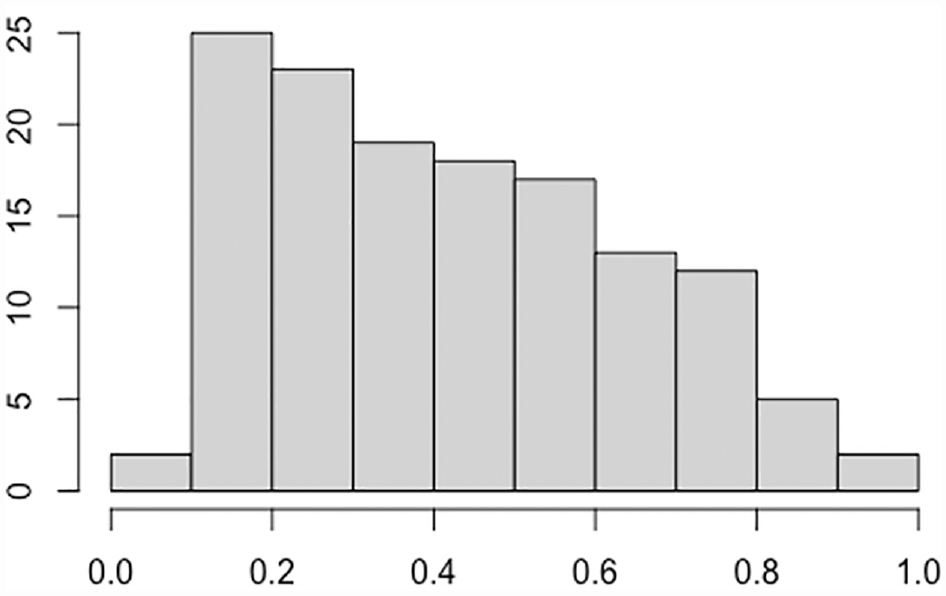
The number of crash and near-crash events per driver ranges from 1 to 10. For each driver, the ratio of the event number and mileage can denote the risk level. Figure 4 shows the distribution of this ratio for all drivers. The blue dotted lines are the 85th percentile and 50th percentile values.
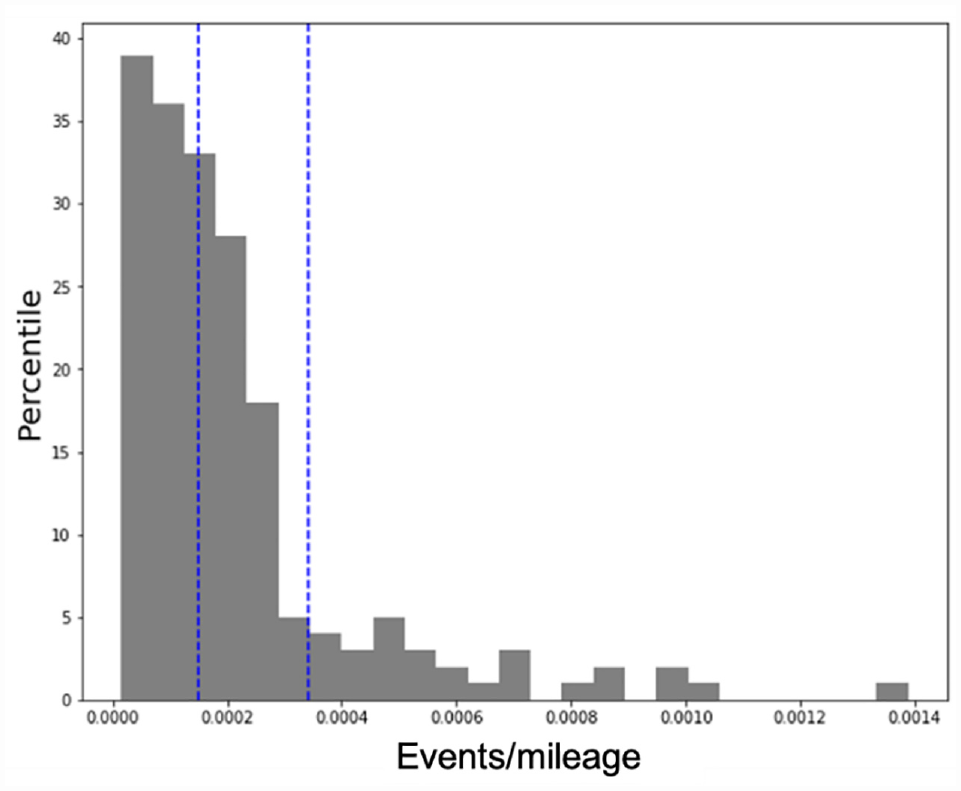
Distribution of drivers’ risk levels.
For the input variables, there are kinematic variables including speed, forward acceleration (when FWD is above 0), braking (when FWD is below 0), lateral acceleration, and so forth. The details of the extracted variables are explained below.
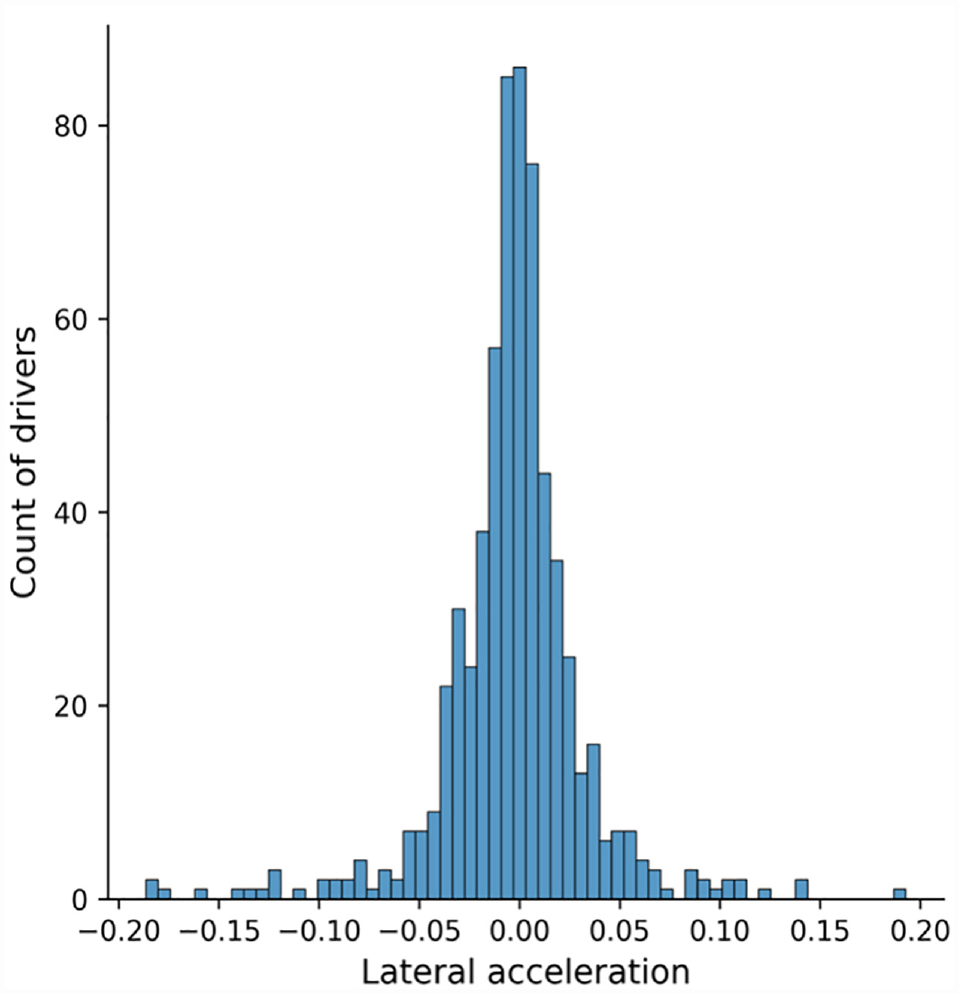
Lateral acceleration distribution.
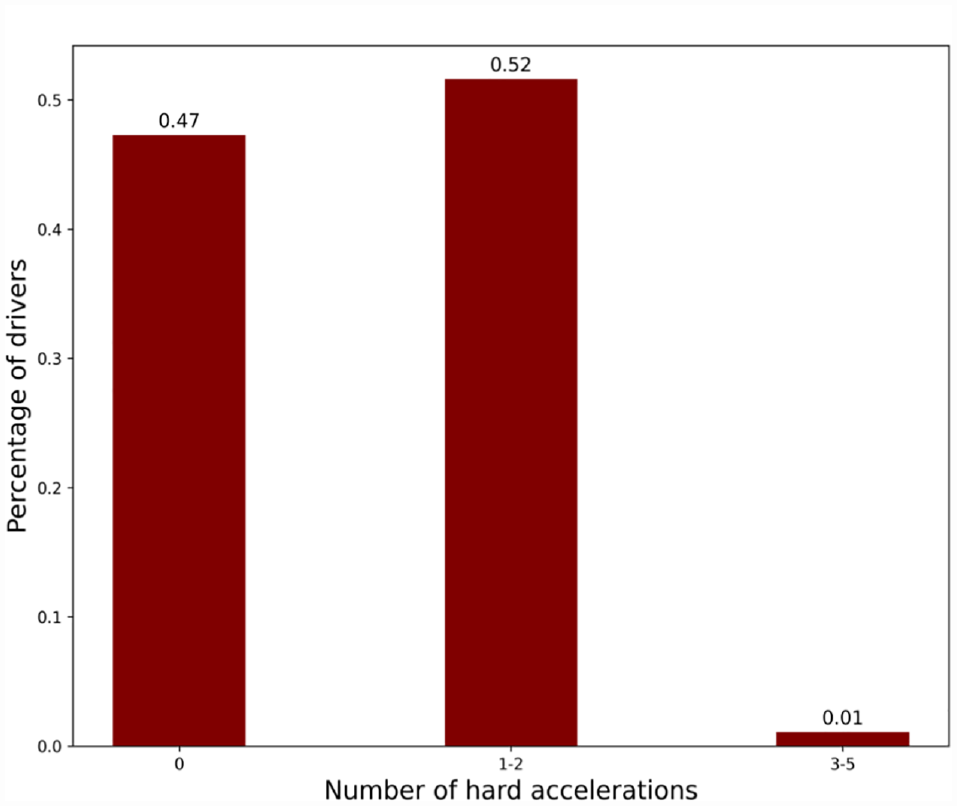
Hard acceleration distribution.
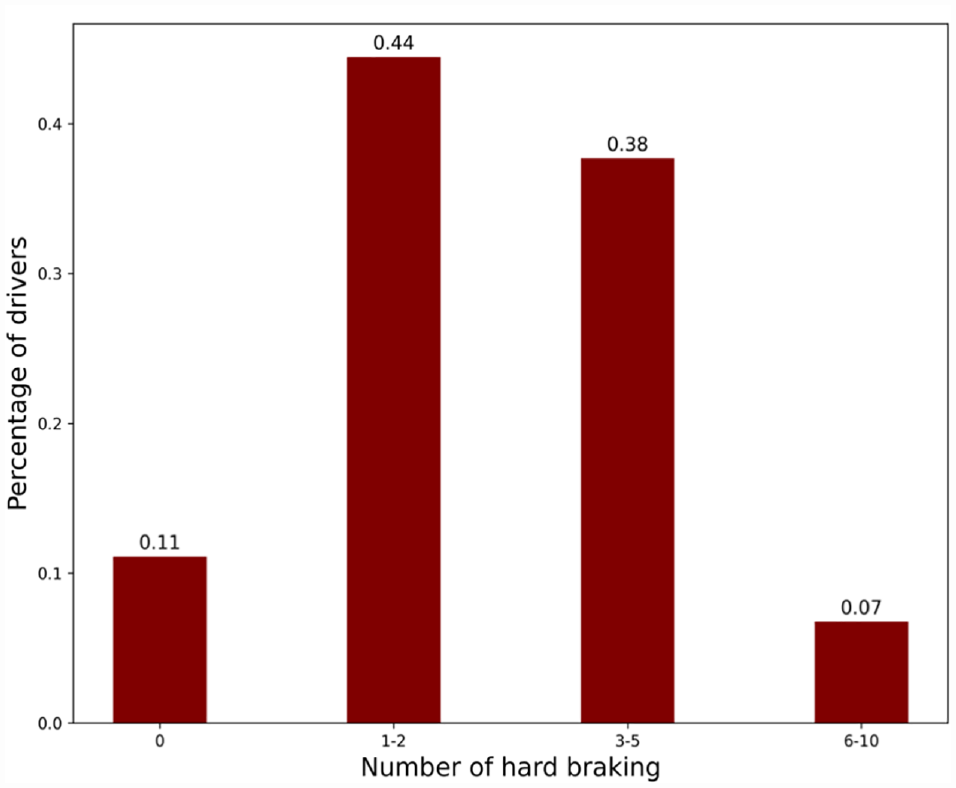
Hard braking distribution.

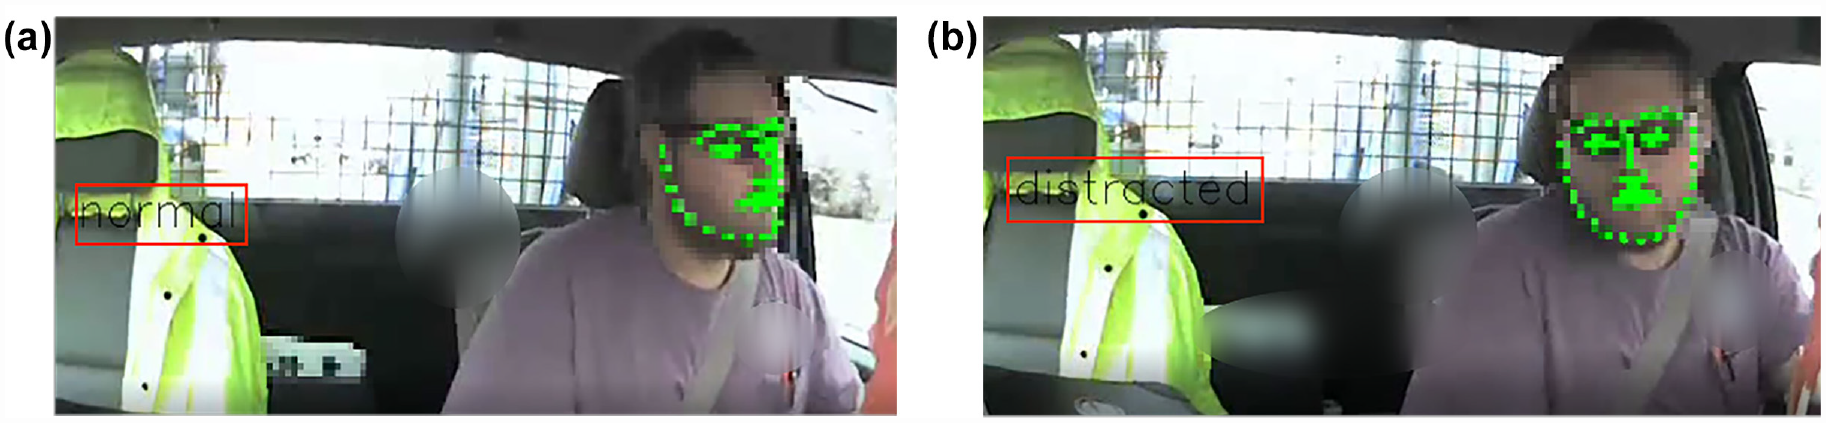
Automated detection of driver’s visual distraction: (a) frame without distraction, and (b) frame with distraction.
Figure 9 shows the analysis of the time percentage of driver distraction. It shows that 22% of the drivers do not have distractions at all, and 52% of the drivers have slight distractions (are distracted up to 25% of the time). Only 2% of drivers are distracted more than 75% of the time. The figure proves that most drivers are distracted before the events happen.

Driver distraction distribution.
The descriptive statistics of the collected variables are shown in Table 2. After checking the Pearson correlations of the quantitative variables (Figure 10), it can be found that the forward acceleration and braking rate have a strong correlation. Thus, the braking rate is removed from the data set.
Collected variables from videos
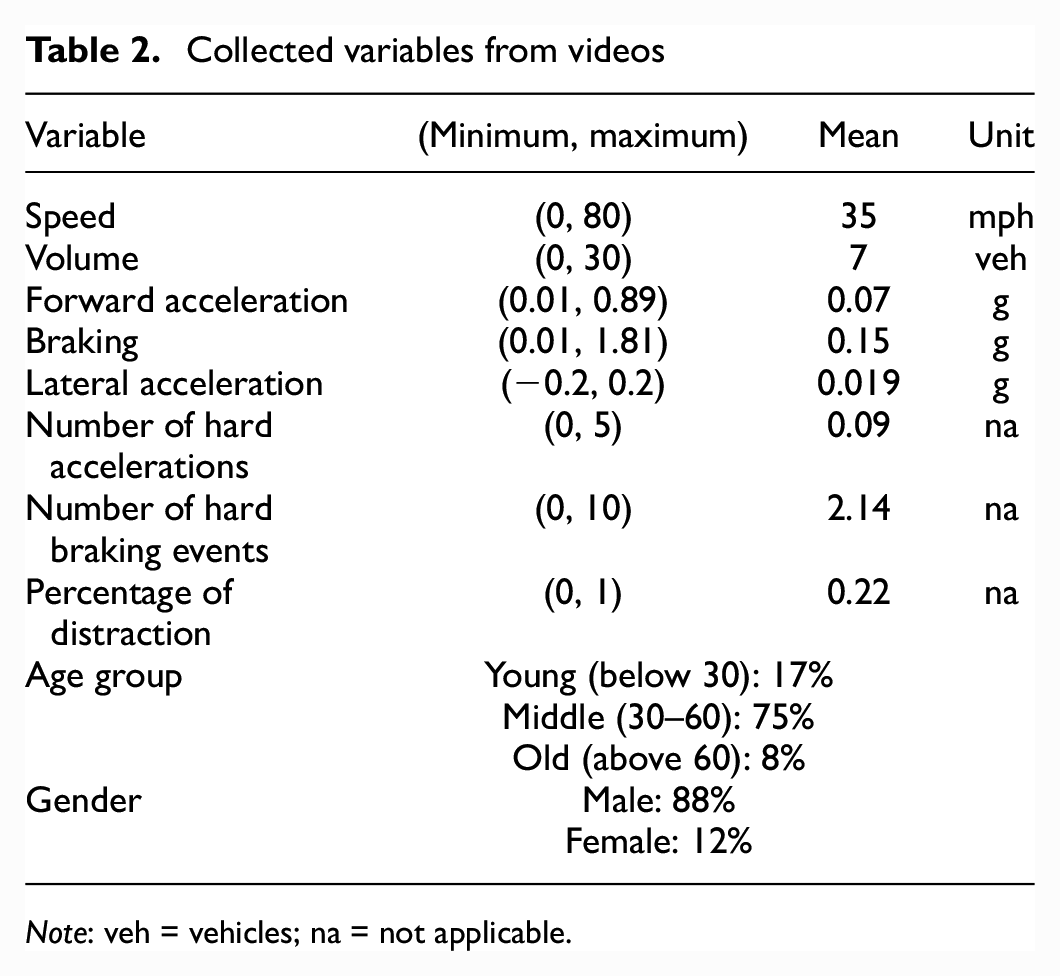
Note: veh = vehicles; na = not applicable.
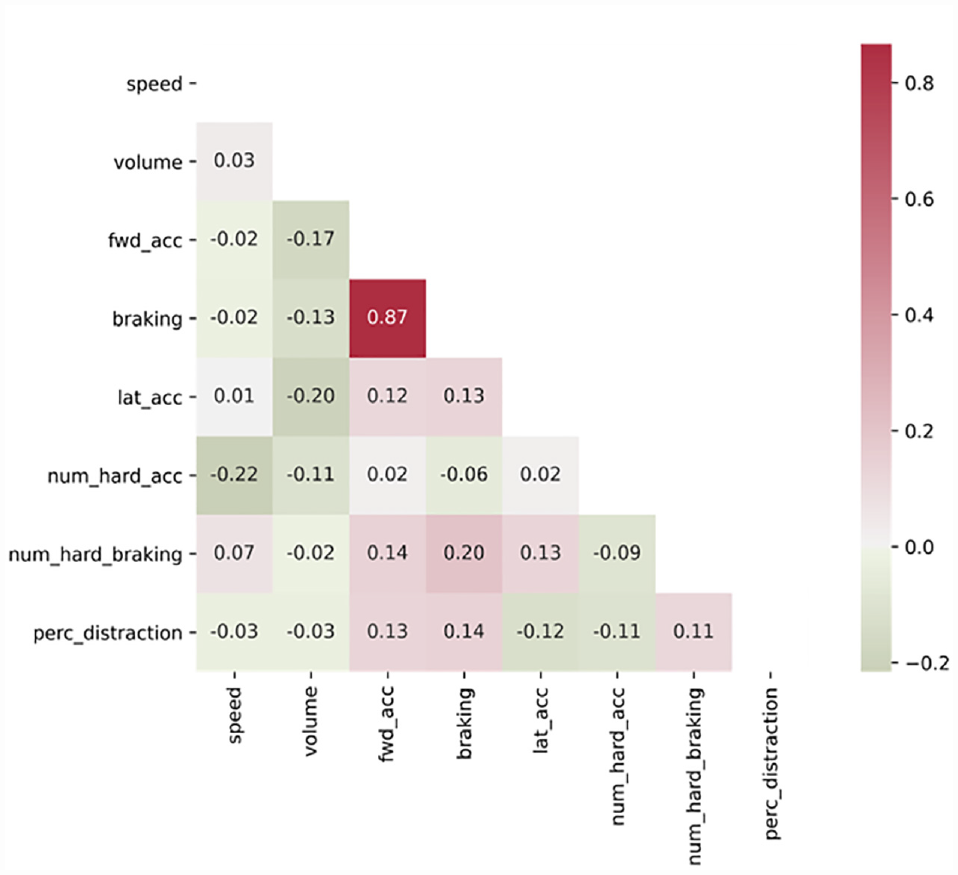
Variable correlation plot.
Methodologies
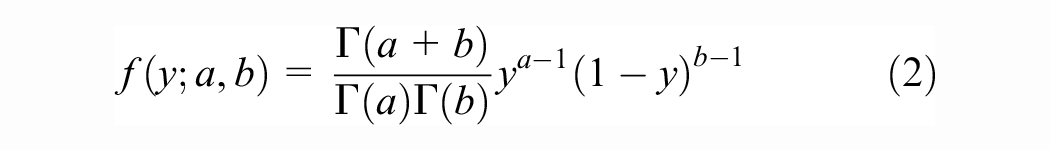
Beta regression was proposed by Ferrari and Cribari-Neto ( 38 ). It models the probability distribution of continuous values between 0 and 1. The model has a density function as shown in Equation 2.
where

where
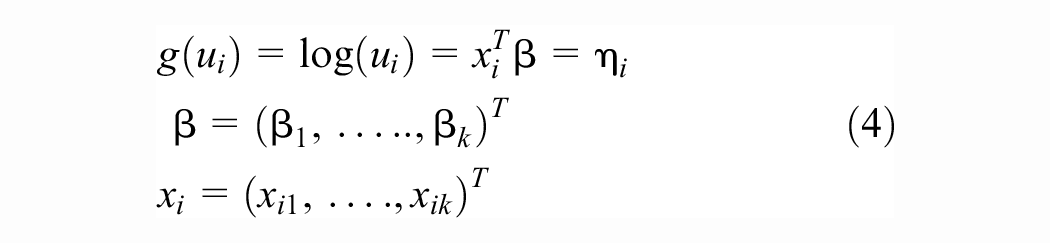
The driver’s risk level is defined as the ratio of the number of events divided by the mileage from each driver, denoted by

After the transformation,
Distribution of the dependent variable.
The modeling result is shown in Table 3. It can be found that the significant variables include forward acceleration, the number of hard accelerations, driver distraction, and age. The forward acceleration has a positive coefficient, which may reveal that the risky drivers accelerate more before the events. The number of hard accelerations instead has a negative coefficient. The percentage of driver distraction is positively correlated with risk level, which is consistent with the existing studies. The driver’s age group has a negative coefficient, which means people are less risky when getting older. The number of hard braking events is not shown in the table as it is not a significant variable. Braking may be a typical evasive maneuver to take before crashes and near-crashes, making it less important in identifying the risky drivers.
Model summary (Beta regression)

Note: AIC = Akaike information criterion.
(significant at the 99% confidence level), *(significant at the 95% confidence level), · (significant at the 90% confidence level).
Conclusion and Discussion
Risky driving can be a major contributing factor in road crashes. In this study, naturalistic driving data are used to identify drivers’ risk levels. The kinematic variables and driver’s characteristics are extracted from event data recorders. A beta regression model is estimated. The modeling results show that the variables acceleration rate, number of hard accelerations, driver distraction, and age are significant. It is found that higher acceleration rate and driver distraction are positively related to driver risk level. Compared with young drivers, older drivers are less risky. The proposed model can be used to investigate pre-crash scenarios, and help with the design of automated vehicles and road infrastructure. For example, more accelerations may lead to critical events. Instead, a smooth driving style is preferred. In addition, the model is easy to implement since most of the variables can be extracted automatically.
The study offers a flexible solution to reveal drivers’ risk levels from naturalistic driving data instead of surveys or questionnaires. Compared with the existing studies, this study uses naturalistic driving data collected over 2 years, from 187 drivers in 131,408 trips and 367 events. The data are collected over a relatively long time period that is enough to reveal drivers’ driving patterns and risk levels. The data are collected from event data recorders installed onboard. The recorders only record data during the occurrence of crashes and near-crashes. The drivers take evasive maneuvers before the events to avoid possible crashes. Thus, variables like the number of hard braking events and the number of hard accelerations are less significant than other variables like driver distraction.
Driver characteristics and driving habits are still playing an important role in risk-level identification. Future work in this study could include attempts to collect more driving-related variables like tailgating, driver demographics, and so forth. The real-time implementation can also be further investigated using the proposed model.
Footnotes
Acknowledgements
The authors would like to acknowledge Lytx® and Orange County for providing the videos.
Author Contributions
The authors confirm contributions to the paper as follows. Experiment design, data collection, analysis, and manuscipt preparation: Shile Zhang, Mohamed Abdel-Aty. All authors reviewed the results and approved the final version of the manuscript.
Declaration of Conflicting Interests
The authors declared no potential conflicts of interest with respect to the research, authorship, and publication of this article.
Funding
The authors received no financial support for the research, authorship, and publication of this article.
All results and opinions are those of the authors.