



Abstract
This paper presents a data-driven approach to address the state of good repair (SGR) in small urban and rural transit systems in the U.S. by predicting the service life of rolling stock vehicles. Achieving and maintaining public transportation rolling stock in SGR is crucial to providing safe and reliable services to riders, particularly for transit agencies utilizing federal grants that mandate asset maintenance at a full level of performance. In this context, an intelligent predictive model is proposed to analyze the transportation rolling stock, determine their backlog and current condition, predict their replacement or rehabilitation needs, and estimate the funding required for future replacements, ensuring SGR. The model utilizes historical data from retired revenue vehicles in the National Transit Database and employs machine learning techniques, specifically random forest regression and gradient boosting regression, to develop the predictive tool. By addressing the backlog of vehicles beyond their service lives and estimating replacement costs, the model provides valuable decision support for effective transit asset management. Transit agencies in small urban and rural transit systems, lacking analytical tools for service life prediction, can greatly benefit from this simple yet powerful predictive model. The approach offers a practical resource to address SGR needs, optimize investment prioritization, and enhance operational efficiency in public transit systems.
Keywords
Public transportation plays a vital role in providing mobility and accessibility while providing transportation alternatives and enhancing quality of life. To maintain an efficient public transportation system, there is a need to keep the existing transit assets in proper condition. Section 5326 of Moving Ahead for Progress in the 21st Century (MAP21) required the U.S. Federal Transit Administration (FTA) to establish a definition for “state of good repair” (SGR) that would have objective standards to measure the condition of various capital assets such as rolling stock, equipment, facilities, and infrastructure condition ( 1 ). The U.S. Department of Transportation (U.S. DOT) defined SGR as “a condition in which the existing physical assets, both individual and as a system, (a) are functioning within their ‘useful lives,’ and (b) are sustained through regular maintenance and replacement program.” SGR does not ensure the growth of service, but provides a solid foundation so that transit agencies are dependable as ridership grows ( 2 ). Achieving and maintaining SGR is essential to enhance passenger safety, increase service reliability, and extend the lifespan of transit assets. However, the challenge of maintaining SGR is particularly pronounced in small urban and rural transit systems, which often face limited financial resources and ongoing replacement and rehabilitation backlog issues compared with their larger counterparts ( 3 ).
Addressing rehabilitation and replacement needs for small urban and rural transit assets in the U.S. poses challenges because of under-investment and the lack of reliable analytical tools for investment decisions ( 1 ). There is a growing concern that a significant portion of rolling stock in these transit systems has exceeded its useful life and requires immediate repair or replacement ( 1 ). Consequently, capital reinvestment becomes essential to maintain revenue vehicles in SGR, ensuring safe and reliable public transportation services ( 1 ). However, transit agencies often face limited resources to predict the outcomes of various funding scenarios, as their current tools lack reliability, hindering accurate projections for replacing revenue vehicles when needed. These limitations impede transit agencies from effectively addressing ongoing replacement and rehabilitation backlog issues when funding falls short ( 4 ).
Machine learning is a rapidly evolving field that incorporates computer algorithms designed to improve automatically through experience ( 5 ). These technologies integrate principles from artificial intelligence, data science, computer science, and statistics. Machine learning algorithms have been extensively developed to address various data and machine learning-related challenges. In recent years, the abundance of data collected through networking and mobile computing systems, known as “big data,” has driven scientists and engineers to employ machine learning for diverse problem-solving tasks. These algorithms effectively learn from extensive datasets and adapt their outputs according to specific business requirements ( 5 ).
In the realm of machine learning, a prominent predictive algorithm is random forest regression (RFR), which belongs to the ensemble methods category ( 6 ). RFR generates predictions by combining individual tree predictions, resulting in more accurate and robust results. Another stage-wise ensemble method is gradient boosting regression (GBR) trees, which sequentially fit weak models to minimize errors on the training set. These weak models, represented as decision trees, collectively contribute to improved predictions in GBR ( 7 ).
In recent years, the increasing availability of data and advancements in machine learning techniques have opened up new avenues for addressing complex challenges in various industries, including transportation ( 8 ). Data-driven approaches offer the potential to revolutionize the way small urban and rural transit systems tackle their SGR issues. By leveraging historical revenue vehicle inventory data, a simple data-driven predictive model can provide valuable insights into the health and remaining service life of transit assets.
In this paper, we propose a data-driven approach that employs the powerful GBR algorithm to predict the service life of rolling stocks in small urban and rural transit systems. By accurately forecasting the service life of rolling stock, transit agencies can proactively plan for replacement activities, reduce backlog, and estimate long-term replacement costs. This predictive model aims to optimize SGR by facilitating informed decision-making and efficient resource allocation.
The paper consists of a comprehensive literature review in the next section, detailing existing studies related to backlog reduction, long-range replacement cost estimation, and remaining useful life (RUL) estimation using machine learning techniques for rolling stock components. In the section after that, we describe the data collection and preprocessing procedures necessary to train the predictive model. The following section outlines our methodology, emphasizing the suitability of RFR and GBR for the predictive task. There is then a section presenting the development of the predictive model for rolling stock service life in, followed by a section giving the results and insights obtained. The penultimate section discusses the limitations and potential avenues for future research. In the final section, we draw conclusions based on our findings and contributions, highlighting the transformative potential of data-driven approaches in achieving and maintaining SGR for small urban and rural transit systems.
Literature Review
FTA established a minimum useful life policy for revenue vehicles funded with federal grants ( 9 ). According to the FTA Grant Management Requirements Circular 5010-1E, “useful life” is defined as the minimum acceptable period for which a capital asset purchased with FTA funds should be used in service. While capital assets purchased with FTA funds may often be used beyond their minimum useful lives, they are not considered part of a grantee’s SGR backlog. For rolling stock, the minimum useful life is calculated based on the date the vehicle is placed in revenue service and continues until it is retired from service. This approach ensures that transit agencies are equipped to maintain their rolling stock fleet in SGR while allowing flexibility for agencies to consider additional factors specific to their operational needs and funding resources. By adhering to these guidelines and considering individual circumstances, transit agencies can make informed decisions about the useful life of their rolling stock and ensure the efficient and reliable operation of their transit systems ( 10 ).
The “Useful Life of Transit Buses and Vans Final Report,” published by the FTA in 2007, assessed the existing minimum service life policy for transit buses and vans ( 9 ). Through economic analysis, the study team found that the optimal replacement points for different bus types were at or later than the FTA’s minimum service life. Additionally, the study revealed that agencies were retiring buses from service at ages that exceeded the FTA’s minimum service life, suggesting the need for a policy change. The report’s insights offer evidence-based guidelines for transit agencies to optimize fleet management and replacement strategies, ensuring efficient operations and maintaining SGR in public transportation systems ( 9 ).
In 2010, the FTA conducted a comprehensive evaluation of the investment required to achieve SGR for all transportation agencies in the U.S. ( 3 ). The study revealed a significant backlog of approximately $77.7 billion in 2009, which would be needed to attain SGR status, along with an additional annual investment of $14.4 billion for normal replacement to maintain SGR. The assessment considered the condition of existing transit assets and found that approximately one-third of the U.S.’s overall transit assets were in marginal or poor condition, nearing or surpassing their expected useful lives ( 3 ). The findings underscore the urgency of reinvestment and maintenance to ensure the long-term sustainability and reliability of the U.S.’s transportation infrastructure.
In a report by Cevallos, a comprehensive evaluation of transit assets’ condition, age, and performance data is presented to achieve and maintain SGR ( 1 ). Federal regulatory agencies require transit agencies to use a data-driven approach for measuring SGR and forecasting reinvestment needs. The report emphasizes the importance of reliable data collection and proactive maintenance strategies for optimizing asset management and reducing long-term replacement costs. By leveraging performance metrics and data-driven approaches, transit agencies can make informed decisions and ensure safe and reliable public transportation services ( 1 ).
Numerous studies have investigated strategies to address the backlog of maintenance and repair tasks in transit systems to attain SGR. One approach is the prioritization of maintenance activities based on criticality and urgency. Dowd et al. proposed a framework integrating various factors, such as asset condition assessment, risk analysis, cost-benefit analysis, and life-cycle considerations, to guide decision-making processes ( 11 ). By combining data-driven approaches and expert knowledge, the framework offers a systematic and informed approach for optimizing maintenance and modernization strategies. Estimating the long-range replacement costs of rolling stock is another crucial aspect of achieving SGR.
Guillot explores long-range transit fleet planning, specifically focusing on defining and costing a replacement-only scenario for Seattle ( 12 ). The study analyzes the financial aspects of replacing the existing transit fleet over an extended period, considering factors such as vehicle lifespan, maintenance requirements, and technological advancements. By examining the financial implications and operational considerations, the study provides insights into the feasibility and effectiveness of adopting a replacement-only approach for transit fleet planning.
Ferroni et al. present a comprehensive study on leveraging data-driven techniques to monitor rolling stock components in the railway industry ( 13 ). By utilizing sensor data and machine learning methods, the research aims to improve predictive maintenance strategies, asset management, and operational efficiency. The paper provides valuable insights into enhancing railway maintenance and reliability through data-driven monitoring approaches.
Yang et al. propose an innovative approach to predict the RUL of industrial equipment ( 14 ). The study utilizes a double-convolutional neural network (CNN) architecture designed to extract and analyze complex patterns from sensor data collected during equipment operation. By training the CNN model on historical data, the authors’ proposed approach accurately predicts the RUL of the equipment, allowing for proactive maintenance planning and minimizing downtime.
Nappi et al. propose an advanced predictive maintenance strategy for rolling stock vehicles in the railway industry ( 15 ). By leveraging real-time data from sensors and using predictive analytics techniques, the approach enables proactive identification of potential failures and maintenance needs. This enhances operational efficiency, reduces downtime, and improves railway maintenance practices, ensuring safe and reliable railway operations.
Yang et al. present a data-driven approach to predict the lifespan of lithium-ion batteries ( 16 ). The study focuses on extracting various features from battery operational data and uses a GBR tree model to make accurate predictions about the batteries’ RUL.
Ay Türe et al. present a comprehensive overview of data-driven techniques used to estimate RUL of milling processes ( 17 ). The study highlights the potential of data-driven approaches for RUL estimation in cutting tools used in milling. The authors explore various algorithms, including statistical methods, machine learning methods, and deep learning methods, for effectively predicting RUL of milling processes.
The current research addresses a significant gap in the existing literature, which lacks a data-driven approach to predicting the service life of rolling stock assets, thus impeding the reduction of SGR backlog and accurate estimation of long-range replacement costs in small urban and rural transit systems. To bridge this gap, the study develops and evaluates a machine learning model using historical data from small urban and rural transit systems. The model serves as a decision support tool for transit agencies, enabling them to prioritize SGR backlog reduction and estimate long-range replacement costs. The outcomes of this research offer potential benefits, enhancing asset management practices, informing decision-making about rolling stock replacement or rehabilitation, and, ultimately, leading to cost savings and improved service reliability for riders in small urban and rural transit systems.
Data Collection and Preprocessing
Sources of Data for Rolling Stock Service Life and Other Relevant Factors
The algorithm development for predicting rolling stock service life relies on two types of data: the target data, which represents the service life to be predicted, and the features used for making the predictions ( 18 ). To prepare the training set for the machine learning model, data from the National Transit Database (NTD) revenue vehicle inventory datasets from 2002 to 2019 was utilized. The NTD compiles data from various transit systems across the country, including those in large urban, small urban, and rural areas. To filter small urban and rural transit system data from the NTD’s revenue vehicle inventory data, we first narrow down the dataset to focus only retired vehicles. We then refine the dataset by removing entries classified under Rural General Public Transit in the Reporting Module column, focusing more on smaller urban areas. Additionally, we exclude data from Full Reporter in the Reporter Type column to eliminate larger, urban transit agencies. This process effectively isolates data pertinent to small urban and rural transit systems, providing a targeted dataset for our specific analysis needs. By focusing exclusively on retired vehicles, the training sample size is established at 12,158 data points, providing ample data to construct the predictive model. This preprocessing step ensures that the algorithm is trained on data solely from retired vehicles, which is crucial for accurately predicting the service life of rolling stock. By excluding active vehicles, the model can focus on learning patterns and factors related to the end-of-life stage, enabling more precise and reliable predictions for the rolling stock service life. Notably, the data extraction process excluded information reported by urban Full Reporters assigned to urban transit systems, allowing the model to focus on relevant data specific to small urban and rural transit systems and improving its performance in predicting rolling stock service life.
Data Preprocessing Techniques
In the data preprocessing phase, we applied a range of comprehensive techniques to refine the dataset, ensuring its quality and appropriateness for the predictive model. This phase was crucial in ensuring the model’s accuracy and effectiveness in analyzing the rolling stock service life.
The first step in our data cleaning process involved identifying and removing data that was either irrelevant or redundant, focusing our dataset on retired vehicles from the NTD. We then turned our attention to addressing the issue of missing data, a common challenge in large datasets. This required a careful evaluation of the significance of missing values in each column, followed by the implementation of appropriate strategies for dealing with these gaps.
For columns with missing Manufacture Year data, our approach was to exclude these rows entirely, as this data was critical for our analysis. In cases where values were missing for Seating Capacity, Standing Capacity, and Vehicle Length, we employed the “fillna” method from Python’s pandas library. This method allowed us to substitute missing values with the mean values of their respective vehicle types, ensuring continuity and accuracy in our data.
Another integral aspect of our data cleaning process was the management of outliers. Outliers can significantly distort results and adversely affect the predictive model’s accuracy. We meticulously identified and eliminated data points that were clear anomalies, such as instances where the Retired Year of a vehicle was earlier than its Manufacture Year, resulting in a negative service life. This anomaly could be attributed to incorrectly reported Manufacture Year by agencies in the NTD database.
A key step in preparing our dataset for machine learning analysis involved the transformation of categorical data. We focused on categorical string columns such as Fuel Type, Vehicle Type, Funding Source, Reporter Type, Reporting Module, Mode, Ownership Type, Type of Service, and Dedicated Fleet. These are actual columns of the revenue vehicle inventory data. To make these categorical variables suitable for analysis, we utilized the “get_dummies” method from Python’s pandas library. This method is crucial for transforming categorical string columns into dummy variables, thereby converting them into a numerical format that is compatible with our predictive model. Such transformation is essential for maintaining the comprehensiveness of our dataset without compromising the integrity of the data.
Feature Engineering to Enhance the Predictive Model
In the pursuit of an accurate and reliable predictive model for rolling stock service life estimation, the study employed meticulous feature engineering to select relevant features that significantly influence the prediction performance ( 19 ). Several key features from the revenue vehicle inventory data were thoughtfully incorporated into the training dataset to capture essential characteristics of the rolling stock. These features include Seating Capacity, Standing Capacity, Vehicle Length, Active Fleet Vehicles, Americans with Disabilities Act Fleet Vehicles, Total Fleet Vehicles, Average Lifetime Miles per Active Vehicle, and Total Miles on Active Vehicles during the Period. These features are crucial in providing valuable insights into the condition and performance of the rolling stock, making them essential for accurate service life predictions.
Following the data cleaning and preprocessing steps, the initial training dataset was formed, consisting of 66 features, with the target column Service Life derived by subtracting the Manufacture Year from the Retired Year. By incorporating these relevant features into the dataset, the study aims to construct a robust foundation for the predictive model. This thoughtful selection and engineering of features contribute to the model’s ability to make precise and dependable predictions about the remaining service life of rolling stock vehicles. Through this comprehensive approach, the study seeks to enhance the performance and effectiveness of the predictive model, providing valuable support to transit agencies in their efforts to optimize asset management and achieve SGR for their rolling stock fleet.
Methodology
Introduction to Random Forest Regression (RFR) and Gradient Boosting Regression (GBR) and its Suitability for the Problem
In this study, we consider two powerful ensemble learning techniques, RFR and GBR, for estimating the RUL of rolling stock components in small urban and rural transit systems. The rationale behind choosing these two models was rooted in their proven effectiveness in handling complex datasets with multiple features, as is typical in transit system analyses. Ensemble learning methods involve combining multiple individual models to enhance predictive accuracy and generalization capability. RFR constructs multiple decision trees and combines their predictions to improve accuracy and robustness ( 19 ). This model was chosen for its ability to handle non-linear relationships and its robustness to overfitting, which is crucial given the diverse and intricate nature of transit data. GBR builds sequential weak learners to iteratively minimize errors and capture complex patterns in the data ( 20 ). This model was selected for its proficiency in minimizing prediction errors and its effectiveness in capturing complex patterns and interactions between variables, which are common in transit system datasets. These techniques are well-suited for handling large datasets and complex relationships, making them suitable for predicting rolling stock service life and optimizing replacement strategies.
Model Implementation and Parameter Tuning
The Python programming language was employed to implement the predictive model. Before feeding the data into the model, various data preprocessing steps were undertaken. New features were generated, missing data were addressed, and outliers were handled to prepare the data for the machine learning algorithm. Two regression algorithms, namely RFR, and GBR, were utilized to develop the machine learning predictive model for this problem ( 21 ).
Hyperparameter tuning is a critical step in optimizing the performance of RFR and GBR models on the retired vehicle training dataset, which contains 12,158 data points. The dataset is split into a training set comprising 70% of the data and a test set containing the remaining 30%, ensuring both model training and evaluation on unseen data.
The tuning process for RFR involved methodically adjusting key parameters such as the number of trees, maximum depth, and minimum samples per leaf. We utilized a grid search approach for this purpose. This systematic exploration of parameter combinations aimed to identify the settings that optimize prediction accuracy and model robustness. The grid search was complemented by cross-validation techniques to verify that the model performs well not only on the training data but also generalizes effectively to new, unseen data.
In the case of GBR, the focus was on fine-tuning parameters such as the learning rate, maximum depth, and minimum samples for splitting. The objective of tuning these parameters was to control the training process and mitigate the risk of overfitting. Employing a grid search methodology, similar to RFR, helped in finding the optimal parameter settings. Cross-validation techniques were also applied here to balance model complexity and prediction accuracy, ensuring that the GBR model is neither underfitted nor overfitted.
By systematically tuning the hyperparameters of both the RFR and GBR models, the research aims to achieve the most accurate and reliable predictions for estimating the RUL of rolling stock vehicles. By carefully calibrating both RFR and GBR models, we enhanced their capability to make precise predictions.
Performance Evaluation Metrics
For performance evaluation, commonly used regression metrics such as mean absolute error (MAE), root mean square error (RMSE), and R-squared (R2) are employed. MAE measures the accuracy of the model’s predictions, and RMSE calculates the measure of the model’s performance. A lower MAE and RMSE indicate better model performance, as they imply smaller prediction errors ( 22 ). R2, also known as the coefficient of determination, assesses how well the model explains the variability in the dependent variable. A higher R2 value closer to 1 signifies a better fit, indicating that the model can explain a larger proportion of the variance in the data ( 23 ).
The models’ predictions on the test set are compared with the corresponding ground truth values, and the performance metrics (MAE, RMSE, R2) are calculated to evaluate the accuracy and reliability of the predictive models in estimating the rolling stock service life. This approach allows for a thorough assessment of the models’ effectiveness and ensures that the models are capable of making accurate predictions on new, unseen data. The selected predictive model with the best performance metrics can then be applied to estimate the projected retirement years of non-retired revenue vehicles, contributing to effective replacement management in small urban and rural transit systems.
Predicting Rolling Stock Service Life
Development of Predictive Model
In this research, our primary focus was to develop a precise predictive model for estimating the service life of rolling stock in small urban and rural transit systems. To achieve this, we harnessed the power of two robust machine learning algorithms, RFR and GBR, well-suited for regression problems. The data underwent meticulous preprocessing, addressing missing values, and converting categorical features into numerical format, as described in earlier sections ( 24 ).
During model development, we utilized common regression model techniques with input hyperparameters and applied Standard Scaler on the training data to ensure feature scaling and enhance model convergence. This approach facilitated the development of a reliable and efficient predictive model capable of accurately estimating the service life of rolling stock in small urban and rural transit systems, supporting effective decision-making in maintaining SGR.
Evaluation of Predictive Model
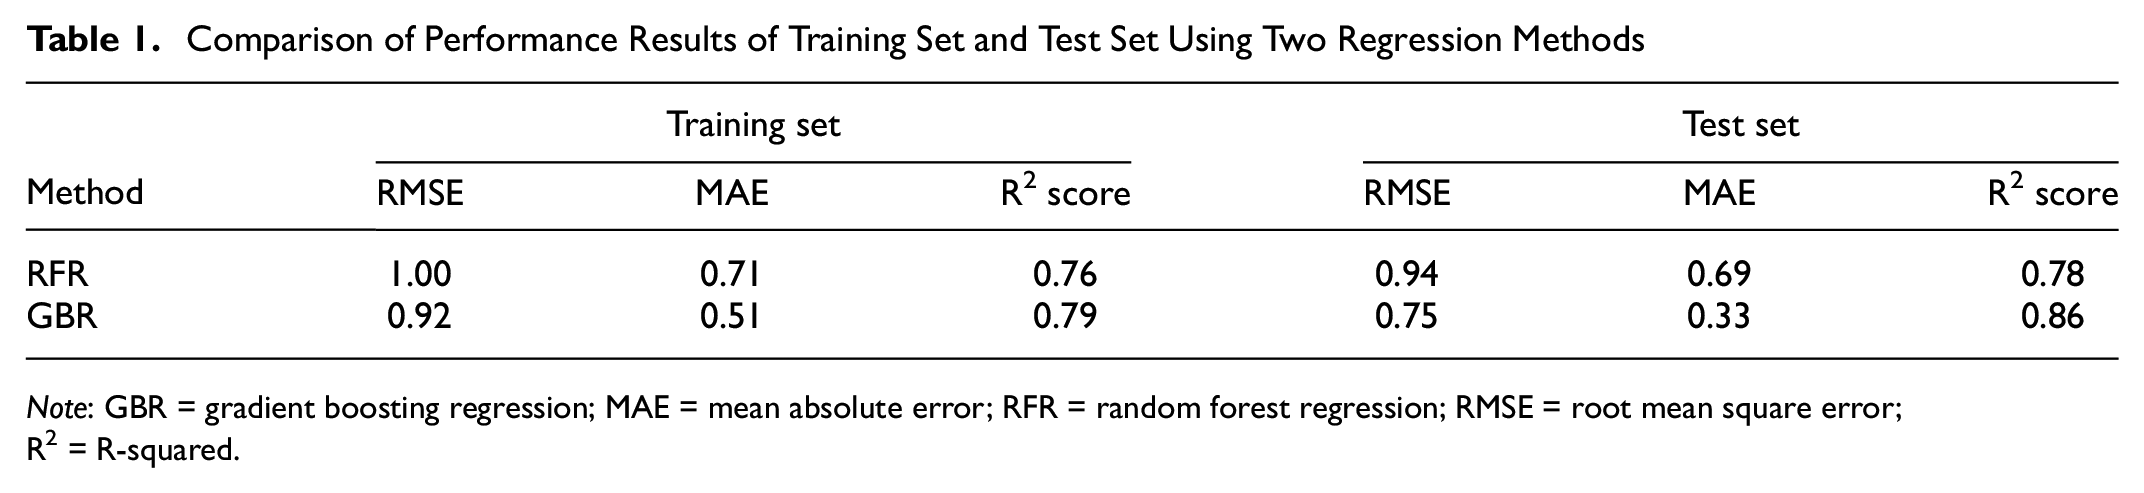
The predictive model’s performance evaluation involved measuring the R2 score, RMSE, and MAE. Both RFR and GBR models were trained and assessed on the training and test datasets. The evaluation process aimed to determine the model that best predicts the service life of rolling stock. The comparison results of the two models are summarized in Table 1. Based on their performance, the superior predictive model was selected for making accurate predictions on new data.
Comparison of Performance Results of Training Set and Test Set Using Two Regression Methods
Note: GBR = gradient boosting regression; MAE = mean absolute error; RFR = random forest regression; RMSE = root mean square error; R2 = R-squared.
From the results, we observe that both models show promising performance in predicting the service life of rolling stock, as indicated by relatively low RMSE and MAE values. However, the GBR model outperforms the RFR model as far as predictive accuracy on both the training and test datasets are concerned. The GBR model achieves lower RMSE and MAE values on the test set, suggesting better generalization and ability to make accurate predictions on unseen data.
Furthermore, the R2 score, which measures the proportion of variance in the target variable that is explained by the model, indicates that the GBR model better captures the underlying patterns in the data, as it achieves higher R2 scores on both the training and test datasets compared with the RFR model.
The evaluation results indicate that the GBR model outperforms other methods in predicting the service life of rolling stock. The GBR model demonstrates superior predictive performance and generalization capability, making it the most appropriate choice for practical applications. Thus, based on the comparison results, the GBR model is recommended as the preferred option for this problem. Nevertheless, continuous monitoring of the model’s performance and potential further improvements are essential to ensure its accuracy and reliability in real-world scenarios.
Development of Deployment Dataset
The revenue vehicle deployment dataset used for model deployment comprises real-time data indicating the operational status of all vehicles. For this study, the most up-to-date data available during model development was sourced from the NTD 2020 revenue vehicle inventory data. This dataset contains nationwide data on rolling stock, which was then tailored to create the deployment dataset specifically for small urban and rural transit systems.
To tailor the dataset, we filtered out urban data by excluding full reporter data based on reporter type, resulting in a deployment dataset containing 19,078 data points, representing revenue vehicles in operation within small urban and rural areas. The primary purpose of creating the deployment dataset was to predict the target feature, that is, the predicted service life.
To ensure seamless compatibility with the machine learning model, the deployment dataset underwent the same data processing steps as the training dataset. Specifically, 66 relevant features were identified and aligned with the target variable to facilitate accurate predictions.
The deployment dataset now stands ready for real-world application, allowing the model to generate service life predictions for revenue vehicles in small urban and rural transit systems. By leveraging the power of machine learning and the comprehensive dataset, this predictive model contributes to informed decision-making and optimal resource management, ultimately supporting SGR for transit systems.
Results and Discussion
State of Good Repair (SGR) Vehicle Backlog and Replacement Reports
In this research, the authors applied their predictive model to analyze the 2020 revenue vehicle data of small urban and rural transit agencies nationwide. By calculating the service life of each vehicle and predicting their retirement year for replacement, the study identified a subset of vehicles that were predicted to be retired by 2021, referred to as the “backlog.” Specifically, a total of 8,058 out of 19,078 revenue vehicles were projected to have reached or surpassed their retirement benchmark, indicating a need for replacement to bring the revenue vehicles into SGR. The high number of vehicles projected to have reached or exceeded their service life can be attributed to several factors within the transit systems. These include the presence of aging fleets that have been in service for an extended period, limited budgets that delay timely replacements, resource allocation decisions that prioritize other aspects of operations, and, sometimes, the acquisition of new vehicles without a corresponding increase in the rate of retirements. Moreover, concerns related to the inability to receive vehicles, because of manufacturing or logistical issues, can further complicate the management of rolling stock service life and add to the complexities transit agencies face in maintaining SGR. This backlog is represented by the red bar in Figure 1.
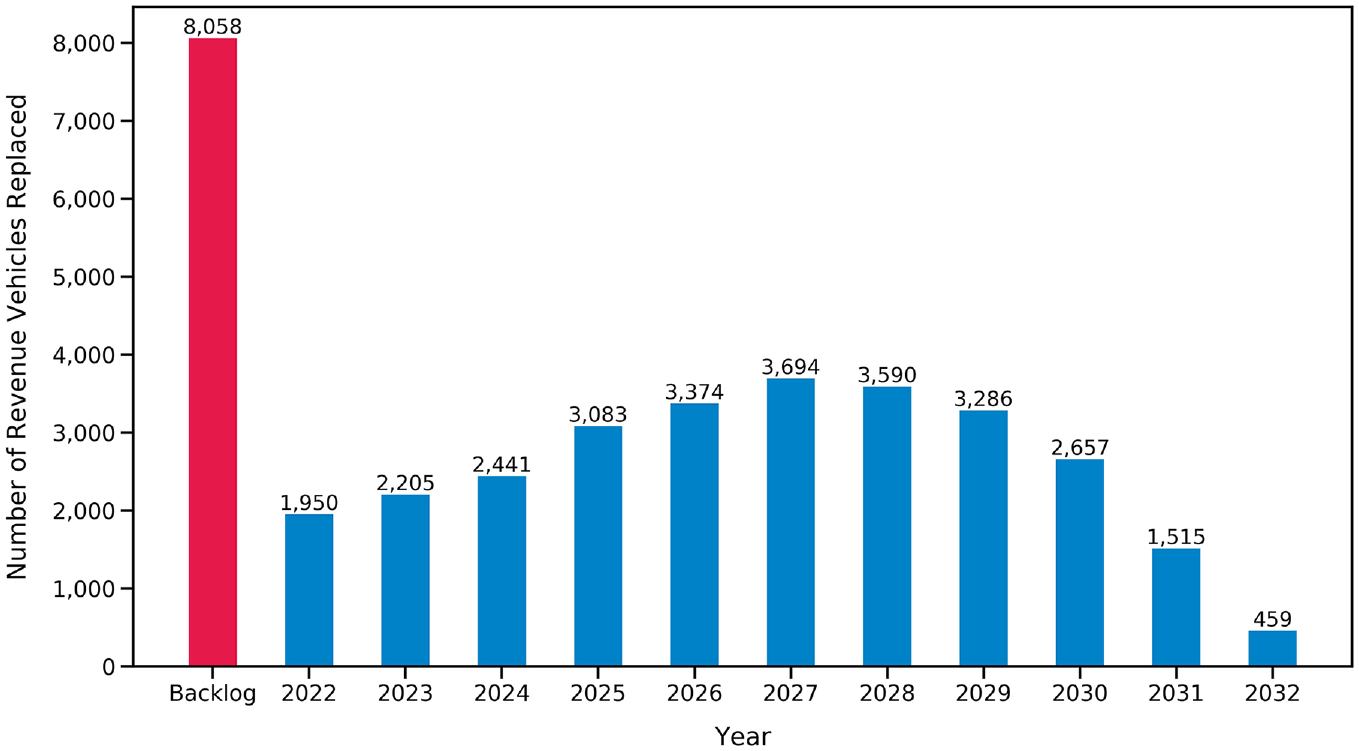
Backlog and predicted year of retirement for revenue vehicles in small urban and rural transit systems.
To address the backlog, the authors devised an 11-year long-range replacement plan spanning from 2022 to 2032. The plan assumes that transit agencies will maintain their current fleets and replace retired vehicles with an equal number of new vehicles. Given that some vehicles have relatively short service lives and may be replaced two or three times during the 11-year plan, the authors generated new predicted replacement years accordingly. It is worth noting that this 11-year plan can be extended beyond its current scope, accommodating transit agencies’ preferences for an even longer-term replacement planning, as required. The number of vehicles projected to be replaced in each year of the long-range plan are as follows: 1,950 in 2022; 2,205 in 2023; 2,441 in 2024; 3,083 in 2025; 3,374 in 2026; 3,694 in 2027; 3,590 in 2028; 3,286 in 2029; 2,657 in 2030; 1,515 in 2031; and 459 in 2032, as shown in Figure 1.
By implementing this 11-year long-range replacement plan based on the predictive model’s recommendations, transit agencies can effectively manage the backlog and ensure that revenue vehicles are maintained in SGR. The approach provides valuable insights into optimizing replacement strategies and enhancing the overall reliability and performance of rolling stock in small urban and rural transit systems.
Backlog and Long-Range Replacement Cost Estimation
The replacement costs of revenue vehicles were determined using data from the American Public Transportation Association (APTA)’s Public Transportation Vehicle Database, which provides information on fleet characteristics—such as the date of manufacture, manufacturer, model, length, and equipment—for transit agencies in the U.S. and Canada. To estimate the current replacement costs, we considered the minimum fleet costs. Subsequently, the calculated replacement costs were adjusted to their present value in 2022 using the Historical Consumer Price Index for All Urban Consumers as the annual inflation rate.
For the backlog vehicles, the replacement costs were computed by considering the vehicles predicted to be retired before 2022. The backlog cost for small urban and rural transit systems amounted to $1,583 million, representing the funding required to achieve SGR.
Moreover, an 11-year long-range replacement plan was developed for small urban and rural transit systems. The costs for vehicle replacement in each year from 2022 to 2032 were estimated as follows: $255 million in 2022; $282 million in 2023; $290 million in 2024; $359 million in 2025; $364 million in 2026; $439 million in 2027; $417 million in 2028; $447 million in 2029; $343 million in 2030; $219 million in 2031; and $50 million in 2032.
Figure 2 provides a visual representation of the backlog for small urban and rural transit systems, along with the subsequent replacement costs for maintaining SGR in each year. By considering these replacement cost estimates, transit agencies can effectively allocate funds and develop sustainable financial strategies to ensure the smooth functioning and optimal performance of their rolling stock.

Backlog and predicted replacement cost of revenue vehicles in small urban and rural transit systems.
SGR Backlog Analysis by Vehicle Type
The SGR backlog analysis for small urban and rural transit systems involved calculating the number of backlog vehicles and their respective replacement costs based on projected retirements before 2022. The analysis further categorized the backlog into four main vehicle types: buses, cutaways, minivans, and vans. Figure 3 illustrates the number of backlog vehicles for each category, with 1,811 buses, 3,942 cutaways, 1,080 minivans, and 796 vans that have exceeded their useful lives and require replacement to achieve SGR.

Revenue vehicle backlog by vehicle type in small urban and rural transit systems.
Similarly, Figure 4 provides an overview of the replacement costs for the identified backlog vehicles. The funding required for replacing the 1,811 buses amounts to nearly $631 million, followed by $390 million for the 3,942 cutaways, $36 million for the 1,080 minivans, and $43 million for the 796 vans. These estimated replacement costs demonstrate the financial commitment needed to address the backlog for each vehicle type and maintain the rolling stock fleet SGR.

Funding needed for backlog vehicles by vehicle type in small urban and rural transit systems.
By understanding the magnitude of the backlog and the associated replacement costs for each vehicle type, transit agencies can prioritize and allocate resources effectively to ensure timely replacements, enhance operational efficiency, and achieve SGR for their small urban and rural transit systems. These insights provide valuable guidance for implementing data-driven maintenance strategies and optimizing asset management practices.
Limitations/Further Research
While this research successfully applied RFR and GBR to predict the service life of rolling stock in small urban and rural transit systems, the predictive model’s performance could be further enhanced by exploring other machine learning algorithms. Consideration of additional algorithms such as support vector regression, neural networks, or XGBoost could lead to improved predictive accuracy and better generalization capabilities. Incorporating a variety of algorithms in the model development process could provide a comprehensive comparison and enable the selection of the most suitable algorithm for this specific problem.
Although this study focused on utilizing revenue vehicle inventory data to address the SGR problem, future research could benefit from incorporating additional relevant data sources to enhance the predictive model’s accuracy. Supplementing the training set with data from other maintenance records, historical incident reports, or real-time sensor data could provide valuable insights into the rolling stock’s health and performance, further optimizing predictive maintenance strategies.
Furthermore, to ensure the model’s ongoing relevance and accuracy, it is essential to continually update the training data. Since the model was developed using 2020 revenue vehicle inventory data, incorporating the most up-to-date data into future models would result in more accurate predictions and better reflect the current state of the rolling stock fleet.
It is worth noting that, although the predictive tool demonstrates strong performance in estimating an agency’s revenue vehicle service life, certain practical considerations should be considered. Agencies may choose not to retire vehicles solely based on predictive results, as other factors such as the vehicles’ actual condition and performance may influence their retirement decisions. Safety risks associated with prolonged vehicle service life, as predicted by the predictive model, should also be carefully considered by transit agencies ( 25 ).
One limitation of this paper is that the authors focused solely on small urban and rural public transit systems, which may restrict the generalizability of the findings to larger national public transit networks. However, the data-driven approach and predictive model developed in this research can serve as a valuable foundation for extending the analysis to encompass all national public transit systems. By incorporating data from larger transit networks, the predictive model’s applicability and effectiveness could be further evaluated and enhanced, ultimately benefiting a broader range of transit agencies in their efforts to achieve and maintain SGR.
Given the relatively novel application of machine learning algorithms in addressing the SGR problem, this research paves the way for further exploration and opportunities for future studies. The potential of machine learning in developing advanced tools and applications for efficiently prioritizing investments and maintaining rolling stocks in SGR presents a promising avenue for future research in the transportation industry. The continuous advancement in machine learning techniques and the integration of new data sources hold great potential for further analysis and innovative solutions in the pursuit of optimal asset management and enhanced transit system reliability.
Conclusion
In conclusion, this paper presents a robust data-driven approach to address SGR in small urban and rural transit systems by predicting the service life of rolling stock vehicles. Leveraging the GBR machine learning technique, we successfully developed a predictive model to predict the service life of vehicles. Consequently, this model empowers transit agencies to conduct in-depth analyses and prioritize their SGR investments more effectively. By utilizing this model, transit agencies in small urban and rural locations can optimize transit asset management, maximize revenue vehicle service life, and minimize long-term replacement costs, thereby contributing to the achievement and maintenance of SGR. Furthermore, U.S. DOT, state DOTs, and decision-makers can utilize this model to assess the overall condition of revenue vehicles in transit agencies at both state and national levels, encompassing small urban and rural areas. This information can be used to better understand the funding needs for transit vehicle replacements and SGR initiatives.
The implementation of the predictive model provides valuable insights into efficient asset management, enabling transit agencies to proactively plan and allocate resources for timely replacements. Our results demonstrate the model’s effectiveness in backlog reduction and long-range replacement cost estimation, making it a valuable decision support tool to enhance operational efficiency and service reliability. Compared with relying solely on standard useful life policies, our data-driven approach offers a more tailored and informed decision-making process for capital investments, potentially aligning capital-funding needs more effectively with available resources.
While our approach shows promising results, we acknowledge some limitations, such as using only two regression algorithms, and the possibility of further enhancement with additional machine learning techniques. Future research could explore diverse data sources and continuous updates to enhance model accuracy and relevance. Nonetheless, our research provides practical solutions to address the challenge of achieving and maintaining SGR, offering valuable resources for small urban and rural transit systems to make informed decisions and optimize investments for their rolling stock fleet.
Additionally, we have developed a dedicated web tool for transit SGR, accessible at https://sgr.ugpti.org/, which is specifically designed for the unique needs of small urban and rural transit systems. It is pertinent to mention that the SGR reports in our research might not exactly match the reports produced by this web application, because of its frequent updates with the latest data from NTD. This application provides easy-to-navigate visual representations of transit SGR, including vehicle backlog, enabling effective prioritization of backlog, and facilitating the development of long-range replacement strategies.
Ultimately, the integration of machine learning in SGR analysis opens new possibilities for advancing predictive replacement strategies and contributing to the evolution of efficient and sustainable transportation networks. As technology continues to evolve, we anticipate that data-driven approaches will play a crucial role in shaping the future of transit asset management, ensuring safe and reliable services for passengers in small urban and rural transit systems. In conclusion, our research offers practical solutions and data-driven insights to enhance transit SGR and support the continual improvement of small urban and rural transit operations.
Footnotes
Acknowledgements
The Small Urban and Rural Center on Mobility (SURCOM) within the Upper Great Plains Transportation Institute at North Dakota State University conducted the research.
Author Contributions
The authors confirm contribution to the paper as follows: study conception and design: Dilip Mistry; data collection: Dilip Mistry; analysis and interpretation of results: Dilip Mistry; draft manuscript preparation: Dilip Mistry, Jill Hough. All authors reviewed the results and approved the final version of the manuscript.
Declaration of Conflicting Interests
The author(s) declared no potential conflicts of interest with respect to the research, authorship, and/or publication of this article.
Funding
The author(s) disclosed receipt of the following financial support for the research, authorship, and/or publication of this article: Funds for this study were provided by the Small Urban, Rural, Tribal Center On Mobility (SURTCOM), a partnership between the Western Transportation Institute at Montana State University and the Upper Great Plains Transportation Institute at North Dakota State University. The Center is funded through the U.S. Department of Transportation’s Office of the Assistant Secretary of Research and Technology as a University Transportation Center.
Data Accessibility Statement
The data that support the findings of this research are available in the National Transit Database (NTD) data at https://www.transit.dot.gov/ntd/ntd-data and the American Public Transportation Association (APTA)’s Public Transportation Vehicle Database at  .
.