
Abstract
Bridge deck deterioration poses a critical threat to structural safety and public transportation systems, necessitating scalable and objective inspection methods. This study presents a lightweight, unsupervised anomaly detection framework that leverages unmanned aerial vehicle (UAV)-acquired imagery and sparse autoencoders to evaluate bridge deck surface conditions without requiring labeled training data. High-resolution images captured using a UAV were divided into 64 × 64 patches and processed through a sparse autoencoder trained solely on healthy concrete patches to learn a compact representation of normal surface texture. During testing, reconstruction error was computed for each patch, with elevated errors indicating potential anomalies such as cracks, delamination, or staining. These error values were visualized through heatmaps and aggregated across all patches to derive three condition quantification metrics: average reconstruction error, anomalous area percentage, and normalized severity score. A novel classification scheme empirically mapped these metrics to National Bridge Inventory (NBI) deck condition ratings, offering an interpretable, standardized evaluation of bridge decks. To analyze the model’s robustness and threshold sensitivity, experiments were conducted on eight bridges, showing high agreement with NBI deck condition ratings, achieving up to 87.5% rating classification accuracy. Moreover, threshold sensitivity analysis revealed how rating transitions occur across scoring levels, further highlighting the model’s adaptability. Overall, the proposed approach enables efficient, interpretable, and defect-annotation-free bridge condition assessments, aligning with federal standards while significantly reducing the labor requirements, subjectivity, and data annotation burdens of traditional inspections. It represents a promising step toward scalable, automated infrastructure health monitoring using autonomous aerial systems.
Keywords
Introduction
The structural integrity of bridges is critical to the safety and resilience of transportation infrastructure. In the United States in 2025, of approximately 623,000 bridges, 6.8% were rated in poor condition, and nearly half were in fair condition ( 1 ). Among the various components of a bridge, the deck is particularly susceptible to deterioration because of direct exposure to traffic loads, weathering, and deicing chemicals. Consequently, deck inspection plays a pivotal role in determining overall bridge health. The U.S. Department of Transportation (U.S. DOT) mandates routine inspections at intervals not exceeding 24 months, and these assessments rely heavily on visual evaluations performed by certified inspectors. Although this process has been institutionalized through the National Bridge Inspection Standards (NBIS) and National Bridge Inventory (NBI) rating scale (ranging from 0 to 9), it remains subjective, labor-intensive, and prone to inconsistencies across different inspectors and agencies ( 2 , 3 ).
To address these limitations, recent advances have explored the use of unmanned aerial vehicles (UAVs) for remote bridge inspection ( 4 , 5 ). UAVs provide rapid access to hard-to-reach areas, reduce inspection time, and allow for high-resolution imagery of the bridge. However, since UAV missions can generate thousands of images per bridge, far exceeding what human inspectors can analyze in a timely manner, the full potential of UAV-based inspection can only be realized when coupled with automated and intelligent data analysis techniques ( 6 , 7 ).
Recent efforts have focused on integrating UAV-acquired imagery with artificial intelligence (AI) and machine learning models to automate damage detection, reducing dependency on manual interpretation ( 8 – 10 ). However, most of these systems rely on supervised learning models, which require extensive labeled datasets that are often costly and time-consuming to generate. In supervised approaches, deep convolutional neural networks (CNNs) have been widely used for tasks such as crack detection, delamination identification, and defect segmentation ( 11 ). Additionally, region-based convolutional methods (e.g., Faster R-CNN and YOLO) have achieved high accuracy in localizing bridge surface damage ( 12 , 13 ). However, these models depend heavily on large, well-annotated training datasets, which are challenging to produce at scale in the bridge inspection domain. Furthermore, a limitation of supervised models is that they often lack generalizability across bridges with varying textures, lighting conditions, or environmental factors unless extensively fine-tuned ( 14 ).
To overcome the dependence on damage labels, researchers are increasingly turning to unsupervised anomaly detection techniques for structural inspections ( 15 , 16 ). Instead of learning from pre-labeled defective examples, these methods learn the distribution of normal, pristine infrastructure imagery and flag deviations as potential anomalies. Autoencoders have become a popular backbone in such approaches because of their ability to learn compact representations of input images. Trained only on undamaged portions of surface images, an autoencoder can reconstruct normal patches with low error, but will struggle to accurately reconstruct images containing damage, resulting in a higher reconstruction error. This reconstruction error thus serves as an anomaly indicator ( 17 ). Sparse autoencoders, which impose sparsity on the latent representation, have been shown to improve generalization by capturing the most essential features of the undamaged surface ( 18 ). Resende et al. demonstrated the potential of sparse autoencoders for structural health monitoring (SHM) systems by using autoencoders as feature extractors of the dynamic vibration signals collected from a bridge before and after the structure was damaged ( 19 ). In another study, Sakurada and Yairi ( 17 ) demonstrated the effectiveness of sparse autoencoders in detecting anomalies in sensory data without requiring labeled anomalies during training. Teng et al. trained an autoencoder as the reconstruction algorithm for real-time bridge vibration signals to detect abnormalities and validated their method on a cable-stayed bridge ( 20 ).
Despite these advancements, current studies in this area have focused mainly on pixel-level or patch-level defect identification and have not yet translated these anomaly detections into an integrated condition assessment framework useful for bridge management. Additionally, while autoencoder-based anomaly detection has been widely explored in domains such as industrial inspection, cybersecurity, and medical imaging, its application to bridge inspection remains limited. Conventional methods such as principal component analysis, support vector machines, and Kalman filters have demonstrated potential for anomaly detection in SHM ( 21 – 23 ). However, these approaches often assume linear system dynamics or rely on temporal sensor data rather than spatial imagery, making them less effective for visual damage detection in heterogeneous concrete textures.
Another key gap in the state of the art is connecting automated defect detection to the well-established condition rating frameworks used in bridge management. Bridge agencies require results that align with the NBI or the newer element-level ratings in the AASHTO Manual for Bridge Element Inspection. Some research efforts have begun to address this integration. For example, Zhang et al. developed a machine learning workflow for condition state assessment of cracking in reinforced concrete bridge deck elements, but their study was limited to evaluating the condition state of cracks according to Federal Highway Administration (FHWA) specifications ( 9 ). These emerging studies underscore the importance of aligning automated inspection outputs with standard condition ratings ( 24 ).
Furthermore, a substantial body of research leverages NBI inspection records and bridge inventory attributes for condition modeling, deterioration prediction, and network-level decision support ( 25 ). These studies are valuable for asset management but typically operate on tabular inspection history rather than deriving condition evidence directly from imagery ( 26 ). In contrast, UAV vision-based inspection seeks to infer surface-level condition cues from visual data, which can complement NBI-based models by providing rapid, localized evidence of distress. To the best of our knowledge, no prior work has combined an unsupervised, label-free defect detection approach with the capability to produce an overall bridge deck condition rating compatible with NBI ratings. This remains an open challenge in infrastructure AI: bridging the gap between raw anomaly signals in images and the high-level condition indices used for decision-making in bridge management systems.
This study addresses the aforementioned gaps by presenting an unsupervised, patch-based anomaly detection framework that not only identifies localized anomalies from UAV imagery using a lightweight sparse autoencoder but also aggregates results across multiple images to estimate an overall bridge deck condition rating in line with NBI standards. The proposed unsupervised anomaly detection framework is specifically designed to identify surface-level visual anomalies on concrete bridge decks, including cracks, spalling, efflorescence, discoloration or staining, visible signs of delamination, and localized material loss or erosion. The key novelty lies in translating pixel-level reconstruction errors into patch-wise anomaly scores and then synthesizing them across the bridge to compute metrics such as average reconstruction error, percentage of anomalous area, and a normalized severity score. These metrics are then mapped to the NBI scale based on defined thresholds, enabling objective, data-driven evaluation of bridge decks without defect labels or manual intervention. The novelty lies not only in the use of unsupervised autoencoders alone, but also in the proposed metric aggregation and NBI-aligned translation layer that converts patch-level anomaly evidence into an interpretable deck-level condition rating.
To the best of our knowledge, this is the first study to (i) combine UAV-based imaging with unsupervised sparse autoencoder analysis to produce an NBI-aligned condition rating, (ii) use patch-wise analysis to improve sensitivity to small-scale defects while preserving scalability, and (iii) enable automated bridge-level scoring from multiple images without requiring manual defect annotations or supervised retraining.
The implications of this method are substantial, as it provides DOTs with a scalable and objective tool for rapid assessment of bridge decks using drone imagery, reducing the burden on inspectors, enhancing inspection frequency, and enabling early intervention before defects become critical. Furthermore, by aligning with the nationally recognized NBI scoring system, the method’s outputs can be directly integrated into existing asset management workflows.
The remainder of this paper is structured as follows. The next section describes the proposed methodology, including image patching, sparse autoencoder architecture, and the NBI-aligned scoring mechanism. This is followed by experimental validation on real UAV datasets collected from in-service bridges. The results, advantages, limitations, and potential extensions are then presented. The paper concludes with final remarks and future directions.
Methodology
This proposed methodology is a fully automated, unsupervised anomaly detection pipeline for bridge deck inspection using UAV-acquired imagery and a sparse autoencoder. The pipeline is designed to process multiple high-resolution images of a bridge deck captured from various angles, detect local surface anomalies through reconstruction errors, and aggregate the findings into a global bridge condition score that aligns with NBI standards. Figure 1 shows the general flowchart of the proposed methodology. These steps are described in detail in the following subsection.
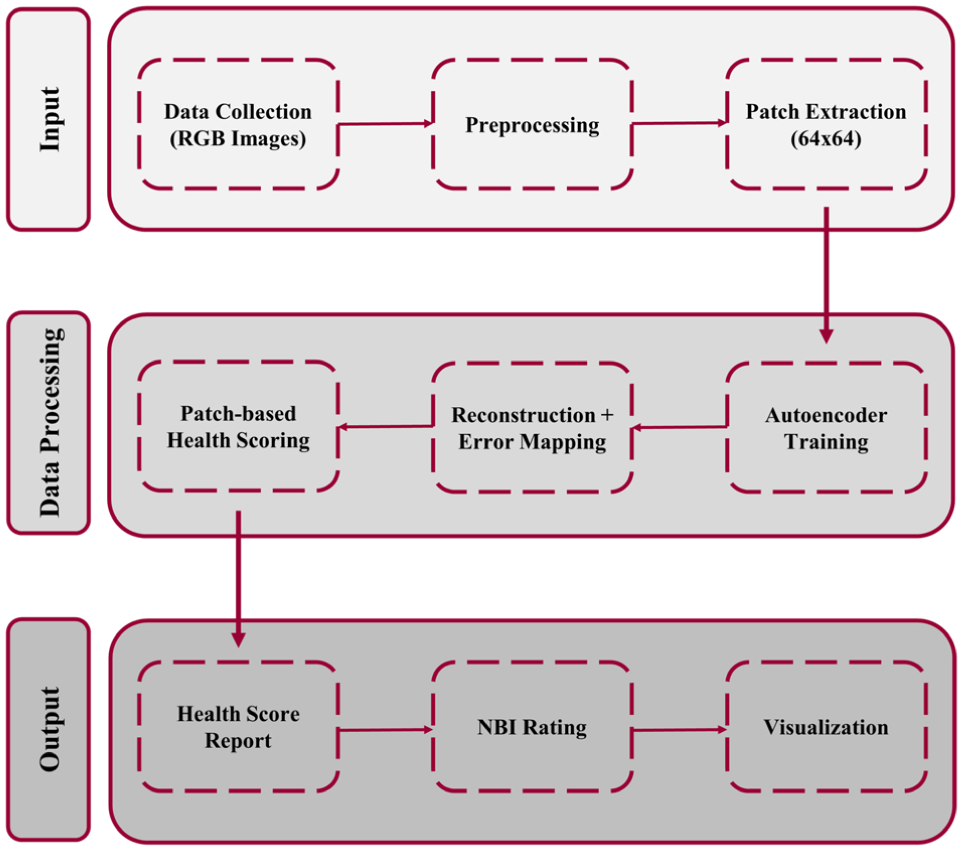
Flowchart of the proposed methodology of this study.
Data Collection, Preprocessing, and Patch Extraction
In the first step of the methodology, high-resolution bridge deck images were collected using a DJI Mavic 2 Enterprise UAV equipped with a standard RGB camera. Because NBI deck ratings are primarily driven by visible surface deterioration, unimodal RGB imagery is sufficient for the NBI-aligned bridge deck assessment performed in this study. To maintain image clarity and geometric consistency, the UAV flights were performed at a controlled altitude (typically 3–5 m above the deck surface), which corresponds to a ground sampling distance (GSD) of 1–1.5 mm/pixel. Each image captured covers a portion of the bridge deck with visible concrete texture, cracks, shadows, and surface features that support robust model learning under varying lighting and texture conditions. The typical image resolution was 4056 × 3040 pixels, allowing for fine-grained patch extraction. UAV imagery was collected from 23 in-service bridges in New Mexico, and from these, five bridges were used to curate healthy concrete regions for training the sparse autoencoder (146 images). Ten bridges were used to conduct threshold sensitivity calibration, and final evaluation (testing) was performed on eight held-out bridges, which were not used in model training or threshold calibration.
Images were cropped to remove irrelevant backgrounds (e.g., sky, trees, traffic barriers) and focus exclusively on the healthy concrete surfaces of the deck, including the top surface, underneath, and sides. This step does not constitute labeling in the supervised learning sense. No defect labels, structural condition labels, or pixel annotations were used at any stage of model training or testing. Although background regions were manually removed in this study to maintain the unsupervised nature of the anomaly detection pipeline, this step is not intrinsic to the proposed method. The core anomaly detection framework operates entirely automatically once deck regions are provided. For full autonomy, an optional deck-segmentation module can be integrated to automatically identify deck pixels. This component would be supervised, but it does not affect the label-free nature of the anomaly detection and NBI rating modules, which rely exclusively on unlabeled healthy concrete patches.
Once the images were acquired, each underwent a standardized preprocessing pipeline to ensure consistency and readiness for the anomaly detection stage. The first step involved grayscale conversion, in which each RGB image was transformed into a single-channel grayscale image. This was based on the observation that most structural defects on concrete surfaces manifest through intensity variations (e.g., cracks, delaminations) rather than chromaticity. Grayscale conversion reduces data dimensionality and computational load without substantially sacrificing relevant features. Subsequently, if the input images contained high-frequency sensor noise or compression artifacts, a mild Gaussian smoothing filter was applied.
The preprocessed grayscale images were then divided into non-overlapping square patches of size 64 × 64 pixels, forming the fundamental input unit for the unsupervised learning model and providing a balance between resolution and coverage. The patch size was set to 64 × 64 pixels after evaluating several alternatives. This dimension provides an effective balance between spatial context and computational efficiency. Smaller patches (e.g., 16 × 16 or 32 × 32) lacked sufficient contextual information and led to fragmented anomaly representation, whereas larger patches (96 × 96 or 128 × 128) tended to oversmooth fine crack patterns and increased computational load. At the UAV’s GSD described above (1–1.5 mm/pixel), a 64 × 64 patch corresponds to approximately 6.4–9.6 cm of physical deck surface, which captures the typical scale of surface-level anomalies such as cracks, stains, and small spalls.
Each patch was flattened into a one-dimensional vector of 4096 elements and normalized to the range [0,1]. This normalization step ensures consistent intensity scaling across all patches and avoids numerical instability during model training. Formally, let
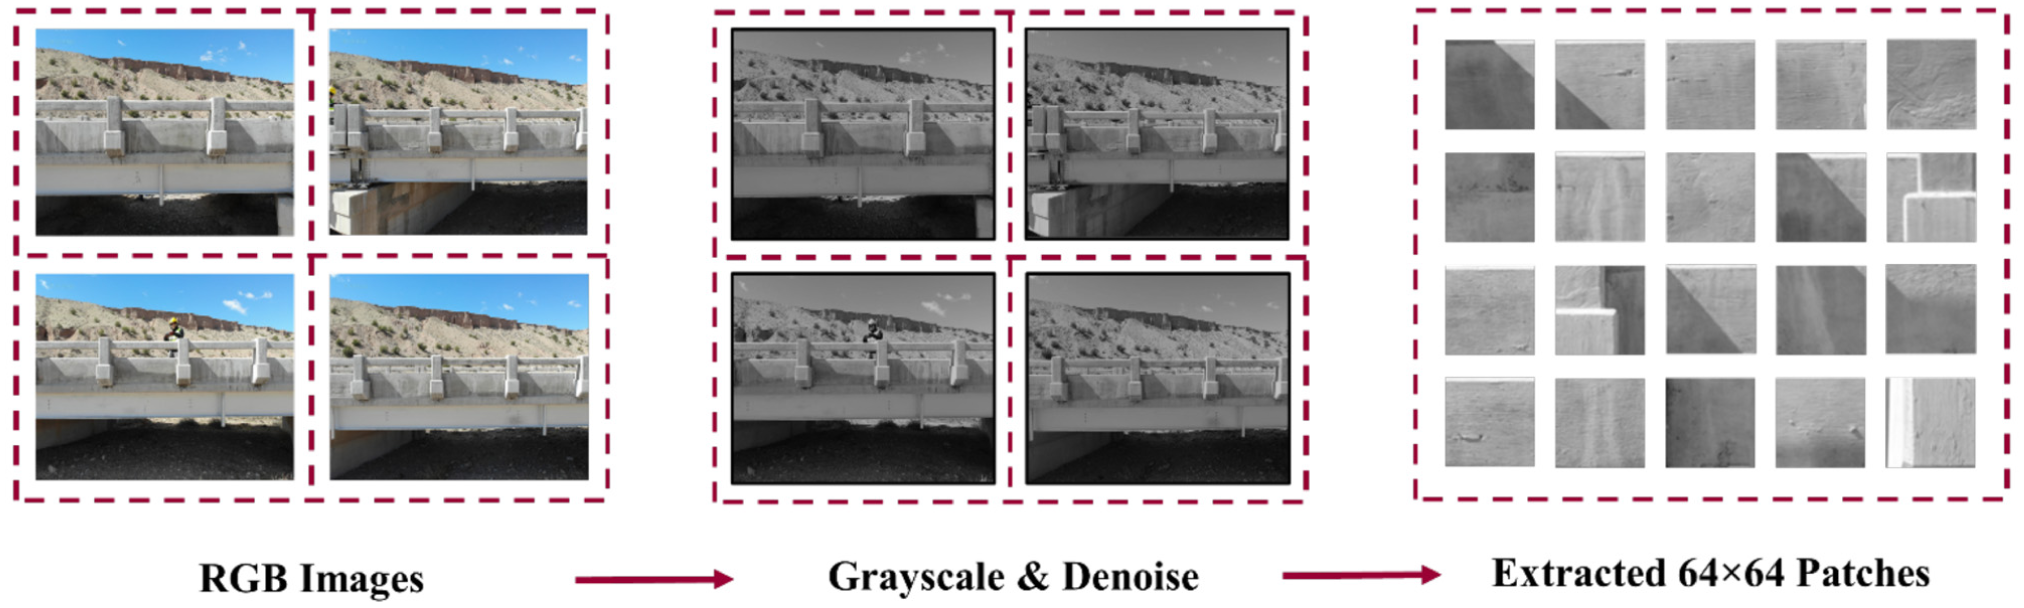
Example of UAV-collected deck images, preprocessing, and extraction of healthy concrete 64 × 64-pixel patches.
Filtering was performed to remove patches containing sky, vegetation, or heavily obstructed views, ensuring that only surface-representative patches were used for training. To enhance the robustness and accuracy of the autoencoder, additional images of healthy concrete surfaces (without defects) were added to the UAV-collected data. Therefore, the total number of extracted 64 × 64 patches for autoencoder training was 36,000.
Sparse Autoencoder Training
The training set consisted exclusively of healthy concrete surface data (non-anomalous) data, ensuring the model learned a compact latent representation of healthy patterns only. The core of the proposed framework is an unsupervised sparse autoencoder, which was trained in MATLAB using the trainAutoencoder function ( 27 ). The architecture comprised a single hidden layer with 200 neurons. A latent dimensionality of 200 (95% reduction from the original 4096-pixel patch) provided the best balance between expressive capacity and compression, enabling the sparsity constraint to operate effectively while avoiding overfitting. This configuration consistently yielded the clearest separation in error distributions and stable convergence during training. Sparsity constraints were enforced using Kullback–Leibler divergence to encourage the network to activate only a subset of neurons for any given input, thereby learning discriminative features of healthy surfaces. Additionally, the input and output layers contained 4096 neurons because of the flattened 64 × 64 patches. Figure 3 shows the architecture of the sparse autoencoder.
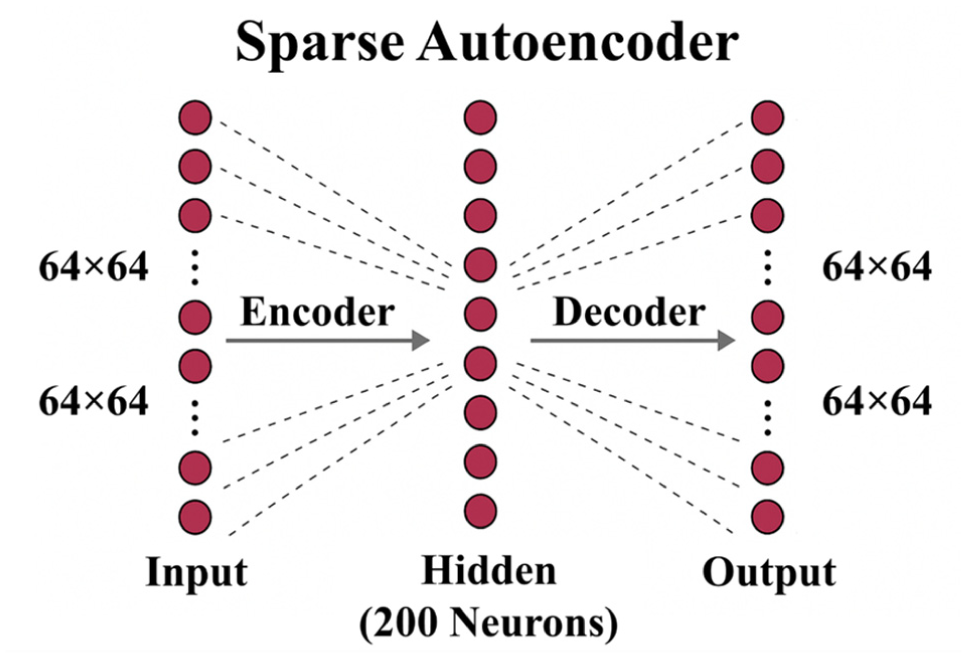
Architecture of the sparse autoencoder.
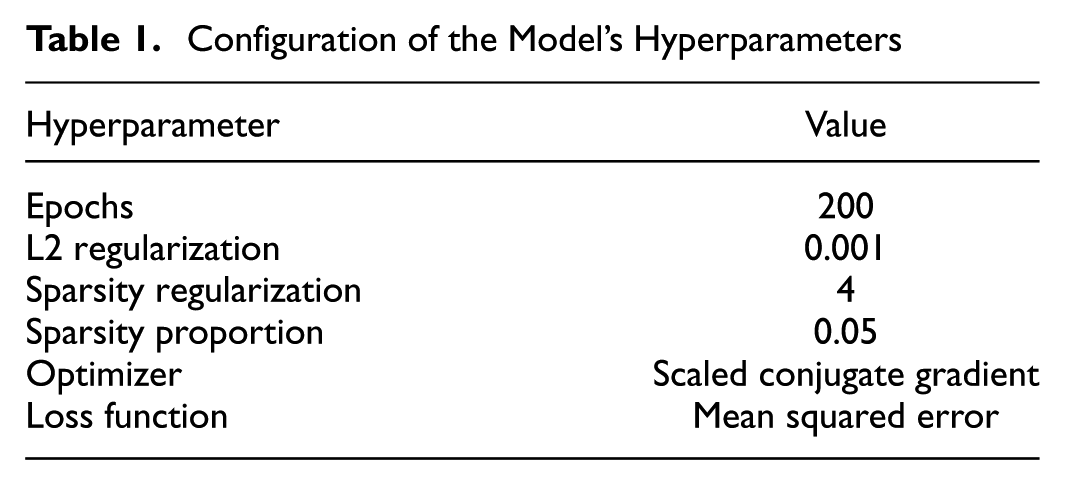
The training was performed using the scaled conjugate gradient (SCG) algorithm, which is a second-order optimization method combining the speed of conjugate gradient descent with efficient step-size scaling. Unlike traditional backpropagation with basic stochastic gradient descent, SCG avoids line searches, accelerates convergence, and is well-suited for smooth error surfaces such as those associated with reconstruction loss. Additionally, L2 weight regularization was used to prevent overfitting by penalizing large weights that may lead to memorization of the training data. Moreover, sparsity regularization was used to enforce that each hidden neuron remains inactive for most inputs, promoting part-based representations. Finally, the sparsity proportion was used to set the desired average activation per hidden unit. A value of 0.05 encourages most neurons to remain off for any given patch, ensuring that only meaningful features are encoded. The configuration of these hyperparameters is summarized in Table 1.
Configuration of the Model’s Hyperparameters
The reconstruction error for each patch was computed using the mean squared error (MSE), defined as:

where
The training performance of the sparse autoencoder is shown in Figure 4. The model exhibited strong convergence behavior over the course of 200 epochs with an elapsed time of 31 min, reaching a final MSE of approximately 0.00299. As pixel intensities are normalized to [0,1], an MSE of 0.00299 means that, on average, the reconstruction error across the 4096 pixels in each patch is extremely small, approximately 0.0546 (
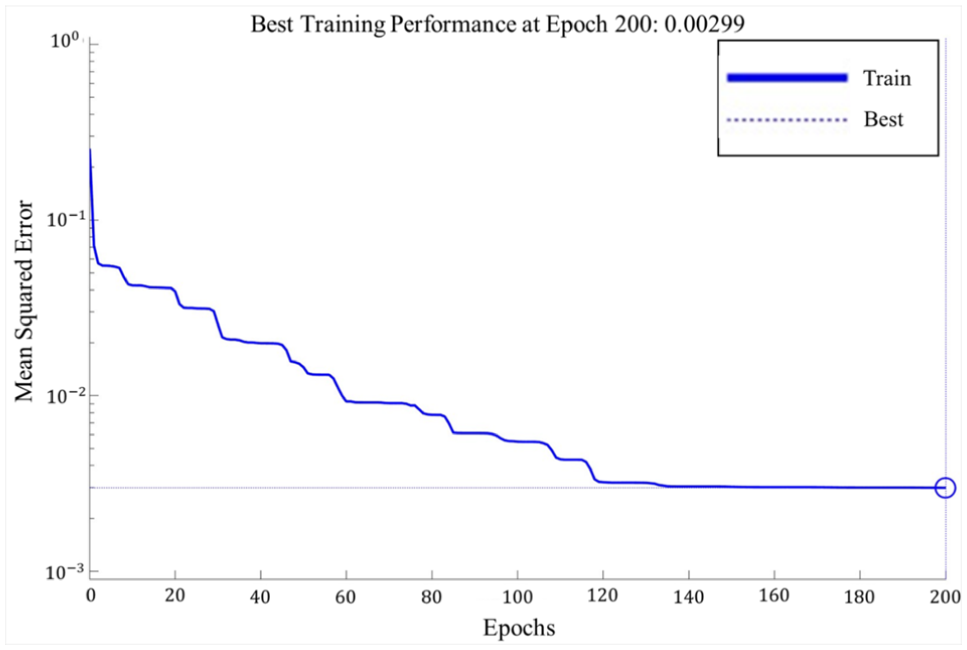
Training performance of the sparse autoencoder.
Additionally, because bottleneck size affects both reconstruction capacity and anomaly sensitivity, a sensitivity analysis of bottleneck sizes of 50, 100, 200, and 500 neurons was conducted using identical training hyperparameters. Figure 5 reports the resulting reconstruction MSE for each configuration. Reconstruction error decreased from 50 to 200 neurons, suggesting improved capacity to represent healthy surface textures. Increasing the bottleneck further to 500 neurons worsened reconstruction (MSE ≈ 0.00975) under the same sparsity and L2 regularization constraints. This indicates that excessively large latent dimensions are not beneficial in this configuration, likely because of optimization and regularization trade-offs, as well as reduced stability. Accordingly, a bottleneck of 200 neurons was selected as the most effective and stable setting for this study.
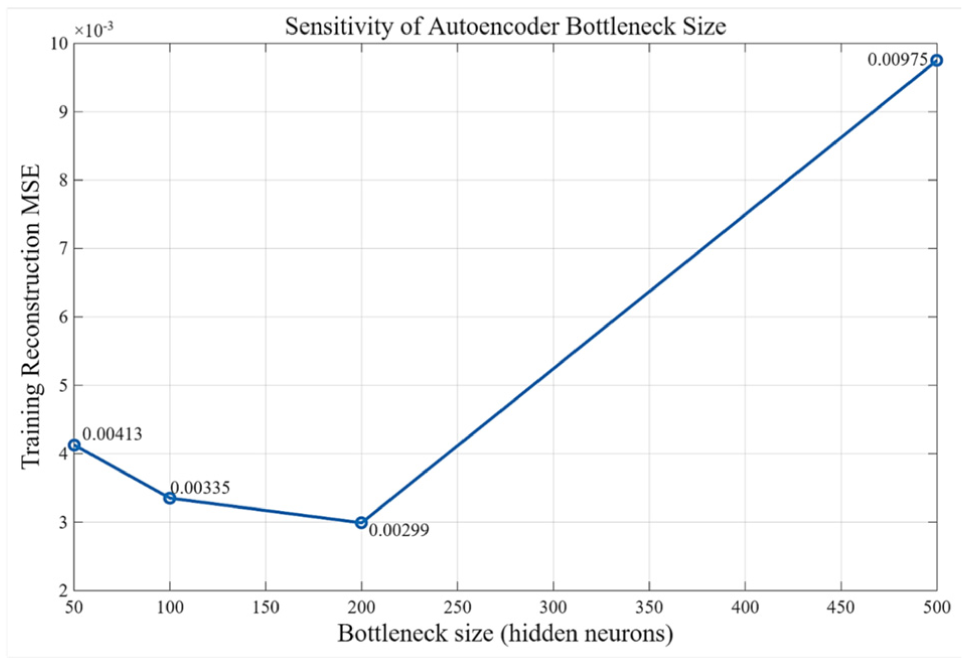
Sensitivity of sparse autoencoder bottleneck size.
All MSE values were aggregated into a 2D error map, with each value representing the anomaly score for a corresponding spatial region in the image. The error map was resized (via bicubic interpolation) to match the original image resolution and normalized to [0,1]. Figure 6 shows two sample patch-level reconstruction error maps. The darker patches represent low reconstruction error, whereas the brighter patches represent high reconstruction error. To enhance interpretability, the error map was converted to a heatmap using a perceptually intuitive hot colormap. The heatmap was overlaid on the original image to highlight potential anomalies, with darker areas indicating lower anomaly scores and lighter areas indicating higher anomaly scores. Therefore, although the dimensions of the defects were not measured, by using the reconstruction error and the evaluation metrics mentioned below, the effect of defects with different dimensions was incorporated automatically for the deck health evaluation and rating.
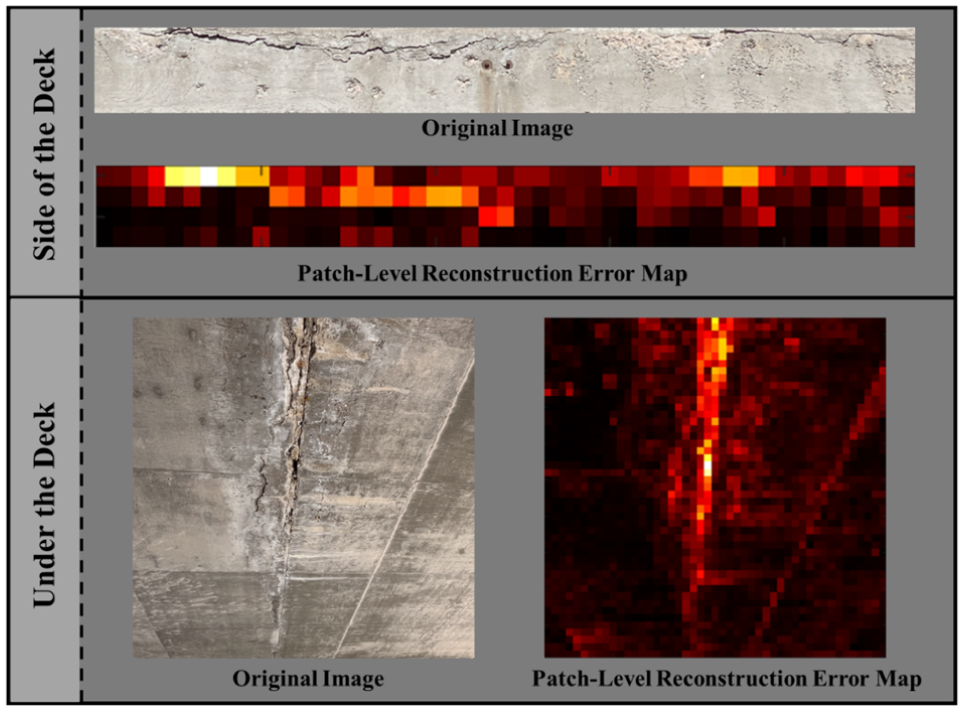
Examples of patch-level reconstruction error map for Bridge 5839.
The sparse autoencoder produces reconstruction errors at the patch level, which represents localized deviation from the learned healthy concrete texture manifold. However, the NBI deck rating is a coarse, deck-level indicator and is not intended to be inferred from a single localized defect. Therefore, this study does not map individual patch errors directly to NBI bridge deck ratings. Instead, patch-level errors are treated as distributed evidence and are aggregated across all patches and all UAV images of a bridge deck to produce deck-level anomaly metrics that quantify overall deviation, spatial extent of abnormality, and severity of anomalous behavior. This aggregation step is essential for translating localized visual cues into a holistic deck-level score aligned with inspection practice. The resulting output is intended as a deck-level rapid screening and decision-support tool that produces an NBI-aligned bridge deck condition proxy from UAV imagery, while the patch-level heatmaps remain available to support localized interpretation and potential future element-level condition-state reporting.
Given the unsupervised design and lack of pixel-level anomaly ground truth, evaluation relied on visual and statistical measures. To quantify the anomaly heatmap into actionable metrics, the following metrics were computed:
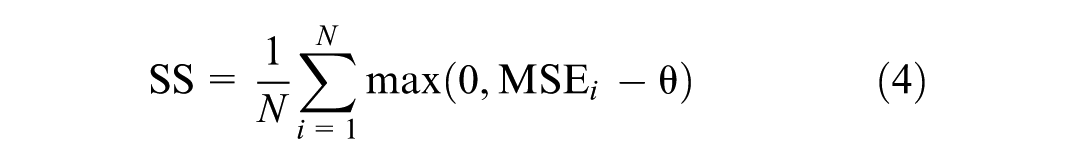
Average error (AE): Mean of reconstruction error across all patches, which indicates overall deck condition.

where N is the total number of patches.
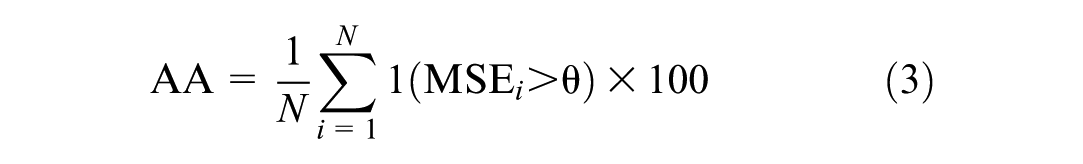
Anomalous area (AA; %): Percentage of patches with error above a threshold
Severity score (SS): Sum of excess error beyond the threshold
The threshold mentioned above is chosen based on the sensitivity analysis, which is discussed in the next subsection.
To provide a standardized interpretation of the computed anomaly metrics, the results were mapped to NBI condition rating guidelines for decks. Based on the average error, anomalous area, and normalized severity score from multiple images of a single bridge deck, a rule-based classifier was used to assign an NBI-aligned bridge deck rating between 1 (critical) and 9 (excellent). The relationship between these metrics and the NBI bridge deck rating, derived through threshold calibration, is summarized in Table 2.
Correlation of Metrics with NBI Bridge Deck Rating
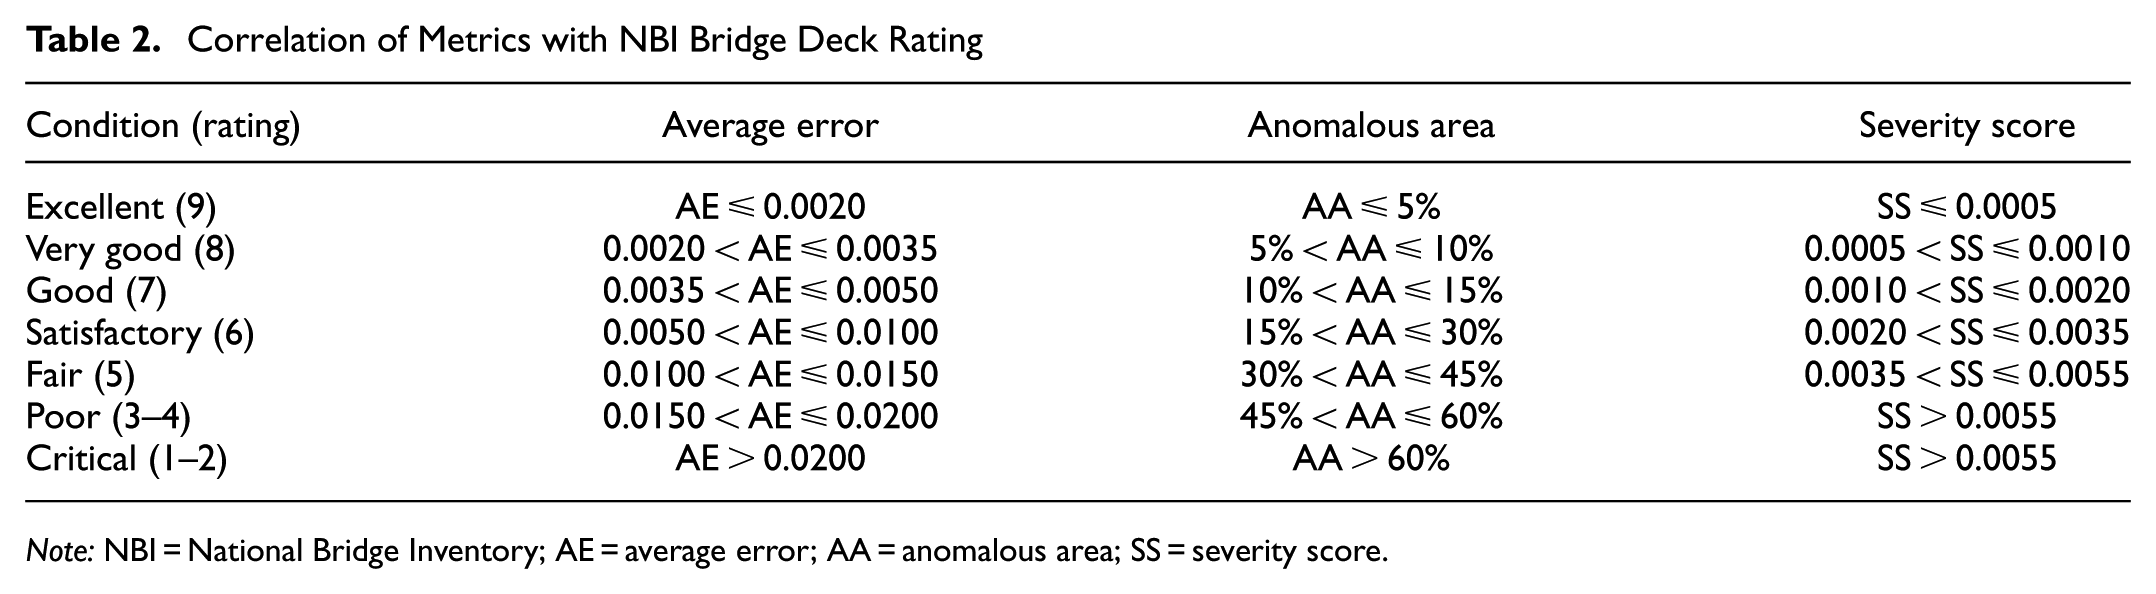
Note: NBI = National Bridge Inventory; AE = average error; AA = anomalous area; SS = severity score.
The ranges in Table 2 were empirically calibrated using a limited set of bridges in New Mexico and are not claimed to be universally optimal. Rather, they represent an initial, interpretable mapping between anomaly metrics and NBI-like categories that was calibrated to maximize agreement with the available inspector ratings. The underlying anomaly detection pipeline and metric definitions are general, whereas the specific numeric boundaries in Table 2 can be recalibrated for other inspection datasets as additional data become available.
Finally, based on the heatmap overlay described above and the correlations with NBI bridge deck ratings, a full bridge deck report and anomaly visualization are provided. The next section presents the model training results, along with the resulting reports and visualizations.
Sensitivity Analysis and Experimental Validation
This section first discusses the selection of the threshold described above based on the sensitivity analysis. It then presents the experimental validation using real-world scenarios and the proposed methodology with the selected threshold.
Threshold Sensitivity Analysis
To evaluate the robustness and reliability of the anomaly detection process, a sensitivity analysis was performed over a range of reconstruction error thresholds from 0.010 to 0.025, with increments of 0.001. For each threshold value, two key metrics were computed: (i) the percentage of anomalous patches, defined as the fraction of image patches exceeding the threshold, and (ii) the normalized severity score, calculated as the mean amount by which the anomalous patches exceeded the threshold.
The sensitivity analysis was performed independently on images from 10 bridges in New Mexico to observe how the system’s response varied under different surface conditions. In all cases, increasing the threshold led to a monotonic decline in both anomalous percentage and severity score. However, the rate of decline varied between bridges. These variations highlight the importance of careful threshold selection. A lower threshold may be overly sensitive, capturing minor surface variations and increasing false-positives, whereas a higher threshold may miss early-stage damage. Based on a balance between detection sensitivity and false anomaly suppression, and consistent with observed NBI bridge deck rating transitions, the final operating threshold,
As an example of the sensitivity analysis, results for two representative bridges are shown in Figure 7. Based on the DOT reports, both bridges are classified as being in fair condition (NBI bridge deck rating of 5). For Bridge 6357, the threshold corresponding to the fair-condition classification (green dashed line) is 0.015, whereas this value for Bridge 6358 is 0.012. Although both bridges have the same condition, their sensitivity trends exhibit distinguishable differences. As shown in Figure 7, Bridge 6357 maintained a relatively high anomalous area (∼38%) and normalized severity (∼5.4 × 10⁻³) at the threshold of 0.015, transitioning from poor (NBI = 4) to fair (NBI = 5). In contrast, Bridge 6358 transitioned to fair earlier (0.012), with anomalous percentage and severity dropping more sharply, reaching ∼36% and ∼3.6 × 10⁻³ at the same threshold (0.015). This behavior suggests that Bridge 6357 may contain more localized or intense anomalies that quickly fall below threshold detection as the value increases, whereas Bridge 6358 exhibits more widespread but shallower anomalies that persist over a broader threshold range.
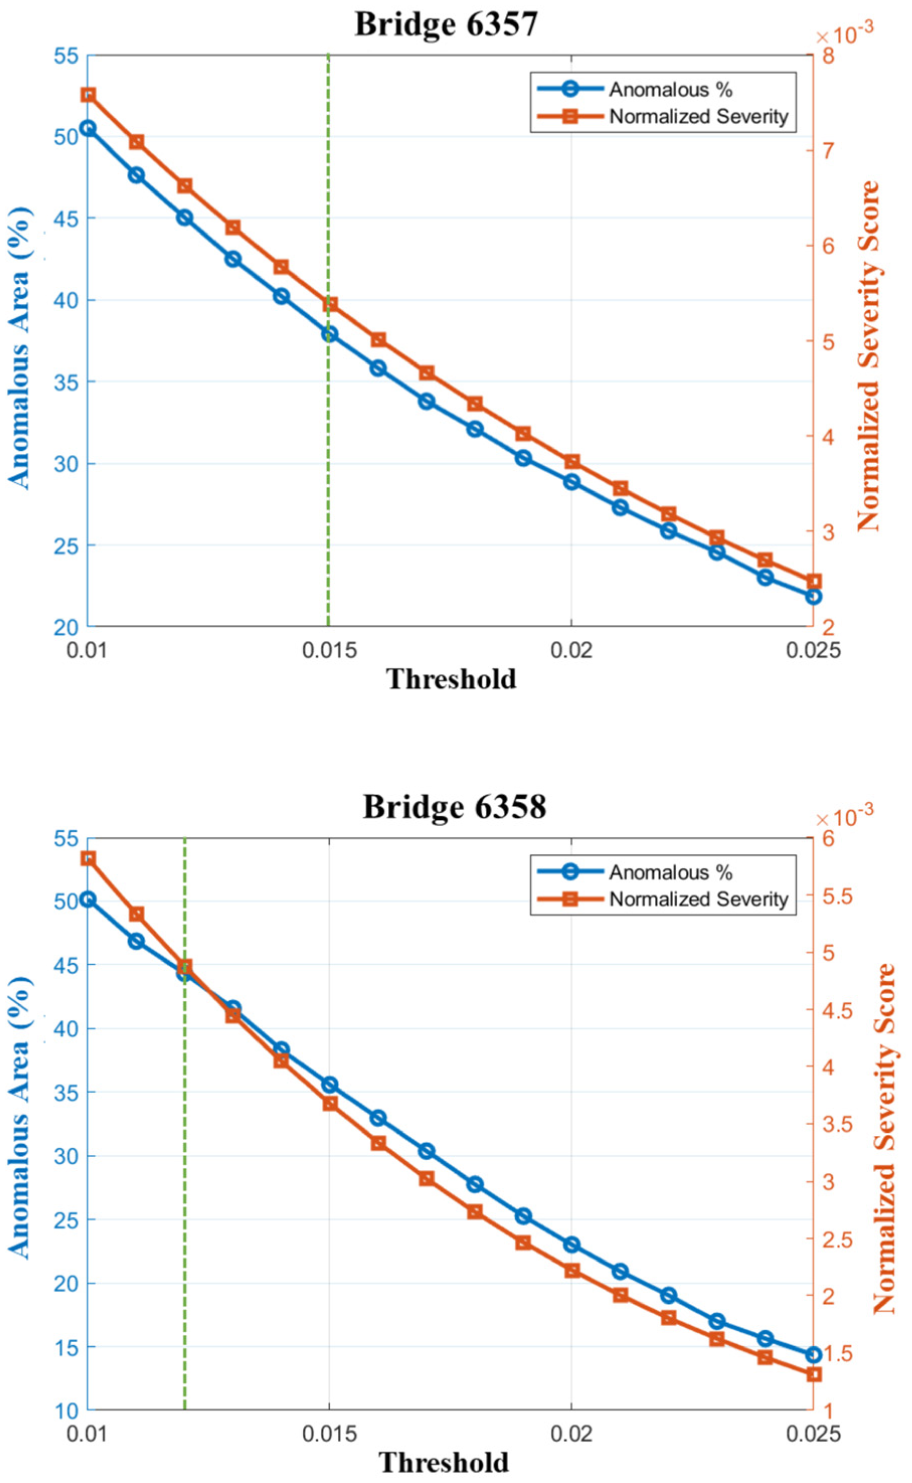
Examples of threshold sensitivity analysis for two bridges.
Such analysis supports two key insights:
1. Consistency of NBI estimation: Both bridges converge to the same condition rating despite differences in sensitivity slopes, supporting the robustness of the selected threshold.
2. Potential for prioritization: Bridges that transition later (e.g., after 0.015) may warrant earlier inspection or maintenance, even within the same NBI rating, because of the persistence of high-severity patches.
This type of sensitivity-driven comparative profiling can be used to differentiate bridges within the same rating class and potentially inform more nuanced maintenance prioritization strategies. Although the bridges used in the calibration were in New Mexico, the surfaces exhibited substantial variability in surface roughness, cracking patterns, staining, weathering, lighting, and environmental exposure. The consistency of threshold behavior across this diverse set suggests that the reconstructed-error characteristics of healthy versus anomalous concrete surfaces are relatively stable and transferable. Thus, the chosen threshold is not tied to a single bridge or region but reflects a broader statistical separation captured by the autoencoder’s learned representation of concrete texture. However, this threshold is not claimed to be universal, but rather a calibrated decision parameter that can be transferred through a simple, reproducible calibration procedure. The proposed framework is structured so that the anomaly detection and metric computation stages remain unchanged, whereas θ can be recalibrated using a small representative sample of deck images from a target deployment environment. A practical calibration procedure is to sweep θ over a bounded range (e.g., 0.010–0.025), compute bridge-level metrics and ratings, and select the value that yields stable ratings and the best agreement with available inspection records. This sensitivity-based calibration improves transferability and reduces reliance on a single locally tuned parameter.
Experimental Validation
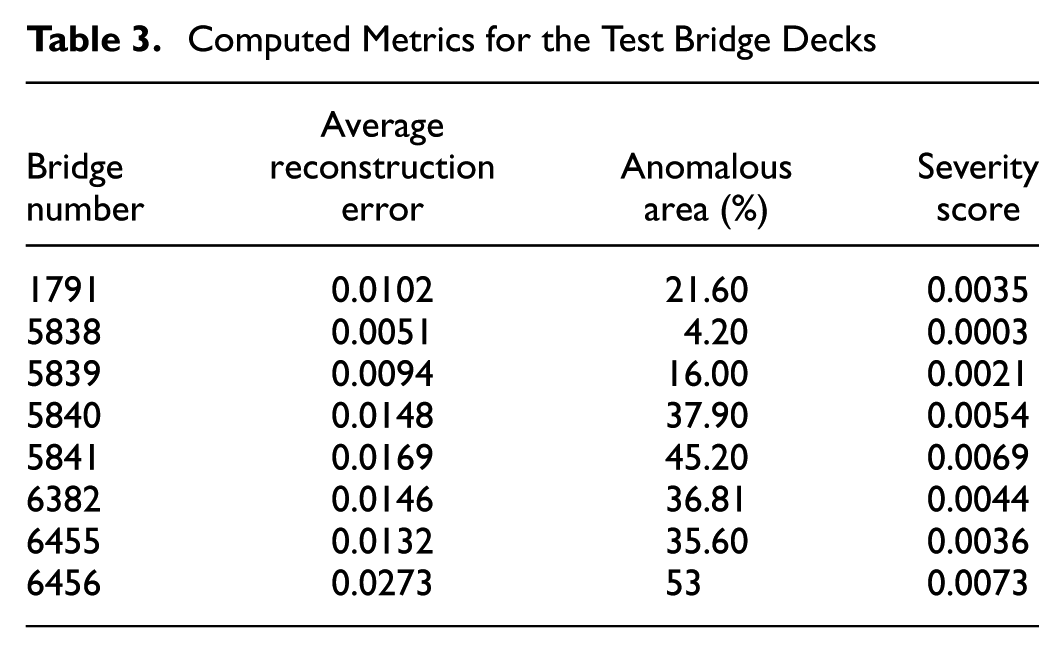
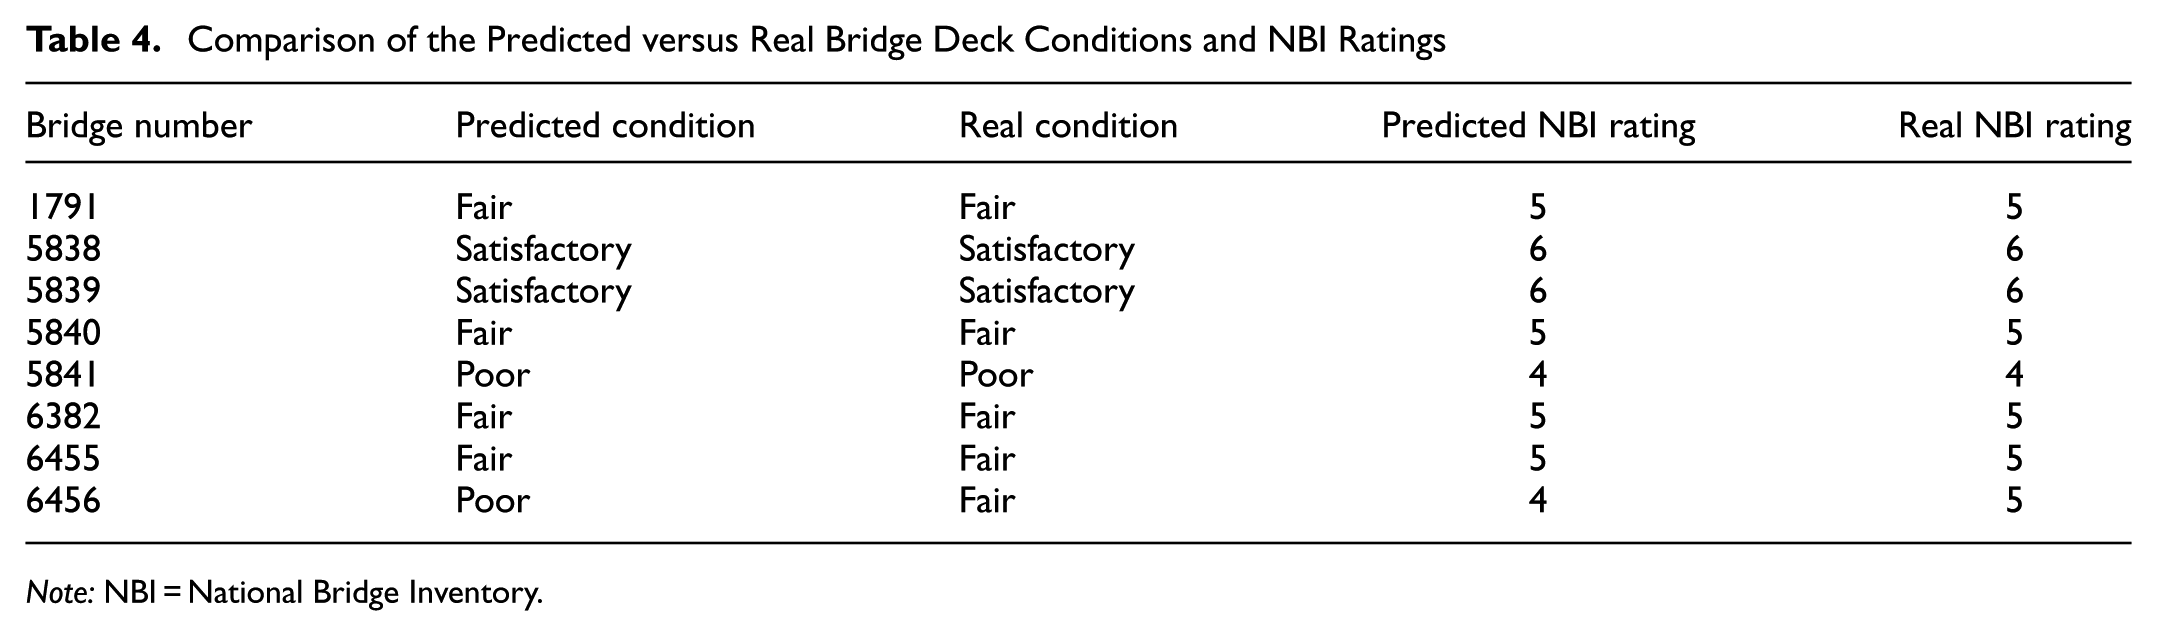
To evaluate the performance of the proposed methodology in real-world scenarios, eight bridges across New Mexico were selected, and the model was applied to predict their deck condition and NBI bridge deck ratings. Images from different sides of each bridge deck were collected using a UAV and input to the model for prediction. The model achieved full agreement with the actual NBI bridge deck ratings (DOT reports) in seven out of eight cases, achieving an 87.5% exact-match accuracy and 100% agreement accuracy within a ±1% tolerance in predicting correct deck conditions. This includes correct classification of bridges in fair, satisfactory, and poor condition categories. Table 3 summarizes the computed metrics for these bridges using the 0.015 threshold, and Table 4 compares the predictions with the real conditions and ratings. Moreover, a confusion matrix for the rating predictions is provided in Table 5.
Computed Metrics for the Test Bridge Decks
Comparison of the Predicted versus Real Bridge Deck Conditions and NBI Ratings
Note: NBI = National Bridge Inventory.
Confusion Table of the Predicted Ratings
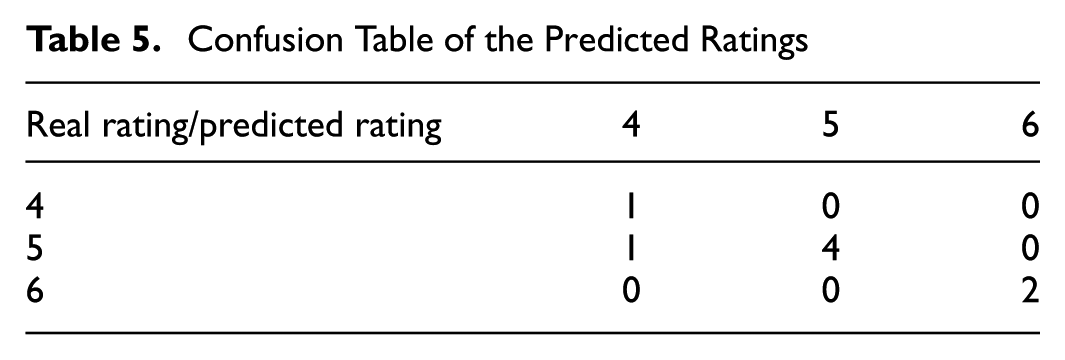
As shown in Table 3, bridges with lower NBI ratings (e.g., Bridge 5841 and Bridge 6456) tend to exhibit higher average reconstruction errors, more widespread anomalous regions, and greater severity scores. For instance, Bridge 5841, which is rated as poor (NBI = 4), shows an anomalous area of 45.2% and a high severity score. In contrast, Bridge 5338, rated as satisfactory (NBI = 6), demonstrates an anomalous area of only 4.2% and a minimal severity score of 0.0003, suggesting the model’s sensitivity to damage-related signatures. Additionally, Tables 4 and 5 show that the only mismatch was observed for Bridge 6456, which was predicted as poor (NBI = 4) while being rated as fair (NBI = 5) in the official record. However, this bridge exhibited both the highest reconstruction error (0.0273) and the largest anomalous area (53%). This may reflect true distress such as cracking clusters or localized surface degradation, but it may also arise from confounders that elevate reconstruction error without representing structural deterioration, including surface staining, markings, or texture heterogeneity from patching or surface finishing. Because close-range inspection photos and detailed inspection notes corresponding to the recorded rating were not available, further error analysis through manual inspection would be required to determine this difference. Nevertheless, this discrepancy also highlights the potential of the proposed method for early detection of structural degradation, making it especially valuable for large-scale monitoring and prioritization.
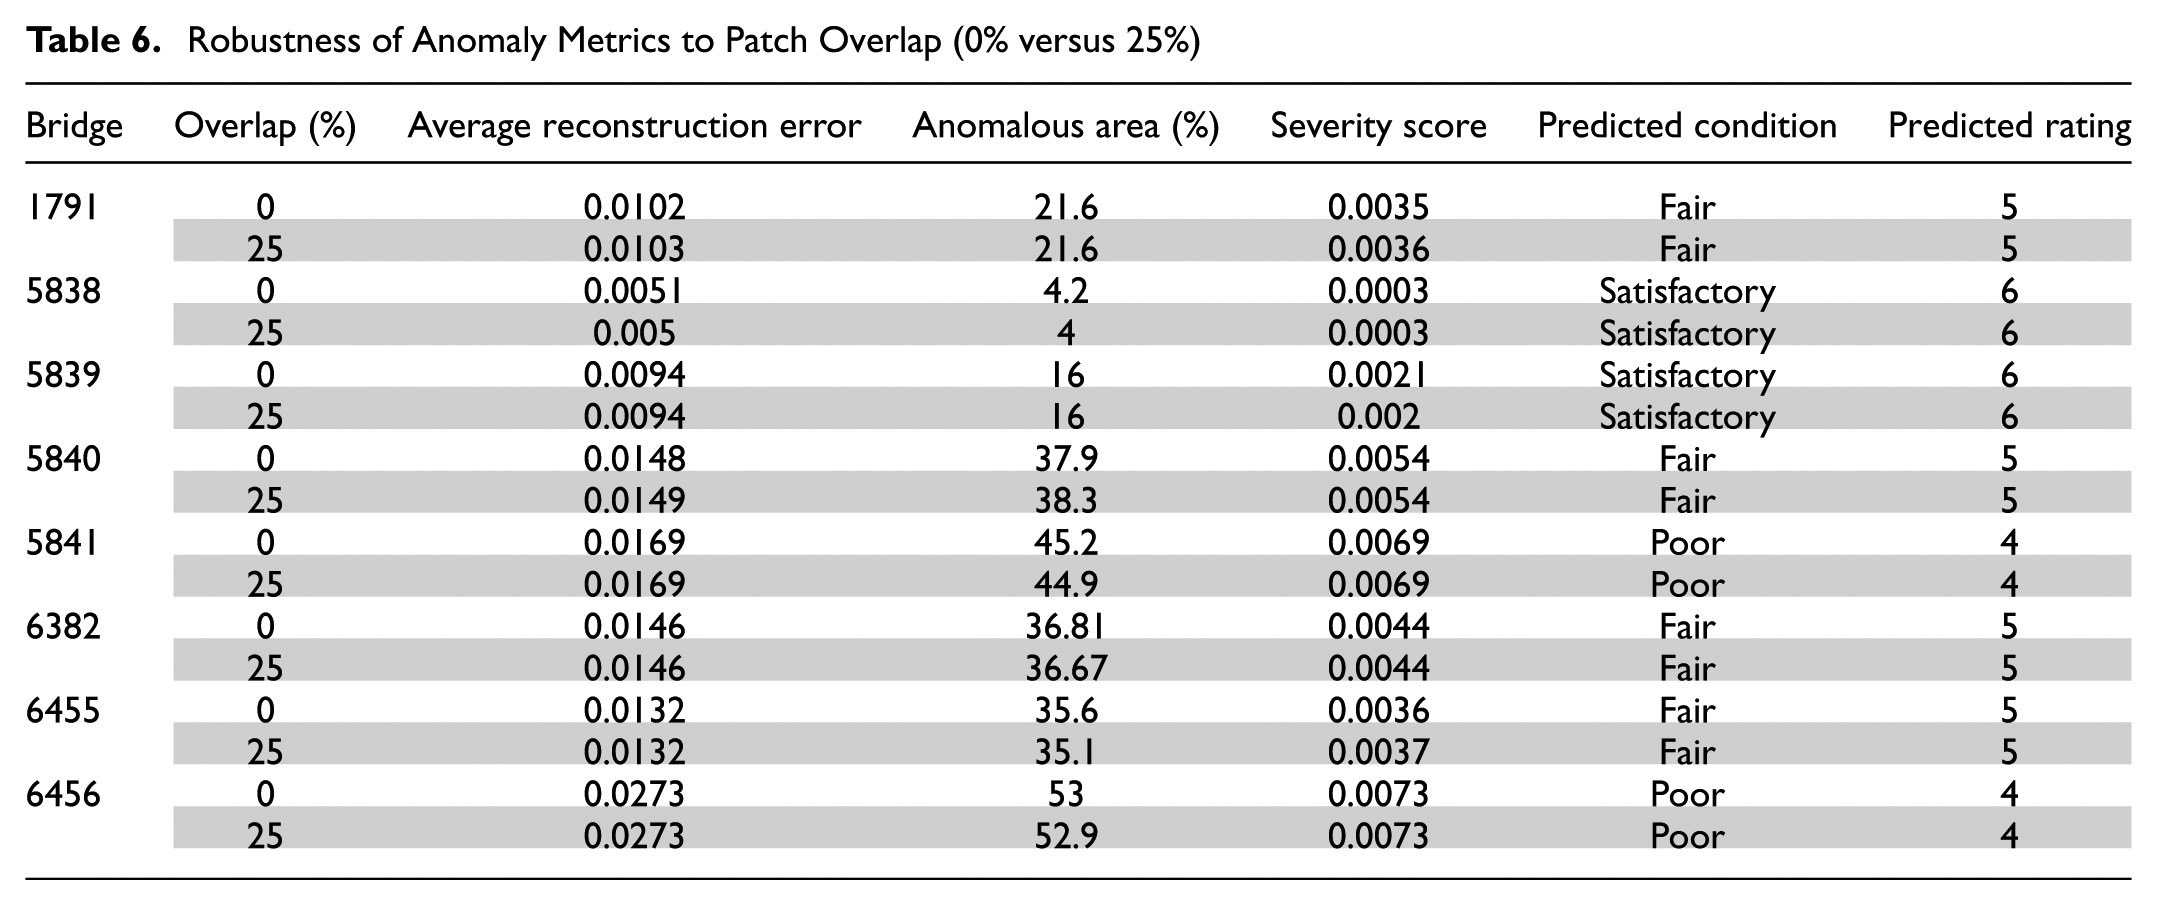
Because non-overlapping patches may introduce boundary effects when narrow cracks lie near patch boundaries, an additional robustness experiment was conducted using partially overlapping patches. Specifically, we repeated the full inference pipeline using 64 × 64 patches with 0% and 25% overlap. All other parameters were held constant, including the threshold (0.015), reconstruction-error computation, and bridge-level aggregation. This ablation study evaluates whether patch-boundary effects materially influence bridge-level anomaly metrics and the resulting NBI-aligned condition rating. Table 6 summarizes the anomaly metrics for all eight bridges under non-overlapping (0%) and partially overlapping (25%) patch settings. The results show that overlap has a negligible impact on the aggregated bridge-level metrics. Average reconstruction error remains nearly unchanged for all bridges (changes on the order of 10−4). The anomalous area percentage varies only slightly (maximum observed change of 0.5 percentage points), and normalized severity scores are nearly identical (changes on the order of 10−4). These findings indicate that patch-boundary effects do not materially affect the bridge-level scoring outcomes in this framework. Although overlap may visually smooth anomaly heatmaps and reduce patch-grid artifacts at the patch level, the final deck-level condition assessment remains stable because of aggregation across thousands of patches and multiple images per bridge.
Robustness of Anomaly Metrics to Patch Overlap (0% versus 25%)
For practical applications, it is crucial to provide a visualization of the deck’s anomalies, as inspectors and decision-makers require spatially coherent visualizations of potential defects in addition to condition ratings. To generate image-level anomaly heatmaps, each test image was first divided into non-overlapping 64 × 64 grayscale patches. For each patch, the trained sparse autoencoder reconstructed each patch, and the MSE between the input and output vectors was computed as the patch anomaly score. These scalar errors were then spatially reassembled to form a 2D anomaly heatmap, preserving the patch-wise location of each score. Additionally, since patch processing is independent, parallel computing is used to reduce computational time. As the model is lightweight and parallelizable, the proposed system is suitable for onboard deployment on UAVs for near real-time processing.
Figure 8 shows examples of UAV-captured bridge deck images of Bridge 5839 from the side and underside of the deck, along with the corresponding predicted anomaly heatmaps produced by the proposed method. Areas shown in yellow and white indicate high reconstruction error levels and thus likely surface anomalies such as cracks and spalling, whereas dark red and black areas represent well-reconstructed regions with low reconstruction error. The top panel shows an image captured from the side of the bridge deck, where prominent horizontal cracking is visually evident. The predicted heatmap highlights these regions with light red and yellow hues, corresponding to observed damage zones. The model accurately localizes distributed anomalies, including minor spalling and crack propagation zones that are typically hard to detect using traditional threshold-based image processing methods. The bottom panel displays an under-deck view, where multiple intersecting cracks are present. The reconstruction-error-based heatmap successfully intensifies around both longitudinal and transverse cracks, reinforcing the model’s robustness across varying crack morphologies, orientations, and lighting conditions. The localization accuracy is notable, even in heavily textured regions where manual inspection becomes challenging.
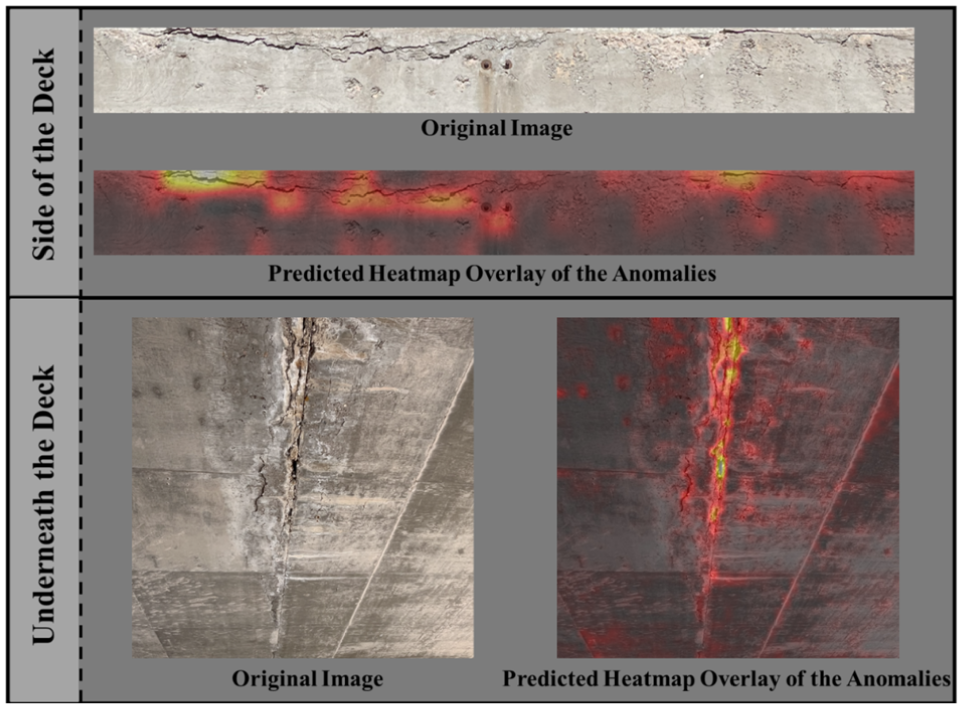
Sample images and predicted heatmap overlays from the deck of Bridge 5839.
These visual results emphasize the model’s utility not only for automated assessment and scoring, but also for supporting human-in-the-loop decision-making, where inspectors can focus attention on the most critical structural regions using the heatmaps. Combined with the computed metrics and NBI-aligned ratings, the proposed system not only predicts anomalies and condition ratings, but also enables deeper analysis by inspectors to prioritize bridge maintenance based on the detailed predictions and visualizations provided.
Conclusions
This study presents a fully unsupervised and scalable framework for bridge deck condition assessment using UAV-acquired imagery and sparse autoencoder-based anomaly detection. Addressing the need for cost-effective, objective, and standardized infrastructure monitoring, the proposed method eliminates reliance on large-scale labeled datasets and manual feature engineering, which are typically key barriers in traditional inspection and supervised deep learning approaches. By decomposing UAV-captured RGB images into 64 × 64 grayscale patches and training a sparse autoencoder exclusively on healthy concrete textures, the framework learns a compact latent representation of undamaged surface characteristics. During inference, elevated reconstruction errors are used to identify anomalous patches potentially corresponding to surface-level defects such as cracks, delamination, or contamination.
To move from localized anomaly detection to holistic structural evaluation, the study introduces three interpretable metrics: average reconstruction error, anomalous area percentage, and normalized severity score, which are then aggregated across all images for each bridge. An empirically designed classification scheme maps these metrics to NBI deck condition ratings, allowing the system to approximate human inspection logic in a transparent and reproducible manner. The framework was validated on multiple real-world bridges, demonstrating strong alignment with inspection ratings, with an exact-match classification accuracy of up to 87.5%. Moreover, a threshold sensitivity analysis reveals how threshold values influence the resulting ratings, providing insight into the robustness, stability, and transition behavior of the framework across condition levels. We acknowledge that further validation using a larger and more diverse dataset would enhance statistical reliability. Therefore, future research will focus on expanding the dataset and developing adaptive thresholding mechanisms based on bridge-specific surface texture distributions to reduce manual parameter tuning.
The results demonstrate the practicality and reliability of the proposed system in practical inspection scenarios. It facilitates rapid, label-free condition evaluations over large deck surfaces, reduces subjective interpretation, and improves standardization. The method is consistent with federally recommended advanced inspection practices and supports broader infrastructure management strategies. Its lightweight implementation enables deployment on portable computing platforms, allowing for near real-time condition assessment during UAV missions.
Future work will focus on several directions. First, the validation dataset will be expanded to cover a broader range of bridge condition ratings. Second, integration with real-time onboard UAV processing using edge devices such as NVIDIA Jetson Nano platforms could be explored to enable real-time feedback during inspection flights. Third, the proposed method could be extended to classify different defect types across bridge elements such as piers, pier caps, and girders. This could be further enhanced by incorporating location-aware weighting of anomalies to prioritize structurally critical regions. Fourth, the autoencoder could be extended to multi-channel inputs (RGB and thermal) to improve detection of color-dominant anomalies such as staining and efflorescence, and to reduce ambiguity between discoloration-related and texture-related anomalies. Finally, fusing the proposed visual anomaly detection system with complementary modalities such as infrared thermography or LiDAR could enable multi-modal damage inference and subsurface anomaly detection.
Footnotes
Acknowledgements
The research reported in this paper was conducted under a long-term project sponsored by the NMDOT Research Bureau. Q. Zhang acknowledges the startup fund from the College of Engineering at New Mexico State University.
Author Contributions
The authors confirm contribution to the paper as follows: study conception and design: Q. Zhang; data collection: P. Almasi; analysis and interpretation of results: P. Almasi, Q. Zhang; draft manuscript preparation: P. Almasi, Q. Zhang; manuscript review: P. Almasi, R. Premadasa, D. Jauregui, Q. Zhang; resources: D. Jauregui; investigation: P. Almasi, R. Premadasa, Q. Zhang. All authors reviewed the results and approved the final version of the manuscript.
Declaration of Conflicting Interests
The authors declared no potential conflicts of interest with respect to the research, authorship, and/or publication of this article.
Funding
The authors disclosed receipt of the following financial support for the research, authorship, and/or publication of this article: The research reported in this paper was conducted under a long-term project sponsored by the NMDOT Research Bureau.