
Abstract
This study explored the utility of trait emotional intelligence (EI) for predicting students’ university graduation outcomes six years after enrolment in university. At the start of the program, 1,015 newly registered students completed a brief multidimensional self-report EI assessment and provided consent to track their subsequent degree progress via official university records. Using latent profile analysis (LPA), participants were sorted into five classes that differed in the overall EI level and in the relative strengths and weaknesses on individual EI dimensions. Greater likelihood of degree noncompletion at the 6-year follow-up was uniquely associated with having a low-EI profile with particularly pronounced weaknesses in the interpersonal and stress management domains, after controlling for high school grades and gender. Comparative levels of predictive utility could not be achieved by examining scores on each EI dimension independently. Authors discuss practical advantages of LPA over traditional variable-centered approaches for identifying and assisting students at risk for degree noncompletion.
Pursuing university education is a long-term undertaking that requires serious commitment of effort and resources on the part of both students and educators. Degree noncompletion is not only taxing on everyone’s time and finances, but it also carries lasting life implications for students who dropout, including missed career opportunities and lowered self-esteem. Historically, researchers investigating patterns of student retention and attrition have relied on a set of demographic (e.g., gender and socioeconomic status) and academic (e.g., aptitude tests and high school grades) indicators (Tinto, 1993). However, contemporary models of student persistence recognize that successful degree completion depends on a more complex network of variables, including students’ involvement and satisfaction with university life, emotional and interpersonal adjustment, and availability of institutional support programs (Berger & Milem, 1999; Pascarella & Terenzini, 2005; Robbins, Allen, Casillas, Peterson, & Le, 2006).
One relevant construct that has attracted attention of educational researchers in recent years is that of emotional intelligence (EI), broadly defined as a constellation of abilities and dispositions related to perceiving, understanding, and managing emotions of self and others (Bar-On & Parker, 2000). Ability-based aspects of EI include objective emotion-related knowledge and reasoning and are measured with performance-based tests, similar to other cognitive abilities (Mayer, Salovey, & Caruso, 2008). Trait-based aspects of EI encompass emotion-related dispositions and self-perceptions and are measured with self-report questionnaires, similar to other personality variables (Petrides, Pita, & Kokkinaki, 2007). Although both ability and trait aspects of EI have been linked with substantive outcome criteria and constitute complementary sources of individual differences, the focus of the current investigation will be on trait EI.
In postsecondary settings, trait EI competencies have been linked to a number of positive indicators, including less perceived stress (Pau & Croucher, 2003), fewer physical fatigue symptoms (Brown & Schutte, 2006; Thompson, Waltz, Croyle, & Pepper, 2007), less social anxiety and loneliness (Summerfeldt, Kloosterman, Antony, & Parker, 2006), and better overall adjustment and life satisfaction (Extremera & Fernández-Berrocal, 2006; Palmer, Donaldson, & Stough, 2002). Studies that have explored specific mechanisms underlying these relationships indicate that students who possess a better developed EI repertoire enjoy greater social support and use more effective coping strategies, which in turn, modulate the effects of stress on performance and well-being (Austin, Saklofske, & Mastoras, 2010; Extremera, Durán, & Rey, 2009; Saklofske, Austin, Galloway, & Davidson, 2007). Failures to establish supportive social relationships or to cope with various stressors of campus life, by contrast, are among the most common reasons for students to discontinue their studies (Christie, Munro, & Fisher, 2004; Pritchard & Wilson, 2003; Yorke, 1999).
Direct evidence linking trait EI to objective retention outcomes comes from two studies of first-year Canadian students (Parker, Hogan, Eastabrook, Oke, & Wood, 2006; Parker, Summerfeldt, Hogan, & Majeski, 2004). At the start of the academic year, newly registered full-time undergraduates completed a brief self-report measure of EI and provided consent to access their year-end university records. At the end of the year, students’ EI scores were matched with their official academic standing (succeeded vs. failed) and registration status (persisted vs. withdrew). Despite having comparable age, course load, and high school grade point average (GPA), students who entered university with lower EI scores were significantly more likely to fail or withdraw from the university than their higher-EI peers. Similar results have been replicated with independent samples of first-year students from the United States (Parker, Duffy, Wood, Bond, & Hogan, 2005) and the United Kingdom (Qualter, Whiteley, Morley, & Dudiak, 2009). At least two other studies have provided controlled experimental evidence showing that intervention programs aimed at enhancing freshmen’s EI competencies also produce concomitant increases in first-year retention rates (Qualter et al., 2009, Study 2; Schutte & Malouff, 2002). Of note, these intervention effects could not be attributed to individual differences in basic personality traits or gains in non-EI related skills (e.g., critical thinking).
Although existing evidence provides compelling support for trait EI’s role in promoting successful adjustment to university, the full extent of its predictive utility for long-term graduation outcomes remains largely unexplored. One reason for this gap is that much of the relevant research to date has been limited to a relatively short time frame, focusing on first-year students making the immediate transition from high school to university. Whether EI continues to predict retention beyond first year is a question that has not yet been addressed empirically. Because EI competencies are purported to improve naturally with age and life experience, even in the absence of direct intervention effects (Bar-On & Parker, 2000), the temporal stability of the EI construct becomes an important confound. Indeed, one of the few longitudinal studies that tracked students’ EI levels beyond first year documented significant improvements in several EI domains over the course of a three-year period (Parker, Saklofske, Wood, Eastabrook, & Taylor, 2005). Given the malleable nature of many EI competencies, the predictive scope of first-year EI scores would be expected to diminish for outcomes assessed farther away in the future.
Another issue that has not been fully explored in previous research is the conceptual heterogeneity of the EI construct, which by definition comprises multiple competencies in several distinct but moderately intercorrelated domains (Bar-On & Parker, 2000). The prevailing analytic strategy has been to relate the outcome variable to scores on different EI dimensions in a linear fashion (e.g., in an analysis of variance or multiple regression), with the goal of isolating the independent effects of each predictor. The limitation of such variable-centered approaches is that they cannot account for the intra-individual interactions among various EI competencies in jointly influencing the outcome. For example, if two students had comparable overall levels of EI but differed in terms of their relative strengths and weaknesses on particular EI dimensions, would their long-term university outcomes differ? Several EI theorists have suggested that such within-person discrepancies across different EI domains may constitute important sources of variability in and of themselves (Fiori, 2009; Gohm & Clore, 2000). From an applied standpoint, too, knowing which unique configurations of EI competencies represent particularly vulnerable EI profiles would help inform more effective institutional practices for identifying and assisting at risk students.
In the current investigation, we evaluated the relationship between trait EI and degree completion outcomes over a multiyear period and from a person-centered perspective. Registration status in a four-year degree program (graduated vs. withdrew) was assessed six years following students’ initial enrolment (150% time graduation rate is a standard performance indicator in institutional research; Knapp, Kelly-Reid, & Ginder, 2010). Within- and between-person differences in EI were explored using latent profile analysis (LPA), a model-based classification technique that assigns persons into homogeneous groups, or latent classes, based on similarities in their scoring patterns (Lubke & Muthén, 2005). The derived EI profiles were expected to differ both quantitatively, in terms of the overall EI level, and qualitatively, in terms of the unique configurations of relative strengths and weaknesses on the individual EI dimensions (Marsh, Lüdtke, Trautwein, & Morin, 2009). In light of the latter, the LPA solution was expected to provide greater explanatory utility than the traditional variable-centered analyses. This would be demonstrated if latent class membership was found to be a stronger predictor of graduation outcomes than scores on the individual EI dimensions.
Method
Participants
The sample consisted of 1,015 undergraduate students (282 men, 732 women, 1 gender unreported) enrolled in a four-year degree program at a medium-sized university in Central Ontario, Canada. Participation in the study was limited to full-time first-year students between the ages of 17 and 21 years (M = 19.23, SD = 0.71) who had graduated from high school within two years prior to entering university. In terms of ethnicity, majority of the participants (92.1%) identified themselves as White/Caucasian, 2.7% as Asian, and the remaining 5.2% represented a mix of other cultural backgrounds.
Measures
EI profile indicators
Students’ EI profiles were constructed from scores on the Emotional Quotient Inventory: Short Form (EQ-i:S; Bar-On, 2002), a brief self-report instrument commonly used for assessing trait EI in postsecondary settings. The EQ-i:S contains 35 items measuring EI competencies in four domains: Interpersonal (10 items), Intrapersonal (10 items), Adaptability (7 items), and Stress Management (8 items). Scores on the four EI subscales can be further summed to provide a total EQ score. In addition, the EQ-i:S contains a 10-item qualifier scale of General Mood, which measures general level of emotional positivity/negativity, and a 6-item validity scale of Positive Impression, which serves as an indicator of excessively positive or socially desirable responding. The EQ-i:S items are worded in the form of short self-statements rated on a 5-point Likert-type scale (1 = very seldom true of me to 5 = very often true of me) and take approximately 10 min to complete. Higher scores on the total EQ scale and the four EI subscales reflect higher levels of self-perceived emotional and social competency. The multidimensional structure of the EQ-i:S assessment has been validated with undergraduate students (Parker, Keefer, & Wood, 2011), and the EQ-i:S technical manual reports acceptable levels of internal consistency (Cronbach’s alphas > .70) for the subscale and total scale scores in the general adult population (Bar-On, 2002). In the present sample, Cronbach’s alpha coefficients were .79 for the Interpersonal scores, .82 for the Intrapersonal scores, .81 for Adaptability, .70 for Stress Management, and .86 for total EQ.
University records
With participants’ consent, the following information was obtained from the university registrar’s records: high school GPA (measured on a 100% scale, available for 899 participants); registration status at a 6-year follow-up (graduated vs. withdrew); and for participants who did not complete their degree, the length of study (in years) prior to withdrawal.
Procedure
The data were collected in two waves: At the beginning of the participants’ first term at the university (Time 1) and at a 6-year follow-up (Time 2). Time 1: Newly registered students were approached by the researchers during the introductory week activities (held in the first week of September) and asked to volunteer for a study on “personality and academic success”. At that time, consenting participants completed the EQ-i:S and provided permission to obtain their high school GPA and to track their subsequent degree progress via official university records. Time 2: Participants’ EQ-i:S scores and high school GPA obtained at Time 1 were matched with their registration status obtained at Time 2 6 years later. By that time, 86% of the participants (n = 868; 225 men, 642 women, 1 gender unreported) had completed their degree and graduated from the university, whereas the remaining 14% (n = 147; 57 men, 90 women) left without completing their studies. Of the latter group, 16% (n = 23) attended the university for one year, 32% (n = 47) for two years, 28% (n = 41) for three years, and 24% (n = 36) for 4 years.
Statistical Analyses
LPA
To identify groups of students with similar EI profiles, a sequence of LPA models with increasing numbers of latent classes (from 1 to 10) was fit to the EQ-i:S data using the maximum likelihood estimator with robust standard errors implemented in Mplus Version 5.21 (Muthén & Muthén, 2009). Scores on the four EQ-i:S subscales (Interpersonal, Intrapersonal, Adaptability, and Stress Management) served as indicators of the latent class variable. Class-specific indicator means and variances were allowed to vary across classes, but within-class residual covariances among indicators were fixed to zero in line with the LPA assumption of local independence (Lubke & Muthén, 2005). To guard against the potential problem of local maxima, each LPA model was estimated using 1,000 random sets of start values and 100 final-stage optimizations. For each LPA model, the following parameter estimates were computed: posterior probabilities of latent class membership, relative class sizes, and class-specific indicator means and variances.
Because there is no single rule for determining the correct number of latent classes, model selection was based on a combination of tests of statistical significance, information-based model fit indices, classification statistics, and substantive considerations (Lubke & Muthén, 2005; Marsh et al., 2009). First, the upper limit on the number of latent classes needed to obtain good fit to the data was determined using the parametric bootstrap likelihood ratio test (BLRT) with 100 bootstrap draws. The BLRT provides an unbiased empirical estimate of a p-value for the statistical log likelihood difference test comparing incremental fit of a given model relative to a model with one fewer latent class. Next, models yielding significant BLRT results (p < .01) were compared on three commonly used information-based indices: the Akaike Information Criterion (AIC), the Bayesian Information Criterion (BIC), and the sample-size adjusted BIC, where the lowest index value indicates the model with the most optimal number of latent classes. Recent simulation studies have shown that the BIC tends to outperform other indices in correctly identifying the best-fitting model (Nylund, Asparouhov, & Muthén, 2007); therefore, the BIC results were given more weight in the present study. The models were also compared on how well they classified participants into latent classes according to the entropy statistic, where values closer to 1 indicate higher classification accuracy. Finally, among models with comparable model fit and entropy values, preference was given to the most parsimonious and theoretically interpretable solution.
Follow-up analyses
Participants were assigned into classes on the basis of the posterior probability estimates from the most optimal LPA solution. To validate the nature and distinctiveness of the latent classes, a discriminant function analysis (DFA) was performed on the four EQ-i:S subscale scores as predictors of latent class membership. Class differences in the background and outcome variables were also examined. The relationship between EI and graduation outcomes was tested in two sets of logistic regression analyses. The first set of analyses reflected the traditional variable-centered approach, where graduation status (1 = graduated, 0 = dropped out) was regressed onto the EQ-i:S subscale scores. The second set of analyses reflected a person-centered approach, where graduation status was regressed onto the posterior probabilities of membership in each LPA class. Wherever significant, effects of the background variables (age, gender, and high school GPA) were taken into account. All follow-up analyses were done in statistical package for the social sciences (SPSS) Version 15.
Results
Derivation of Latent Classes
Of the one- to ten-class LPA models tested, the BLRT results were significant for models with one to eight latent classes (p < .01). Model fit indices and classification statistics for these eight models are presented in Table 1. In terms of model fit, the AIC and the adjusted BIC values continued to decrease across the full range of models tested, suggesting that the more latent classes are added, the better. However, the more sensitive BIC index indicated that the five-class solution was in fact the most optimal. In terms of classification accuracy, the highest entropy values were associated with five-, six-, and eight-class solutions. However, models with more than five classes were less parsimonious, containing at least one very small class composed of 1% or fewer cases. Examination of class-specific parameter estimates indicated that these additional classes did not represent new or substantively different EI profiles from those identified in the five-class solution. Overall, the five-class LPA model provided the most optimal balance between statistical fit, model parsimony, and substantive interpretation. For ease of communication, the five latent classes were labeled A, B, C, D, and E in order of their decreasing total EQ scores. The relative sizes of these classes in the sample were 39%, 43%, 11%, 4%, and 3%, respectively.
Model Fit Indices and Classification Statistics for One- to Eight-Class Latent Profile Analysis Solutions
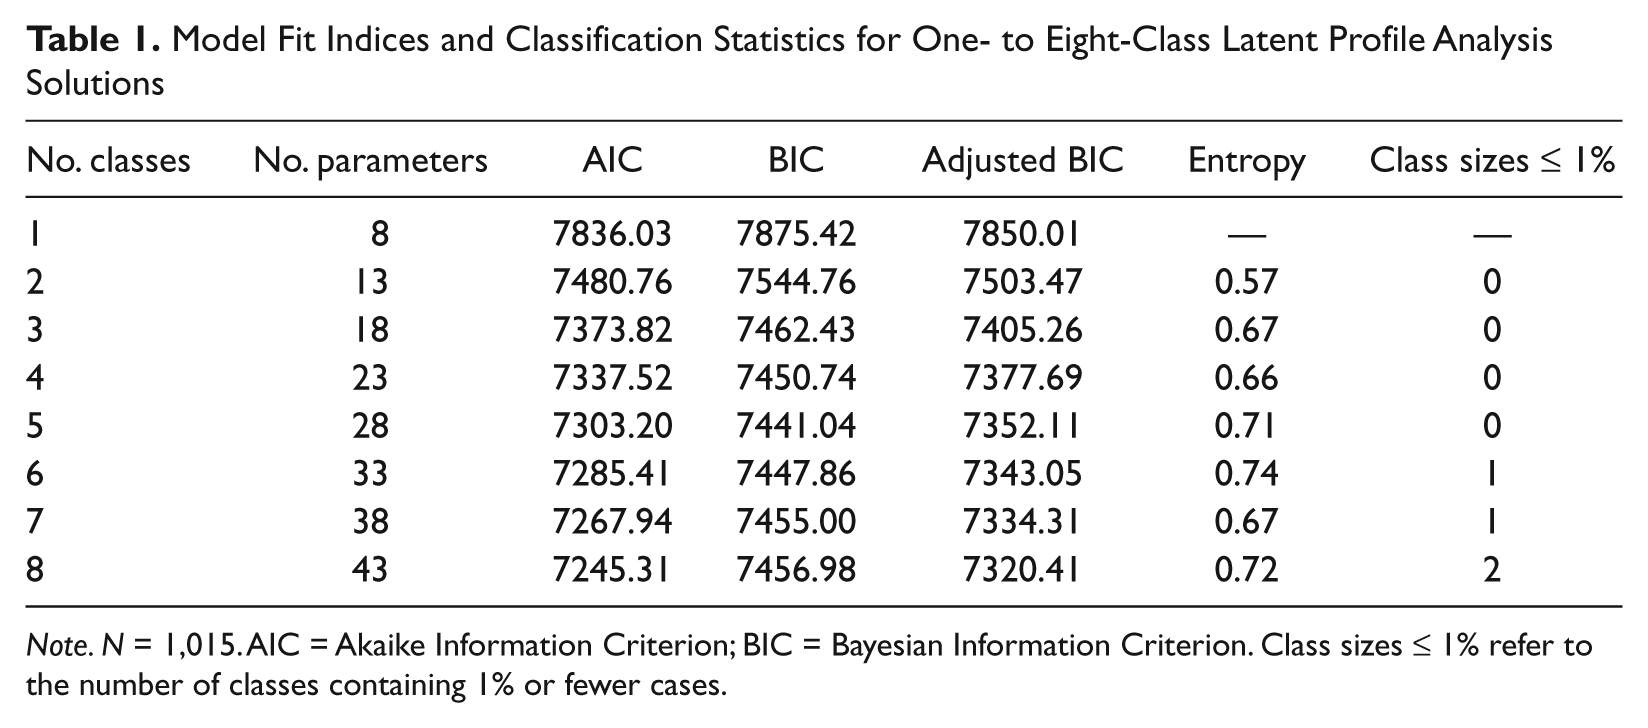
Note. N = 1,015. AIC = Akaike Information Criterion; BIC = Bayesian Information Criterion. Class sizes ≤ 1% refer to the number of classes containing 1% or fewer cases.
The extent and nature of class differences were validated in a follow-up DFA. Almost all of the participants (97.2%) were correctly classified into their respective LPA classes on the basis of the EQ-i:S subscale scores, indicating that the derived classes were very well differentiated. Most of the variance in the latent class membership was collectively explained by the first (76.8%) and second (21.2%) discriminant functions (depicted in Figure 1). Based on the pattern of standardized coefficients, the first discriminant function (x-axis) represented the overall level of EI, where positive x-values denote higher EI and negative x-values denote lower EI. The second discriminant function (y-axis) represented the degree of dispersion within a profile, where y-values close to zero denote less discrepancy, and y-values that deviate from zero in either direction denote more discrepancy, across individual EI dimensions. Based on the locations of group centroids (black boxes in Figure 1), Class A was characterized by a high overall level of EI (positive x-values) and a well-balanced profile of strengths and weaknesses (around zero on the y-axis). Classes B and C had average levels of EI (around zero on the x-axis), but Class B had a more balanced EI profile (closer to zero on the y-axis) than Class C. Classes D and E had low overall levels of EI (negative x-values) and were both characterized by large discrepancies across individual EI dimensions.

Plot from the discriminant function analysis depicting locations of the latent classes along two discriminant functions representing elevation (x-axis) and dispersion (y-axis) of the Emotional Quotient Inventory: Short Form subscale scores.
Figure 2 depicts graphical profiles of the standardized EQ-i:S score means for the five latent classes (see Table 2 for class means, standard deviations, and statistical test results). In line with the DFA results, members of Classes A and B presented consistent scores across all four EI dimensions, with Class A scoring higher, on average, than Class B. In contrast, members of Classes C, D, and E showed marked discrepancies in scores on several EI dimensions. For example, Class C had particularly high Interpersonal scores but low Stress Management scores; Class D showed a reverse pattern, with high Stress Management scores but low Interpersonal scores; and class E had disproportionately low scores on both of these dimensions.
Descriptive Characteristics of the Latent Classes
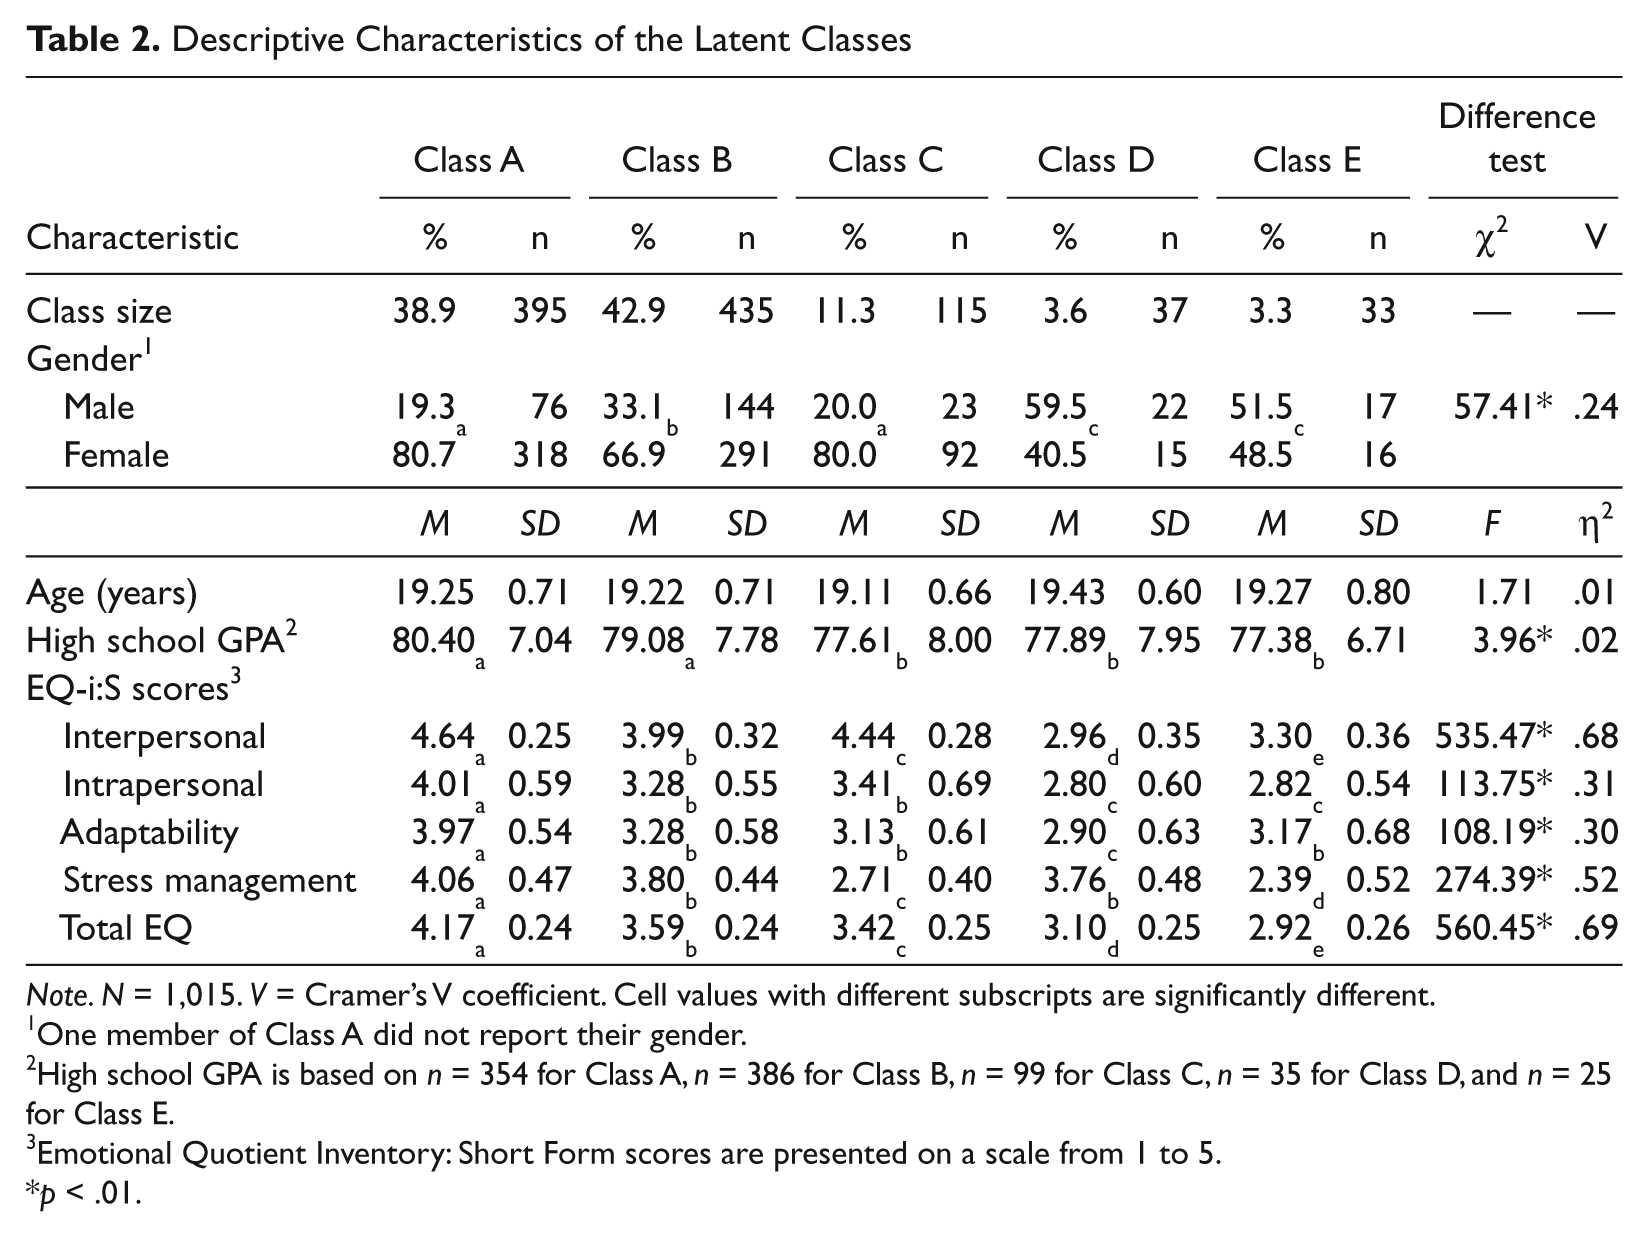
Note. N = 1,015. V = Cramer’s V coefficient. Cell values with different subscripts are significantly different.
One member of Class A did not report their gender.
High school GPA is based on n = 354 for Class A, n = 386 for Class B, n = 99 for Class C, n = 35 for Class D, and n = 25 for Class E.
Emotional Quotient Inventory: Short Form scores are presented on a scale from 1 to 5.
p < .01.
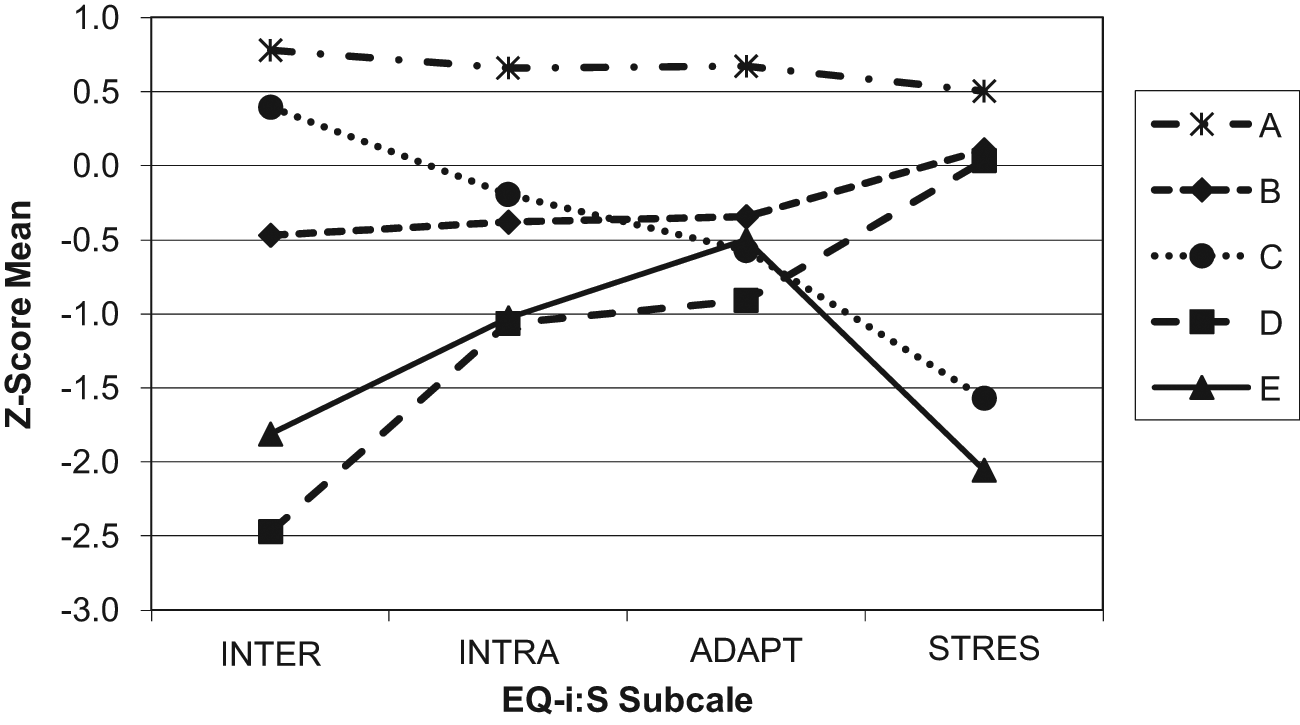
Latent class profiles of z-score means for the Emotional Quotient Inventory: Short Form subscales. INTER = Interpersonal; INTRA = Intrapersonal; ADAPT = Adaptability; STRES = Stress Management.
Class characteristics with respect to the background variables are summarized in Table 2. Because of the restricted age range in the present sample (17 to 21 years), no significant age differences could be detected (p > .05). The female to male ratio was highest in Classes A and C (4:1), comparable to the full sample in Class B (2½:1), and lowest in Classes E (1:1) and D (1:1½). A multivariate analysis of variance comparing the EQ-i:S subscale scores for men and women revealed that the observed gender differences among classes could be fully accounted for by gender differences in the Interpersonal scores (Wilks’ lambda = .92, univariate F [1, 1012] = 83.99, p < .001, η2 = .08). A small effect of high school GPA was also found: Members of Classes A and B had earned higher grades, on average, than members of Classes C, D, and E.
Prediction of Graduation Outcomes
At the bivariate level, greater likelihood of successful degree completion at a 6-year follow-up was significantly associated with female gender (Wald’s χ2[1, n = 1,014] = 10.08, p < .05, odds ratio [OR] = 1.81), higher high school GPA (Wald’s χ2[1, n = 899] = 38.91, p < .01, OR = 1.09), higher total EQ (Wald’s χ2[1, n = 1,015] = 5.73, p < .05, OR = 1.65), Interpersonal (Wald’s χ2[1, n = 1,015] = 4.92, p < .05, OR = 1.44), Stress Management (Wald’s χ2[1, n = 1,015] = 5.26, p < .05, OR = 1.35), and Adaptability scores (Wald’s χ2[1, n = 1,015] = 4.69, p < .05, OR = 1.33), and lower probability of having a Class E profile (Wald’s χ2[1, n = 1,015] = 6.12, p < .05, OR = 0.32). When the effects of the background variables were controlled in a multivariate regression design, the incremental contributions of the EQ-i:S subscale and total EQ scores were no longer significant (p > .05). However, membership in Class E remained a significant unique predictor of graduation status even after the effects of high school GPA and gender were taken into account (Wald’s χ2[1, n = 899] = 3.93, p < .05, OR = 0.33).
A follow-up examination of class differences in graduation and dropout rates revealed that approximately twice as many students in Class E left university without completing their degree as in Classes A, B, or C (see Table 3). Although the dropout rate for students in Class D was comparably high, their pattern of withdrawal was significantly different from that in Class E. If the majority of leavers in Class E (67%) withdrew within the first two years of study, the majority of leavers in Class D (78%) persisted beyond third or fourth year. By comparison, the ratios of early to late withdrawals in Classes A, B, and C were between 1:1 and 1:2.
Graduation Outcomes by Latent Class
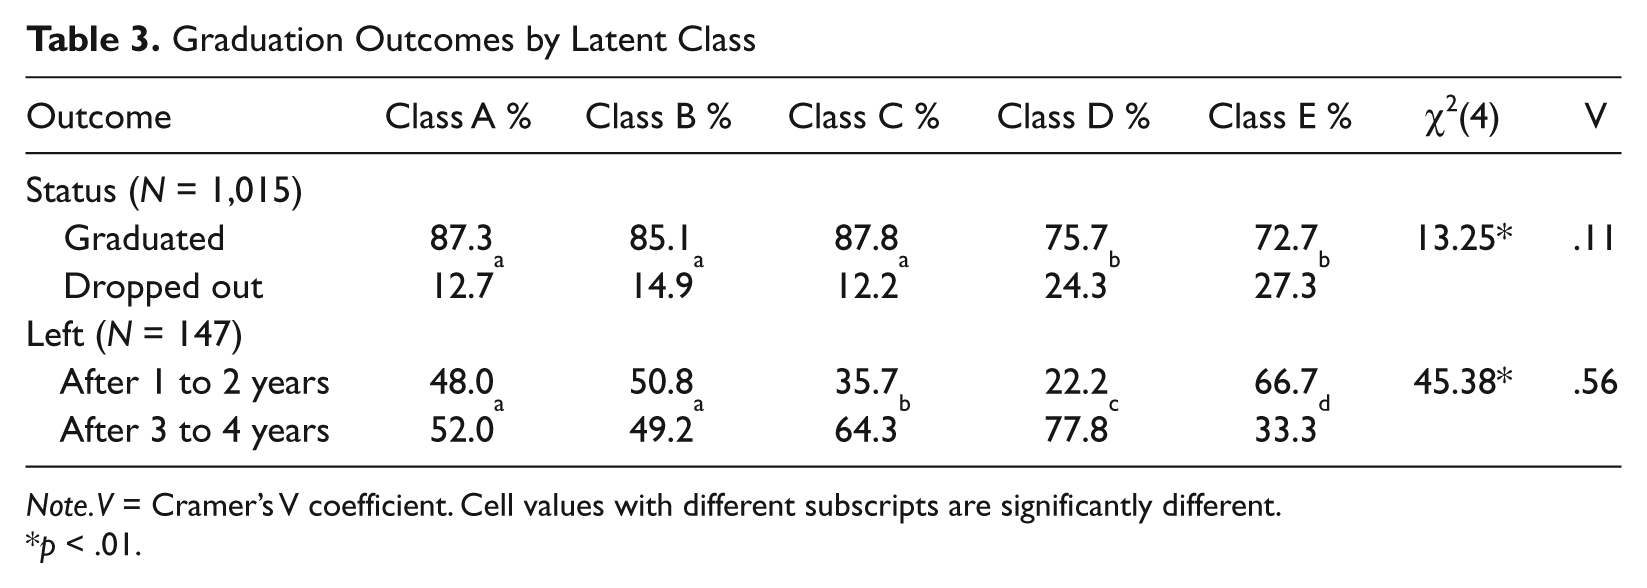
Note. V = Cramer’s V coefficient. Cell values with different subscripts are significantly different.
p < .01.
Discussion
This study explored the applied utility of trait EI for predicting university completion outcomes over a multiyear period and from a person-centered perspective. All predictions made for this study were supported by the data. As expected, the link between EI and multiyear graduation outcomes was found to be less robust than the effects typically reported for first-year retention rates (Parker et al., 2006; Qualter et al., 2009). The reduction in predictive utility over time can be partly attributed to the temporal instability of the EI construct, as many EI competencies tend to increase naturally with age and life experience (Parker, Saklofske et al., 2005). In addition, some loss of meaningful variance was expected to arise from the limitations of traditional variable-centered methods for analyzing complex heterogeneous data. Using an alternative person-centered procedure, we identified five unique profiles of EI scores that differed not only quantitatively (high vs. low levels), but also qualitatively (relative strengths vs. weaknesses). Of the four EQ-i:S dimensions, scores on the Interpersonal and Stress Management subscales produced the most pronounced within-person discrepancies in all possible low-high combinations. As anticipated in the presence of such nonlinear effects, consideration of the integrated EI profiles provided greater explanatory utility than examination of scores on the individual EI dimensions, both in terms of statistical significance and the number of novel insights gained about the nature of the EI—persistence relationship.
One novel contribution is the finding that successful degree completion was associated with lower probability of having a low-EI profile but not with greater probability of having a high-EI profile. Although this distinction may seem trivial, it nevertheless has tangible practical implications for educators interested in the most efficient ways of allocating institutional resources to students who would benefit from them the most. Our results suggest that intervention efforts focused on raising students’ EI from low to average would have greater impact on the retention and completion rates than programs aimed at raising EI from average to high. Indeed, students with an average overall EI profile (Class B) did not differ significantly from high-EI students (Class A) either in high school preparation or in long-term graduation outcomes.
Although low EQ-i:S scores were found to be more diagnostic of potential retention problems than high EQ-i:S scores, not all students scoring in the low to average range were equally at risk. The greatest vulnerability was associated with a combination of low overall EI level and notable absence of individual strengths in any particular EI domain. Students presenting this EI profile (Class E) were significantly more likely to leave university without completing their program, with the majority of leavers withdrawing within the first two years of study. By comparison, having at least one solid area of personal strength appeared to offset the negative effects of deficits in other areas. For example, although students with very low Interpersonal scores were at an elevated risk for degree noncompletion, those who also had high Stress Management scores (Class D) persisted longer with their studies than those who scored low on both dimensions (Class E). Knowledge of these nuanced interactions can be quite valuable for designing client-centered interventions aimed at neutralizing personal vulnerabilities by honing complementary skill sets.
Taken together, the results of the present study complement and extend previous research on trait EI and post-secondary attainment, showing that socioemotional competencies can have long-lasting implications for students’ persistence at university. Several features of the study’s design lend confidence to this conclusion, including large sample size, control of the background variables, 6-year follow-up period, and objective behavioral outcome criteria. However, some limitations must also be acknowledged. First, our operationalization of degree noncompletion was university-specific and did not allow us to distinguish between students who discontinued their education entirely versus students who changed universities and completed their degree elsewhere. Because changing schools to better match one’s interests is often an adaptive decision for the student (Wintre, Bowers, Gordner, & Lange, 2006), this group of leavers would likely resemble successful graduates in terms of their initial EI profiles. Likewise, we did not differentiate between students who left university for personal reasons (e.g., homesick, stressed out, and unprepared) versus students who left for reasons outside of their control (e.g., financial, family, and health). Because only the former type is expected to be theoretically related to EI, taking into account students’ reasons for withdrawal should further improve EI’s predictive use. It might also be fruitful to explore differences in EI profiles across various programs of study. Would the same combination of EI competencies predict success in highly competitive professional programs (e.g., nursing, business, and engineering) as in liberal arts and sciences?
These limitations notwithstanding, the person-centered approach adopted in the present study revealed some novel insights about the nature of EI and its functions, the implications of which extend far beyond the post-secondary context. Although the notion of within-person variability in EI competencies has been entertained in the past (Fiori, 2009; Gohm & Clore, 2000), this was the first study to document the existence of such differences empirically. Future work in this area should focus on cross-validating the latent-class profile structure in independent samples of students and adults, followed by a systematic examination of the correlates uniquely associated with each EI profile. It would also be important to widen the scope of these profiles to include a combination of trait and ability aspects of EI and to use multiple measurement formats as indicators of latent class membership. Such a multitrait-multimethod approach would also help circumvent potential issues with response biases and fakability inherent in self-report scales such as the EQ-i:S (Grubb & McDaniel, 2007), while capitalizing on recent developments in performance-based EI measurement (Roberts, MacCann, Matthews, & Zeidner, 2010). Integrated knowledge of these differential effects would not only help rectify some outstanding controversies regarding the nature of the EI construct (Mayer et al., 2008), but also inform more effective applications of the EI theory in diverse spheres of life functioning.
Footnotes
Declaration of Conflicting Interests
The author(s) declared no potential conflicts of interest with respect to the research, authorship, and/or publication of this article.
Funding
The author(s) disclosed receipt of the following financial support for the research, authorship, and/or publication of this article: This study was supported by a research grant to the second author from the Social Sciences and Humanities Research Council of Canada (SSHRC) and SSHRC graduate scholarships to the other authors.