
Abstract
The 10-item General Self-Efficacy Scale (GSES) was developed to assess an individual’s beliefs to cope with a variety of situations in life. Despite the GSES being used in numerous research from researchers in different countries and presented in different languages, little is known about the use of its validity in an Asian culture. The aim of the present study is to assess the measurement invariance of the GSES across two countries with distinctly different cultures. Results revealed that although there was full metric invariance in the two samples, only partial scalar invariance was achieved as the intercepts of 4 out of 10 items were non-invariant.
Introduction
Self-efficacy is commonly defined as “people’s beliefs about their capabilities to produce designated levels of performance that exercise influence over events that affect their lives” (Bandura, 1994, p. 71). Arguably the foundation of human agency, self-efficacy plays a central role in the self-regulation of motivation through goal challenges and outcome expectations (Bandura, 2001). Although self-efficacy was originally proposed as a domain-specific construct, a construct of general self-efficacy defined by one’s confidence in coping across various situations has also been proposed (Jerusalem & Schwarzer, 1981). Empirical studies examining general self-efficacy have found that it was predictive of one’s perceived ability in a variety of tasks and moderated the influence of previous performance on subsequent specific self-efficacy formation. Some of these outcomes included optimism, perception of challenge, proactive coping, and self-regulation. Arising from their discussion of general self-efficacy, Schwarzer and Jerusalem (1995) developed the General Self-Efficacy Scale (GSES) to measure the construct.
The GSES was originally developed in German as a 20-item scale by Jerusalem and Schwarzer (1981) before it was modified as a 10-item version in 1995. In the GSES, the 10 items assess an individual’s beliefs to cope with a variety of situations in life. Since its development, the GSES has been translated into 26 other languages by various researchers. Compared with other scales that were designed to assess self-efficacy, the GSES explicitly measures the degree of personal agency, that is, the belief that an individual’s actions are responsible for successful outcomes. In particular, the scale was created with the aim to predict coping with daily hassles as well as adaptation after experiencing all kinds of stressful life events. Despite the GSES being used in numerous research from researchers in different countries and presented in different languages (e.g., Luszczynska, Gutierrez-Dona, & Schwarzer, 2005), a review of the literature revealed that little is known about the use of its validity in an Asian culture. Chen (2008) conducted a comprehensive review on cross-cultural measurement invariance (MI) literature and found close to three quarters of these studies failed to find metric invariance in the scales that they examined. Possible reasons for measurement non-invariance included cross-cultural difference in response styles and differences in the meaning of measurement anchors. Therefore, the aim of the present study is to assess the MI of the GSES between the original country where the scale was developed, Germany, and one Asian country, Singapore. It is expected that the findings of this study could inform and further our understanding of the cross-cultural validity of the GSES. Figure 1 shows the measurement model of the GSES.
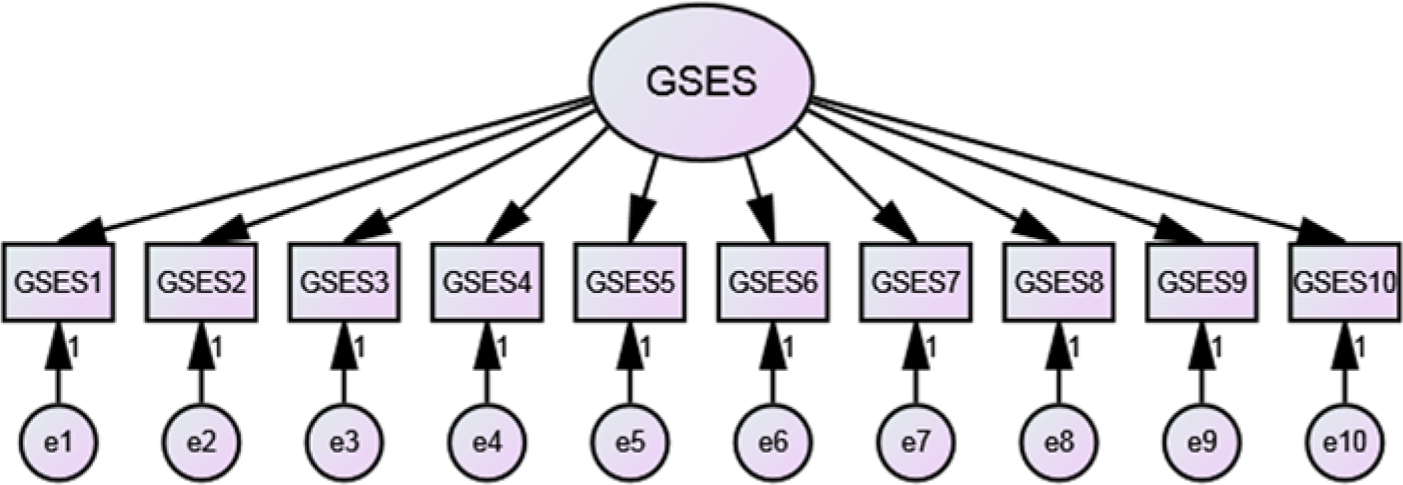
Measurement model of the GSES.
Method
Participants and Procedure
Two samples totaling 498 participants (258 females) were used in this study. These participants were from Germany (GE; n = 240; 129 females) and Singapore (SG; n = 258; 162 females). Data from SG were obtained by this author from a secondary school and those for GE were taken from a large-scale 24-nation study on the GSES involving 19,896 participants (Scholz, Doña, Sud, & Schwarzer, 2002). The German sample was selected because it shared a similar profile as the SG sample in age and educational level and that its culture was distinctly different from SG.
The SG participants completed an online version of the 10-item GSES during school hours and, on average, they spent about 15 min to complete the GSES. The mean age was 13.00 (standard deviation [SD] = 0.00) for the German sample and 13.57 (SD = 0.78) for the Singaporean sample. As the German sample data were adopted from a previous study (Scholz et al., 2002), it was not known why the SD was zero although it could be speculated that the age variable had been simplified for data entry purposes.
Instrument
The English version of the 10-item GSES (Schwarzer & Jerusalem, 1995) was administered to the SG sample. Those from GE had completed the German version of the GSES. All items were hypothesized to load on one factor and worded in the same direction. Each item was measured using the original 4-point scale of the GSES, with 1 = not at all true and 4 = exactly true. The Cronbach’s alphas are .73 in GE and .95 in SG. The scale has been shown to have meaningful nomological networks with psychological well-being constructs, such as moderate positive correlations with optimism, expected social support and proactive coping, and moderate negative correlation with depression, anxiety, and work burnout in both Western and Eastern samples (Scholz et al., 2002).
Results
Descriptive Statistics and Modeling Information
The data (N = 498) were examined for out-of-range responses (i.e., responses greater than 4), and none were detected. As the data were either taken from a previous study (GE sample) or collected using an Internet survey questionnaire online form that prevented submission of incomplete forms (SG sample), no missing data were found. The means and SDs for each item in the GSES ranged from 2.83 to 3.08 and 0.63 to 0.71, respectively. All confirmatory factor analyses (CFAs) were based on maximum likelihood estimation with robust standard errors because these analyses do not assume strict multivariate normality. Model comparisons were based on a scaled chi-square difference test particularly designed to contrast among models with robust standard errors (Yuan & Bentler, 1998).
Tests of MI
The first step in establishing MI involves testing whether the same factor structure exists across the two countries (configural invariance; for example, Vandenberg & Lance, 2000). A good fitting unconstrained model would indicate that a common factor structure is shared across the GE and SG samples. Following, using a multigroup CFA based on mean and covariance structure (MACS) analysis, MI was tested in the following sequence of nested models (Meredith, 1993): metric (weak) invariance where factor loadings were constrained to be equal across countries and, scalar (strong) invariance where factor loadings and item intercepts were constrained to be equal across countries. If support for metric and scalar invariance is found, it would be reasonable to infer that the GSES has been measured on the same scale across the two cultures and, in general, these tests were sufficient conditions for MI to establish cross-group equality (Millsap, 1998).
Model fit was evaluated using the χ2, Tucker–Lewis index (TLI), comparative fit index (CFI), root mean square error of approximation (RMSEA), and standardized root mean square residual (SRMR). Hu and Bentler (1999) proposed TLI and CFI statistics greater than .90 as an “adequate” model fit and values greater than .95 as a “good” model fit. Those for RMSEA and SRMR values with less than .06 and .08, respectively, are “good” and values between .08 and .10 are considered “mediocre,” respectively.
A test of the configural model revealed an acceptable level of invariance although the TLI value is mediocre, χ2 = 182.518; TLI = .913; CFI = .932; RMSEA (95% confidence interval [CI]) = .080 [.069, .092]; SRMR = .041; Figure 1. Traditionally, the chi-square test is used to compare between nested models, but it has been known to be oversensitive to large sample sizes (Chen, 2007). Following Chen’s recommendations, ΔCFI, ΔRMSEA, and ΔSRMR will be used, in addition to the Δχ2 in this study, to assess for evidence of invariance. The criteria for invariance will be ΔCFI ≤ - .01, ΔRMSEA ≤ .015, and ΔSRMR ≤ .03 for tests of factor loading invariance and ΔCFI ≤ -.01, ΔRMSEA ≤ .015, and ΔSRMR ≤ .01 for test of scalar invariance.
Following a well-fitting baseline (configural) model, the model was then constrained by the factor loadings across the two countries to test for metric invariance. These constraints increased the chi-square value by 11.673 (Δχ2), gaining 9 degrees of freedom (Δdf). Because the metric invariance model (Model 2) is nested within the baseline model (Model 1), a scaled chi-square difference (Δχ2) test (Yuan & Bentler, 1998) was performed. Given that the Δχ2 of 11.673 with Δdf = 9 was not statistically significant (p = .23), and that the change in the values of the CFI, RMSEA, and SRMR was within recommended guidelines, metric invariance was supported.
Scalar invariance was tested by constraining the intercepts of the 10 items to be the same across the two countries. A Δχ2 test was performed comparing the scalar invariance model (Model 3) against the metric invariance model (Model 2) and neither the Δχ2 test nor the ΔCFI supported the scalar invariance model. Following the recommendations of Byrne, Shavelson, and Muthén (1989), a partial scalar invariance test was conducted. This involved removing the constraint on the intercept of each item in turn to identify the non-invariant item(s). The process revealed that the intercepts of Items 2, 3, 5, and 6 were non-invariant; hence, they were removed to allow a test for partial scalar invariance (Model 3a). When compared with Model 2, the partial scalar invariance model (Model 3a) with six items resulted in a drop of model fit by Δχ2 of 9.601 with Δdf = 5. As the Δχ2 was not statistically significant (p = .09) and the change in the values of the CFI, RMSEA, and SRMR were within recommended guidelines, partial scalar invariance was supported (Table 1).
Summary of Invariance Tests Across the Germany (n = 240) and Singapore (n = 258) Samples.

Note. df = degrees of freedom; TLI = Tucker–Lewis index; CFI = comparative fit index; RMSEA = root mean square error of approximation; CI = confidence interval; SRMR = standardized root mean square residual.
1 = configural model; 2 = metric model; 3 = scalar model; 3a = partial scalar model.
The chi-square difference values have been scaled based on Yuan and Bentler’s (1998) method, because each model is estimated with robust standard errors.
p < .001.
Discussion
This study aims to examine the MI of the 10-item GSES proposed by Schwarzer and Jerusalem (1995) across two countries with distinctly different cultures. From the data obtained with samples of students ranging 13 to 14 years old from GE and SG, there was support for the one-factor hypothesized model that underlies the GSES. The results also supported a full configural and metric invariance model. For the scalar invariance model, it was partially supported as the intercepts of 4 out of 10 items were non-invariant.
Given that individual’s environment, personal factors, and behavior have an impact on his or her perceptions about the self and what he or she can accomplish, self-efficacy can influence subsequent behavior (Bandura, 1997). As the samples in this study were taken from different countries, it was possible that the environmental and personal factors that shape the beliefs about personal agency in students would be different to an extent that affected the scalar invariance. In addition, owing to the different language used in the GSES to measure the German and Singaporean students, the results of this study may have been subjected to the effect of language translation in the scale items. However, the translated version of our English GSES scale was the most common and widely accepted version; thus, the possible issue of translation error should be minimal. In addition, the validity of the scale was supported by the meaningful nomological networks of the GSES with psychological well-being measures in both Western and Eastern countries (Scholz et al., 2002) although subtle cross-cultural differences in the meaning of general self-efficacy may exist, and these subtle differences may affect attainment of MI among items as well as scale validity. Finally, East Asians have shown distinct response styles, such as frequent use of moderate response anchors and higher acquiescence response styles (Chen, 2008). These response styles may not have affected metric invariance in the current study, but their combination may create unpredictable effects that hinder scalar invariance. Attainment of metric invariance supports the use of the GSES scale to examine cross-cultural correlational differences, but absence of scalar invariance implies the presence of bias in cross-cultural mean comparison with this scale.
Future research on the GSES may include additional validation involving participants across the spectrum of ages, including the very young and old. This would contribute to our understanding of self-efficacy in terms of its stability and progression through the life span. Given that the internal consistency for GSES was found to be higher in SG as compared with GE, future studies should examine the role of response styles, such as frequent use of moderate response anchors among East Asians, as well as other factors that affect examination of cross-cultural mean difference. Invariance testing should also be continued to establish validity across cultures, languages, and educational systems. Finally, the concurrent and nomological validity of the GSES could be examined to support its currency and relevance in psychological and educational research.
Footnotes
Declaration of Conflicting Interests
The author(s) declared no potential conflicts of interest with respect to the research, authorship, and/or publication of this article.
Funding
The author(s) received no financial support for the research, authorship, and/or publication of this article.