
Abstract
School-level contextual factors have been found to influence reports of school climate. The purpose of the current study was to evaluate the extent to which these associations are related to the school climate traits being measured or the methods (i.e., informants) used to obtain them. Data from a multilevel multitrait–multimethod (MTMM) design in which structurally different and interchangeable students (n = 45,641) and teachers (n = 12,808), residing within 302 high schools, responded to items measuring four dimensions of school climate were evaluated through a multilevel correlated trait–correlated method (CT-CM) latent analysis that allowed for the estimation of both school-level trait and informant-based method factors. The resulting trait and method factors were regressed on several school-level contextual variables. Results indicated that the percentage of students receiving free and reduced-price meals (FRPM) in schools was associated with both school climate traits and informant-based method factors, school size and the percentage of minority students in schools were associated with some traits, and school size was associated with student method effects. Findings support the use of controlling for school-level contextual factors in school climate research.
The assessment of school climate has taken on national importance with implications for improving school quality and student outcomes (Dary & Pickeral, 2013). School climate is a multifaceted construct that typically captures the “quality and character of school life” and is “based on patterns of people’s experiences of school life and reflects norms, goals, values, interpersonal relationships, teaching and learning practices, and organizational structures” (Cohen, McCabe, Michelli, & Pickeral, 2009, p. 182). Numerous studies have demonstrated the far-reaching effects of a positive school climate on a variety of important outcomes. For example, positive school climates are associated with higher achievement levels (Wang & Degol, 2016), increased student engagement (Cornell, Shukla, & Konold, 2016), less teacher victimization (Gottfredson, Gottfredson, Payne, & Gottfredson, 2005), bullying (Cornell, Shukla, & Konold, 2015), and lower drop-out rates (Jia, Konold, & Cornell, 2015).
Given the importance of school climate to educational experiences and outcomes, schools are understandably motivated to obtain accurate assessments of their schools’ standing on this construct to identify areas for improvement. In measuring school climate, two methodological issues are worthy of consideration. The first concerns the informant source and the second pertains to contextual factors that are beyond the control of the school that might bias perceptions of a school’s climate.
Evaluations of school climate are typically based on reports provided by students and/or teachers that can be considered structurally different because their perceptions may vary as a function of their roles and opportunities for observation. For example, Ramsey, Spira, Parisi, and Rebok (2016) point out that students typically experience school through expectations that are established and applied by teachers. Consequently, each holds the potential to contribute unique and relevant perspectives on common school climate traits (Konold & Cornell, 2015b). In many instances, reports of school climate are obtained from multiple interchangeable raters within a given school and structural class (e.g., multiple students) to obtain a more reliable estimate of their groups’ perspective. The use of multiple informants and sources is considered best practice in assessments that rely on rating-based systems of measurement (Bauer et al., 2013), and the use of multiple interchangeable raters within two or more structurally different groups is said to provide “the most comprehensive insights into validity” (Eid et al., 2008). Schools that elect to employ only one informant source (e.g., students) may draw different conclusions about the climate of their schools than if a different source (e.g., teachers) were solicited (Ramsey et al., 2016).
Perceptions of school climate have also been found to be influenced by a variety of contextual characteristics that are often beyond the schools’ control (Gottfredson et al., 2005). Research indicates that school size, socioeconomic characteristics (Koth, Bradshaw, & Leaf, 2008), neighborhood characteristics (Maume, Kim-Godwin, & Clements, 2010), and race may all have an impact on reports of school climate. For example, non-White students have been found to report more negative school climates than their White peers (Pedro, Gilreath, & Berkowitz, 2016), and informants may have difficulty separating school climates from the experiences they have outside of schools in their neighborhoods and surrounding communities (Wang & Degol, 2016). These findings have largely come by way of associations between observed measures of school climate and the contextual variables that are characteristic of the schools being evaluated. However, observed variables are comprised of variance that can be attributed to the school climate traits that are the focus of measurement, as well as non-trait-related variation that results from the method used to obtain the ratings (e.g., rater or informant) and other residual sources (Konold & Cornell, 2015b). Consequently, it is unclear whether these contextual variables have a direct influence on the school climate traits that are being measured through survey reports, on the non-trait-related sources of bias that can be attributed to the rater, or both.
Contemporary latent variable methods for evaluating multitrait–multimethod (MTMM) data collections provide a useful starting point for disaggregating the influences of trait (e.g., school climate) and method (e.g., rater) effects from observed variable ratings of school climate. For example, both the correlated trait–correlated method (CT-CM; Lance, Noble, & Scullen, 2002) and correlated trait–correlated method minus one (CT-C(M − 1); Eid et al., 2008) models represent advancements beyond inspection of zero-order correlation matrices in our ability to understand the contaminating influences of method effects and, through extension, variables that might be associated with the trait and method factors. Both estimate a set of common traits across observed variables obtained by different raters and a set of method factors that can be specified to model the influence of different raters on the observed measures. Although there are model trade-offs with respect to data and design limitations, the CT-C(M − 1) model is typically best suited for instances in which there are relatively few interchangeable raters available within the investigated structural classes and when there is a clear choice of structural class to serve as the contrasting group (see Bauer et al., 2013, for a recent review).
Present Study
A variety of factors have been reported to influence perceptions of school climate through methods that focus on relationships among observed measures of school climate and contextual variables that are characteristic of the schools being evaluated. However, the extent to which these contextual variables influence trait- versus non-trait-related sources of variance in observed variables that can be attributed to the informant providing the ratings remains unclear. The current study uses a multilevel MTMM design in which multiple interchangeable raters within two structural classes (i.e., student and teachers) evaluated their schools in relation to disciplinary structure, respect for students, student engagement, and the prevalence of teasing and bullying (PTB). A multilevel CT-CM latent analysis allowed for the estimation of both school-level trait and informant-based method factors. The resulting school-level trait and informant-based method factors were regressed on a variety of school-level contextual variables (i.e., school size, population density, the percentage of students receiving free and reduced-price meals (FRPM), and the percentage of minority students in the school) to evaluate the extent to which they were associated with trait and nontrait sources of variance attributable to rater effects.
Method
Participants and Settings
Student and teacher data were obtained from the 2014 Virginia state’s Secondary School Climate Survey (Cornell et al., 2014) that used a standardized set of instructions for completion. The survey was administered in public schools with Grades 9 to 12. Schools were located in urban (20.7%), suburban (31.6%), town (4.6%), and rural (43.0%) regions. Of the 324 eligible schools, teacher surveys (n = 13,455) were obtained from 310 schools, and student surveys (n = 52,012) were returned from 323 schools.
On average, participants completed the 100-item survey in 14.2 min (SD = 9.2). To improve data quality, a multistage screening procedure resulted in the removal of students (1.3%) and teachers (5%) for completing the survey too rapidly (i.e., less than 6 min). Students were also removed (an additional 6.4%) from the sample for not being truthful as revealed through responses to two validity questions (i.e., “I am telling the truth on this survey” and “How many of the questions on this survey did you answer truthfully?”) that were not asked of teachers. Failure to screen samples through the use of completion time and validity items has recently been shown to have adverse impacts on the validity of survey data (Jia, Konold, Cornell, & Huang, 2016). Finally, the sample was further restricted to schools with a minimum of five valid teacher respondents (see Konold et al., 2014, for additional technical information and description of sampling procedures).
The resulting analytic sample consisted of n = 12,808 teachers (66.8% female) and n = 45,641 students (51.2% female) from 302 different schools. Teaching experience was captured in the categories of more than 10 years (58%), 6 to 10 years (22%), 3 to 5 years (11%), and 1 to 2 years (9%). To ensure teacher anonymity, no other demographic information was obtained on teachers. Students were distributed across ninth (26.1%), 10th (25.8%), 11th (24.8%), and 12th (23.3%) grades. The racial breakdown of students was 60.1% White, 18.0% Black, 3.9% Asian, 1.6% American Indian or Alaska Native, and 0.9% Native Hawaiian or Pacific Islander, with an additional 15.5% identified with more than one race. Approximately 18.9% of the students reported speaking a language other than English at home, and parent education was reported in the categories of completed postgraduate studies (19.9%), completed a 4-year college degree (24.1%), completed a 2-year college or technical education degree (16%), graduated from high school (31.2%), and did not graduate from high school (8.8%).
Measures
Surveys were administered online to students in classrooms under teacher or school staff supervision using a standardized set of instructions. The complete online survey consisted of 100 items and included the four scales examined in the present study. Recent multilevel confirmatory factor analyses (CFAs) and structural models of these items and scales revealed good psychometric properties (i.e., strong pattern coefficients and meaningful reliability estimates at the level of the informant and school) when examined on the basis of student (Konold & Cornell, 2015a) and teacher (Huang et al., 2015) responses. Given the focus on method effects in obtaining school-level estimates on the four scales used in the current study, it was important that items comprising each of the scales be the same for students and teachers. Items that were common to both the student and teacher versions of the scales are shown in Table 1, along with their psychometric characteristics that were estimated in the current sample. As described below, these estimates were obtained from multilevel CFAs of student and teacher responses in which each item was specified to be influenced only by its respective factor. Factor pattern loadings, as indictors of construct validity, were strong for the majority of items, and school-level reliabilities were appreciable.
Common Student and Teacher Item Multilevel Completely Standardized CFA, Reliability, Consistency, and Specificity Estimates.
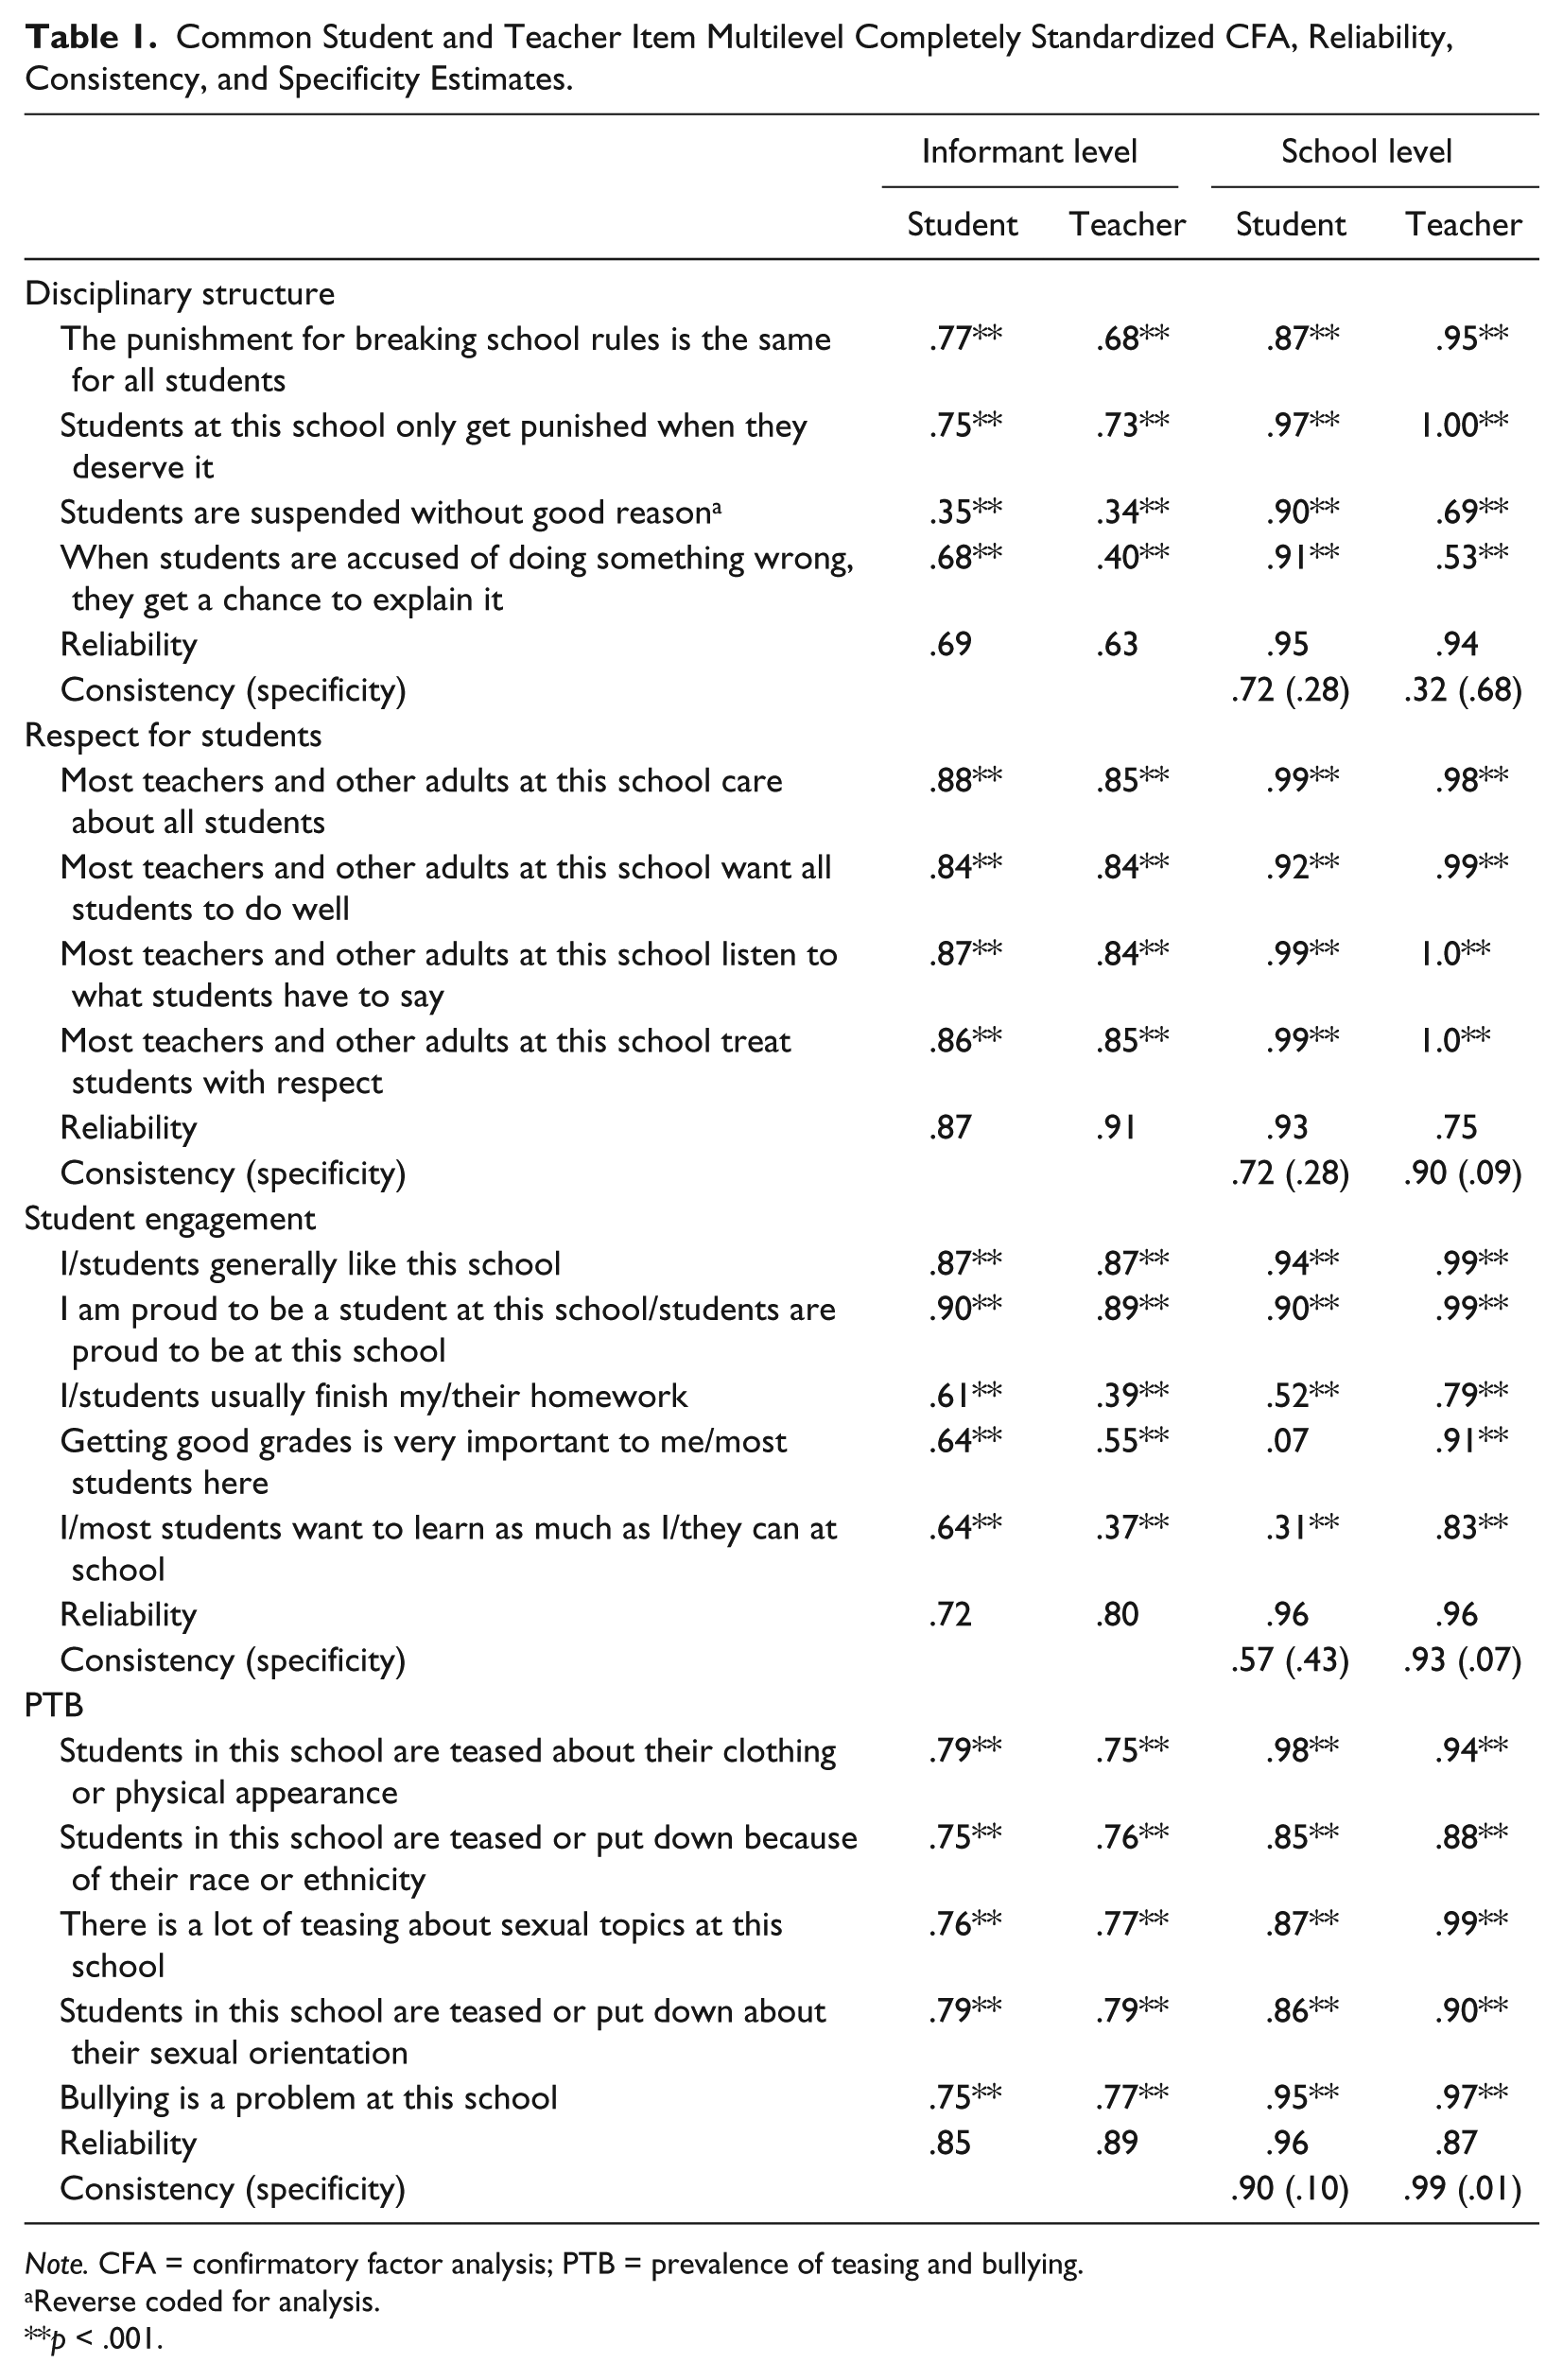
Note. CFA = confirmatory factor analysis; PTB = prevalence of teasing and bullying.
Reverse coded for analysis.
p < .001.
The four scales that were used in the current study included Disciplinary Structure, Respect for Students, Student Engagement, and the Prevalence of Teasing and Bullying. Disciplinary Structure was designed to measure the perceived fairness and strictness of school discipline. It was derived from previous research on the concept of school disciplinary structure (Gregory, Cornell, Fan, Sheras, & Shih, 2010) and the Experience of School Rules scale developed by federal authorities for use in the School Crime Supplement to National Crime Victimization Survey (National Center for Education Statistics, 2005). Respect for Students was aimed at measuring perceived support in the form of teacher–student relationships. The items were derived in part from the Learning Environment scale (Austin & Duerr, 2005). Student Engagement was derived from the Commitment to School measure (Rochester Youth Development Study; Thornberry, Lizotte, Krohn, Farnworth, & Jang, 1991) and captures elements of both affective and cognitive engagement. Last, the Prevalence of Teasing and Bullying scale assessed the extent of bullying and teasing students observed at school. Consistent with other measures of bullying (e.g., Juvonen, Nishina, & Graham, 2000; Olweus, 2007), item content was not limited to use of the term “bullying,” but included general forms of peer harassment associated with bullying (e.g., students here often get teased about their clothing or physical appearance).
Higher scores on these measures are reflective of more positive aspects of disciplinary structure, respect for students, and student engagement, and more negative reflections of teasing and bullying in schools. The school-level predictors of school size, percent FRPM, and percent minority (race) were obtained from the Virginia Department of Education. Population density was calculated as the number of individuals residing in a town divided by the geographic area of the town, where both estimates were obtained from U.S. Census reports.
Analytic Plan
Prior studies have demonstrated strong psychometric support for the four measures of Disciplinary Structure, Respect for Students, Student Engagement, and PTB in both student and teacher samples (Huang et al., 2015; Konold & Cornell, 2015a). However, the current study utilized a reduced set of items in the calculation of these measures to ensure that differences in item characteristics were not responsible for variances in method effects across informant types.
As a result, multilevel CFAs were conducted as a preliminary step on the 22 common items that were combined to create the four scales used in the substantive structural models described below. Separate analyses were conducted on the student and teacher samples, and each item was linked only to its respective factor as shown in Table 1. Student- and teacher-level reliabilities were estimated through Cronbach’s alpha, and school-level reliabilities for the resulting factors were estimated by (K[ICC] / ([K − 1][ICC] + 1), where K = the average cluster (or school) size and ICC = intraclass correlation for a factor (
Two multilevel MTMM designs were examined through CT-CM analyses. The first was a measurement model (Model 1), and the second was a substantive model that was derived on the basis of former through inclusion of school-level contextual predictors of the resulting trait and method factors (Model 2). Model 1 is illustrated in Figure 1 and specified a set of common school-level trait factors (i.e., Disciplinary Structure through PTB), a pair of unique (i.e., Level 1 individual informants) method factors, and a pair of common (i.e., Level 2 school) method factors. It includes observed variables for each trait (enclosed in boxes) that were completed by both students and teachers. The unique Level 1 influences of the structurally different (i.e., students vs. teachers) and interchangeable (i.e., multiple student raters and multiple teacher raters) informants are modeled on the left side of Figure 1 to have a direct influence on these observed variables.
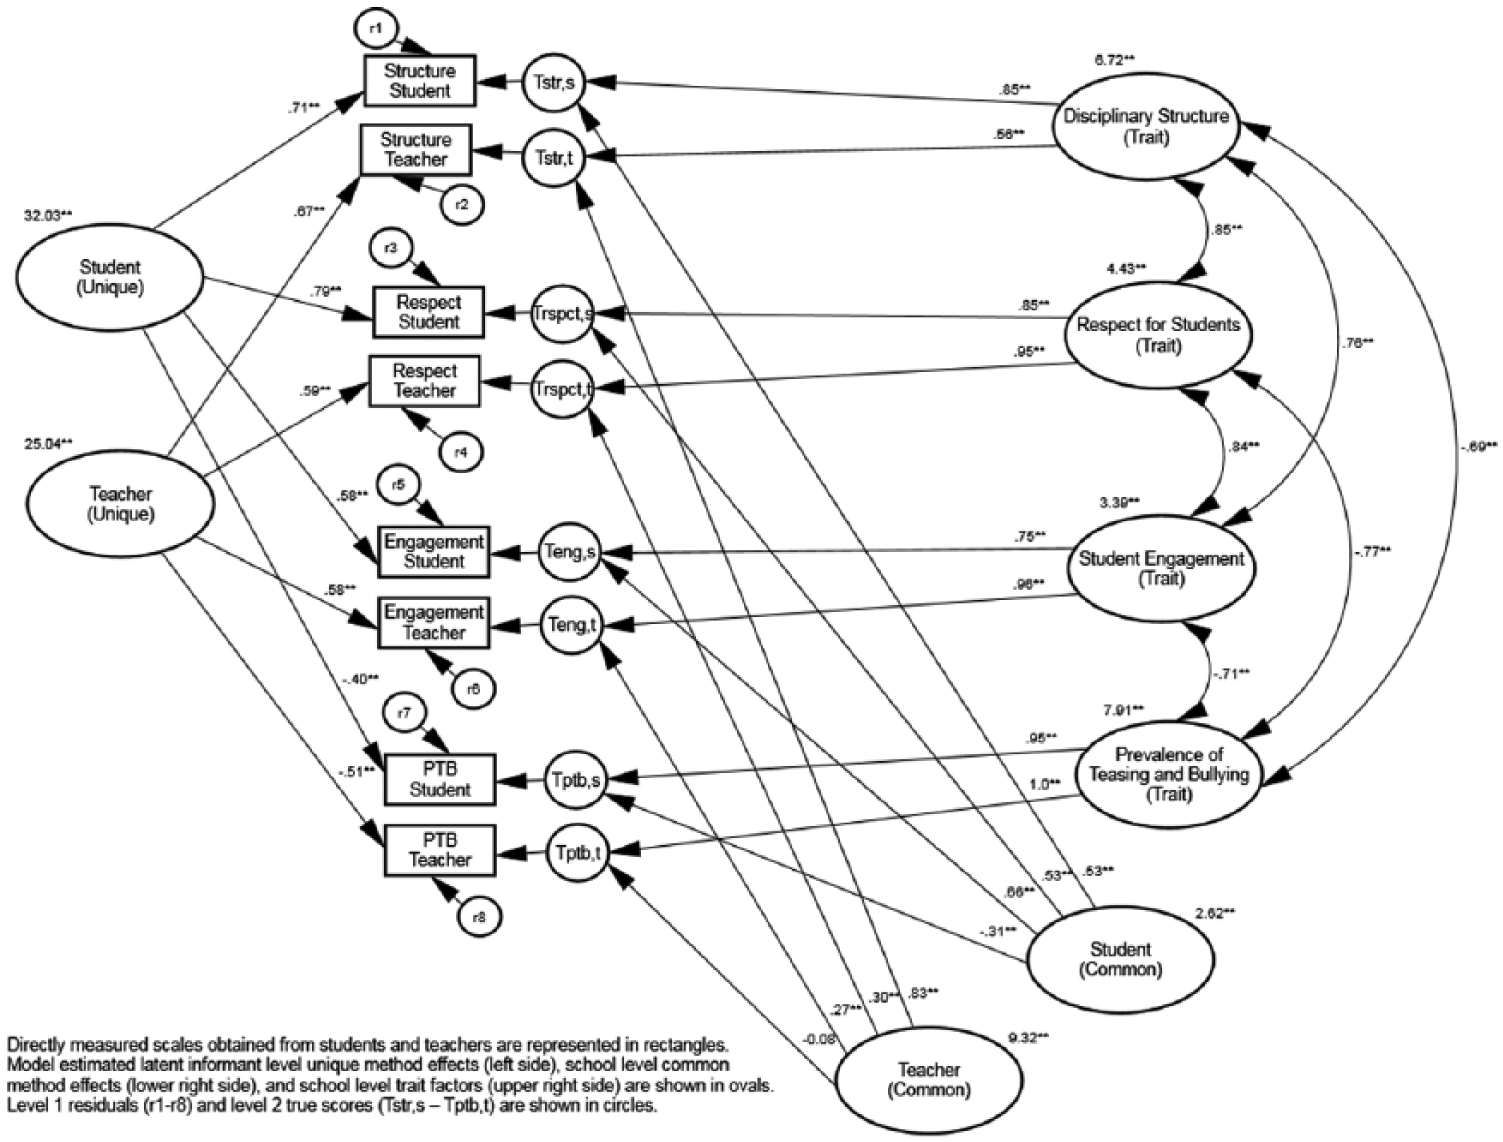
Multilevel multitrait–multimethod latent model of student and teacher assessments of school characteristics.
Estimated observed variable residuals (r1-r8) and school-level true (T) scores for each measured trait obtained by students (s) and teachers (t) are represented by circles (Tstr,s to Tptb,t) in Figure 1. True scores represent the expected value (or average) of school ratings across interchangeable common raters within a school (Carretero-Dios, Eid, & Ruch, 2011). As described in part elsewhere (Konold & Cornell, 2015b), these true scores are modeled to be directly influenced by the common school-level traits and the common school-level method effects that are shared among all students’ or teachers’ ratings of a given school (see right side of Figure 1). Consistency coefficients that measure the proportion of true score variance attributable to the trait factors and common method specificity coefficients that evaluate the proportion of true score variance attributable to the school-level method factors (Eid et al., 2008) are reported. All raw score scales were separately standardized for students and teachers (M = 50, SD = 10) to aid interpretation. Model 2 was similar to Model 1 with the exception that the two school-level method factors and four trait factors were regressed on school size, population density, the percentage of students receiving FRPM, and the percentage of minority students in the schools.
Four measures of fit were considered in evaluating model quality: the Tucker–Lewis index (TLI), comparative fit index (CFI), root mean square error of approximation (RMSEA), and the standardized root mean square residual (SRMR) (Browne & Cudeck, 1993; Hu & Bentler, 1995). These four measures generally range between 0 and 1.0. Values of .90 or greater (Bentler & Bonett, 1980) or .95 or greater (Hu & Bentler, 1999) on the first two measures are often taken as evidence of good fitting models. Alternatively, smaller RMSEA and SRMR values support better fitting models, with RMSEA values of .10 or less (Fan, Thompson, & Wang, 1999), and SRMR values of .08 or less (Hu & Bentler, 1999) representing good fit. The maximum likelihood model estimates were obtained through Mplus Version 7.4.
Results
Measures of fit for the preliminary step of evaluating the factor structure of the 22 items used in the creation of the observed variable scales, through multilevel CFAs, were adequate for both students (TLI = .925, CFI = .937, RMSEA = .048; SRMRL1 = .069, SRMRL2 = .091) and teachers (TLI = .891, CFI = .908, RMSEA = .050; SRMRL1 = .053, SRMRL2 = .091). Completely standardized factor coefficients at the informant level were all large and statistically significant (see Table 1). Likewise, with only one exception, all school-level factor loadings were large and statistically significant. Student- and school-level reliability estimates are also presented in Table 1. School-level estimates that are the focus of the current study were generally appreciable for scales of this size, and informant-level estimates were generally adequate.
CT-CM Measurement Model (Model 1)
The multilevel CT-CM measurement model illustrated in Figure 1 (i.e., Model 1) demonstrated good fit (TLI = .979, CFI = .987, RMSEA = .017; SRMRL1 = .015, SRMRL2 = .051). ICCs reflect the degree to which variability in individual informant ratings can be explained by the schools in which they reside. Values ranged from .06 to .09 across the four student measures and from .07 to .28 across the four teacher measures. Completely standardized Model 1 estimates are shown in Figure 1 to provide context for the resulting coefficients. All coefficients linking the student and teacher unique method factors to their respective indicators were found to be statistically significant, and moderate to large in magnitude (see left side of Figure 1). Results also indicated statistically significant variation among students (S2 = 32.03) and teachers (S2 = 25.04) with respect to the unique method factors. These nontrait method effects are unique in that they reflect the extent to which different students and different teachers vary in their ratings of the same traits (Carretero-Dios et al., 2011; Nussbeck, Eid, Geiser, Courvoisier, & Lischetzke, 2009). Contrasts between these Level 1 unique method factor variance estimates and the commonly shared (i.e., Level 2) student (S2 = 2.62) and teacher (S2 = 9.32) method factor variance estimates suggest that much of the unique method variance is due to rater differences that are shared among similar informant types. In other words, much of the nontrait informant-based variation among n = 45, 641 interchangeable students and n = 12,808 interchangeable teachers is captured at the school level.
The influence of the common school-level method effects (i.e., effects that are common to all teachers or students) on the average school-level ratings obtained by students and teachers represents shared method effects among similar informant types (see bottom right side of Figure 1). All coefficients were statistically significant and moderate for students, and three of the four estimates were statistically significant for teachers. Statistically significant completely standardized estimates for students ranged in absolute value from .31 to .66, and from .27 to .83 for teachers.
School-level consistency coefficients estimate the proportion of true score variance that is accounted for by the trait factors (Eid et al., 2008). These estimates that are free of both residual variance and unique method variance ranged from .57 to .90 for students and from .32 to .99 for teachers. School-level common method specificity coefficients that estimate the proportion of true score variance that is attributable to the common informant effects ranged from .10 to .43 for students and from .01 to .68 for teachers. In combination, the sum of these consistency and specificity coefficients explains 100% of the true score variance in this model. Consistency coefficients are a reflection of convergent validity with respect to student and teacher reports of a given trait (i.e., how consistent are the reports obtained by these informants; Nussbeck et al., 2009). By contrast, common specificity coefficients reflect the extent to which reports obtained by students and teachers are specific to a given informant type, and reveal a shared common perspective among students and teachers that is independent of the four school traits being measured. With one exception, all consistency coefficients were greater than their corresponding specificity estimates across traits and informants (see Table 1).
Contextual Correlates of Common School-Level Method Effects
The influence of school contextual variable on the common school-level informant-based method effects and school-level trait factors were evaluated through expansion of the multilevel CT-CM model (i.e., Model 1) to include direct paths linking the four school predictors to the latent teacher and student school method factors. Here, the two school-level method factors and four trait factors were regressed on school size, population density, the percentage of students receiving FRPM, and the percentage of minority students in the schools. The resulting model (i.e., Model 2) demonstrated good fit (TLI = .979, CFI = .990, RMSEA = .015; SRMRL1 = .015, SRMRL2 = .064). Completely standardized coefficients linking the school-level predictors to the school-level informant effects are shown in the first two columns of Table 2. School size (βstandardized = .36, p < .001) and FRPM (βstandardized = .69, p < .001) were both found to be statistically linked to students’ nontrait informant effects, and accounted for 51% of the variance in the common student method factor Squared Multiple Correlation (SMC) = .51). FRPM (βstandardized = .36, p < .001) was the only predictor associated with teachers’ nontrait informant effects, and accounted for 14% of the variance in the common teacher method factor (SMC = .14).
Completely Standardized Coefficients Linking School-Level Predictors to School-Level Method and Trait Factors.
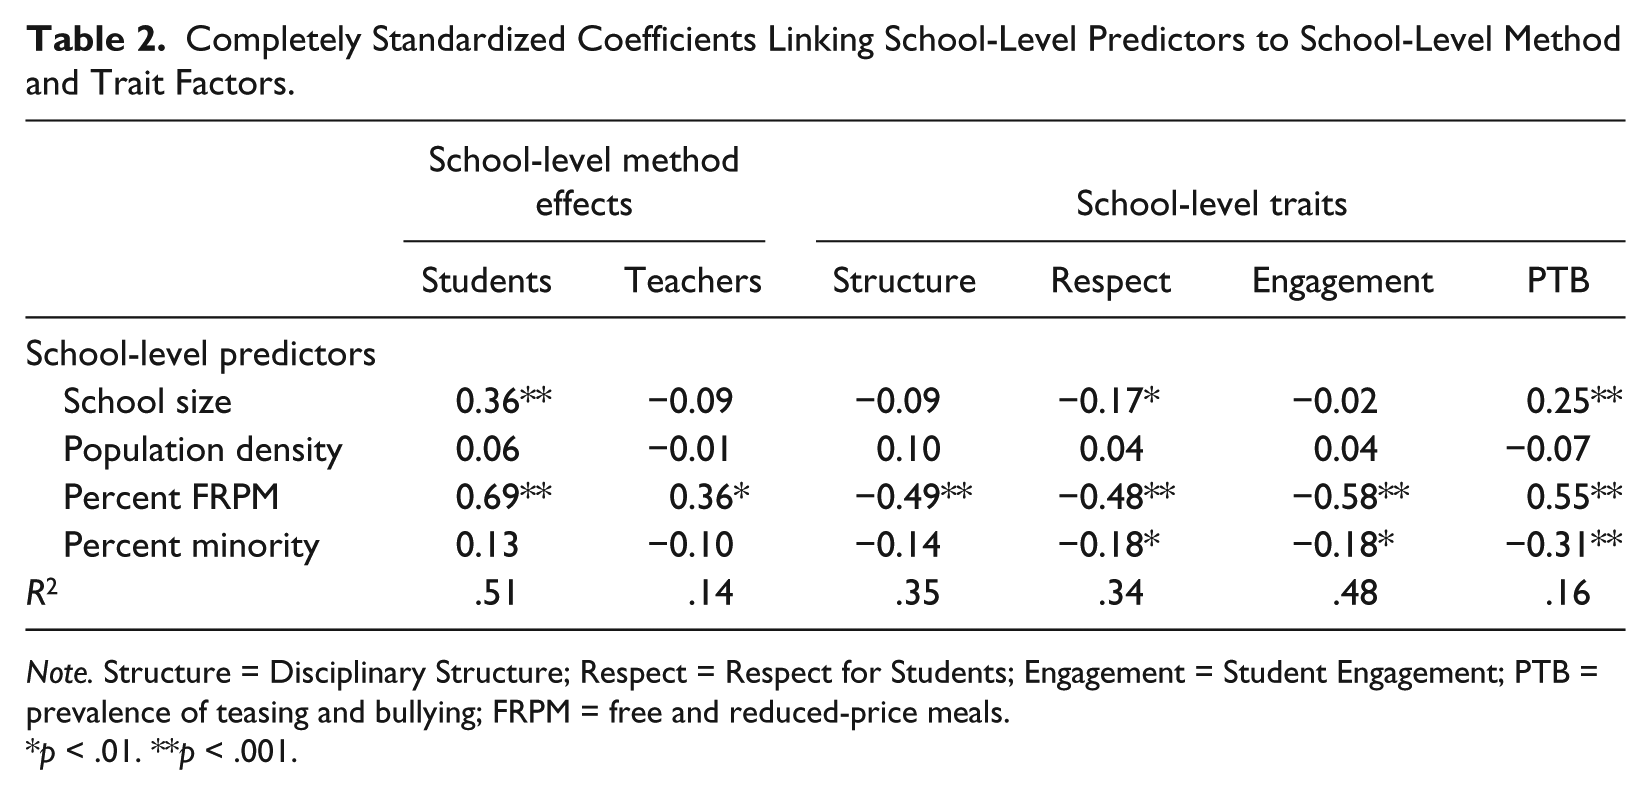
Note. Structure = Disciplinary Structure; Respect = Respect for Students; Engagement = Student Engagement; PTB = prevalence of teasing and bullying; FRPM = free and reduced-price meals.
p < .01. **p < .001.
Contextual Correlates of School-Level Traits
Completely standardized coefficients linking the school-level contextual variables to the trait factors are shown in the last four columns of Table 2. FRPM was statistically linked to all four school trait factors (ps < .001), percent minority was associated with three of the four traits (ps < .01), and school size was a statistically significant predictor for two of the four traits (ps < .01). The amount of variance in the trait factors accounted for by the school-level predictors ranged from 16% to 48% (see last row of Table 2).
Discussion
Despite recognition that the use of multiple informants is important in evaluations involving subjective assessments, it is estimated that nearly 50% of school climate research relies only on the perspectives of students, and about 17% of the studies incorporate the perspectives of multiple informants (Wang & Degol, 2016). Although students and teachers reside within the same schools, there are a number of reasons why their perspectives of their school climates might differ (e.g., socialization with different peer groups, different roles in the school). Results from the multilevel CT-CM measurement model (Model 1) evaluated in the current study revealed that reports obtained by both students and teachers were meaningfully related to the school-level traits they were designed to measure. All trait factor loadings were large and statistically significant, and consistency coefficients were meaningful across student and teacher reports, suggesting that both students and teachers contribute to our understanding of school climate traits. Thus, although differences in observed ratings of school climate are not uncommon across different informant types that reside within the same school (Ramsey et al., 2016), results of the current study suggest that these cross-informant ratings are tapping into the traits they were intended to measure.
At the same time, reports obtained by students and teachers were influenced by informant effects that were unrelated to the traits being measured or other residual sources of variation. Evidence of this was revealed through common method specificity coefficients and common method factor loadings. With one exception, all school-level student and teacher method effect factor loadings were statistically significant and moderate in magnitude, where students showed less variation (S2 = 2.62) than teachers (S2 = 9.32).
The separation of observed score rating influences into components attributable to trait- and nontrait informant effects allowed for an examination of the associations among school-level contextual effects and these factors (i.e., Model 2). In combination, the investigated contextual variables accounted for appreciable amounts of school-level variation on the four investigated traits (
Consistent with past research documenting the influence of school-level socioeconomic status (SES) on observed measures of school climate (Vieno, Perkins, Smith, & Santinello, 2005), results of the current analysis of trait factors revealed that schools with higher percentages of students receiving FRPM had less disciplinary structure, less respect for students, less student engagement, and higher PTB. This was an expected finding given that schools with higher percentages of students receiving FRPM are likely to be situated in low-SES communities, where schools are under-resourced, less safe, and tend to provide lower quality classroom experiences (Aikens & Barbarin, 2008). At the same time, school-level FRPM was also found to influence the portions of both student and teacher rating effects that were unrelated to the traits being measured. This can most likely be explained by the fact that perceptions of one environment (e.g., schools) are likely to be influenced by other contexts in which the students and teachers reside (e.g., home, neighborhood; Wang & Degol, 2016). As a result, reports of school climates in schools with higher percentages of students receiving FRPM may be more likely to contain common biases of school characteristics that are unrelated to the particular traits of the school.
Likewise, larger schools were associated with lower levels of respect for students and higher PTB. These associations may be the result of feeling less safe and having a more diminished sense of belonging in larger schools (Koth et al., 2008). However, only the nontrait portions of student ratings were influenced by the size of their schools. This may reflect student feelings of being more disconnected in the environments of larger schools (Hellman & Beaton, 1986).
The percentage of minority students in the school was also related to three of the four trait factors. Here, too, results of the current analysis of trait factors align with those reported elsewhere (Bottiani, Bradshaw, & Mendelson, 2016), in that schools with higher percentages of minority students had lower levels of respect for students and lower student engagement. In addition, schools with higher percentages of minority students had a lower PTB. These current results align with research that has found greater ethnic diversity in schools to be associated with lower levels of harassment and victimization (Grahm, 2006; Juvonen, Nishina, & Graham, 2006). Fortunately, neither the percent minority nor population density were found to be associated with student or teacher-related method effects, and do not seem to play a role in contributing to non-trait-related sources of variance attributable to these different informants. Moreover, population density was also not found to be associated with any of the school-level trait factors. Although somewhat similar measures (e.g., urbanicity) have also failed to yield meaningful associations with reports of school climate (Waasdorp, Pas, O’Brennan, & Bradshaw, 2011), it may be that the use of population density in the current study was a distal proxy of community, and not likely to have captured the qualitative characteristics of community as they would relate to school environments. As a result, better indicators of neighborhood and surrounding community characteristics might reveal a more pronounced effect of the type that have been reported elsewhere (Wang & Degol, 2016), on both the trait and nontrait portions of school climate ratings.
There are likely many other contextual factors (e.g., student–teacher ratios) that are beyond the control of the school that might affect both school climate traits and the non-trait-related biases that informants bring to the measurement process, that were not available for investigation in the current study. At the same time, the combination of school-level contextual effects examined in the current study was found to have a pronounced influence on the traits of disciplinary structure, respect for students, and student engagement (
The current study extends previous work that has examined the effects of school-level contextual factors on observed variable ratings of school climate through separate evaluation of the trait and method effects that give rise to observed measures. Findings provide additional evidence that contextual school-level factors that are largely outside the control of the school can affect a variety of school-level climate traits, when effects attributed to the method used to measure those traits are removed. Moreover, these same contextual factors can have a measurable influence on nontrait sources of variation attributable to the informant. School climate investigators should consider controlling for these variables in research designs that attempt to illustrate the impacts of an intervention on improvements to the climates of schools.
Footnotes
Acknowledgements
The author thanks Donna Michaelis and Jessica Smith of the Virginia Department of Criminal Justice Services for their support of the Virginia Secondary School Climate Study, Dewey Cornell of the Curry School of Education at the University of Virginia, and other members of the project research team, including Anna Grace Burnette, Anna Heilbrun Catizone, Pooja Datta, Francis Huang, Yuane Jia, Marisa Malone, Patrick Meyer, and Kathan Shukla.
Author’s Note
The opinions, findings, and conclusions or recommendations expressed in this publication are those of the author and do not necessarily reflect those of the U.S. Department of Justice.
Declaration of Conflicting Interests
The author(s) declared no potential conflicts of interest with respect to the research, authorship, and/or publication of this article.
Funding
The author(s) disclosed receipt of the following financial support for the research, authorship, and/or publication of this article: This project was supported by Grant No. 2012-JF-FX-0062 awarded by the Office of Juvenile Justice and Delinquency Prevention, Office of Justice Programs, U.S. Department of Justice; and Grant No. NIJ 2014-CK-BX-0004 awarded by the National Institute of Justice, Office of Justice Programs, U.S. Department of Justice.