
Abstract
Many students struggle with the basic skill of writing, yet schools lack technically adequate screening measures to identify students at risk in this area. Measures that allow for valid screening decisions that identify students in need of interventions to improve performance are greatly needed. The purpose of this study was to evaluate the validity and diagnostic accuracy of early writing screeners. Two early writing screening measures, Picture Word and Word Dictation, were administered to a diverse sample of 95 kindergarten students, almost half of whom were classified as English language learners and almost 70% identified ethnically as Hispanic. It was hypothesized that the early writing screening measures would demonstrate moderate to strong relationships with a standardized norm-referenced measure of written expression and adequate diagnostic accuracy for identifying kindergarten students at risk. Findings indicate that concurrent validity coefficients for both Picture Word and Word Dictation tasks ranged from .32 to .70 with the Written Expression cluster of the Woodcock–Johnson Tests of Achievement–IV and .26 to .61 with the Writing Samples and Sentence Writing Fluency subtests. Diagnostic accuracy results suggest these measures are a promising option for screening early writing skills. Implications for practice and directions for future research are discussed.
Writing is a critical skill for school and career success. With the ubiquity of technology-based communication in the workplace (e.g., email, word processing), employers expect current and prospective employees to possess writing proficiency (National Commission on Writing [NCW], 2004, 2005). Despite the clear need for strong writing skills during school and beyond, national test data indicate that students largely lack proficiency in writing (National Center for Education Statistics [NCES], Institute of Education Sciences, & U.S. Department of Education, 2012). In fact, the vast majority of eighth- and 12th-grade students do not perform at the proficient level on national tests of writing (NCES, Institute of Education Sciences, & U.S. Department of Education, 2012). To identify students at risk for poor performance and to measure changes in skills in response to instructional support, technically adequate measures of writing suitable for these purposes are needed. Curriculum-based measurement (CBM) is one measurement approach that can serve both screening and progress monitoring purposes (e.g., L. S. Fuchs, 2004) and can be used to measure writing skills (McMaster & Espin, 2007). Existing research regarding written expression CBM (WE-CBM), however, focuses on students in elementary grades and beyond, with less attention given to the earliest levels at which intervention would be valuable. The purpose of this study was to examine the validity and diagnostic accuracy of two types of WE-CBM for kindergarten students.
Writing Skills
Writing skills enable students to succeed in coursework and to communicate their ideas effectively with others (Persky, Daane, & Jin, 2003). In addition, students with strong writing skills are frequently viewed favorably during college admissions and hiring decisions (NCW, 2004). In fact, level of writing proficiency has been found to differentiate individuals who attain high-paying, high-skill jobs, and more than half of the time, companies consider writing abilities when making promotion decisions (NCW, 2004). Despite evidence that writing is an essential skill for long-term success, student writing performance falls short of national standards.
National test data suggest that students struggle to perform adequately in writing. For example, in 2002, 69% of eighth graders and 77% of 12th graders performed below proficient on the national writing assessment (Persky et al., 2003). This pattern of performance has persisted for the last decade with approximately three quarters of eighth- and 12th-grade students failing to receive proficient ratings on national writing achievement tests (NCES, Institute of Education Sciences, & U.S. Department of Education, 2012). In 2010, 54% of graduating seniors taking the test were not prepared for college-level writing courses, and students who did not meet the SAT benchmark for college readiness were less likely to enroll in college (Wyatt, Kobrin, Wiley, Camara, Proestler, 2011).
One way to address the need to improve student writing skills is through a multitiered system of supports (MTSS). Accurate and efficient screening is a critical component of MTSS and is used to identify students at risk for poor performance to provide instructional support. Early identification of risk for writing difficulties facilitates the provision of early writing intervention to prevent academic difficulties in later grades (McMaster, Parker, & Jung, 2012; McMaster, Ritchey, & Lembke, 2011).
Early Identification
Early identification of students at risk for academic difficulties improves long-term school success and prevents the onset of more significant academic problems (L. S. Fuchs et al., 2007). Earlier identification of academic risk is associated with higher achievement in later grades because it allows for the implementation of preventive interventions to address identified skill deficits, thus avoiding the noted issues with the wait-to-fail model (e.g., D. Fuchs & Fuchs, 2006; Parker, Burns, McMaster, & Shapiro, 2012).
CBM is commonly used to screen for academic risk across grade levels and content areas (L. S. Fuchs, 2004; Shapiro, 2011) in the context of MTSS. Most research regarding CBM for screening is focused on reading (R-CBM; for example, Kilgus, Methe, Maggin, & Tomasula, 2014). Findings largely indicate that R-CBM is technically adequate for identifying students at risk for poor performance on high stakes measures (e.g., Keller-Margulis, Shapiro, & Hintze, 2008; Tindal, 2013). Although R-CBM is a well-established screening tool, WE-CBM has a less developed research base (e.g., McMaster & Espin, 2007).
Measures of Early Writing
Studies of early writing include a diverse collection of measures that sample a range of early writing skills. For example, studies at the kindergarten level include tasks that require writing letters, demonstrating knowledge of letter sounds and spelling, as well as writing sentences (Coker & Ritchey, 2014). Other types of writing tasks used in first grade, for example, include word and sentence copying, as well as word and sentence dictation (Hampton & Lembke, 2016) and picture-word prompts (McMaster, Du, & Petursdottir, 2009).
These early writing tasks are scored differently depending on what the student produces. For example, measures of letter writing are scored based on whether the letter is readable and can be identified (e.g., Coker & Ritchey, 2014; Ritchey, 2008) while measures of sound and word spelling are often scored based on whether the sound is correct or based on the correct spelling of all sounds in a word (e.g., Coker & Ritchey, 2014; McMaster et al., 2009). This is typically captured as correct letter sequences (CLS) or correct minus incorrect word sequences (CILS; for example, Hampton & Lembke, 2016) and is scored as correct word sequences (CWS) or correct minus incorrect word sequences (CIWS) for measures of sentence writing (SW). In addition, the total number of words written are also scored on tasks where sentences are required (e.g., McMaster et al., 2009) and a rubric approach (e.g., Coker & Ritchey, 2014) has also been used.
Early WE-CBM research has been guided by L. S. Fuchs’s (2004) three-stage model of research to establish the utility of CBM. Studies largely focus on Stages 1 and 2, the technical features of CBM scores such as validity and rates of growth (Coker & Ritchey, 2010; Hampton & Lembke, 2016; McMaster et al., 2011). Some research has also advanced to Stage 3 by examining instructional utility in the context of whether the measures are technically adequate for screening to identify students at risk for academic difficulties (Coker & Ritchey, 2014; Ritchey & Coker, 2013, 2014). The examination of both validity coefficients and diagnostic accuracy provide two different but important measures of validity. Validity coefficients are important indicators of the degree to which the measures being studied are related to an established measure of the construct of interest (American Educational Research Association, American Psychological Association, & National Council on Measurement in Education, 2014). Diagnostic accuracy, however, allows for the examination of the utility of a measure for screening student performance to determine who is at risk for poor performance on a criterion measure. Both approaches are important for evaluating the technical adequacy of a measure used as a screener (Jenkins, Hudson, & Johnson, 2007; Kilgus et al., 2014).
Validity
In developing an evidence-base for measures of writing, validity support is a critical component. There are several aspects of validity used to examine the degree to which scores reflect what they are intended to measure, including content and criterion-related validity. Specifically, content validity provides evidence that the scores from a test actually measure the domain of interest and criterion-related validity generally demonstrates how well a measure performs when compared with a criterion, or gold-standard measure. Validity coefficients are often evaluated using Cohen’s (1992) descriptions of a small (.10), medium (.30), or large (.50) effect, also often referred to as low or weak, moderate, and strong. Much of the existing literature has focused on students in first grade and above, finding mixed results regarding the technical adequacy of WE-CBM (McMaster & Espin, 2007; Ritchey & Coker, 2013). Initial work in this area examined validity for traditional countable indices (i.e., words spelled correct [WSC], CWS) on early writing tasks such as SC, PW, and a typical Story Prompt task when scored for CWS and CLS with a district rubric and an individual writing tests (McMaster et al., 2009). Results yielded correlations that were largely above .50 for the correlations with the district rubric. Further studies of validity for first-grade students range from .40 to .60 (medium to large per Cohen, 1992) with results indicating that a PW task when scored for CWS offers criterion validity of .49 (p < .05) with the Test of Written Language–3 (TOWL-3; (Hammill & Larsen, 1996; McMaster et al., 2011).
Existing studies of validity include various early writing tasks such as Word Copying (WC), Word Dictation (WD), Sentence Copying (SC), and Sentence Dictation (SD), as well as examination of adequate duration of writing samples (1, 2, and 3 min) for first-grade students (Hampton & Lembke, 2016). Samples were scored for various metrics including correct-minus-incorrect sequences (C-ICS) and predictive validity was calculated with the Test of Early Written Language–2 (TEWL-2; Hresko, Herron, & Peak, 1996). For all four tasks examined, the C-ICS metric at the 3-min duration had the highest validity coefficients (r range = .47-.57; Hampton & Lembke, 2016). Other studies examining Spelling, SW, and Picture Story tasks for first-grade students found moderate to strong correlations between these tasks scored for countable indices and the Broad Writing domain (r = .37-.72, p < .01) of the Woodcock–Johnson Tests of Achievement, Third Edition (WJ III; Woodcock et al., 2001/2007) as well as a teacher rating of writing performance (r = .40-.68, p<.01; Ritchey & Coker, 2014).
More recent work has included the use of traditional countable indices of writing and a trait rubric with a SW task and the Wechsler Individual Achievement Test-3 Spelling and Sentence Composition for first-grade students (Allen, Poch, & Lembke, 2018). Criterion validity findings for the rubric score with spring administration of the WIAT-3 were low for the fall writing sample (r = .16 and .21), and significant but moderate for the winter (r = .41 and .38) and spring (r = .41 and .30) writing. Overall, results suggest that WE-CBM tasks are promising screening tools for first grade; however, validity coefficients are mostly in the moderate range for both countable indices and rubric scoring, regardless of the criterion measure used.
The only study we are aware of that includes kindergarten students also examined writing measures for first grade using a researcher-developed task, SW, that required students to write two sentences from several brief prompts (Coker & Ritchey, 2010). The sentences were then scored for Total Words Written (TWW), WSC, and CWS in addition to a qualitative score designed to capture spelling, mechanics, and grammar, and whether the response was consistent with the prompt. Criterion validity of SW scores with the TEWL-2 provided support for the use of SW among first-grade students (r range = .25-.57), but not among kindergarten students (r range = .20-.46). Validity coefficients for the qualitative score in kindergarten were slightly higher (r = .43 and r = .46) but still in the moderate range.
In general, emerging evidence points toward early WE-CBM as a valid tool for measuring writing, in particular, the use of tasks where students write a sentence in response to a picture prompt demonstrates sufficient technical adequacy (e.g., Allen et al., 2018). Most studies, however, have focused on validity for students in first grade and beyond with fewer studies including kindergarten students or the evaluation of diagnostic accuracy.
Diagnostic Accuracy
When examining the instructional utility of a measure, one dimension of interest is whether a measure can be used for screening to identify students at risk for poor performance and in need of intervention, often referred to as classification or diagnostic accuracy. The process of calculating diagnostic accuracy first involves selecting a cut score for the predictor and determining dichotomized performance on a criterion measure. Using the dichotomized predictor and criterion performance, a 2 × 2 contingency matrix is determined. From this matrix, several statistics are calculated including sensitivity, specificity, positive predictive power (PPP), and negative predictive power (NPP). In the context of screening, accurately identifying struggling students (maximize sensitivity) rather than correctly identifying non-struggling students (maximize specificity) is valued. PPP is the likelihood that students identified as at risk are, in fact, at risk as determined by criterion performance, and NPP is the likelihood that students identified as not at risk were successful on the criterion. Examining diagnostic accuracy requires establishing cut scores and there are various approaches to establishing a cut score including theory as well as practical reasons. One other option that provides flexibility is receiver-operating characteristic (ROC) curves (Swets, Dawes, & Monahan, 2000). ROC curves model diagnostic accuracy for all possible cut scores on a predictor measure and generate the aforementioned statistics for evaluating diagnostic accuracy (i.e., sensitivity, specificity, PPP, and NPP). Area under the curve (AUC) is an overall measure of accuracy with values greater than .70 and p values less than .05 indicating acceptable fit and significance.
Ritchey and Coker (2014) examined diagnostic accuracy of three early writing measures (Spelling, SW, Picture Story Writing) among first-grade students, using the WJ-III Spelling and Writing Samples tests and a holistic teacher rating as criterion measures. Cut score selection procedures involved maintaining sensitivity at .90 then selecting the score offering the highest specificity. The combined writing screeners had the greatest diagnostic accuracy for teacher rating (AUC = .94, specificity = .84) and weaker scores for the WJ-III Spelling (AUC = .81, specificity = .57) and WJ-III Writing Samples (AUC = .83, specificity = .52).
A study of the diagnostic accuracy of WE-CBM among kindergarten students included researcher-developed writing tasks of Letter Writing, Sound Spelling, Word Spelling, and SW along with the DIBELS to assess early literacy skills (Coker & Ritchey, 2014). Similar to the findings of the first-grade study, the AUC for individual early WE-CBM tasks ranged from .60 to .87 for predicting performance on a criterion (TEWL-2, Contextual Writing, Global Writing, and Teacher Rating). These studies provide preliminary support for the diagnostic accuracy of WE-CBM in the early grades. Further study of WE-CBM in kindergarten is needed before these measures are routinely used in schools.
Purpose of the Current Study
This study extends existing work on early WE-CBM by examining the validity and diagnostic accuracy of two early WE-CBM probes administered to kindergarten students. The study addresses the following research questions:
Method
Participants
Participants were drawn from an early childhood center in a mixed suburban-rural district in the southeastern United States. A total of 96 kindergarten students participated in this study. One student responded in Spanish and was therefore excluded from analyses for a final total of 95 students. The final sample included 51.0% female and 49.0% male participants. The race and ethnicity of participants were reported separately and are included in Table 1. About half (42.7%) the sample was classified as an English language learner (ELL), with 43.8% of these students participating in a Bilingual classroom. Of the total sample, 5.2% were in special education (2.1% other health impaired [OHI], 3.1% speech impairment [SI]).
Sample Demographics.

Measures
Early writing CBM
Participants completed two Early Writing CBM tasks: WD and PW. Both tasks were developed based on existing work by McMaster et al. (2009), Coker and Ritchey (2014), and Ritchey (2006). Target words for both writing tasks were chosen from the AIMSweb Kindergarten Oral Reading Fluency passages. Passages were reviewed and words selected for possible inclusion. Words were arranged into categories based on consonant (C) and vowel (V) groupings to include a variety of word types (i.e., CVC, CCVC, CVCe, CCVCC, CVVC, and CCVCe). The frequency of each chosen word across the passages was reviewed and decisions were made about which words to include. WD included 30 words that were dictated to students, similar to word spelling tasks used in previous studies (e.g., Coker & Ritchey, 2014; Hampton & Lembke, 2016; Ritchey, 2006). Students had 3 min to write as many words as they could on the numbered lines provided. PW included a picture and one word labeling the picture. For example, if the target word was “chair,” the prompt included a picture of a chair with the word below. Students were instructed to write a sentence using each word, completing as many words as possible in 3 min.
The early WE-CBM tasks of WD and PW were developed for the purpose of this study so there is no direct reliability data, and validity was the central focus of the present work. There is, however, substantial evidence of the reliability of these activities as well as similar tasks for use in the early grades. For example, reliability results for a 3-min PW task completed by first-grade students (test–retest and alternate form reliability) exceeded adequate levels, as defined in the study of .70 or higher for all the metrics examined (e.g., words written, WSC, CWS, CIWS, and CLS; McMaster et al., 2009). Although the task was not timed, reliability estimates for a five-item word spelling task among kindergarten students, similar in format to the WD task used here, were sufficient, ranging from .84 to .94 (Coker & Ritchey, 2014; Ritchey, 2006). Construct validity for the predictor was partially established by the use of tasks that are similar to early writing tasks and ensuring that the words included in the writing prompts were appropriate for the grade level.
Woodcock–Johnson Tests of Achievement–IV (WJ IV)
The Written Expression cluster of the WJ IV was administered as the criterion to assess global writing skills and includes the Writing Samples and SW Fluency subtests (Schrank, Mather, & McGrew, 2014). Writing Samples requires students to write sentences of increasing difficulty given a verbal and picture prompt and responses are scored for quality, without being penalized for punctuation, capitalization, and spelling errors. The SW Fluency subtest measures students’ ability to write sentences fluently. For each item, the student is provided three words and asked to write a sentence, completing as many items as possible within 7 min.
Average reliabilities across ages 5 through 11 are .92 for Written Expression, .90 for Writing Samples, and .83 for SW Fluency (McGrew, LaForte, & Schrank, 2014). Reported concurrent validity indices for the WJ IV Written Expression cluster include moderate correlations with the Kaufman Test of Educational Achievement-II Written Language domain (.65) and Reading Composite (.68). In addition, the WJ IV Written Expression Cluster was correlated (.62) with the Written Expression cluster on the Wechsler Individual Achievement Test–III.
Procedures
A recruitment letter and consent were provided to parents of kindergarten students in April 2016. Students whose parents signed consent were included in the study. Both the Early Writing CBM tasks and WJ IV subtests were individually administered during one session within a 3-week period in spring 2016. Prior to data collection, all examiner team members were trained on administration and scoring of the measures.
Administration
The WD task involves reading a word to the student and asking them to write it on the numbered lines provided. The administrator reads each word twice, pausing briefly in between, and continues to the next word when the student finishes writing the word, or pauses for more than 5 s. On the PW task, students were asked to write one sentence about each picture, using the word provided. A total of 12 pictures were presented, and students had 3 min to complete as many as possible. The administrator read aloud each word before the time began. If the student paused for more than 10 s, the administrator prompted them to continue and if the student finished before time elapsed, they were told to review and add more detail to the sentences.
Scoring
Early WE-CBMs were scored for numerous metrics. TWW included the total number of words written in 3 min. Total Letters Written (TLW) was also scored for each measure. Out of the total words written, the number of words both spelled correctly and incorrectly were calculated and scored as WSC and Words Spelled Incorrect (WSIC). CLS and Incorrect Letter Sequences (ICLS) were also recorded for each measure. A CLS is one that includes any two correctly placed letters or a correctly placed letter next to a space. CWS and Incorrect Word Sequences (ICWS) were also scored with a CWS including any two correctly placed units (i.e., word-word, word-punctuation, and punctuation-word). CWS and ICWS were only scored on the PW measure.
Data Analysis
Data analysis included descriptive statistics and correlations to examine validity. Diagnostic accuracy analyses included ROC curves to identify cut scores on the early WE-CBM that optimize diagnostic accuracy (i.e., sensitivity and specificity). Although there is no clear agreement on what the threshold is for minimally adequate sensitivity (or specificity), recommendations in the literature typically range from .70 (e.g., Hintze & Silberglitt, 2005) to .90 (e.g., Jenkins et al., 2007) for sensitivity and ≥.70 for specificity (e.g., Hintze & Silberglitt, 2005). For the purpose of this study, we employed ROC curves to identify cut scores on the early WE-CBM that optimized both sensitivity and specificity, that is a maximum level of sensitivity achievable without resulting in inadequate (i.e., <.70) levels of specificity. In addition, the AUC, hit rates, PPP and NPP, and false positives were also calculated. The hit rate, also referred to as overall classification accuracy, is the percentage of agreement between scores on the screener and the criterion. A false positive result occurs when a student is incorrectly identified as having a problem. An AUC of .50 to .70 is considered low, .70 to .90 moderate, and .90 to 1.00 is high (Hintze & Silberglitt, 2005). Poor performance on the criterion measure was defined as a standard score below 85 (i.e., one standard deviation below the mean).
Results
Interrater reliability was conducted (N = 20, 21%) and all coefficients were significant and ranged from .98 to 1.00 for the WD task and .86 to 1.00 for the PW task. Values of skewness and kurtosis were within normal range for all scores (i.e., ±1.96, Madansky, 1988), with the exception of the WJ IV Writing Samples subtest which demonstrated an abnormally sharp peak. One participant was removed from the sample because they responded in Spanish instead of English. Descriptive statistics are included in Table 2. The remaining data (N = 95) were screened through frequency analysis and visual inspection. This was done to supplement the examination of skewness and kurtosis and ensure that all values represented accurate and plausible scores for participants. Ultimately, all data were deemed accurate and were retained for analyses.
Descriptive Statistics.
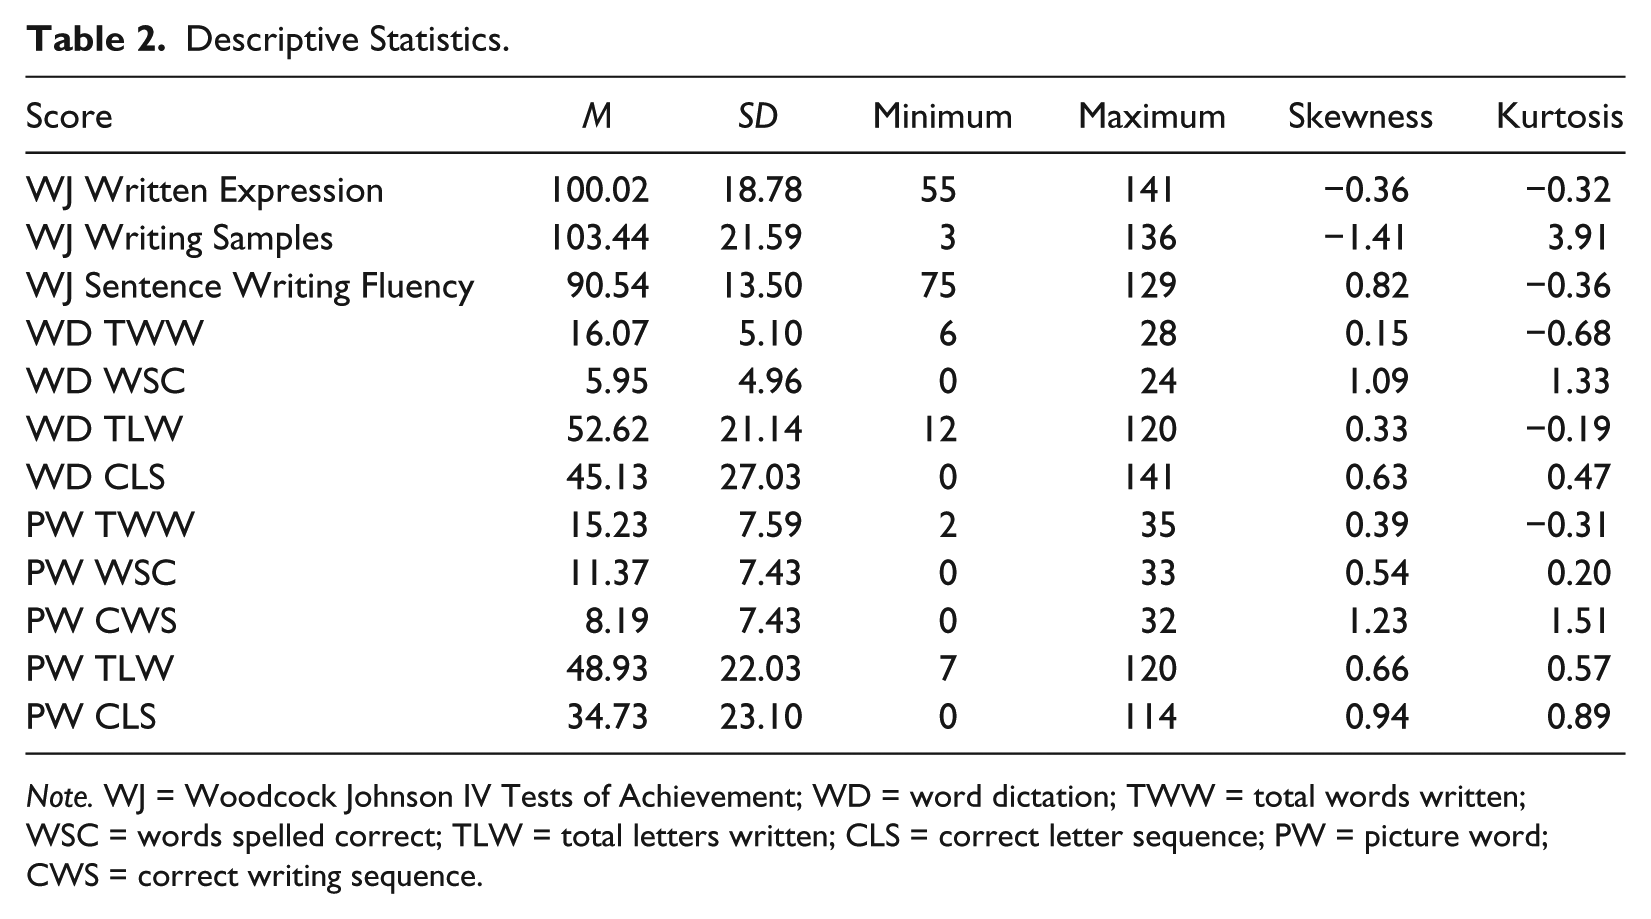
Note. WJ = Woodcock Johnson IV Tests of Achievement; WD = word dictation; TWW = total words written; WSC = words spelled correct; TLW = total letters written; CLS = correct letter sequence; PW = picture word; CWS = correct writing sequence.
Validity Results
The relationship between raw scores on early writing probes (WD and PW) and standard scores on the WJ IV Written Expression cluster and subtests was examined (Table 3). All WD scores were significantly related to the WJ cluster and individual subtest scores but the strength of the relationship varied. WJ WE cluster scores were weakly related to TWW (.32), moderately related to TLW (.47), and strongly related to WSC (.70) and CLS (.68). Scores on each WD metric were significantly related to all other WD scores with correlations ranging from moderate to strong. Similarly, all PW scores were significantly related to WJ scores (p < .01). Correlations ranged from .40 to .57, with the exception of CLS with the WJ cluster score (.61), and CWS and CLS with the SW Fluency subtest (.60, .61, respectively). Each PW score demonstrated a strong relationship with all other PW metrics (p < .01). In addition, all WD scores were significantly related to PW scores.
Correlation Results.

Note. WJ = Woodcock Johnson IV Tests of Achievement; WE = written expression; WS = writing samples; SWF = sentence writing fluency; WD = word dictation; TWW = total words written; WSC = words spelled correct; TLW = total letters written; CLS = correct letter sequence; PW = picture word; CWS = correct writing sequence.
p < .01. **p < .05.
Diagnostic Accuracy
Cut scores resulting in sensitivity and specificity at or above .70 were identified. When sensitivity did not reach .70, the sensitivity closest to .70 which was accompanied by the highest specificity was selected. This approach is similar to other studies of diagnostic accuracy with writing CBM (e.g., Keller-Margulis et al., 2016). The results include cut scores, sensitivity, specificity, PPP and NPP, AUC and associated confidence intervals, and hit rates. AUC is an overall measure of accuracy and was significant for all analyses (see Table 4).
Diagnostic Accuracy Statistics.

Note. PPP = positive predictive power; NPP = negative predictive power; AUC = area under the curve; CI = confidence interval; TWW = total words written; WSC = words spelled correct; TLW = total letters written; CLS = correct letter sequence; CWS = correct word sequence.
All AUC values were significant at p < .01. **Significant at p < .05.
WD
AUC values were moderate to high for WD, resulting in 75% to 93% accurate classification. All WD metrics yielded a cut score resulting in sensitivity and specificity above .70, with the exception of TWW. Diagnostic accuracy analyses for WD metrics demonstrated adequate sensitivity, with the sensitivity for WSC reaching 1.00, with a specificity of .82. Resulting NPP values were higher than PPP in every instance. Although sensitivity levels exceeded .70, resulting false positives (i.e., 1 – specificity) were variable. For instance, the cut score associated with maximized sensitivity and specificity for WSC (i.e., 2) resulted in a false positive rate of .15 whereas the false positive rate for TWW (cut score = 15) was .35.
PW
AUC values were moderate for PW, with the exception of TLW (.69), resulting in 74% to 83% accurate classification. For most metrics (i.e., TWW, WSC, TLW, and CLS), a cut score that maximized both sensitivity and specificity was not identified; however, sensitivity was consistently around or above .70. For metrics with adequate sensitivity (i.e., CWS and TLW), false positive rates were .19 and .39, respectively. NPP values were higher than PPP across all metrics.
Discussion
The purpose of this study was to examine the concurrent validity and diagnostic accuracy of scores on early writing CBMs including WD and PW tasks. Existing studies suggest that WD and PW measures are promising in kindergarten (e.g., Coker & Ritchey, 2014) and first grade (e.g., McMaster et al., 2009). Early identification of students who are struggling in writing is critical to changing poor trajectories of performance. This study examined whether brief writing tasks, designed from a CBM theoretical framework, generated scores that could be used for valid screening decisions in kindergarten.
The findings offer preliminary evidence that scores on WD and PW tasks are valid and provide adequate diagnostic accuracy for kindergarten. Findings indicated significant, but varying, correlations between the WD tasks and WJ IV cluster and subtest scores with correlations between WSC and CLS with the WE cluster being the highest. Overall, correlations between PW and the WJ IV were slightly lower than those for WD, although a statistical comparison was not conducted. Correlation results were similar to those found between the early writing measures and the TEWL-2 Basic Writing score in Coker and Ritchey (2014). The highest relationships in this case were those between the WJ IV WE cluster score PW CWS and CLS. These validity findings parallel the results of writing studies in older children where metrics that capture correct sequences, often CWS as well as CIWS, are found to be most related to the criterion (e.g., Keller-Margulis, Payan, Jaspers, & Brewton, 2016; Weissenburger & Espin, 2005), although the correlations are often only in the moderate range. The results are slightly higher than those of existing studies at the kindergarten level where the correlations tend to be moderate (e.g., Coker & Ritchey, 2010).
Diagnostic accuracy results were promising with significant AUC values for all WD and PW metrics, suggesting the early writing measures are predictors of performance. Sensitivity is the metric of the most interest when examining diagnostic accuracy results to evaluate appropriateness for use in screening. Sensitivity is the probability of the score on a screening measure accurately identifying a student who will fail the criterion. Our approach was to examine the ROC results to identify a cut score that maximized sensitivity, without specificity falling to unacceptable levels. For WD, the sensitivity results were positive and were similar or exceeded what is often observed in studies of diagnostic accuracy using other CBMs for screening (e.g., Hintze & Silberglitt, 2005; Shapiro, Keller, Lutz, Santoro, & Hintze, 2006; Stage & Jacobsen, 2001). Similar to the validity findings, WSC and CLS offered the highest levels of sensitivity with the cut score on WSC offering perfect sensitivity and adequate specificity. Similar results were evident for CLS indicating that these accuracy measures on WD would be useful and accurate for screening students.
Diagnostic accuracy findings for the PW metrics were not quite as high, and although AUC values were significant, only CWS and CLS offered sensitivity exceeding .70. The remaining metrics offered sensitivity of .69, quite close to acceptable levels, and specificity for CLS was acceptable. These results are preliminary and it is possible that future studies could meet or exceed acceptable levels of sensitivity. In the meantime, these findings suggest that WD measures may be a better option for screening if only one measure is selected. Any of the metrics would offer adequate diagnostic accuracy for screening but WSC and CLS appear to be the most accurate for identifying students who may fail the criterion measure.
Limitations and Future Directions
The findings of this study must be interpreted in the context of several limitations. The early writing measures used were designed by the researchers for the purpose of this study and were administered in only one session (per the research agreement with the district); therefore, additional technical adequacy data, including examination of reliability appropriate for timed tests such as test–retest or alternate form, are not available. In addition, although the framework for this study was universal screening, the study reflects data collected at a single time point, and only for those students whose parents gave consent. Future work should examine early writing measures across screening time points to further establish technical adequacy (e.g., reliability, discriminant validity) and determine whether they can be used to estimate growth and are responsive to instruction in kindergarten. This additional research is needed before use in practice is fully endorsed.
Future research should also include examination of various criterion measures and definitions of successful and poor performance on those measures. We used the Written Expression cluster from the WJ IV, which includes the Writing Samples subtest and the SW Fluency subtest. Both of these measures require the respondent to construct sentences from a picture or picture/word prompt. There are other writing related subtests on the WJ IV including Spelling, a task more similar to the WD task, which may have served as a valuable criterion measure as well as other, writing-specific achievement measures such as the Test of Early Written Language, Third Edition (TEWL-3; Hresko, Herron, Peak, & Hicks, 2012). The TEWL-3 is designed for use with children as young as 4 years of age and includes measures of writing mechanics and quality. Students generate a story in response to a picture prompt, serving as a more comprehensive task than sentence writing. In addition to measurement decisions, decisions about how academic failure is defined can vary. We used scores below 85 to indicate poor performance; however, a score of 90 offers a more conservative screening cut point that may be desirable for screening. Numerous cut score and criterion options are used in practice and should be considered for future research.
Data were collected concurrently and therefore conclusions regarding use of these screening measures at other times during the school year or to measure progress cannot be made. Future studies should examine early writing CBMs during typical screening time points (i.e., fall, winter, and spring). Using data collected via tri-annual screening with a criterion measure in the spring would allow for studies of long-term validity as well as rates of growth.
Finally, the sample included in our study was diverse in terms of race and ethnicity, in addition to including students served in bilingual programming. Although a strength of the study, it also represents a potential limitation to generalizability. Future studies should examine the technical adequacy of early writing CBM with samples of students from various demographic backgrounds. In addition, explicit study of the validity and technical adequacy of early writing CBMs for use with students who are ELLs is greatly needed. Future work should include a focus on ELLs writing in both English and their native language and consider use of meaningful covariates such as direct measures of language proficiency.
Practical Implications
Although this work is preliminary, and the writing tasks experimental in nature, there are significant practical implications of the findings. As discussed, there is an obvious need to identify students who are at risk for poor performance in writing. Research regarding writing has largely lagged behind that of reading and math, for example. Recent research, however, is advancing our understanding about how to measure writing, and what skills should be considered at the earliest point for screening. Results of this study suggest that measures focused on basic writing skills such as spelling (measured by WD) and writing simple sentences based on a picture prompt are promising options for kindergarten.
An additional implication of the current work is use of early writing screening measures with a sample including a large percentage of students who were ELLs. The district where the sample was obtained used an early exit bilingual program where students were instructed in English 50% of the time during pre-kindergarten (if enrolled—pre-kindergarten is not mandatory) with English instruction increasing until second grade when all instruction was provided in English. Although this study did not analyze differences across language backgrounds, the findings provide preliminary evidence to suggest that the skills may be useful and technically adequate across diverse groups.
This study is one of only a few examining the technical adequacy of WE-CBMs for kindergarten students. Given consistent findings that students perform poorly in writing, measures that can be used to identify students at risk for poor performance is critical. Our findings suggest that a measure of WD may offer the accuracy and efficiency desired in a screening tool for kindergarten; however, this work is in its infancy. Continued research on the technical adequacy and practical utility of early writing screeners used to identify students at risk for academic difficulty is greatly needed.
Footnotes
Declaration of Conflicting Interests
The author(s) declared no potential conflicts of interest with respect to the research, authorship, and/or publication of this article.
Funding
The author(s) disclosed receipt of the following financial support for the research, authorship, and/or publication of this article: This study was supported by University of Houston Clear Lake (Grant/Award Number: “Faculty Research Support Fund”).