




Abstract
Investigating the structure and assessing the psychometric properties of Likert scales before their application is a prerequisite of scaling theory. However, there are instances in the literature where Likert scales that were developed as a multidimensional measurement of the underlying construct have been applied without first validating their structure and reporting on their reliability. In this paper, to discourage such applications, the required sequence of decisions for such an investigation and assessment based on current theory and practice is demonstrated using the Patient Satisfaction Questionnaire Short-form (PSQ-18), a six-dimensional Likert measurement instrument. Although the findings did not confirm the dimensionality of the PSQ-18, they did provide an overall valid and reliable scale, emphasizing the need of validating its structure before application.
Introduction
Likert scales are extensively used in social sciences, educational, medical and health sample survey research. The items (opinion statements) comprising a Likert scale are normally assigned five response categories scored from 1 to 5 and usually labelled strongly agree, agree, neither agree nor disagree, disagree, strongly disagree, although a different number of categories could be used, such as seven or nine. In most exploratory research situations, having assessed the psychometric properties of the scale or subscales and ascertained their reliability and validity, the respondent’s attitude is normally measured by summing up or averaging his or her responses for each of the items.
Constructing a Likert scale and assessing its psychometric properties depend on whether the goal is theory development (subscales are not predetermined as dimensions by theory) or theory testing (subscales are predetermined as dimensions by theory). Likert scaling theory requires the items to be worded alternately as positive and negative in the case of theory development to control for acquiescent response (Moser and Kalton, 1975). In the case of theory testing, this requirement is applied within each subscale (see for example Marshall and Hays, 1994). Therefore, before carrying out an analysis, the values of all negative (or positive) worded items have to be reversed in order to achieve correspondence between the ordering of the response categories so that in constructing the overall scale (or subscales) low and high scores would indicate negative and positive attitudes, respectively.
Likert scaling theory requires a sequence of theoretical and rule of thumb decisions for investigating the scales’ dimensionality (structure) and assessing their psychometric properties before their application. In previous work, we presented the required sequence of decisions in the case of theory development (Symeonaki et al., 2015). However, there are instances in the literature where Likert scales that were developed as a multidimensional measurement of the underlying construct have been applied without first validating their structure and reporting on their psychometric properties. In this paper, to discourage such applications, the sequence of decisions required for investigating the theoretical structure of Likert scales and assessing their psychometric properties is presented based on current theory and practice. First, because this is a case of theory testing (Thompson, 2005), it involves splitting randomly a sample of adequate size into two halves. For assessing the construct validity of the scale, Exploratory factor analysis (EFA) is performed on one half sample in order to test the theoretical model of latent factors causing the observed variables (Bartholomew et al., 2008; Fabrigar et al., 1999). Then the structure is investigated by carrying out Confirmatory factor analysis (CFA) on the second half sample. Applying this approach, the structure of the Likert scale identified by EFA is validated by performing CFA (see for example Anagnostopoulos et al., 2013). Based on the total sample and the CFA results, the validity and reliability of the resulting subscales (or overall scale) and their distributional properties are assessed. To demonstrate the implications of not implementing this methodology and facilitate practical applications, we use the Patient satisfaction questionnaire short-form (PSQ-18), a well-known six-dimensional Likert measurement instrument that was administered to evaluate general satisfaction with medical care in a primary health care centre in Athens. The PSQ-18 serves as a good example because although it has been widely used, no evidence for its structure and psychometric properties has been reported to our knowledge. Furthermore, because one additional dimension is defined as a direct measurement of general satisfaction it allows the assessment of the resulting subscales’ (or overall scale) criterion validity.
Let us now present briefly the PSQ-18. The long-form PSQ was designed by Ware and his colleagues (Ware et al., 1976) as a self-administered Likert measurement instrument of patient satisfaction applicable across different systems of medical care in various settings providing “data of both theoretical importance and practical relevance to the planning, administration, and evaluation of health services” (Wilkin et al., 1992: 231). In an assessment of patient satisfaction measures, Wilkin et al. (1992: 236) remarked that the PSQ was “one of the most thoroughly researched measures…[having] a sound theoretical basis and great care has been taken in establishing reliability and validity”; they considered the PSQ to be “the best developed and most extensively tested measure available” (Wilkin et al., 1992: 231). Over the years, various revisions of the PSQ were developed as part of the RAND Health research programme. Hawthorne (2006: 276), in his extensive review of patient satisfaction measures, assessed the recent PSQ-III version as “the most rigorously developed instrument of any reviewed” with very good psychometric properties (see also Gill and White, 2009; Hagedoorn et al., 2003). The short form PSQ-18 was derived from the 50 items of the PSQ-III (Marshall and Hays, 1994) and was briefly presented by Thayaparan and Mahdi (2013: 21747) as “an adaptable, reliable, and validated tool for use in various settings…well received by patients due to its brevity”.
The PSQ-18 was designed with the same structure as the PSQ-III to measure six underlying dimensions (technical competence, interpersonal manner, communication, financial aspects, time spent with doctor and accessibility and convenience) and one additional dimension of general satisfaction, thus providing both indirect and direct assessment of satisfaction with medical care (Marshall and Hays, 1994; Marshall et al., 1993). Most researchers using the PSQ-18, by citing Marshall and Hays (1994) or RAND Health (1994a, 1994b), have taken for granted the validity and reliability of the PSQ-18 (see for example Peabody et al., 2010a). Peabody et al. (2010b: 570), in their response to Sheikh (2010) who pointed out this problem, noted simply that “the patients were given the validated and widely used PSQ-18”. Only Vrijhoef et al. (2009) and Ganasegeran et al. (2015) reported reliabilities of the subscales. However, as mentioned before, Likert scaling theory requires assessment of the scales’ structure and psychometric properties before their application. In this instance, Hagedoorn et al. (2003: 254) pointed out: “Feedback from patients is usually seen as important to evaluate the quality of health care, to isolate problems, and to generate ideas to improve health care. To attain these goals, the validity and reliability of the measures used are crucial”.
To investigate the dimensionality of the PSQ-18, first, as mentioned before, the sample was randomly split into two halves and EFA was performed on the first half sample using IBM SPSS Statistics Version 20. Then the structure was examined by carrying out CFA on the second half sample using IBM SPSS Amos Version 21. Applying this approach, the structure of PSQ-18 identified by EFA was validated by performing CFA. Based on the total sample and the CFA results, the psychometric properties of the resulting overall scale (or subscales) and their distributional properties were assessed.
Preliminary Decisions, Tests and Procedures
Preliminary decisions, tests and procedures refer to the level of measurement of Likert scale items, the adequacy of the sample size for performing factor analyses, splitting randomly the sample into two halves, and how missing values, outliers and unengaged responses are to be dealt with.
Level of Measurement and Reversing the Ordering of Items
The level of measurement of Likert scale items and the appropriateness of applying parametric or non-parametric analyses has been debated for many years. Kuzon et al. (1996), Jamieson (2004) and Göb et al. (2007), to name but a few, considering the items as ordinal, proposed that only non-parametric analyses should be performed. Carifio and Perla (2007, 2008), and Norman (2010), among others, favoured the use of parametric methods, persuaded by the empirical evidence showing the robustness of the methods commonly applied. Erceg-Hurn and Mirosevich (2008) contradicting this point, proposed the use of modern robust statistical methods. However, in applications where the number of response categories used for each item is at least five, the ordinal categories can be taken to be interval and one may perform statistical analyses using these pseudo-interval variables (Bartholomew et al., 2008).
As mentioned before, the first step before carrying out an analysis is to reverse the values of all negative (or positive) worded items according to the theoretical definition of the scale.
Sample Size Adequacy and How to Split Randomly the Sample into Two Halves
Tabachnick and Fidell (2007) proposed that a sample size of 300 cases or more is adequate for performing factor analysis. In this respect, a sample size of 600 cases or more is required to ensure that the two split-half samples are of adequate size.
Also, the Kaiser-Meyer-Olkin measure of sampling adequacy (KMO) can be calculated – a KMO value closer to 1 indicates adequacy of sample size for performing factor analysis (Field, 2013).
In order to split randomly the sample into two halves, the algorithm available in SPSS may be used. Although this procedure does not split the sample into exactly two halves, if the sample size is large enough then this is not a problem. However, if two samples of equal sizes are required the SPSS script available for free from Raynald’s SPSS Tools (Levesque, 2012) is more appropriate.
Missing Values
Initially, missing data analysis is performed because complete data sets are required for SPSS Amos. The size and pattern of missing values for each item are investigated for the first half sample. Then Little’s MCAR test is applied to decide whether they are missing completely at random (MCAR) and the test results are reported (χ2, df and p-value). (In SPSS, this information is presented as a note in the tables of Expectation maximization (EM) estimated statistics when using the algorithm of Missing values analysis and EM.) A non-significant p-value indicates that the data is probably missing completely at random. Missing at random (MAR) is inferred in the case of a significant p-value. Direct maximum likelihood is currently considered the best method for dealing with missing data under the assumption of MCAR (Enders, 2010). However, SPSS does not provide this option and so the choice is among the following: mean substitution, regression imputation and expectation maximization (see for a detailed discussion Enders, 2010; Tabachnick and Fidell, 2007). In the case of missing values negligible in size and with an appearing random pattern, list-wise exclusion may be adopted (Tabachnick and Fidell, 2007). Missing data analysis is then carried out on the second half sample. Missing values are dealt with the same method for both half samples.
Data Screening for Outliers and Unengaged Responses
Data screening for unengaged responses has to be performed in both half samples. This involves investigating for each case the standard deviation of their responses to the items. Cases are eliminated if they exhibit low standard deviation (< 0.5), i.e. no variance in the responses (Gaskin, 2016). Data screening for outliers is based on background variables e.g., gender (dichotomy), age (ratio) and education (pseudo-interval). Cases are eliminated if they are shown in the boxplots as outliers (Gaskin, 2016; see also Brown, 2015; Tabachnick and Fidell, 2007; Thompson, 2005).
Construct Validity and Reliability Assessment
The assessment of the psychometric properties of Likert scales before their application is a prerequisite of scaling theory. The result of this assessment decides the structure (dimensionality) of the Likert scale and the reliability of the overall scale or subscales.
Exploratory Factor Analysis
In performing EFA, as we presented in previous work (Symeonaki et al., 2015), the following sequence of decisions is required (Brown, 2015; Tabachnick and Fidell, 2007; Thompson, 2005):
Initially, univariate statistics are computed for each item and their distributional properties are inspected (testing for normality) to decide on the appropriateness of the methods to be used. The criterion of corrected item-total correlations < .30 is used to decide which items to reject from analysis (Clark and Watson, 1995; Nunnally and Bernstein, 1994). Decision on the matrix of association coefficients to analyze: As the items are considered pseudo-interval, the covariance matrix is employed as the matrix of associations since it is the most commonly used matrix of associations in conducting CFA (Thompson, 2005). Factor extraction method: Principal axis factoring (PAF) is performed (see note in step 4) and in order to justify using this solution in CFA, it is validated by applying maximum likelihood (and unweighted least squares) factoring. The decision on the number of factors to be extracted is based on the eigenvalue > 1.0 rule, scree test, parallel analysis and interpretability (Hayton et al., 2004). Parallel analysis (O’Connor, 2000) is performed using the parallel analysis engine provided by Patil et al. (2007) – a utility developed as part of Patil et al. (2008). Note that this parallel analysis engine provides results only for Principal components analysis and PAF. Component or factor rotation method: Based on the correlations among factors and the simple structure criterion, oblique (promax) rotation is applied (Brown, 2015; Fabrigar et al., 1999; Reise et al., 2000). The meaning of each dimension is inferred from the items that have factor loadings >.30 (Fabrigar et al., 1999). Items with loadings greater than .30 on one factor and greater than .22 on another factor are considered as “cross-loading” items, i.e. items that load on multiple factors (Stevens, 2002; see also Anagnostopoulos et al., 2013).
In applications, subscales are constructed and assessed for the first half sample as described below and this sequence of decisions is performed several times before determining the final solution.
Confirmatory Factor Analysis
In performing CFA, the following sequence of decisions is required (Brown, 2015; Thompson, 2005):
The decision on the items to be included in the analysis is based on the item analysis results carried out on the first half sample and those of EFA. Model estimation: CFA is commonly performed using the covariance matrix of association coefficients and maximum likelihood for estimation, depending on the items’ distributional properties. Rival models: The decision on the rival models to consider is based on the theoretical structure of the scale, the EFA results and separate EFAs performed on the first half sample under various structural assumptions. For instance, let us suppose that although the original theoretical structure of the scale is six-dimensional, EFA indicated a three-dimensional structure. Then the following models may be considered: one first-order factor (model 1); two first-order uncorrelated factors (model 2a); two first-order correlated factors (model 2b); two first-order correlated factors (model 2c) with cross-loadings; three first-order correlated factors (model 3a); three first-order correlated factors (model 3b) with cross-loadings; and six first-order correlated factors (model 4) based on the theoretical definition of the scale. Model evaluation: In CFA, model fit is considered adequate if χ2/df is <3 (Bollen, 1989; Tabachnick and Fidell, 2007), the Standardized root mean square residual (SRMR) values are ≤ .08, the Comparative fit index (CFI) and Tucker-Lewis index (TLI) values are greater than or close to .95 and the Root mean square error approximation (RMSEA) values are ≤ .06 with the 90 percent Confidence interval (CI) upper limit ≤.06 (Brown, 2015; Hu and Bentler, 1999; Schmitt, 2011; Tabachnick and Fidell, 2007; Thompson, 2005). Model misspecification searches: Searches for modification indices and further specifications are performed.
Scale or Subscale Construction and Analyses
Likert scales or subscales are constructed according to the theoretical definition of the scale. In most exploratory research situations, summing up or averaging their defining items based on their factor loadings is extensively used. Based on the CFA results for the total sample, the Average variance extracted (AVE) is computed for each subscale by averaging the sum of all squared standardized factor loadings to assess the convergent validity of the respective construct. Convergent validity is considered adequate if the average extracted variance is ≥.50 (Fornell and Larcker, 1981; see also Anagnostopoulos et al., 2013). Adequate discriminant validity of constructs is accepted “if the squared inter-construct correlations estimates associated with that…[construct] were less than its AVE estimate” (Anagnostopoulos et al., 2013: 1977). Criterion validity is usually assessed by correlating the subscales (or overall scale) with another scale or index measuring the relevant underlying construct. High values of the correlation coefficients indicate adequate evidence of criterion validity.
Descriptive statistics, Cronbach’s alpha and split-half reliability coefficients of the subscales are computed. A subscale (or scale) is considered reliable if the coefficients are ≥.70 (Nunnally and Bernstein, 1994; see also Murphy and Davidshofer, 2001). Average inter-item correlations in the recommended range of .15-.5 that cluster near their mean value are used as an indication for the unidimensionality of the subscales (Clark and Watson, 1995). To demonstrate whether subscales are warranted or not, the condition of average correlation between subscale items “significantly greater than zero but substantially less than the average within-subscale values (say, .20)” (Clark and Watson, 1995: 318) is used for justifying subscales. As Clark and Watson (1995: 318) pointed out, “if this condition cannot be met, then the subscales should be abandoned in favor of a single overall score”.
Demonstration of the Methodology
In the present section the methodology presented before is applied to the PSQ-18 that was used in a study conducted under the auspices of the Labour Institute of the General Confederation of Greek Workers (INE/GSEE) to evaluate satisfaction with medical care in a primary health care centre in Athens.
Procedure
Given the limited resources, the study was carried out for one month in an average sized primary health care centre – employing 126 doctors, 43 nursing and technical staff and 6 administrative staff – located centrally in Athens that attracted immigrants. Fieldwork was carried out during June 2012 by four interviewers and a supervisor. The study was conducted according to the International Statistical Institute (2010) code of ethics.
Participants
Given the lack of an appropriate sampling frame, a convenience sample of 1,536 individuals completed the questionnaire. The total sample consisted of 462 men (30.2%) and 1,070 women (69.8%). Just over half of the participants (58.6%) were 50 years old or more (mean age = 56.2 years; standard deviation = 17.334), 54 percent were married, 39.8 percent had completed secondary education, 55.9 percent were economically inactive and 82.6 percent were Greek.
Instrument
The Greek translation of the PSQ-18 was administered by permission of RAND Health. Appropriate translation strategies were employed (Harkness et al., 2010; RAND Health, 2011). The PSQ-18 consists of 16 items defining six underlying dimensions of satisfaction with medical care: technical competence (TQ, 4 items), interpersonal manner (IM, 2 items), communication (CO, 2 items), financial aspects (FA, 2 items), time spent with doctor (TD, 2 items) and accessibility and convenience (AC, 4 items). A single dimension of general satisfaction with care is also included (GS, 2 items). The 18 items are defined as Likert items. Five response categories are assigned for each of the 18 items (strongly agree, agree, uncertain, disagree, strongly disagree) rated from 1 to 5 and therefore the items were considered as pseudo-interval (Bartholomew et al., 2008). Within each of the predetermined dimensions, alternate items are worded positively and negatively. The theoretical definition of the scale requires the scoring of the positively worded items to be reversed before analysis so that low and high scores on the subscales will indicate dissatisfaction and satisfaction, respectively. Subscales are constructed by averaging their defining items based on their factor loadings.
Initially, the reliability of the subscales predetermined as dimensions by theory was assessed. Cronbach’s alpha reliability coefficients for TQ, IM, CO, FA TD and AC subscales were .695, .811, .531, .604, .748 and .677 (and .685 after excluding item AC9 because of too many missing values), respectively, indicating that only four of the six subscales (TQ, IM, TD and AC) were reliable based on values above and around .70, i.e. a more relaxed version of the Nunnally and Bernstein (1994) criterion for Cronbach’s alpha coefficients ≥.70 (see also Murphy and Davidshofer, 2001). Also, the general satisfaction subscale constructed from two items (GS3, GS17) was reliable (Cronbach’s alpha = .683). Therefore the analysis was based on the 16 items defining the six underlying dimensions of satisfaction. It should be noted that these results are not in line with those of Marshall and Hays (1994) who had found that all the subscales were reliable except for IM.
Statistical Analyses
The sample of 1,536 participants was randomly split into two halves using an SPSS script taken from Raynald’s SPSS Tools (Levesque, 2012). The size of each half sample (n = 768) was greater than 300 cases (Tabachnick and Fidell, 2007) and also the KMO (= .924) value was close to 1 and therefore it was considered adequate for carrying out factor analyses. EFA was performed on the first half sample. The resulting structure was validated by carrying out CFA on the second half sample.
Exploratory Factor Analysis
Item statistics and their distributional properties based on the first half sample data were first inspected (Table 1). For all items, the full range of possible responses was used. As shown, for almost half of the participants (48.8%), the question on time spent for emergency treatment (AC9) did not apply – a result useful for evaluation purposes. Consequently, this item was excluded from further analysis. The proportion of missing values for most other items was negligible, ranging from 0.0 to 2.1 percent and exceeded 3 percent only for two items (TQ2 and TQ14). Little’s MCAR test indicated that the data were probably missing completely at random (χ2 = 546.230, df = 517, p = .181) and thus, although Direct maximum likelihood is considered the best method for dealing with missing data, regression imputation was adopted given the limitations of the software used (see for example Enders, 2010). Screening the data did not identify any unengaged responses — standard deviation < 0.5, i.e. no variance in the responses; or outliers — shown in the boxplots of the background variables (gender, age and education). Thus all cases were retained in the analysis. As corrected item-total correlations were >.30 for all 15 items they were all retained in the analysis. Non-normality was not severe (skewness>2; kurtosis>7) for any item, as the skewness and kurtosis values ranged from -1.26 to 0.66 and -1.70 to 0.55, respectively (see for example Chou and Bentler, 1995). Therefore, the covariance matrix was employed as the matrix of associations since it is the most commonly used matrix of associations in conducting CFA.
Item analysis of the PSQ-18 based on the first randomly split-half sample (n = 768)
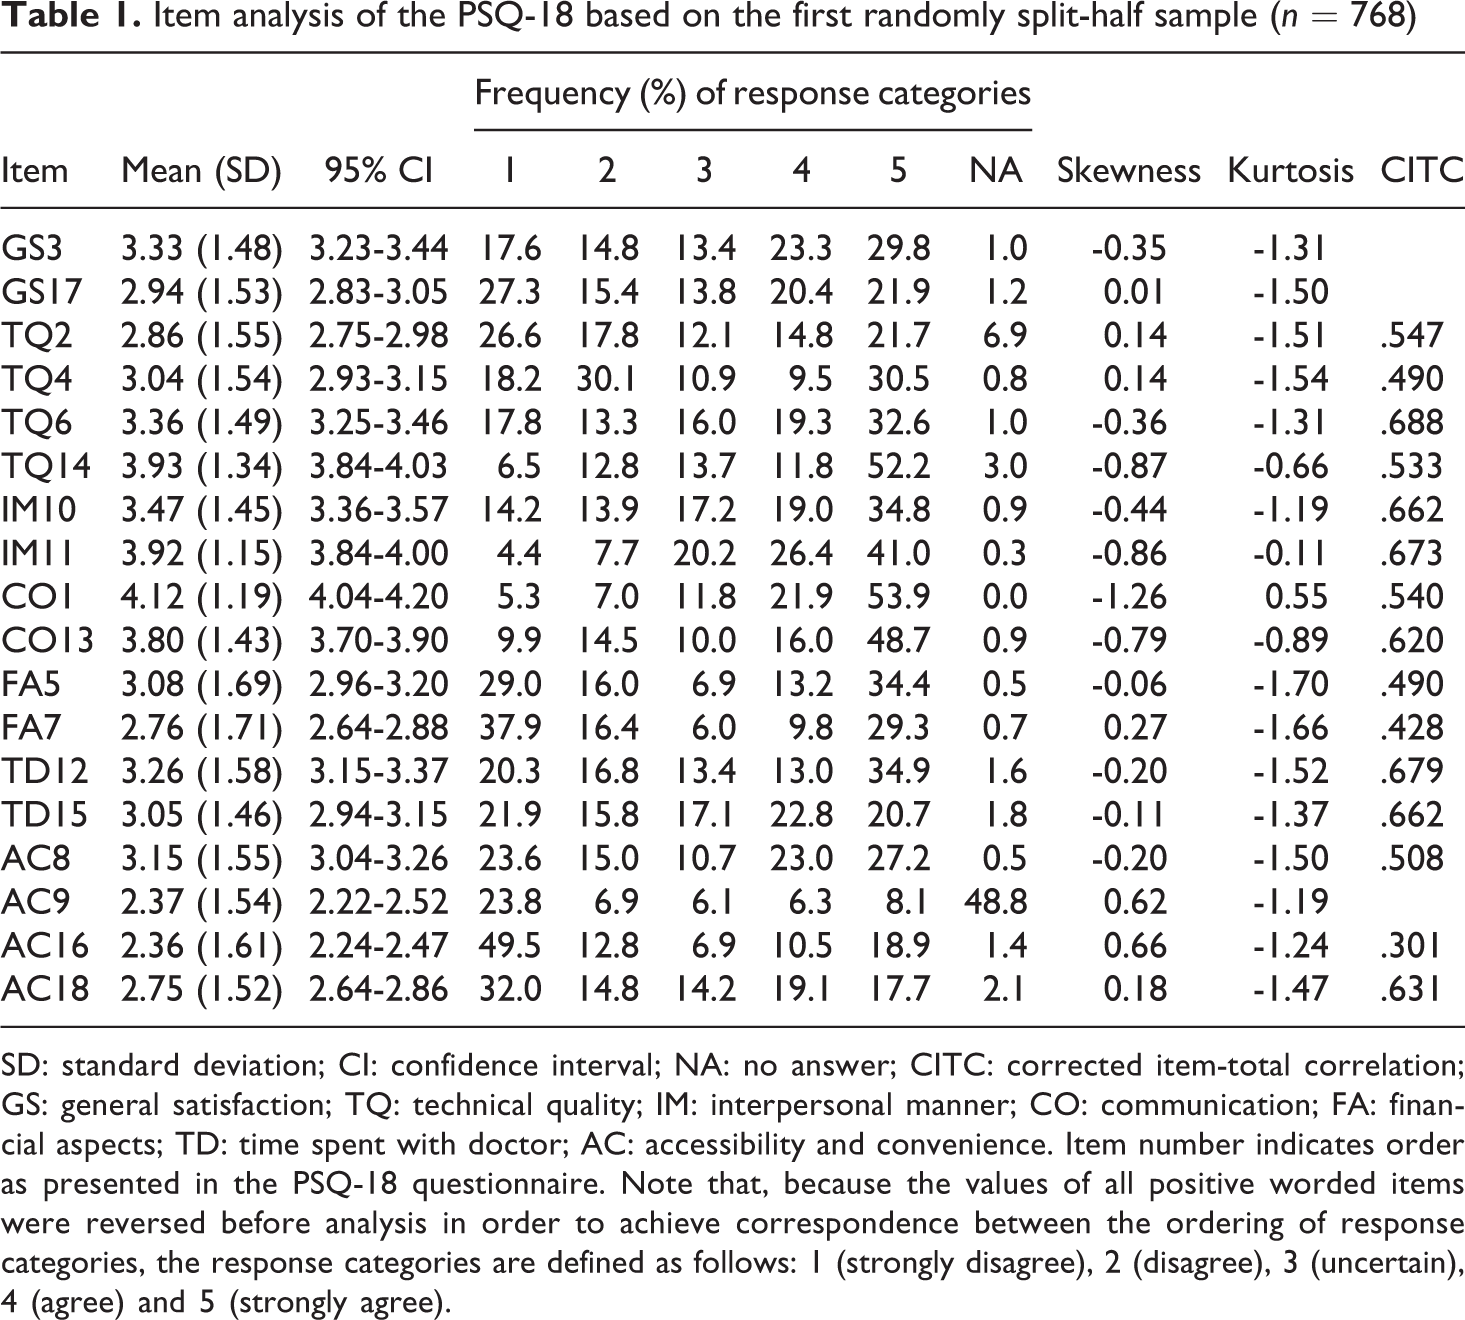
SD: standard deviation; CI: confidence interval; NA: no answer; CITC: corrected item-total correlation; GS: general satisfaction; TQ: technical quality; IM: interpersonal manner; CO: communication; FA: financial aspects; TD: time spent with doctor; AC: accessibility and convenience. Item number indicates order as presented in the PSQ-18 questionnaire. Note that, because the values of all positive worded items were reversed before analysis in order to achieve correspondence between the ordering of response categories, the response categories are defined as follows: 1 (strongly disagree), 2 (disagree), 3 (uncertain), 4 (agree) and 5 (strongly agree).
The initial application of PAF resulted in a three factors solution that was supported by the eigenvalue >1.0 rule and the scree test. Parallel analysis confirmed this result as the actual eigenvalues (13.378, 3.570 and 2.713) were greater than the randomly generated ones for both the average (0.269, 0.210 and 0.167) and the 95th percentile (0.319, 0.248 and 0.201) eigenvalue criteria. These three factors explained 40, 11 and 8 percent of the variance, respectively, amounting to a cumulative 59 percent. Subsequently, the three factors solution was investigated for simple structure and interpretability by applying promax rotation (Table 2).
Factor loadings of Exploratory factor analysis based on principal axis factoring of the covariance matrix with promax rotation performed on the first randomly split-half sample (n = 768)

Factor loadings >.22 are in boldface.
The correlation between factors was >.32 implying that there was more than a 10 percent overlap in the variance among factors, i.e. enough variance to indicate that an oblique rotation was warranted (Tabachnick and Fidell, 2007). As shown, a simple structure was provided with only a single cross-loading item (TQ2). In order to justify using this solution in CFA, it was validated by applying maximum likelihood (and unweighted least squares) factoring, resulting in an exactly similar structure. As shown in Table 2, the first factor was defined by nine items – three of the four items of the technical quality dimension (TQ4, TQ6 and TQ14) and all the items of the impersonal manner (IM10, IM11), communication (CO1, CO13) and time spent with doctor (TD12, TD15) dimensions. Dominant items referred to participants’ perceptions of the way they were cared for mainly by doctors and therefore the underlying construct was labelled as interpersonal aspects. The second factor was defined by four items – three of the four items of the accessibility and convenience dimension (AC8, AC16 and AC18), plus one item of the technical quality (TQ2) dimension. As the dominant items referred to the accessibility and convenience dimension, the underlying construct was labelled as access to care. The third factor was defined by the two items of the financial aspects dimension (FA5, FA7) and so this name was retained.
Confirmatory Factor Analysis
Screening the data did not identify any unengaged responses or outliers and thus all cases were retained in the analysis. In line with the results of the first half sample, missing data were also MCAR and were handled by regression imputation. Also, in this case, non-normality was not severe for any item, as the range of the skewness and kurtosis values were similar to those of the first half sample. CFA was performed using the covariance matrix of associations and employing maximum likelihood for estimation. In order to decide on the rival models to be used in CFA, separate EFAs were conducted under various structural assumptions. The following models were considered: one first-order factor (model 1); three first-order correlated factors (model 2a); three first-order correlated factors (model 2b) with cross-loadings; and six first-order correlated factors (model 3) based on the theoretical definition of PSQ-18 (Table 3). Modification and specification searches were conducted for all models and, where necessary, correlations between error variances were introduced.
Confirmatory factor analysis with maximum likelihood of the covariance matrix performed on the second randomly split-half sample (n = 768): Goodness-of-fit indices of three models

SRMR: standardized root mean square residual; CFI: comparative fit index; TLI: Tucker-Lewis index; RMSEA: root mean square error of approximations; CI: confidence interval. Note that the 15 items used in EFA were included in the analysis.
For all models considered, χ2 was significant (p ≤ .001), i.e. none of the models fitted the data well. However, the ratio χ2/df was <3 for all models indicating adequate model fit. The adequate fit of models 1 and 2a (values of SRMR < .05, values of CFI and TLI > .95 and values for RMSEA ≤ .05 and values of the 90% CI upper limit ≤.054) indicated that a unidimensional (Figure 1) and three-dimensional interpretation of the structure of the measurement might be possible and using the single cross-loading item (TQ2; see Table 2) improved model fit (model 2b). Model 3 resulted in a nonpositive definite matrix indicating that items should be combined (Brown, 2015) and thus CFA did not support the original theoretical structure. Therefore, though the CFA findings supported various structures (unidimensional and three-dimensional), model 2b (Figure 2) was decided to best fit the data confirming the EFA solution.

Standardized solution for Model 1 with one first-order factor based on CFA analysis (n=768). Observed and latent variables are represented by rectangles and ellipses, respectively.

Standardized solution for Model 2b with three first-order correlated factors and a single cross-loading item based on CFA analysis (n=768). Observed and latent variables are represented by rectangles and ellipses, respectively.
Subscale Construction and Analyses
In Table 4, descriptive statistics, convergent and discriminant validity, reliability coefficients and internal consistencies of the subscales and the overall scale are presented. Only the financial aspects subscale demonstrated adequate convergent validity (≥.50). The squared correlations between subscales were less than the AVE estimates, indicating adequate evidence of discriminant validity. Cronbach’s alpha and split-half reliability coefficients showed that only the interpersonal aspects and access to care subscales were reliable (≥.70). Although the average inter-item correlations of the subscales were within the recommended range for unidimensionality (.15-.5), the individual inter-item correlations did not cluster quite well around their respective mean values as indicated by the range. Average inter-item correlations within and between subscales indicated that these subscales were not warranted and should be combined into a single overall scale, a result supported by CFA (model 1). Though the average inter-item correlation (.35) of the overall scale was within the recommended range for unidimensionality (.15-.5), the individual inter-item correlations did not cluster narrowly around this mean value as indicated by the range. The overall scale did not demonstrate adequate convergent validity (≥.50). To assess criterion validity, a scale was constructed by averaging the two items (GS3 and GS17) designed to provide a direct measurement of general satisfaction and was correlated with the overall scale. Pearson’s correlation was .736 (p<.001, two-tailed), indicating adequate evidence of criterion validity. Cronbach’s alpha and split-half reliability coefficients showed that the overall scale (general satisfaction) was reliable. Therefore the overall scale was considered to be both valid and reliable.
Descriptive statistics, convergent and discriminant validity, reliabilities and internal consistencies of the PSQ-18 subscales and overall scale (N = 1,536)
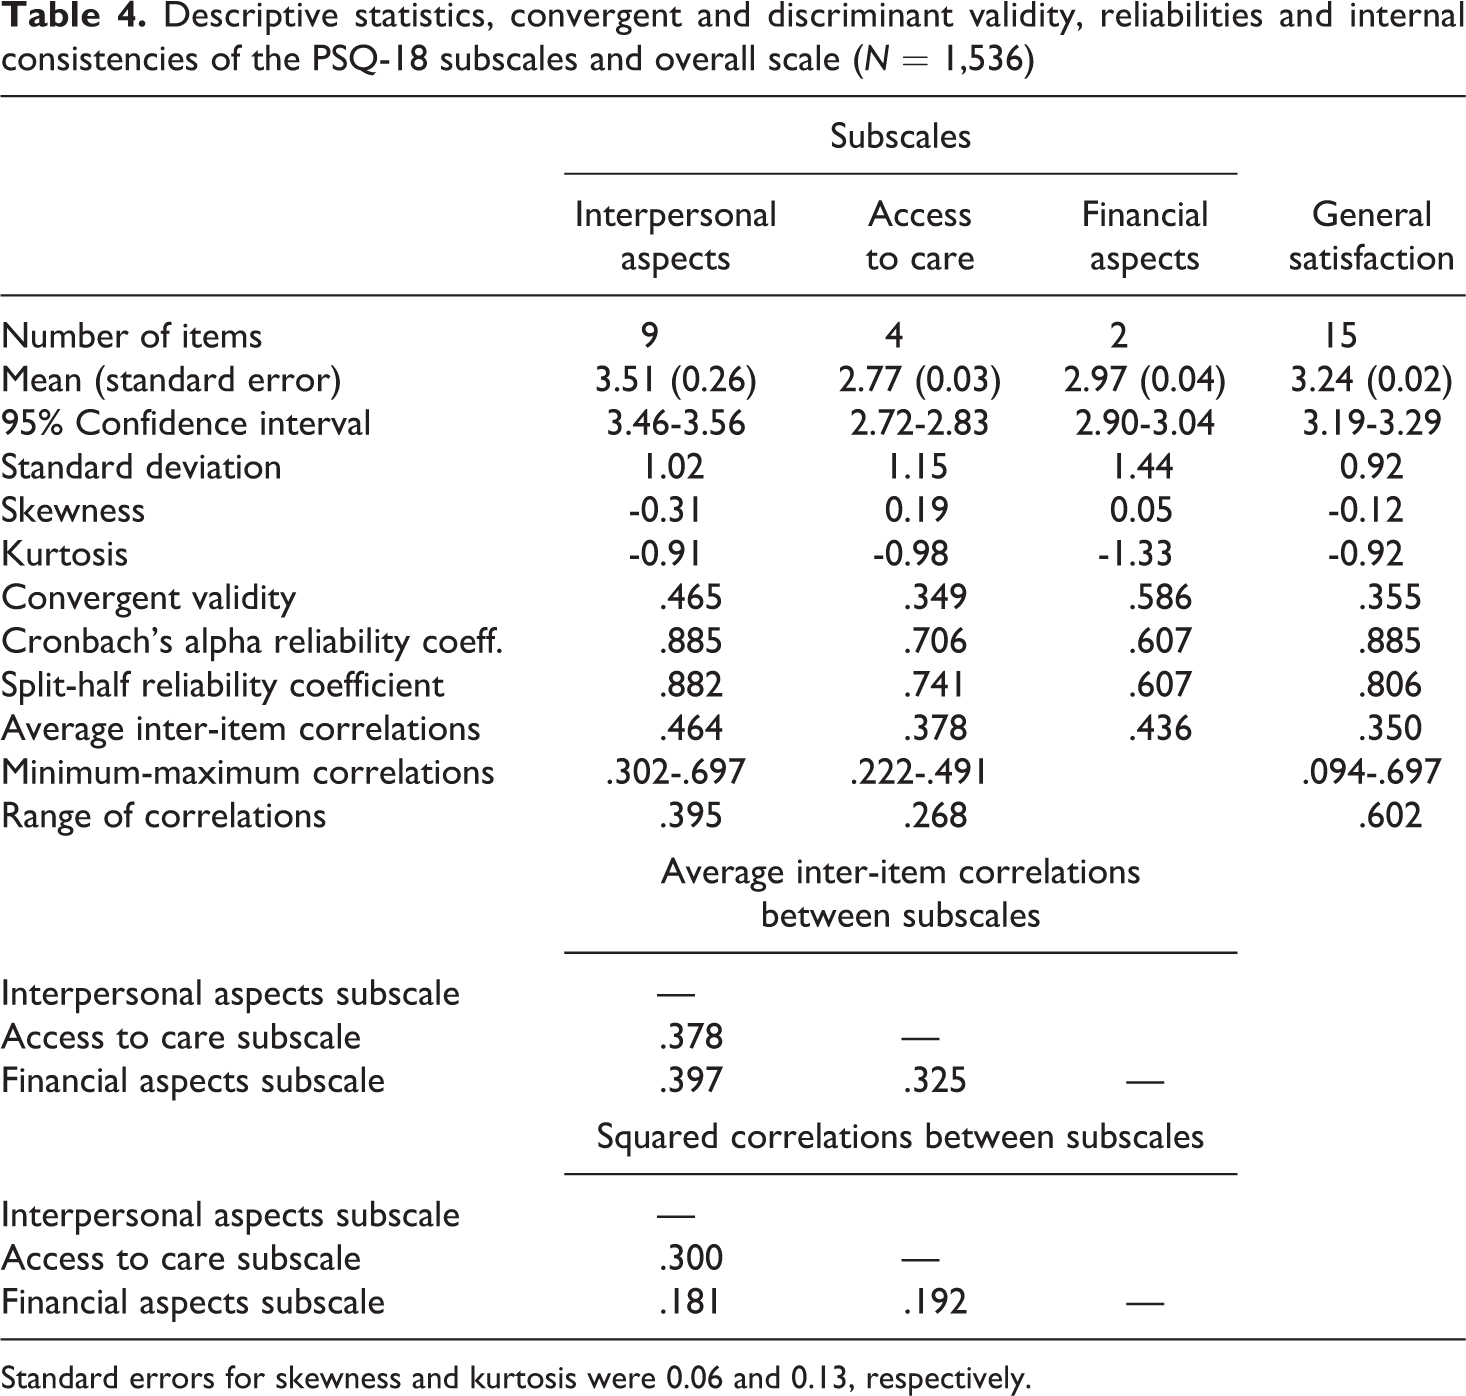
Standard errors for skewness and kurtosis were 0.06 and 0.13, respectively.
Discussion and Conclusions
Central to attitude measurement in social sciences, educational, medical and health sample survey research is Likert scaling theory. Assessing the psychometric properties of Likert scales before application is a prerequisite of scaling theory and as Moser and Kalton (1975: 353) pointed out: “Whatever approach to attitude scaling one cares to adopt there always remain the question (which ideally should be answered before a scale is put to research use) as to what extent the scale is reliable and valid”. However, there are instances in the literature where Likert scales that were developed as a multidimensional measurement of the underlying construct have been applied without first validating their structure and reporting on their reliability. In the cases where standardized instruments are to be used that were validated under various settings, it is not acceptable to take for granted their structure and psychometric properties by presenting only the appropriate citations. Furthermore, computing only the reliabilities of the subscales does not imply that they are necessarily valid, “for [they] could be measuring something other than what [they were] designed to measure” (Moser and Kalton, 1975: 355). This paper aims to present the sequence of decisions required for investigating the dimensionality (structure) of Likert scales and assessing their psychometric properties by performing EFA and CFA on two randomly split-half samples to enable users in their research. The demonstrated methodology using the Likert scale PSQ-18 showed that its theoretical structure of six dimensions was not confirmed. EFA resulted in a three-dimensional structure. The CFA findings supported a unidimensional and a three-dimensional structure, a result in line with what Hagedoorn et al. (2003) found for the PSQ-III. The three-dimensional structure (interpersonal aspects, access to care and financial aspects) provided the solution that best fitted the data. However, investigation of these three subscales’ reliabilities and internal consistencies indicated that a unidimensional structure was more appropriate and supported by CFA. The resulting overall scale was proven to be both valid and reliable. The findings demonstrate that the consequences of the original theoretical six-dimensional structure’s inappropriate use would have been in presenting totally unfounded results.
This study has certainly both strengths and limitations. The demonstration of the sequence of decisions required in carrying out EFA and CFA based on current theory and practice should be noted among the strengths of the study. Before performing EFA, item analysis was carried out to investigate their distributional properties and decide on their inclusion in further analysis based on criteria recommended in the literature. In performing EFA, recommended methods were used for factor extraction, selection and rotation. In performing CFA, the appropriate method for model estimation was applied, multiple fit indices for model evaluation were used and modification and specification searches were performed. In the literature, only Marshall and Hays (1994) provided evidence on the criterion validity of the PSQ-18 by comparing it to the long-form PSQ-III. In this instance, we demonstrated how to use the two items of PSQ-18 that were designed to provide a direct measurement of general satisfaction so as to have an indication of the resulting overall scale’s criterion validity.
Despite its strengths, the following limitations should be considered in drawing conclusions from this study. First, Likert items with five response categories were considered as pseudo-interval and the appropriate methods for that level of measurement were used. However, if they were to be considered as ordinal then the polychoric correlation matrix of associations should have been used in future research (Brown, 2015). Second, models with only first-order factors were tested for CFA; a model with second-order factors, as for instance was suggested by Marshall et al. (1993) for the PSQ-III, might provide better fit indices and should be tested in future research. Third, although the construct validity and reliability of the scale were assessed, there are other types of validity (differential, predictive, concurrent) and reliability (test-retest) that should be considered testing in future studies. Fourth, many analytical decisions were restricted by the software used. Though SPSS is the most widely used software, for instance, in testing for normality, it provides “the excellent Shapiro-Wilk test for sample sizes up to 50. For larger samples, however, they supply the poor-power Kolmogorov test” (D’Agostino et al., 1990: 316). In this respect, normality was decided on skewness and kurtosis where other software provide more sophisticated tests such as the D’Agostino-Pearson normality test (see for example Anagnostopoulos et al., 2013). Also, as mentioned before, although Direct maximum likelihood is considered as the best method for dealing with missing data under the assumption of MCAR, because SPSS does not provide this option, regression imputation was adopted in the application which is problematic in that it produces “underestimates of variances and overestimates of correlations among the variables with imputed data” (Brown, 2015: 341; see also Enders, 2010). Fifth, though Cronbach’s coefficient alpha is widely used for estimating scale reliability its problems are well known and McDonald’s Omega should be used instead (see for example Green and Yang, 2009; Revelle and Zinbarg, 2009; Zieger and Hagemann, 2015). Furthermore, the demonstration of the methodology based on data drawn from a convenience sample, though a widely used method of sample selection in situations where there is no available appropriate sampling frame, indicates that the results should be treated with the necessary caution. In spite of these limitations, the findings of the demonstrated methodology did not confirm the multidimensional structure of the PSQ-18, emphasizing the need of validating the original theoretical structure before its application. The methodology presented may be easily applied to other Likert scales defined as multidimensional by theory. In the case of theory development, the preliminary considerations and the sequence of decisions for performing EFA may be applied with the appropriate modifications.
Footnotes
Acknowledgements
Grateful acknowledgement is made to Professor Clive Richardson for his comments.
Declaration of Conflicting Interests
The author(s) declared no potential conflicts of interest with respect to the research, authorship, and/or publication of this article.
Funding
The study was funded by the European Social Fund and the Greek Ministry of Labour and Social Security under the Operational Programme “Human Resources Development 2007-2013”. The author(s) received no financial support for the research, authorship, and/or publication of this article.