
Abstract
In this article, by applying k-means clustering, cut-off points are obtained for the recoding of raw scale scores into a fixed number of groupings that preserve the original scoring. The method is demonstrated on a Likert scale measuring xenophobia that was used in a large-scale sample survey conducted in Northern Greece by the National Centre for Social Research. Applying split-half samples and fuzzy c-means clustering, the stability of the proposed solution is validated empirically. Testing its performance against three single indicators of xenophobia shows that it differentiates well between non-xenophobic and xenophobic respondents. The proposed method may be easily applied to facilitate interpretation by providing a more concise and meaningful “profile” of Likert scale (or subscale) raw scores especially the negative and positive ends of the scale for evaluation and social policy purposes.
Introduction
Rensis Likert developed a scale in 1932 for measuring attitudes that has been widely used in social sciences, educational, medical and health research (Likert, 1932). The items (opinion statements) comprising a Likert scale (or subscales) are normally assigned five response categories scored from 1 to 5 and usually labelled strongly agree, agree, neither agree nor disagree, disagree, strongly disagree, although a different number of categories could be used, such as seven or nine (Hartley and Betts, 2009; Moser and Kalton, 1975). Having assessed the psychometric properties of the scale or subscales and ascertained their reliability and validity, the respondent’s attitude is usually measured by summing up his or her responses for each of the items. Likert scaling theory requires the items to be worded alternately as positive and negative in the case of theory development (subscales are not predetermined by theory as dimensions). In the case of theory testing (subscales are predetermined by theory), this requirement is applied within each subscale (see for instance Adorno et al., 1950; Marshall and Hays, 1994). Therefore, to make the total score meaningful, the scoring of the positive or negative items is reversed, depending on the definition of the negative-positive ends of the overall scale or subscale (Moser and Kalton, 1975).
The most popular method used to compute Likert scale (or subscale) raw scores is summing up its defining items based on the results of exploratory factor analyses (theory development) and, exploratory and confirmatory factor analyses (theory testing) performed to assess the scale’s construct validity. Composite scales may also be constructed based on the results of factor analyses performed to assess the scale’s construct validity by applying one of four methods: regression, Bartlett, Anderson-Rubin and Thompson factor scores (Thompson, 2005). However, these composite scales do not preserve the variation in the original data as does the method of summing up the items (DiStefano et al., 2009). In most exploratory research situations, summing up the items is extensively used and, when factor analysis shows that simple structure is present, then its application is straightforward (DiStefano et al., 2009).
Though Likert scales (or subscales) are easily constructed by summing up their defining items, the resulting raw scores are difficult to interpret or compare between scales because, even if the same number of response categories is assigned to the items, raw scores will range according to the number of the defining items included in the scale. Various solutions to this problem are adopted, depending on the context and the use of the scale. In health and medical research, a common practice is to average the items, so that scale scores range according to their original scoring (usually from 1 to 5), or to transform them on a scale ranging from 0 to 100 (Stewart and Ware, 1992). In these cases, the scale’s descriptive statistics are usually presented as they compare to various demographic and social characteristics (see for example Marshall and Hays, 1994). In educational and psychological testing, raw test scores are usually rescaled by applying one of three methods: percentiles, standard and standardized scores, and normalized scores (American Educational Research Association, 1999; Murphy and Davidshofer, 2001; Nunnally and Bernstein, 1994; Streiner and Norman, 2003). However, these methods require normative data and therefore they are but rarely applied to attitude scaling. To the best of our knowledge, only Carter (1996), investigating racial identity attitude measures, constructed a Likert scale by both summing up and averaging the items and transformed the raw scores using percentile norms. In attitude scaling, a “profile” of Likert scale raw scores is usually obtained by applying cluster analysis to items or factors and reporting descriptive statistics and further statistical analyses findings based on the resulting clusters (see for example Carter, 1996; Whittaker and Neville, 2009; Worrell et al., 2006). In this respect, cluster analysis “has come to describe grouping people on the basis of the similarity of their profiles (score vectors)” (Nunnally and Bernstein, 1994: 599). However, this type of analysis is applied in a similar fashion to factor analysis with clusters treated as dimensions measuring underlying constructs (Everitt et al., 2011; Nunnally and Bernstein, 1994). In this article, we propose k-means clustering to identify natural groupings of a large data set in order to produce a concise representation of the respondents’ scores and transform the overall Likert scale (or subscale) raw scores into meaningful groupings. By setting k equal to the number of response categories and applying a simple transformation, the original scoring is preserved as more meaningful to the resulting arbitrary raw scores improving the conceptual interpretation especially of the negative and positive ends of the scale crucial to evaluators and policy makers.
K-means clustering, developed by MacQueen (1967), is an iterative partitioning method of cluster analysis commonly used to classify a data set into a pre-specified number (k) of groups based on a Euclidean distance measure (Everitt et al., 2011; Lorr, 1983; see also Wu, 2007). There are various methods proposed in the literature for deciding on the number of groups (Chiang and Mirkin, 2010; Everitt et al., 2011; Lorr, 1983). Spanierman et al. (2006, 2009), following Gordon (1999), applied hierarchical clustering to identify the number of cluster groups before performing k-means clustering. In other applications, a different number of groups are usually employed and the resulting solutions are compared based on Hartigan’s rule (see for instance Neville and Lilly, 2000) and/or interpretability (see for example Thalhammer et al., 2001). However, since our main concern is to preserve the original scoring for facilitating interpretation, as in the case of averaging items (DiStefano et al., 2009), k is empirically defined as the number of response categories assigned to the items. The proposed method results in a transformed overall scale (or subscales) that may be easily analysed when a detailed ‘“profile’ of scale scores” (Streiner and Norman, 2003: 108) is of the utmost importance for social policy purposes.
The method is demonstrated empirically using Likert scale data from a large-scale sample survey intended to measure xenophobia, conducted in Northern Greece (Macedonia) by the National Centre for Social Research (Michalopoulou et al., 1998). Symeonaki and Michalopoulou (2011) applied k-means clustering to this data, defining different patterns of xenophobia in a similar way to that of factor analysis, and fuzzy partitioning was used for the recoding of raw scores on a single overall Likert scale. In the present article, k-means clustering is applied for transforming the raw Likert scale (or subscale) scores.
For the development of the scale, 18 items were used rated from 1 to 5. Symeonaki et al. (2015) presented in great detail the scale’ s construct validity and reliability assessment that indicated a single overall scale constructed by summing up the 15 items included in the analysis. By applying k-means clustering on the overall scale raw scores, we identify five clusters that correspond to the rating of the items. A simple cross-tabulation of the scale by the clusters provides the cut-off points for the recoding of the raw scores into five groupings.
The proposed method is validated empirically by comparing the cluster centres of the overall sample to those resulting from randomly splitting the sample into two halves (Everitt et al., 2011). Also, fuzzy c-means clustering is applied to investigate ambiguities in the proposed solution. It is a data clustering technique wherein each data point belongs to a cluster to some degree that is specified by a membership grade. This method was originally introduced by Bezdek (1981) as an extension on previous clustering methods and shows how to group data points in multidimensional space into a pre-specified number of different clusters. The central idea in fuzzy clustering is the non-unique partitioning of the data into a collection of clusters (Everitt et al., 2011).
The transformed scale may easily be applied to obtain a detailed demographic and social “profile” of raw scale scores. The performance of the proposed solution is assessed by using three single questions treated in the literature as indicators of xenophobia (Eurobarometer, 1989; Leong and Ward, 2006; Thalhammer et al., 2001; see also Welch et al., 2007).
Method
Procedure and Participants
Given the lack of an appropriate sampling frame, a stratified three-stage quota sample of 1,200 individuals completed the questionnaire. The total sample consisted of 601 men (50.1 percent) and 599 women (49.9 percent). Half of the participants (49.9 percent) were 18 to 45 years old (mean age = 45 years; standard deviation = 16.7), 73.1 percent were married, with secondary or lower education certificate (78.6 percent) and 54.4 percent were economically active (for a detail presentation see Michalopoulou et al., 1998; see also Symeonaki et al., 2015).
The survey was conducted according to the International Statistical Institute (1985) code of ethics.
Measures
For the development of the Likert scale measuring xenophobia, 18 items were used rated from 1 to 5. Symeonaki et al. (2015) presented in great detail a re-assessment of the scale’s psychometric properties based on current theory and practice (see also Michalopoulou et al., 1998). Preliminary item analysis resulted in the exclusion of three items. Exploratory factor analysis performed for investigating the scale’s structure resulted in three underlying dimensions. However, inspection of the subscales’ internal consistencies indicated that these subscales were not warranted and should be combined in an overall scale that was found to be both valid and reliable (Cronbach’s alpha = .856; split-half reliability coefficient = .779). The overall scale was computed by both summing up and averaging the 15 items included in the analysis with low and high scores indicating non-xenophobic and xenophobic attitudes, respectively.
Also, three single questions treated in the literature as indicators of xenophobia were used to assess the performance of the proposed solution. These questions measured xenophobia based on the perception of the number of non-EU nationals in one’s country (there are too many, there are many but not too many, there are not many) and the reactions (disturbing, not disturbing) to the presence of “others” of another nationality or religion.
Statistical Analysis
K-means clustering was applied to the overall scale computed by both summing up and averaging the 15 items included in the analysis. The number of clusters was set to five (k = 5) in order to preserve the original scoring and its conceptual interpretation. Cross-tabulating the overall scale raw scores by their cluster membership indicated the cut-off points for the recoding of the raw scores into five groupings in order to provide a better representation of scale scores. The method was validated empirically by comparing the cluster centres for the total sample to those resulting from the two randomly split half samples. Also, fuzzy c-means clustering was applied to investigate ambiguities in the proposed solution.
The transformed scale was cross-tabulated for the sake of brevity with only certain demographic and social characteristics as well as the three questions used as relevant indicators to assess its performance.
Statistical data analysis was performed using IBM SPSS Statistics Version 20. For the implementation of fuzzy c-means clustering, the Fuzzy logic toolbox of MATLAB R20126 was used as well as the clustering GUI tool.
Results
Table 1 illustrates the cluster centres with k-means and fuzzy c-means clustering (total sample) and k-means clustering (half samples 1 and 2) for the overall scale constructed by both summing up and averaging the items. The locations of the cluster centres differ only slightly between the various analyses. In all cases of k-means clustering, analysis of variance, used only for descriptive purposes, resulted in significantly different mean values between the five groups. These results indicate that the proposed solution is stable.
Cluster centres for a given number of clusters (=five) with k-means and fuzzy c-means
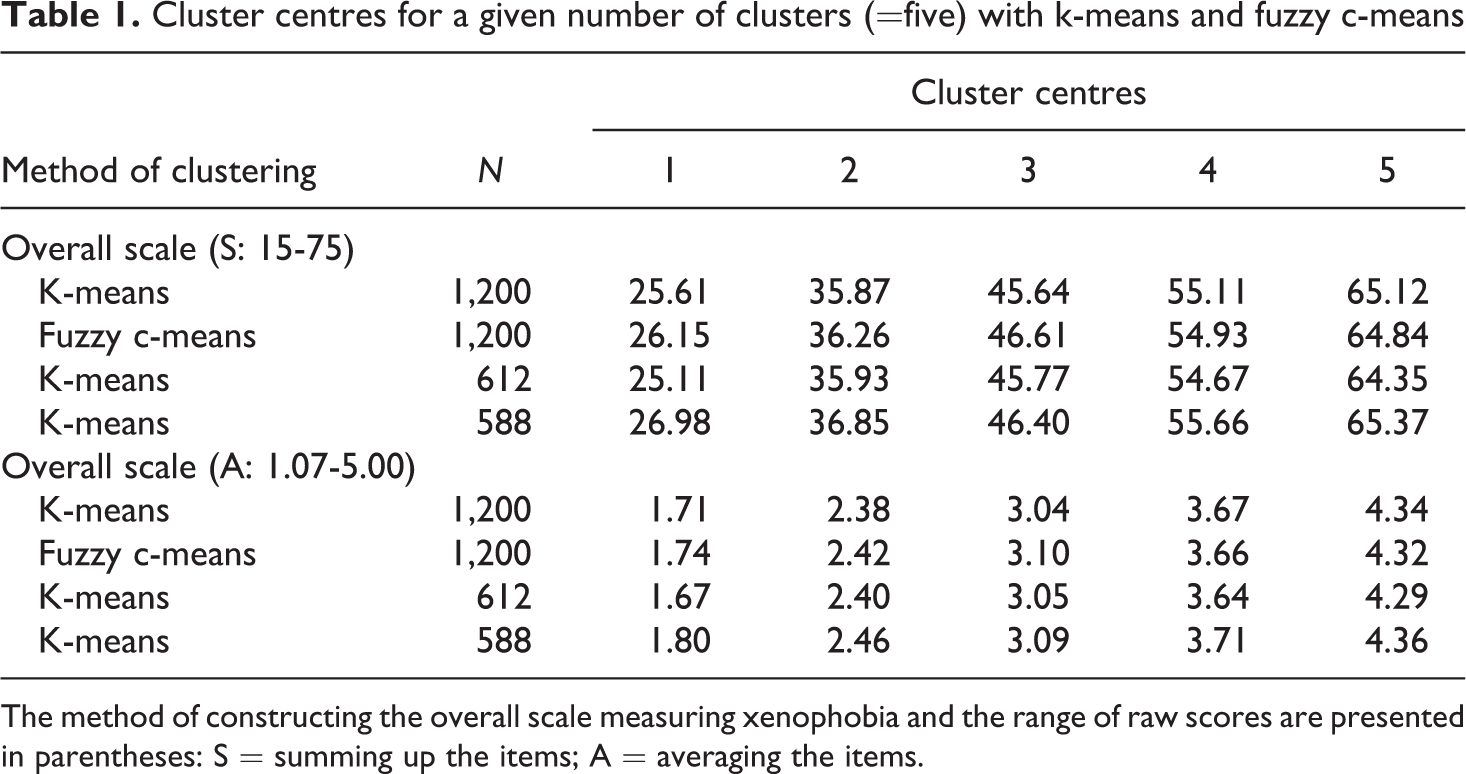
The method of constructing the overall scale measuring xenophobia and the range of raw scores are presented in parentheses: S = summing up the items; A = averaging the items.
Table 2 presents a more analytical brief demographic and social “profile” of the transformed raw scale scores using k-means clustering. As shown, age, education, self-rated political orientation and church attendance frequency play a central role in the formation of xenophobic and non-xenophobic attitudes towards the “other”. The respondents demonstrating xenophobic attitudes are older, less educated, attending church and with rightwing political inclinations, confirming relevant empirical results and theory (Eurobarometer, 1989; Thalhammer et al., 2001; Welch et al., 2007). Therefore, the proposed clustering solution classifies scores in a meaningful way, differentiating well the xenophobic from the non-xenophobic respondents, and thus providing a concise “profile” of scale scores, consistent with the three indicators of xenophobia.
The demographic and social “profile” of the Likert scale measuring xenophobia transformed raw scores using k-means clustering

*N=1,088; **N=1,018; a N=1,073; b N=1,090. The raw scores of the overall scale measuring xenophobia constructed by both summing up and averaging the items were transformed as follows: 16-30 = 1; 31-40 = 2; 41-50 = 3; 51-60 = 4; 61-75 = 5 and 1.07-2.00 = 1; 2.01-2.67 = 2; 2.68-3.34 = 3; 3.35-4.00 = 4; 4.01-5 = 5. All the cross-tabulation results are significant at p < .001.
Conclusions
Likert scaling is central to attitude measurement in social survey research. The present article aims to present a new method for transforming Likert scale (or subscales) raw scores. Having ascertained the psychometric properties of the overall scale (or subscales), the proposed method can easily be applied to construct a transformed single overall scale (or subscales) that provides a more concise interpretation of raw scores, preserving the original scoring as is the case in most explanatory social research situations.
The proposed method is demonstrated on a Likert scale that was used in a large-scale sample survey for measuring xenophobia. Transforming the raw scale scores by applying k-means clustering showed that scores are classified in meaningful groupings that differentiate well the xenophobic from the non-xenophobic respondents, thus providing a concise “profile” of scale scores, consistent with three indicators of xenophobia. Based on these groupings, a detailed demographic and social “profile” of raw scale scores was obtained, consistent with theory.
This article contributes to the growing number of studies on measuring social phenomena by demonstrating how k-means clustering may easily be applied in transforming Likert scale (or subscales) raw scores to facilitate interpretation by providing a more concise and meaningful ‘profile’ of raw scores especially the negative and positive ends of the scale for evaluation and social policy purposes (for example towards immigration).
Footnotes
Acknowledgement
Grateful acknowledgement is made to Professor Clive Richardson for his comments.
Declaration of Conflicting Interests
The author(s) declared no potential conflicts of interest with respect to the research, authorship, and/or publication of this article.
Funding
The author(s) received no financial support for the research, authorship, and/or publication of this article.