



Abstract
Over 80% of bias-motivated violent victimization is motivated by race or ethnicity and over 50% of bias victimization occurs in non-Hispanic Whites (NHW). Our aim was to determine the risk and health impacts of race/ethnicity-motivated violent victimization by victim race/ethnicity. We examined data from the National Crime Victimization Survey (2003-2015) to estimate violent victimization risk by victim race/ethnicity across race/ethnicity bias victimization, other types of bias victimizations, and non-bias violent victimizations. We examined incident and offender characteristics for race/ethnicity-motivated victimization by victim race/ethnicity. The risk of race/ethnicity-motivated violent victimization was greater for non-Hispanic Blacks (NHB) and Hispanics than for NHWs (incidence rate ratios [IRR] = 1.4; 95% confidence interval [CI] = [1.0, 2.0], and IRR = 1.6; 95% CI = [1.2, 2.1]). This translates into an additional 46.7 incidents per 100,000 person-years (95% CI = [1.4, 92.1]) for the NHB population and an additional 60.3 incidents per 100,000 person-years (95% CI = [20.3, 100.4]) for the Hispanic population. Violent incidents for NHB victims more frequently resulted in injury or medical care. Nearly 40% of NHB victims reported difficulties at school or work related to the incident where only 21.5% of NHWs and 11.7% of Hispanic victims reported similar problems. Roughly 37% of NHB victims identified a NHW offender and 45% of NHW victims identified a NHB offender. Hispanic victims identified NHB or NHW offenders in over 70% of incidents. Although literature suggests that NHWs account for the majority of bias victimizations, the risk of non-fatal violent victimization motivated by race/ethnicity is greater for NHBs and Hispanics. Crimes perpetrated against NHBs are likely more severe and victim/offender racial incongruity is common. Findings provide empiric evidence on race/ethnicity-related structural disadvantage with adverse health consequences.
Introduction
The U.S. Department of Justice (DOJ) prosecutes hate crimes defined as “. . . acts of physical harm and specific criminal threats motivated by animus based on race, color, national origin, religion, gender, sexual orientation, gender identity, or disability” (“Hate Crimes, U.S. DOJ,” n.d.). Despite an overall trend toward decreasing violent victimizations between 2004 and 2015 in the United States, the rate of hate or bias-motivated victimization has remained largely stagnant (Masucci & Langton, 2017; Truman & Morgan, 2016). In data from the National Crime Victimization Survey (NCVS) between 2011 and 2015, 80% of all bias crimes were race or ethnicity motivated and nearly 90% of all bias crimes involved violence (Masucci & Langton, 2017). Violent victimization and chronic community violence are known public health concerns related to physical injury, emotional trauma, and poor health outcomes that ripple throughout networks and communities (Copeland, Keeler, Angold, & Costello, 2007; Schilling, Aseltine, & Gore, 2007; Yimgang, Wang, Paik, Hager, & Black, 2017).
Literature Review
Powers and Socia (2019) provide an excellent overview of current theories surrounding the intersection of violence and race. Intraracial and interracial violent victimizations are unique entities and the character of each relates to the racial dyad of the offender and victim, the presence of bias, the population distribution, and existing social structures (Powers & Socia, 2019). Prior literature suggests the impact of race on injury severity, and frequency of attacks may be influenced by several distinct, yet not mutually exclusive, dynamic interactions (Felson & Pare, 2010; Jacobs & Wood, 1999; Messner, Mchugh, & Felson, 2004). The adversary effect is one theory describing these interactions where an offender may anticipate forceful retaliation from the victim and utilize weapons and firearms for protection (Felson & Pare, 2010; Powers & Socia, 2019). In the NCVS, Black victims were more commonly the target of assault with a firearm and less commonly the target of unarmed assault regardless of the race and gender of the offender (Felson & Messner, 1996; Felson & Pare, 2010). Felson suggested this may be related to the perception of a physical retaliatory threat stereotypically associated with African Americans. Lethal outcomes after violent victimizations were more common for Black victims compared with Whites using the NCVS with national homicide data (Felson & Messner, 1996). Felson argues that this association of race with a lethal outcome was due to the adversary effect (Felson & Messner, 1996).
In addition to a direct assessment of the target victim’s unique characteristics, race may be considered in a collective sense where the victim bears the liability for all grievances held by the offender. This racial animosity can potentially influence the frequency of interracial violent encounters (Black, 1983). In the classic example, the long history of injustice toward Blacks in the United States leads to higher rates of Black offenders victimizing Whites compared to White offenders victimizing Blacks in interracial crime (Chilton & Galvin, 1985; Wilbanks, 1985). In the reverse direction, racial theory suggests that as minorities accrue higher population proportions and greater influence socially, economically, politically, and culturally, the majority group responds with actions that attempt to subjugate the minority returning them to a position of submission (Blalock, 1967). This can happen in several ways: (a) increasing the size and power of policing (Liska, Lawrence, & Benson, 1981), (b) increasing arrests (Brown & Warner, 1992), and (c) removing minority protections (King, 2007). Powers and Socia (2019) suggest violent victimizations of minority populations, regardless of explicit bias motivation, also fits into racial theory. Although much attention is dedicated toward understanding interracial victimization, intraracial violence is far more common largely due to existing social structures and formal or informal racial segregation (Becker, 2007).
Disaggregating explicit offender bias motivated by animus toward the race or ethnicity of the victim from underlying societal undertones related to the victim’s race such as the adversary effect, racial animosity, or racial threat can be difficult. Even so, victim perceptions and legal definitions are such that bias can be captured in legal frameworks and databases (Ann Arbor MI: Inter-University Consortium for Political and Social Research, 2016; “Hate Crimes, U.S. DOJ,” n.d.; “National Incident-Based Reporting System, Data Collection: Methodology,” n.d.). Powers and Socia used the National Incident-Based Reporting System to compare single offender–single victim interracial bias violence with non-bias interracial and intraracial violence (Powers & Socia, 2019). They found that the risk of minor and major injury depended on the races in the offender–victim dyad and the presence of bias. Black-on-White racially motivated bias crime had the highest odds of both minor and major injury compared with non-bias White-on-White crime. Interestingly, Klein and Allison found that White offenders and Black victims were the most common racial combination of violent encounters using the U.S. Extremism Database paired with national homicides captured by the Federal Bureau of Investigation and controlling for age, sex, region, relationship, weapons, and number of offenders (Klein & Allison, 2018). Both Powers and Socia and Klein and Allison use data at the event level and do not include population denominators.
Bias-motivated violent victimization may be more severe compared with victimizations of comparable non-bias motivated violent crimes (Fetzer & Pezzella, 2019; Pezzella & Fetzer, 2015). A review of hate crime victimizations from Boston area police records demonstrated evidence of brutality, emotional injury, and psychological trauma associated with these crimes (Pezzella & Fetzer, 2015). Prior analyses suggest that the risk of injury may differ based on the specific bias motivation (Pezzella & Fetzer, 2015). Specifically, one report suggested that anti-White violent crimes are associated with a higher risk of severe injury compared with non-bias violent crimes and is consistent with findings from Powers and Socia (Pezzella & Fetzer, 2015; Powers & Socia, 2019). Also, in NCVS data, from 2011 to 2015, non-Hispanic Whites (NHW) accounted for over half of all bias violent victimizations that may include animus based on race, ethnicity, gender, religion, sexual orientation, disability, associations, and/or perceived characteristics (Masucci & Langton, 2017). Considering only anti-race bias, studies estimating one group’s risk compared to another have produced mixed results. Using incident and crime databases from the 1990s, the odds of victimization were higher for Blacks (Messner et al., 2004; Torres, 1999). Data from the 2005 NCVS, however, suggest that proportions of victims by race were similar (Harlow, 2005). This may be counter to commonly held perceptions on bias victimization. With regard to race- and ethnicity-motivated bias violent crimes, data using population rates of victimization across different racial and ethnic groups are sparse. Also, prior work on severity often consider only Black and White races but few also include Hispanic ethnicity when evaluating severity or consequences of victimization across different demographic populations.
Current Study
Taken together, knowledge is limited on frequency and severity of race/ethnicity bias victimization using population weighted data at the national level for more recent years. Furthermore, according to racial threat and racial animosity theories, demographic shifts, trends in economic and social well-being, and population distribution can influence interracial violence that may or may not be explicitly recorded as bias-related yet reflects interracial friction. Knowing that explicit bias may result from both racial tension inherent in society along with personal hatred leading to more severe violence (Powers & Socia, 2019), population rates of bias victimization may also approximate basal levels of societal antipathy toward certain groups. This may be especially true as hostility toward minority groups becomes more common (Craig & Richeson, 2014). Population rates are critical to answer our research questions and necessitate a data source such as the NCVS and not the National Incident Based Reporting System (NIBRS). To specifically answer this question on population rates and population risk ratios, we analyzed national data from the NCVS to characterize the risk of non-fatal race/ethnicity-motivated violent crimes among non-Hispanic Black (NHB) and Hispanic individuals compared with NHW. Answers to the research questions below contribute to the overall literature in several ways. First, population-based estimates for bias-motivated victimizations using current national-level population data for distinct race/ethnicity groups do not currently exist. Second, we quantify risk using a data source based on self-report that does not filter through law enforcement frameworks. This is critical to better estimate the baseline risk of race/ethnicity-motivated violent attacks knowing the barriers to official reporting for vulnerable populations (Torres, 1999). Third, fewer studies include Hispanics with NHB and NHW when investigating race/ethnicity bias victimization and severity. Fourth, a flexible approach to visualizing victimization trends may account for differential findings for specific groups with elevated risk in prior literature.
Method
Data Source
The Bureau of Justice Statistics’s (BJS) NCVS collects annual data on personal and household victimization using a nationally representative sample of U.S. residential addresses. The survey was first administered in 1973 (named the National Crime Survey) and maintains four principle objectives: (a) collect thorough information on victims of crime and the consequences they suffer, (b) provide estimates of the numbers and types of crime, (c) establish uniform measures for selected crime types, and (d) compare victimization trends over time (Ann Arbor MI: Inter-University Consortium for Political and Social Research, 2016). In addition to collecting detailed information about the characteristics of sampled household members, all persons age 12 or older in sampled households are asked detailed, incident-level questions about experiences with personal and property crimes both reported and not reported to police (Ann Arbor MI: Inter-University Consortium for Political and Social Research, 2016). BJS offers a concatenated file that includes the years 1992 to 2015 as a free download (“NCVS, Concatenated File, 1992-2015 (ICPSR 36456),” n.d.).
Measures
Population risk outcomes
The NCVS contains several variables on bias motivation. Prior reports published by the DOJ and BJS define hate or bias crime as an incident perceived by the victim as bias-motivated and confirmed by the presence of hate language or hate symbols, or the event was established separately by the police as a hate crime (Masucci & Langton, 2017). Categories for potential bias motivation are protected under the federal crime statutes (“Hate Crime Laws,” n.d.). The NCVS includes information on the specific perceived bias motivation such as race, ethnicity, gender, sexuality, religion, disability, an associated person (e.g., the characteristic of a friend, family member, or colleague), or a perceived characteristic of the victim whether or not they actually possess that feature. We define two distinct variables of perceived bias motivation: (a) race or ethnicity motivated or (b) any other perceived bias motivation (i.e., all other possibilities). We included all perceived bias motivated crimes and did not exclude based on the absence of hate language, symbols, or police confirmation. Incidents not categorized in either bias victimization group comprised the group of non-bias victimizations. The NCVS alters the survey periodically; questions on specific bias motivation were introduced in 2003 and have remained consistent through the available data from 2015. For this analysis, we considered the years 2003 to 2015 only.
Exposure
The exposure variable of victim race/ethnicity was created using two separate variables for race and ethnicity and coded to reflect three mutually exclusive groups: NHW, NHB, and Hispanic. American Indian/Alaska Native, Asian, Hawaiian/Pacific Islander, and all multi-racial combinations were not included due to limited power to detect differences in these groups.
Covariates
The NCVS provides victim education by number of years and specific degrees attained and, in the raw form, has 26 levels. In balancing granularity of data with practicality of use, we categorized educational attainment as elementary school only, high school (no graduation), high school graduation, some college, associates’ degree or bachelor’s degree, or an advanced degree. Marital status is given in the NCVS as a categorical variable with levels of married, widowed, divorced, separated, and never married. We used United States region as a categorical variable. The Northeast includes the following states: Connecticut, Maine, Massachusetts, New Hampshire, Rhode Island, Vermont, New Jersey, New York, and Pennsylvania. The Midwest includes the following states: Illinois, Indiana, Michigan, Ohio, Wisconsin, Iowa, Kansas, Minnesota, Missouri, Nebraska, North Dakota, and South Dakota. The South includes the following states: Delaware, District of Columbia, Florida, Georgia, Maryland, North Carolina, South Carolina, Virginia, West Virginia, Alabama, Kentucky, Mississippi, Tennessee, Arkansas, Louisiana, Oklahoma, and Texas. The West includes the following states: Arizona, Colorado, Idaho, Montana, Nevada, New Mexico, Utah, Wyoming, Alaska, California, Hawaii, Oregon, and Washington (U.S. Census Bureau, n.d.). We did not re-categorize marital status or region, and the values reflect the raw NCVS responses for those questions. Victim age is provided in continuous whole-number years and treated as a linear continuous variable.
Victimization outcomes
We used standard DOJ definitions of violent crime, serious violent crime (completed aggravated assault with injury, sexual attack with minor assault, threatened assault with weapon, etc.), and simple assault (simple assault completed with injury, assault without weapon without injury, etc.) (Table 1, Truman & Morgan, 2016). We included only violent victimizations (both serious violent crime and simple assault) and excluded property crime. Weapons are defined as firearms, knives, sharp objects, or blunt objects, or other and coded as yes if any of the previously mentioned weapons were present. Firearm presence during the incident was a composite variable that included handguns, other guns, or unknown gun types and coded as yes if any of the previously mentioned firearms were present. Injuries are coded separately in NCVS as sexual assault or attempted sexual assault injuries, knife or stab wounds, gunshot or bullet wounds, broken bones or teeth, internal injuries, knocked unconscious, bruises or cuts, or other. If any of these injuries were present, the event was coded as yes. Medical care includes self-care, home-based care, and professional care from first-responders or hospital-based medical providers. Incident characteristics including the number and race of offenders and the activity at the time of the incident are self-reported by victims. Victims also self-reported whether victimization led to subsequent life difficulties.
Violent Crime, Serious Violent Crime, and Simple Assault.
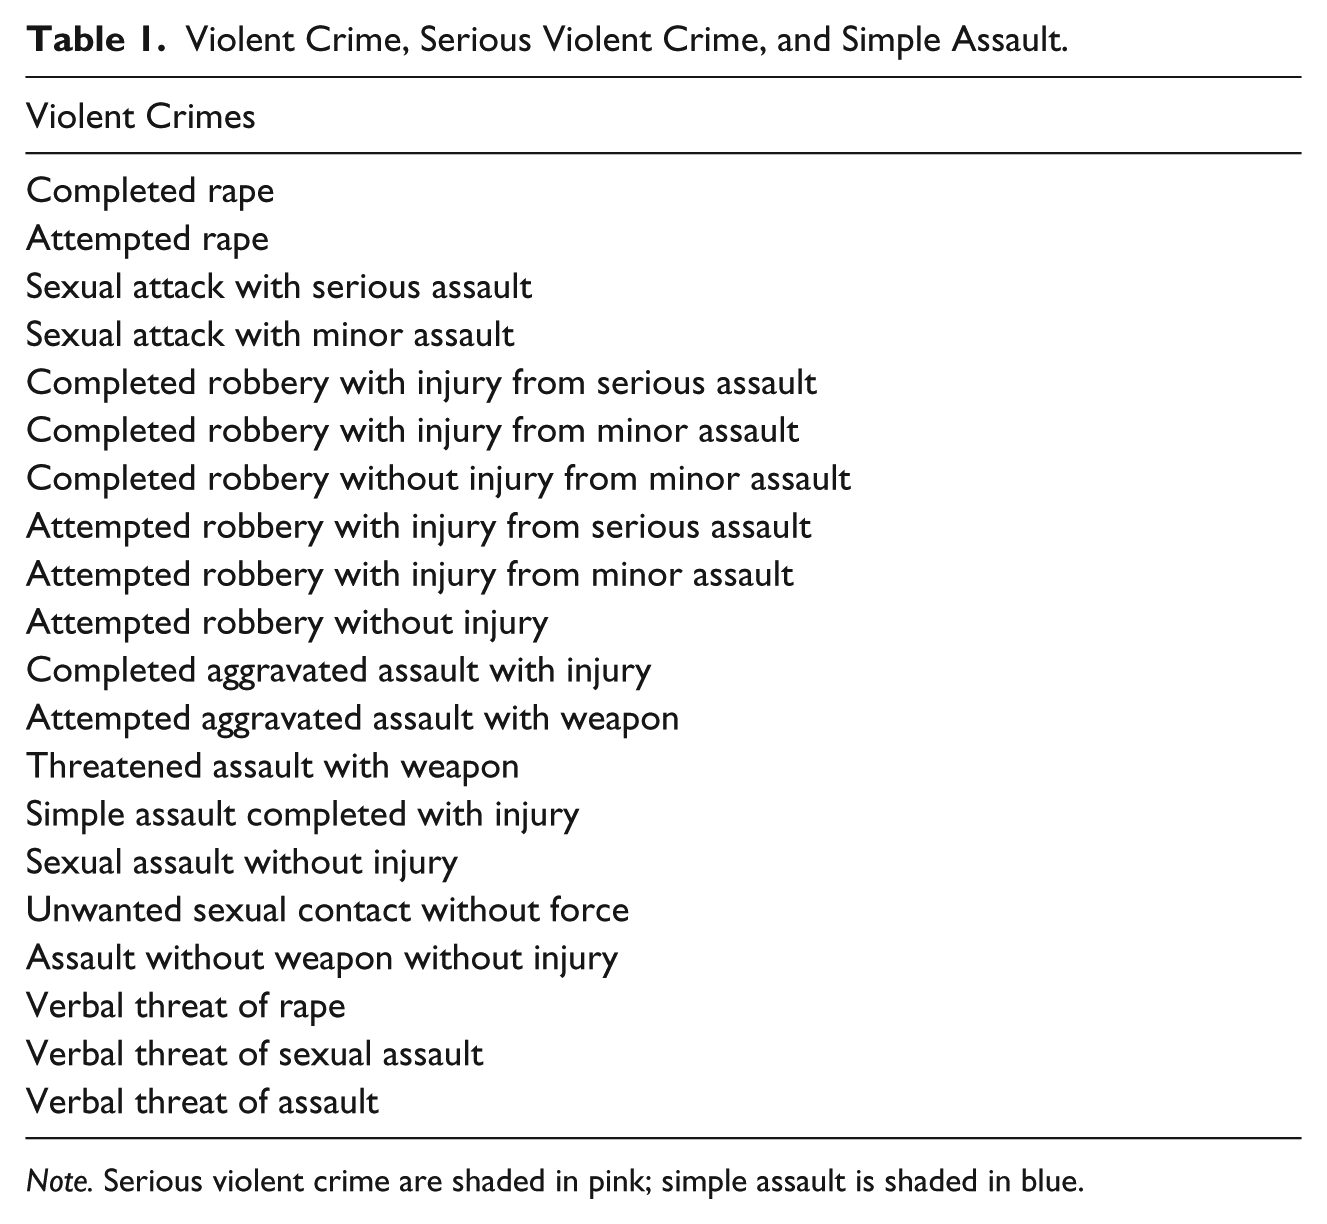
Note. Serious violent crime are shaded in pink; simple assault is shaded in blue.
Statistical Analysis
We calculated survey weighted proportions of respondent characteristics based on the NCVS universe for the years 2003-2015 across the three race/ethnicity groups (Shook, Couzens, & Berzofsky, 2014). Average annual incidence rates were calculated for each victimization category and for each race/ethnicity group using frequency and survey weights as described in the NCVS User Guide for Direct Variance Estimation (Shook et al., 2014). We calculated incidence rate ratios (IRR) for each victimization outcome using a survey-weighted Poisson regression and a multi-level categorical variable for victim race/ethnicity as the exposure with NHW as the reference group. To test the sensitivity of our findings against the choice of model, we also calculated IRRs using negative binomial regression models. We estimated incidence rate differences (IRD) using the average marginal effect based on Poisson model results. We calculated estimates using three different statistical models. Model 1 included the race/ethnicity groups only (unadjusted). Given the differences in age distribution between the three race/ethnicity groups, we also calculated estimates after controlling for age (Model 2). Education, marital status, and region may occur on the causal pathway after race/ethnicity and before victimization potentially acting as mediators in the relationship (VanderWeele & Robinson, 2014). These variables are commonly used in multivariable analysis aimed at measuring socioeconomic status (Dolbier et al., 2013; Shavers, 2007; Zheng & George, 2012). In analyses aiming to estimate the influence of race/ethnicity on the outcome of interest, approaches that adjust for socioeconomic status are controversial (Kaufman & Cooper, 2001; VanderWeele & Robinson, 2014). Controlling for these variables may attenuate any association between race/ethnicity and outcomes; however, these are often included in models to assess whether differences in such socioeconomic measures may account for any observed disparities by race/ethnicity (Rangrass, Ghaferi, & Dimick, 2014; Samuel et al., 2014; Siddiqi, Wang, Quinn, Nguyen, & Christy, 2016). As such, we calculated estimates (Model 3) that included education, marital status, and region. By providing this model, appraisal of our estimates side-by-side with other analyses that control for socioeconomic status is possible. We also calculated weighted proportions of incident characteristics among all race/ethnicity-motivated violent bias crimes across the three race/ethnicity groups. Finally, we estimated yearly incidence rates for each crime type and each race/ethnicity group using 2-year rolling averages and fit with natural cubic splines and two knots. Natural cubic splines were chosen to minimize the impact of any single yearly estimate given the limited number of observations for each year–group victimization type combination and to avoid the assumption of linearity in the trends by year (Durrleman & Simon, 1989).
Results
For the years 2003 to 2015, the NCVS sample included 2,080,786 individuals age 12 years or older with a weighted distribution of 72.3% (95% confidence interval [CI] = [71.4, 73.3]) NHW, 12.6% (95% CI = [11.9, 13.3]) NHB, and 15.1% (95% CI = [14.3, 15.9]) Hispanic origin. In this NCVS universe, a smaller proportion of NHB were male (45.5% vs. 49.0% in NHW and 50.0% in Hispanics) and married (31.0% vs. 53.6% in NHW and 44.9% in Hispanics), and a greater proportion lived in the Southern United States (55.4% vs. 33.6% in NHW and 36.4% in Hispanics). The population proportions between the ages of 12 and 39 were highest for NHB and Hispanics (51.6% and 62.6%, respectively, vs. 40.3% in NHW). Smaller proportions of NHBs and Hispanics had advanced education compared with the population of NHW (4.6% and 2.9%, respectively vs. 9.3% in NHW; Table 2).
Characteristics for Non-Hispanic Blacks, Non-Hispanic Whites, and Hispanic Origin in NCVS (Weighted Proportions), 2003-2015.
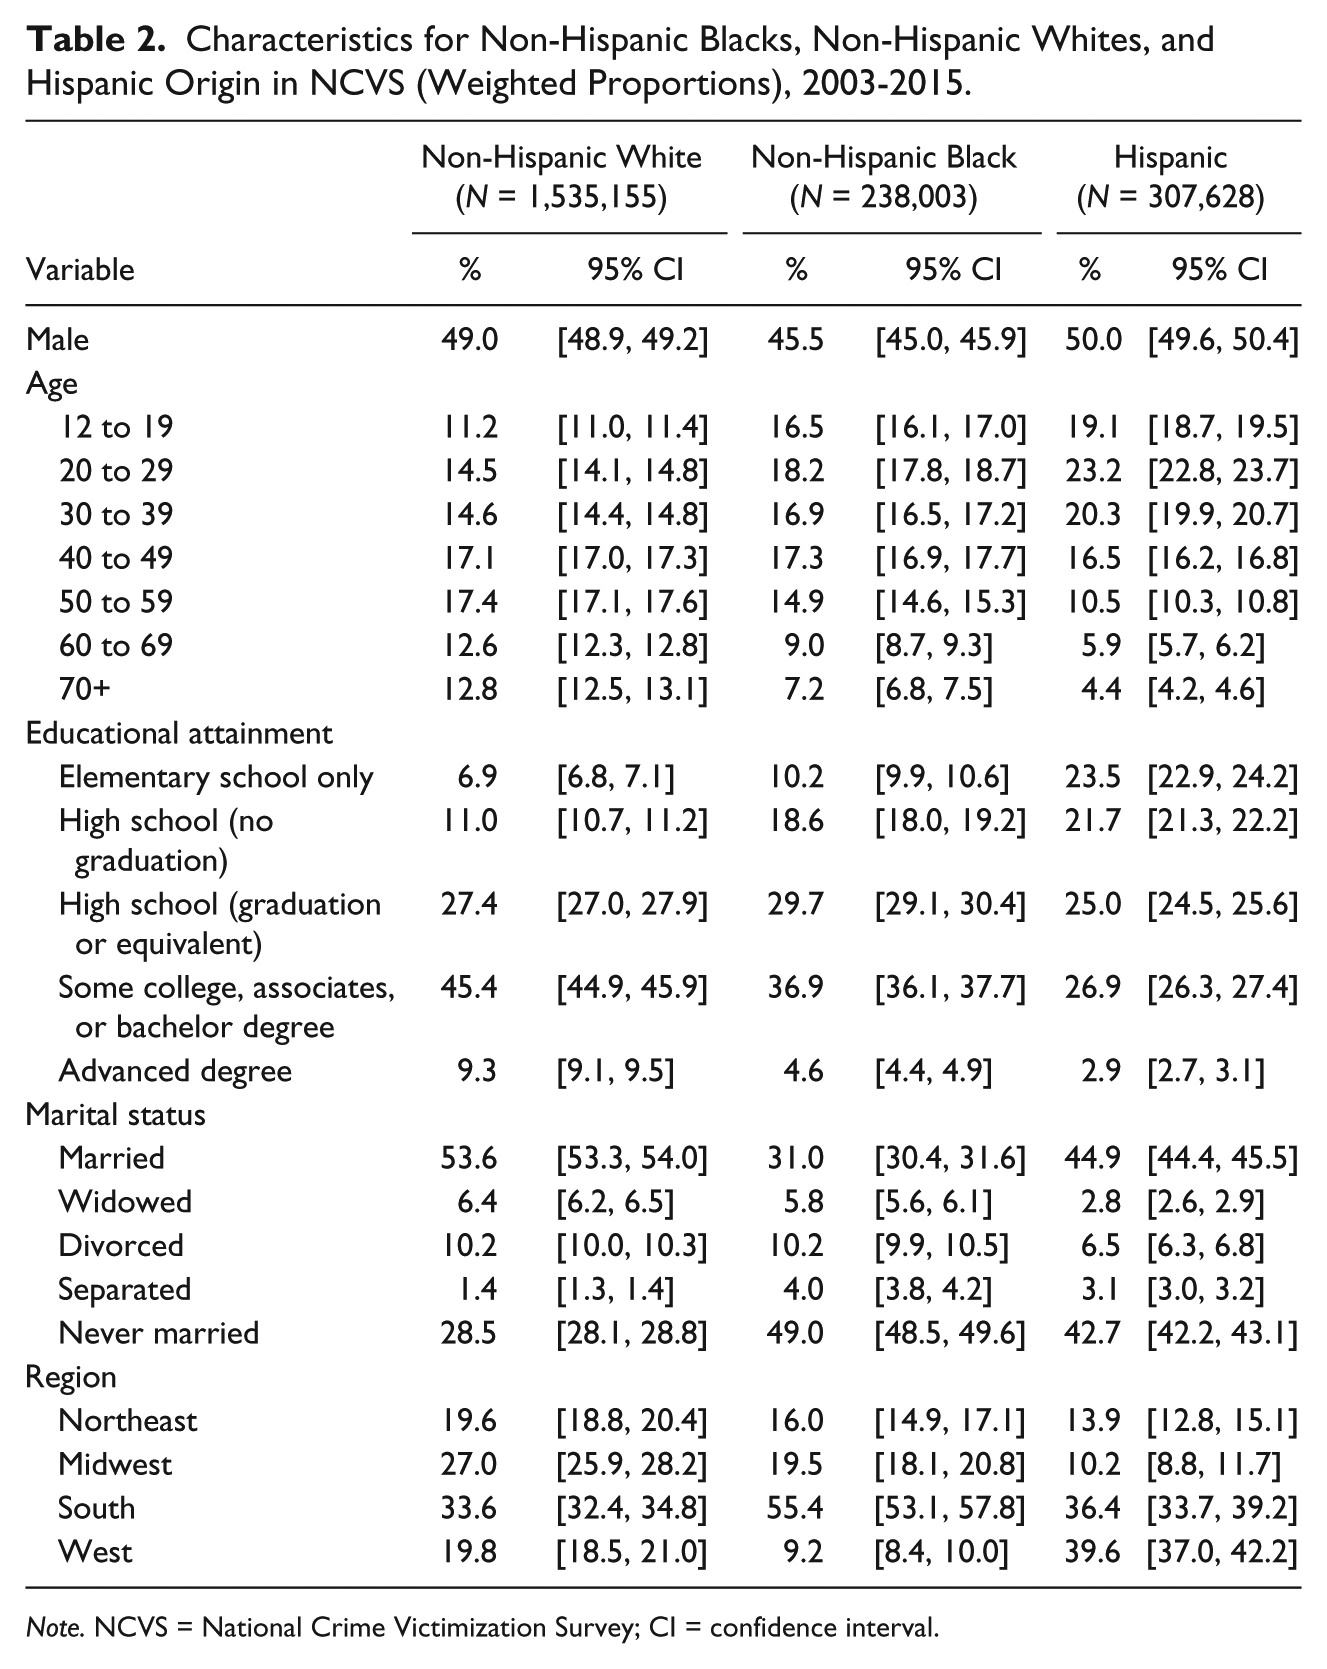
Note. NCVS = National Crime Victimization Survey; CI = confidence interval.
The overall average annual rate of non-fatal violent victimization for all three race/ethnicity groups was 2,525.3 per 100,000 (95% CI = [2,422.9, 2,627.6]). NHB had the highest average annual rate of non-fatal violent victimization in non-bias violent crime (2,768.8 per 100,000) and perceived non-race and non-ethnicity bias-motivated violent crime (92.8 per 100,000). For perceived race/ethnicity, motivated bias violent crime Hispanics had the highest rate (157.4 per 100,000) (Table 3). The unadjusted rate of non-bias violent victimization was higher for NHB compared with NHW (IRR = 1.2, 95% CI = [1.1, 1.3]); however, with adjustment for age as a continuous variable, this difference in rate did not persist. Hispanics had a lower risk of non-bias violent victimization compared with NHW in age-adjusted models (IRR = 0.7, 95% CI = [0.6, 0.7]). IRRs larger than 1 indicate elevated risk compared with the reference group.
Perceived Bias in Non-Fatal Violent Crime by Victim Race/Ethnicity, Incidence Rate and (Average Annual Incidence per 100,000 U.S. Population Age 12 or Older), IRR, and IRD 2003-2015.
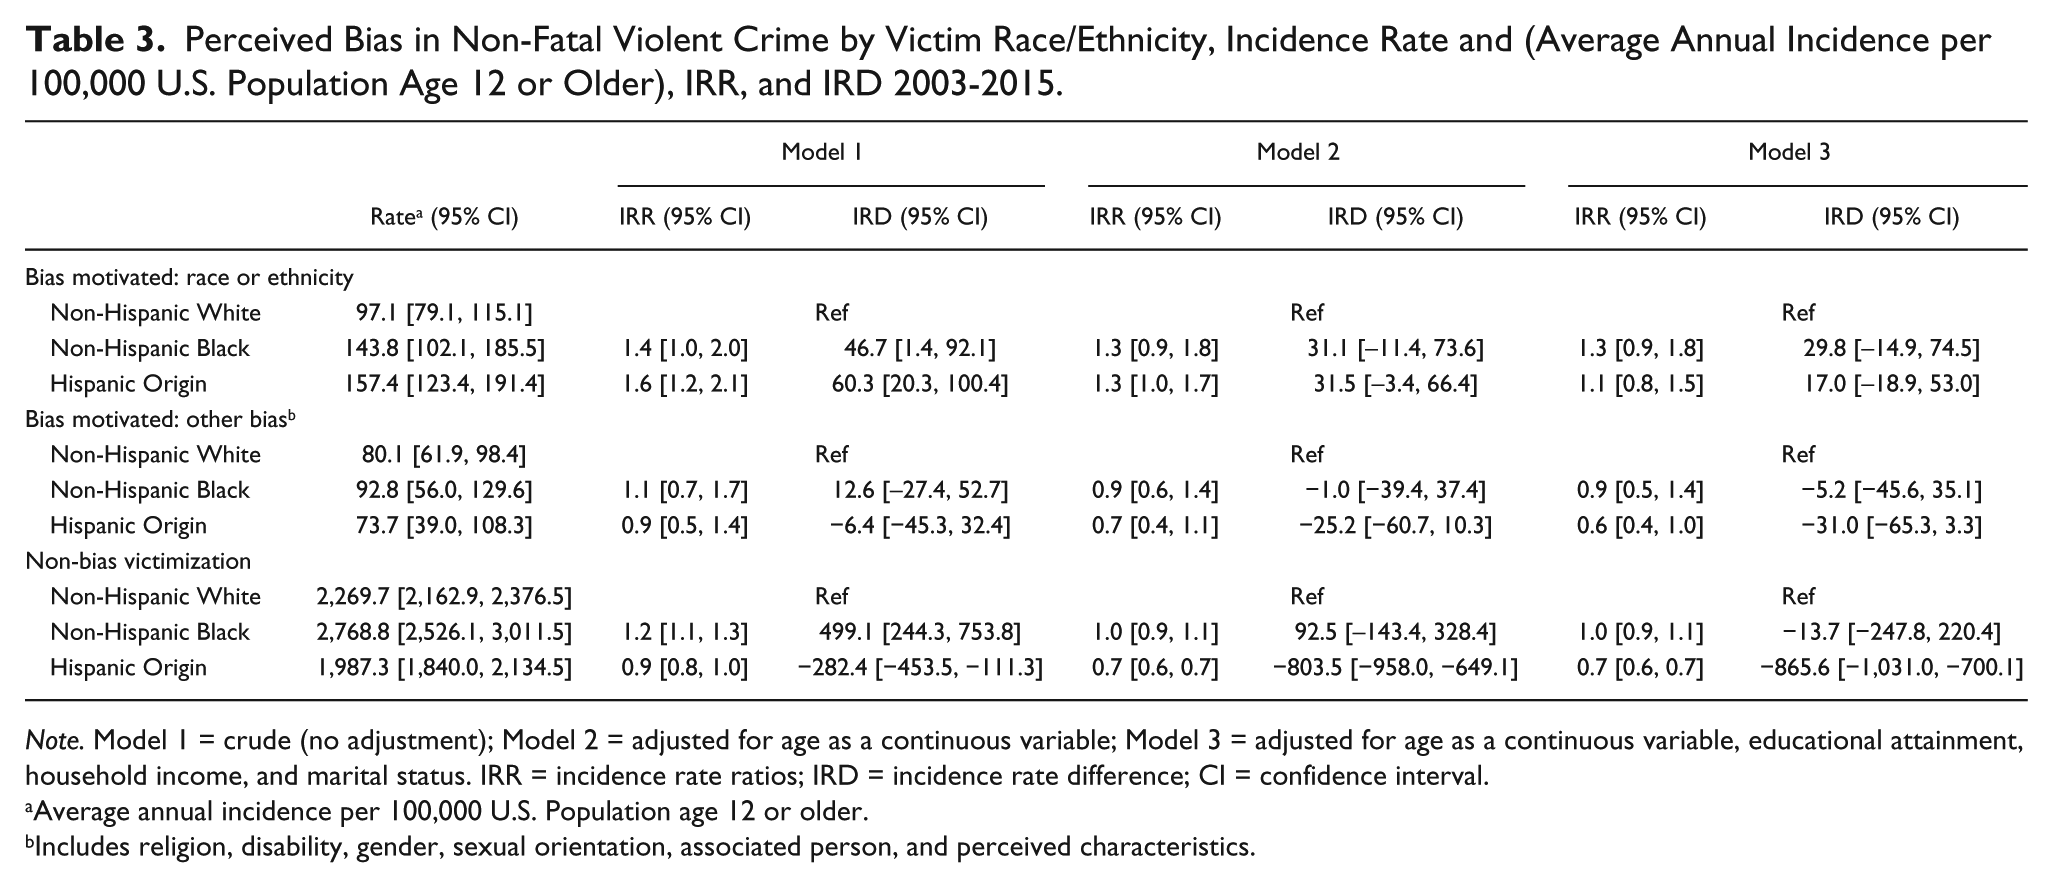
Note. Model 1 = crude (no adjustment); Model 2 = adjusted for age as a continuous variable; Model 3 = adjusted for age as a continuous variable, educational attainment, household income, and marital status. IRR = incidence rate ratios; IRD = incidence rate difference; CI = confidence interval.
Average annual incidence per 100,000 U.S. Population age 12 or older.
Includes religion, disability, gender, sexual orientation, associated person, and perceived characteristics.
The crude rate of race- or ethnicity-bias motivated violent victimization was higher for both NHB and Hispanics compared with NHW (IRR = 1.4, 95% CI = [1.0, 2.0], and IRR = 1.6, 95% CI = [1.2, 2.1]). In age-adjusted models, the estimate was attenuated for both NHB and Hispanics. The model that additionally accounted for education, marital status, and region provided similar estimates to the model adjusting only for age (Table 3). There were an estimated additional 46.7 (95% CI = [1.4, 92.1]) and 60.3 (95% CI = [20.3, 100.4]) race/ethnicity-motivated bias events per 100,000 person-years for NHB and Hispanics, respectively. There was no difference in rate of victimization between groups for non-race/ethnicity bias-motivated violent victimization (Table 3). IRD larger than zero indicate the additional number of victimizations per population. Figure 1 shows changes over time by victimization type and race/ethnicity of the victim. In Panel A, overall rates of non-bias victimization are decreasing over time in all race/ethnicity groups. Panel B demonstrates that while non-race/ethnicity bias victimizations were initially increasing for both NHBs and NHWs, those trends have been the reverse for Hispanics. Panel C suggests that while race/ethnicity-motivated bias victimizations are decreasing for NHWs and Hispanics, the trend for NHBs since 2010 has been slowly increasing.

Crime type by victim race/ethnicity by year (fit with natural cubic spline).
Among race/ethnicity-motivated violent victimization, weapon and firearm involvement did not differ between exposure categories (Table 4). Violent incidents more frequently resulted in injury or ended in some sort of medical care for NHB victims. Nearly 40% of NHB victims reported difficulties at school or work related to the incident where this was true in only 22.3% of NHW and 11.7% of Hispanic victims. Between 10% and 25% of victims across all three groups reported that the incident contributed to difficulties with friends or family, with the highest estimates for NHB and NHW victims, and less commonly for Hispanic victims (Table 4). The majority of incidents for all three groups involved a single offender. Single offenders were most commonly of a different race or ethnicity than the victim. For NHB victims, 37.2% identified a NHW offender, and for NHW victims, 45.0% identified a NHB offender. Hispanics were more commonly victimized while in transit to work or school (29.1%; 95% CI = [16.0, 47.0]) compared with NHB victims and NHW victims (14.5% and 14.4%, respectively).
Characteristics of Race/Ethnicity-Motivated Bias Crimes by Race/Ethnicity, 2003-2015.
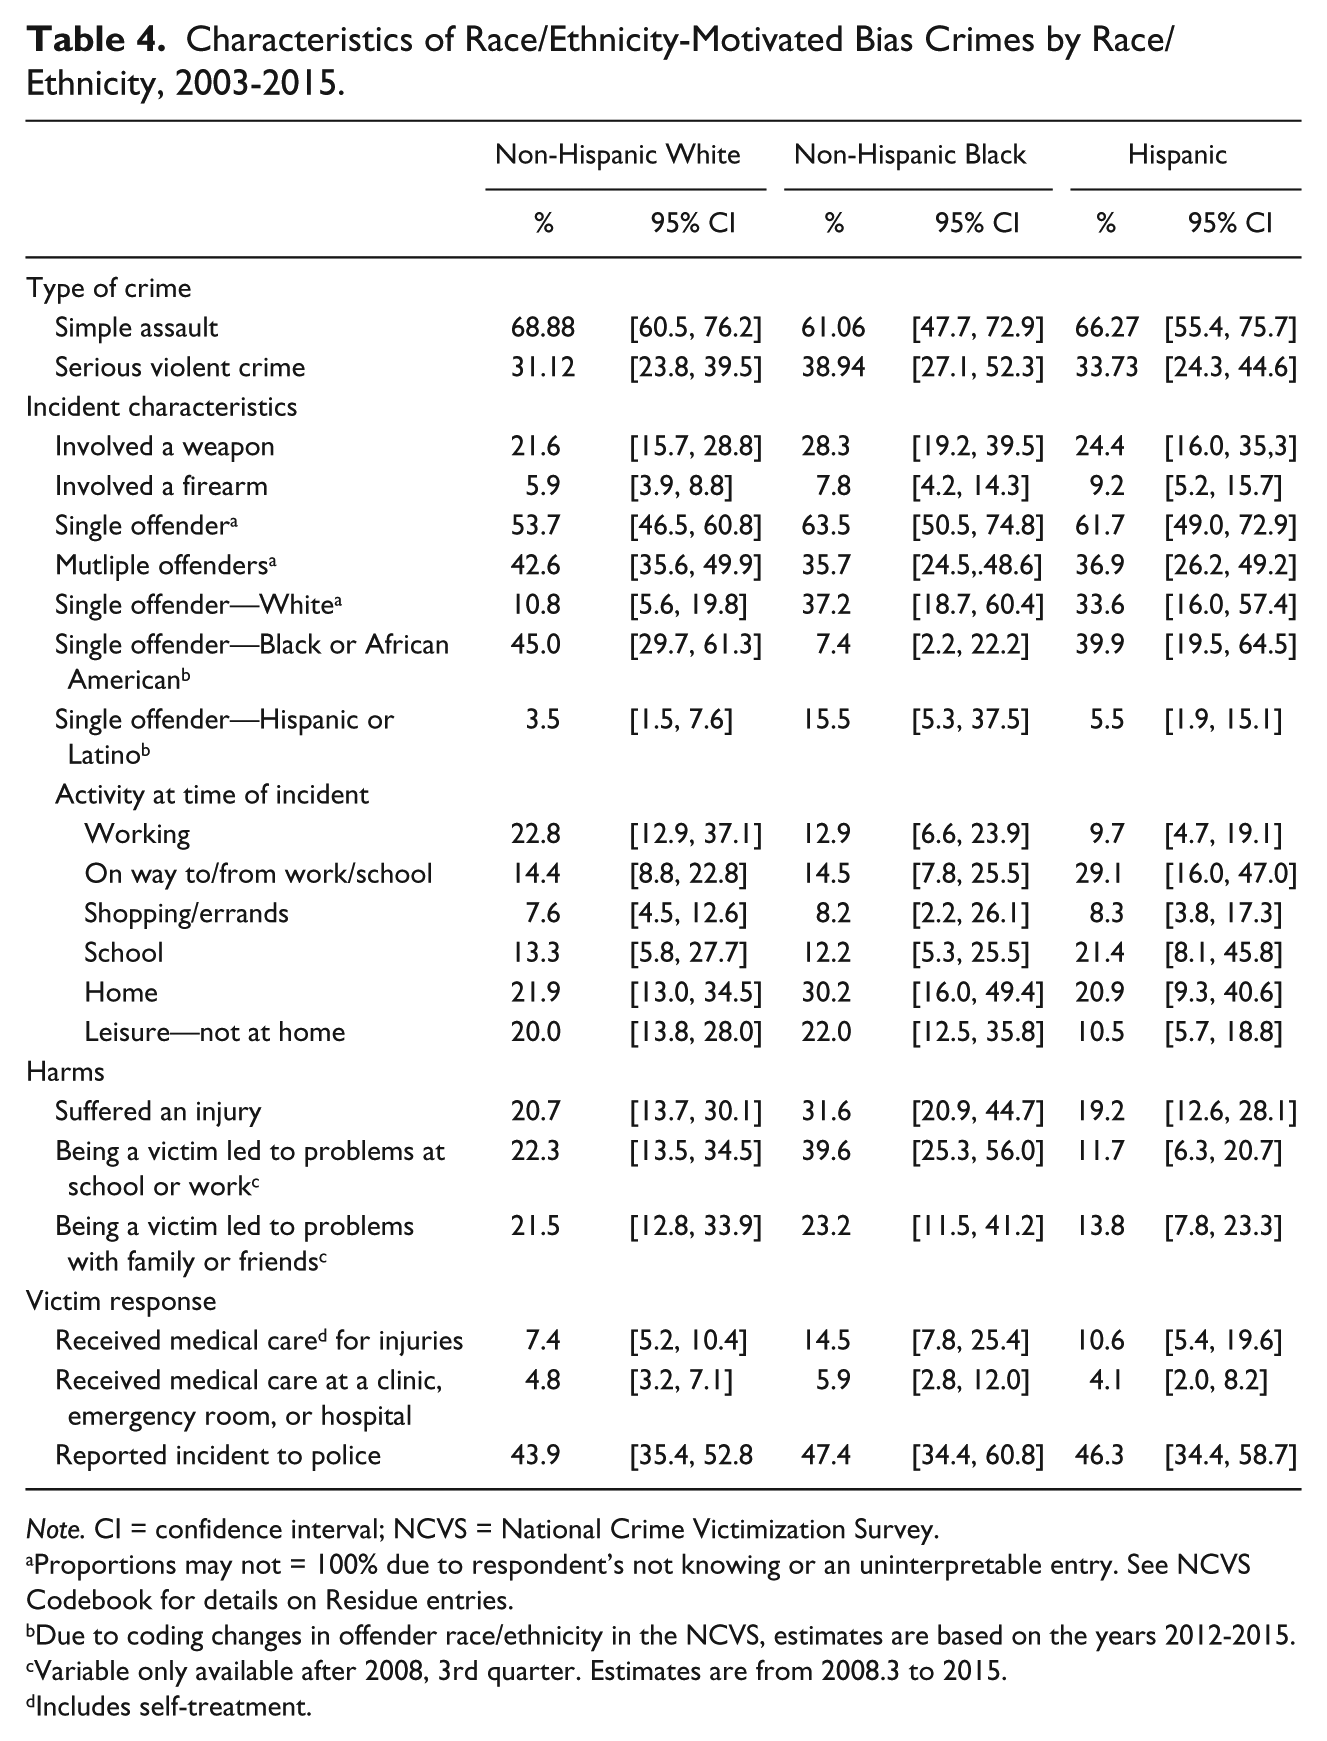
Note. CI = confidence interval; NCVS = National Crime Victimization Survey.
Proportions may not = 100% due to respondent’s not knowing or an uninterpretable entry. See NCVS Codebook for details on Residue entries.
Due to coding changes in offender race/ethnicity in the NCVS, estimates are based on the years 2012-2015.
Variable only available after 2008, 3rd quarter. Estimates are from 2008.3 to 2015.
Includes self-treatment.
Results from the sensitivity analysis generating IRRs using negative binomial regression models are presented in the supplementary tables and are not meaningfully different from the main analysis.
Discussion
To our knowledge, this is the first detailed investigation of perceived race/ethnicity-motivated violent victimization suggesting differences in risk based on victim race/ethnicity. After age-adjustment that controls for the potential confounding of victim age in the association between race/ethnicity and victimization, we found a 30% higher risk of race/ethnicity bias–motivated violent victimization for NHB and Hispanics, compared with NHW. Despite NHWs accounting for the majority of all bias violent victimizations according NCVS, the unadjusted risk for race/ethnicity-motivated violent bias crime is 40% higher for NHBs and 60% higher for Hispanics. In models adjusting for age, marital status, education, and region, the risk estimate for NHBs did not change from the model adjusting only for age; however, for Hispanics, the elevated risk did not persist compared with NHWs. This may suggest that elevated risk of victimization for Hispanics may be weaved into sociodemographic factors that occur on the causal pathway after race/ethnicity such as education, marital status, and region but before victimization. In addition to the risk of race/ethnicity-motivated bias victimization for NHBs and Hispanics, these data suggest a more frequent serious violent crime, including those entailing weapon and firearm involvement, more injuries, and higher proportions receiving medical care. These data also demonstrate that the downstream impact from the victimization on work, school, and social life is substantial with the highest proportion of difficulties reported by NHBs. The cubic spline fitted curve suggests that the population rates of race/ethnicity-motivated bias victimizations may be rising more recently for NHBs while rates for Hispanics and NHWs may be declining. This aligns with data suggesting racial animosity more recently is rising (Craig & Richeson, 2014).
Our results contribute to the existing literature on race/ethnicity bias victimization. Prior BJS reports have not included annual incidence rates for specific bias motivations. According to BJS, the average annual rate of violent bias crime victimization in the years 2004 through 2015 was 90 per 100,000 (Masucci & Langton, 2017). We report for NHWs (over 70% of the sample) that the average annual rate of violent bias crime victimization was 97.1 per 100,000 for race/ethnicity motivation and 80.1 per 100,000 for other bias motivation (Table 2). Knowing the overall BJS rate is a weighted average of rates by specific motivation (80% are race/ethnicity motivated), our results separated by motivation are consistent with the published overall annual rate of 90 per 100,000.
Pezzella and Fetzer (2015) analyzed the 2010 NIBRS to evaluate the risk of severe injury among bias and non-bias violent crime. The authors compare specific biases (anti-White, anti-Black, anti-Lesbian, etc.) with non-bias crimes and report the risk of serious injury. In their analysis, only anti-White and anti-Lesbian attacks resulted in higher odds of serious injury (odds ratio [OR] = 2.5 and 2.7, respectively) and anti-Black attacks had lower odds of serious injury compared with non-bias crimes (OR = 0.5). These findings contrast somewhat with our results where we found more injuries in race/ethnicity-motivated bias crimes among NHBs than in NHWs and Hispanics. The discrepancy in findings is likely related to different data samples and different definitions used for bias crime. The NIBRS includes only bias crimes reported to the police while the NCVS includes unreported crimes. In addition, the NIRBS is not a nationally representative sample and most major cities are not included (Masucci & Langton, 2017; “National Incident-Based Reporting System, Data Collection: Methodology,” n.d.).
The disaggregation of hate crimes into specific bias motivation has led to important public health discoveries. Prior analyses into anti–lesbian, gay, bisexual, and transgender (anti-LGBT) bias-motivated victimization demonstrated concerning associations between exposure to bias-motivated assault and risk of suicide and substance abuse (Duncan & Hatzenbuehler, 2014; Duncan, Hatzenbuehler, & Johnson, 2014; Mereish, O’Cleirigh, & Bradford, 2014). Furthermore, the intersection of sexual orientation, race, and gender, among other identity defining characteristics, may have important public health consequences when considering the effects of, and resilience from, bias victimization (Dunbar, 2006; Mereish et al., 2014). Detailed and sophisticated analytic approaches are necessary to better understand these relationships and the public health implications knowing that specific bias-motivated victimizations may have variable risks and consequences in different scenarios and for different groups.
These data demonstrate that victims report a perpetrator from another race/ethnicity group in a majority of cases. Although this finding is expected given the nature of the topic, in the context of other results, the implications may be broader. Specifically, although documented race/ethnicity bias victimization is relatively rare, hate crime is known to create personal and community instability, diminishes inclusion and trust between groups, and can potentially exacerbate uneven power dynamics at a society level (Pezzella & Fetzer, 2015). Taking together the higher overall risk of victimization among NHBs and Hispanics with the greater burden of severity for NHBs and the race/ethnicity profile of offenders suggests an environment of structural disadvantage of certain groups compared to others. This structural disadvantage includes preservation of power disparities between majority and minority populations similar to descriptions in the racial theory of interracial violence (Blalock, 1967). For these reasons, taking a public health approach to understanding race/ethnicity-motivated violent victimization is an appropriate step to capture how inequity is manifest in health outcomes amid the complex interactions between social structures, individual risks, identity, and legal frameworks.
These data have limitations. The NCVS is a large, multiyear dataset and the data are subject to both sampling and non-sampling survey error (NCVS, Technical Documentation, 2014). Also, the information contained in the NCVS is entirely self-report. This is an important aspect to consider as bias victimization among vulnerable groups are thought to be underreported to law enforcement (Berrill, 1990; Herek, Gillis, & Cogan, 1999; Torres, 1999). The biases inherent in databases that requires reporting to authorities are well documented (Boyd, Berk, & Hamner, 1996; Haider-Markel, 2002; McDevitt, Levin, & Bennett, 2002; Nolan & Akiyama, 1999). Whether or not these barriers to reporting are present also for national surveys has not been empirically studied to our knowledge with regard to bias victimization. However, it is reasonable to ask whether differential barriers to self-reporting of race/ethnicity bias victimization on national surveys among race/ethnicity groups might affect our results. Current limitations in available evidence do not provide for sufficient guidance to infer the direction or magnitude of those potential differences. In addition to consideration of underreporting of events to law enforcement or on national surveys, the information provided in the NCVS is not verified by outside sources. Also, given the nature of the data collection mechanism, these are exclusively non-fatal events. With the knowledge that bias crimes may in fact be more severe, limiting our outcome to non-fatal victimization would bias our results toward the null. In consideration of the association between victim race/ethnicity and risk of race/ethnicity-motivated violent victimization, to interpret the estimates in Model 3 as the direct effect of race/ethnicity, several assumptions would have to be met, many of which are difficult to test in these data (VanderWeele & Robinson, 2014). Additional analyses to elaborate the complex interactions between race/ethnicity, socioeconomic status, and risk of race/ethnicity-motivated violent victimization would ultimately be informative.
Conclusion
Although NHW account for the majority of bias victimizations, the risk of non-fatal violent victimization motivated by race/ethnicity is higher for NHB and Hispanics compared with NHW. Also, the crimes perpetrated against NHB are more severe in the immediate and post-victimization period. There is incongruity between victim and offender race/ethnicity in most cases, which, when considering the differential risk and severity of these crimes, suggests an environment of structural disadvantage of certain groups compared with others. Programs seeking to attenuate racial or ethnic tensions are likely to create public health benefits, especially for communities of color.
Supplemental Material
Supplementary_Table – Supplemental material for Differences by Victim Race and Ethnicity in Race- and Ethnicity-Motivated Violent Bias Crimes: A National Study
Supplemental material, Supplementary_Table for Differences by Victim Race and Ethnicity in Race- and Ethnicity-Motivated Violent Bias Crimes: A National Study by Robert A. Tessler, Lynn Langton, Frederick P. Rivara, Monica S. Vavilala and Ali Rowhani-Rahbar in Journal of Interpersonal Violence
Footnotes
Authors’ Note
The views expressed are those of the author (L.L.) and do not reflect the official views or position of the U.S. Department of Justice. Robert A. Tessler is also affiliated with University of Pittsburgh, Pittsburgh, PA. Lynn Langton is now affiliated with RTI International in Durham, N.C.
Declaration of Conflicting Interests
The author(s) declared no potential conflicts of interest with respect to the research, authorship, and/or publication of this article.
Funding
The author(s) disclosed receipt of the following financial support for the research, authorship, and/or publication of this article: This study was supported by grant 5 T32 HD057822-08 from NICHD.

Supplemental Material
Supplemental material for this article is available online.
Author Biographies
References
Supplementary Material
Please find the following supplemental material available below.
For Open Access articles published under a Creative Commons License, all supplemental material carries the same license as the article it is associated with.
For non-Open Access articles published, all supplemental material carries a non-exclusive license, and permission requests for re-use of supplemental material or any part of supplemental material shall be sent directly to the copyright owner as specified in the copyright notice associated with the article.
