
Abstract
Universities using closed circuit television (CCTV) systems often tout its deterrent role when justifying the use of this technology. Using a sample of 336 U.S. universities, we examine the relationship between CCTV and reported crime rates using Clery Act crime data to discern whether CCTV has a deterrent impact on campus crime, controlling for other variables. We find that CCTV appears to have little to no impact. Rather, crime rates are associated with location (suburban, urban, rural), institutional control (public, private), student population density, level of tuition and fees, student-body demographics (e.g., gender, race), and crime control practices other than CCTV (e.g., scheduled security patrols, student transportation/escort services). These relationships differ by type of crime (e.g., property vs. violent). Implications for policy and future research are discussed.
Introduction
While research has examined the myriad causes and correlates of campus crime (Bromley, 1995a; Fisher, Sloan, & Wilkins, 1995; Sloan & Fisher, 2010), the role of closed circuit television (CCTV) and its impact on campus crime has received little systematic attention, though claims about its importance as a technological crime fighting tool are widespread. This article examines the relationship between CCTV and campus crime rates and asks the following question: How does the presence of CCTV correlate with reported crime on college campuses?
A national study of university CCTV policies reports that most policies take the position that CCTV prevents personal and property crime on campus (Meehan, Liedka, Lauer, Michel, & Harmus, 2012). The deterrence rationale was not only explicitly mentioned but also reflected in terms such as preventive observation, and early intervention. Deterrence is at the core of these justifications and with it a concomitant belief in the efficacy of CCTV in preventing crime and violence. Such a belief is common among campus police officials (see Fickes, 2010a, 2010b; Furno-Lamude & Zannes, 1999), reflected in government documents (U.S. Department of Education, Office of Safe and Drug-Free Schools, 2010; U.S. Department of Homeland Security, 2012) and promoted by security experts (Chace, 2002; Woodward, 2002).
Surveillance systems like CCTV are not unique to educational settings but, rather, a feature of modernity (Lyon, 2007). Camera systems have become ubiquitous and widely accepted in the United States especially since 9/11. A 2004-2005 Department of Justice (Reaves, 2008) survey of campus law enforcement indicated that 69% of campus police agencies report monitoring surveillance cameras as one of their functions: an activity not even mentioned in the same survey 10 years earlier (Reaves & Goldberg, 1996). Indeed, universities received Federal funding after 9/11 to create more secure campuses (Sloan & Fisher, 2010). Mass shootings at Virginia Tech and Northern Illinois further accelerated security efforts and institutional accountability, including more CCTV surveillance systems and other security measures such as mass notifications, active shooter plans, and behavioral reporting systems. 1
The educational market for video surveillance and access control products was US$210 million in 2014 with projected growth to US$1.1 billion per year by 2018 and universities accounting for 40% of that market (“Market for School Physical Security,” 2014). Reports of expanding CCTV infrastructure are commonplace in higher education trade publications. Blackford (2013) reports the University of Kentucky recently spent US$5 million on a security system with 2,000 cameras. Thus, universities are a growing market for techno-security equipment similar to what occurred at the elementary and secondary education levels (Casella, 2006). Marx (1995) notes that the hype surrounding technological efforts to control crime often amounts to an unsuccessful search for the legendary silver bullet, or what we call the technological “fix.” As Marx observes, technologies are the driving force, and human decision makers are too willing to downplay, or ignore the social ends (or consequences), simply because the technological means exist.
We would argue that the intentions of campus decision makers implementing technological solutions are motivated both by intense political pressures and a genuine desire to address campus crime. There is no need to invoke the misused and misunderstood specter of Big Brother to dismiss criticism of CCTV (cf. Milshtein, 2015). Setting aside good intentions, however, the larger questions surrounding decisions to deploy technologies cannot ignore the political and rhetorical discourses surrounding such choices (Haggerty, 2009). Higher education’s embrace of video surveillance parallels how Britain (and the United States) emerged as one of the most visually surveilled in the world. As Haggerty (2009) notes, “CCTV was not introduced because of its demonstrated abilities, but was an initiative intricately bound up with a form of symbolic politics that sought to convey to the British people that politicians were responsive to their concerns about crime” (p. 288). A similar pattern is reflected in U.S. universities’ embrace of CCTV, except systematic studies of CCTV’s capabilities have neither occurred before or after implementation.
Sloan and Fisher (2010) illustrate the symbolic politics of U.S. campus crime and its far-reaching consequences. In the 1980s and 1990s, public pressure to “do something” about highly publicized campus crimes mobilized different interests, including campus crime victim groups, campus feminists, and public health researchers. These groups successfully altered public perception about campus crime often using anecdotal evidence and questionable studies highly publicized in the news media. As a consequence, policy makers have become sensitized to their interpretation and have been quick to respond.
The most significant and far-reaching political response was the first federal law requiring universities to report crime data: the Crime Awareness and Campus Security Act of 1990. 2 This Act expanded the role of campus law enforcement and the security communities (including technology vendors) in the campus crime crisis. It created a demanding context of accountability and responsibility for campus crime and, with it, the search for solutions. This effort entailed closer cooperation with senior campus administration to manage an increased regulatory environment and the legal liability exposure (Fickes, 2010a) that inextricably wove together law enforcement and administration interests.
The “dangers” of campus crime have largely centered on the most fearful events: violent crimes such as the rape and murder of Jeanne Clery and, in recent years, mass shootings. Campus shootings are statistically rare events (Kaminski, Koons-Witt, Thompson, & Weiss, 2010; U.S. Department of Homeland Security, 2012). Nonetheless, such events significantly shape the discourse about campus crime. Campuses are now considered soft and vulnerable targets in need of security measures among which video surveillance figures prominently.
However, these solutions typically assume CCTV has a significant role in deterring crime, and underplays or outright dismisses its impact on those values associated with the educational mission of universities (Michel, 2013). Ironically, law enforcement and security professionals and proponents of CCTV within university administration acknowledge this last issue while extensively expanding the use of CCTV systems. For example, privacy concerns may conflict with the underlying intent of the educational environment leading to a chilling effect on creativity, individualism, and intellectual development. The prioritization of security detracts from individual development by placing undue emphasis on conformity and rules thus weakening academic development. Security may be perceived as a message of distrust that enhances authoritarianism and inhibits open communication between the administration and students. “For these reasons, school authorities should weigh carefully the reason for and against the usage of these surveillance systems and use them only if no other options are available” (U.S. Department of Homeland Security, 2012, p. 150).
There is a paradox: CCTV systems are proliferating on campuses based on their assumed deterrent efficacy which is understudied, while other social impacts are relegated to the sidelines in the name of security. It is a familiar scenario. Highly publicized events precipitate responses where technology is the proposed solution bolstered by anecdotal success narratives. Opposition is dismissed with sentiments such as “security trumps privacy” and the specter of crime, especially violent crime (Fickes, 2010a).
Policies regulating CCTV are often offered as protection against potential damages to the educational environment and individual freedom from unwarranted intrusions (Dodd, 2014; Fickes, 2010a). Yet, only 12% of the universities in a national sample had policies governing CCTV usage (Meehan et al., 2012) despite Department of Homeland Security recommendations that “strict policies must be adhered to in order to maximize the value of internal cameras without negatively impacting the learning environment” (U.S. Department of Homeland Security, 2012, p. 150). In higher education, the research on CCTV is descriptive and uncritically prescribes the use of CCTV for college campuses, for example, Lepon and Popkin (2007) and Massachusetts Department of Education (2008). However, without an empirical examination of the relationship between CCTV and crime on campus, claims about its deterrent capabilities remain just that, claims.
Our test of the deterrent effect of CCTV is straightforward—where CCTV is utilized, its impact on crime, broadly defined, should be negative and significant when controlling for other variables. While this is a cross-sectional study of CCTV and crime, given the dearth of empirical studies of CCTV on college campuses, this is an important and appropriate first step that utilizes a representative national sample to test the relationship between CCTV and variables known to predict campus crime. Our analysis is not about the causes or correlates of campus crime per se or the accompanying theories to explain campus crime. Rather, our findings and discussion are limited to the role of CCTV and its impact on campus crime rates, given the belief that CCTV has a deterrent impact.
CCTV, Deterrence, and Crime
Deterrence theory argues that potential offenders are, at some level, rational actors who can be dissuaded from committing criminal acts when the risks or costs to committing crime outweigh the rewards. Deterrence theory would imply that CCTV technology alters the risk side of the offender calculus by potentially increasing the certainty of detection, especially when no other capable guardian (e.g., a police officer or passerby) is present (Farrington, Gill, Waples, & Argomaniz, 2007). 3 The camera acts as the technological replacement for humans, suggesting that someone is or may be watching their activities. Furthermore, depending on the CCTV system, the camera is recording and saving behaviors, and combined with analytic software, alerting authorities in real time that suspicious behavior has been discerned by a programmed algorithm (Harwood, 2007).
While there are no studies that test the impact of CCTV on campus crime, an extensive criminological literature has examined the effectiveness of CCTV in reducing crime (primarily) in urban settings. This literature offers some insight into the conditions where CCTV might be effective in the university context. The best meta-analysis of CCTV is provided by Welsh and Farrington (2003, 2009b) which only included studies where CCTV was the main intervention; had a pre and post-installation design, with crime (violent and property) as a specific outcome measure; and where the levels of crime pre-installation were high enough to insure an appropriate statistical comparison. Welsh and Farrington (2009a) note too that they “did not find any high-quality evaluations of the effects on crime of surveillance measures in schools, universities, or government buildings” (p. 137).
What they found was that in city centers, public housing, and public transit areas, CCTV had no impact on violent or property crime. In parking garages, they estimated a 26% decrease in theft from vehicles (Welsh & Farrington, 2009b). However, other interventions (such as lighting and security guards) were also present in these settings suggesting this decrease in property crime could not be solely attributed to the use of CCTV.
Ratcliffe, Taniguchi, and Taylor (2009) examined the use of CCTV in Philadelphia. They found that CCTV had no significant impact on serious crimes (which combined violent and property crime) but did on public disorder crimes. Specifically, there was a 5% reduction in serious crimes and a 16% reduction in public disorder crimes. Thus, similar to Farrington and Welsh, this study suggests that CCTV has limited effects by type of crime.
La Vigne, Lowry, Markman, and Dwyer (2011) examined the use of CCTV in Washington, D.C.; Baltimore; and Chicago. They noted that community stakeholders (ostensibly criminal justice officials) viewed CCTV as an effective deterrent (and useful for investigations and prosecution) and that these views “were largely—but not consistently—supported by impact analyses” (La Vigne et al., 2011, p. xii). However, closer examination of their analysis urges more caution about these crime reduction benefits. The comparison of crime before/after installation found that only 12.3% (nine out of 73) of the time-series tests showed a statistically significant reduction in crime, suggesting a minimal impact of CCTV. This reinforces Welsh and Farrington’s meta-analyses: CCTV has a limited impact on crime reduction.
Translating this research to university settings suggests that CCTV will have no significant impact on violent crime and may have a limited impact on some types of property crime and perhaps public disorder crimes. Furthermore, where studies argue that CCTV has been effective, context clearly matters. Results have varied by neighborhood settings within urban areas, or a CCTV intervention occurred in conjunction with other environmental changes (e.g., lighting) or changes in enforcement practices (e.g., increased security patrols) suggesting a significant role for these factors. This has led most scholars to conclude that CCTV is best deployed to address property crimes in “hot spots” and in conjunction with other measures (e.g., better lighting, security patrols). Thus, a second generation of CCTV research examines the conditions under which CCTV may be effective by testing factors such as lighting conditions and the presence of place managers (Welsh & Farrington, 2009a), camera density, and the line of sight of cameras (Caplan, Kennedy, & Petrossian, 2011; Piza, Caplan, & Kennedy, 2014).
CCTV and Educational Settings
In educational settings, studies have largely focused on secondary schools and do not specifically examine CCTV’s impact on crime per se (Hope, 2009; McCahill & Finn, 2010; Monahan & Torres, 2010; Taylor, 2010). Hope (2009) studied the implications of CCTV on social control in schools and concluded that CCTV shifts the educational focus and values from the development of student self-control (or self-surveillance) to an institutional emphasis on direct observation, the disciplining of deviant/risky student behavior, and the “target hardening” of the school environment. Taylor (2010) and McCahill and Finn (2010) examined student perceptions of CCTV and its impact on privacy with the role of CCTV mentioned in the detection of minor offenses (e.g., vandalism) and school policy infractions. The implication from this research is that CCTV has an important deterrent impact on crime, as well as serving retrospective investigative uses after a crime or misbehavior has occurred.
In higher education, a report by the Massachusetts Department of Education (2008) examined campus security practices and technologies and found that 54% of 24 surveyed public universities in the State of Massachusetts utilized CCTV systems. Indeed, they proposed that CCTV systems are a best practice for the prevention of violent crime and should be established at every state college and university. However, they presented no evidence supporting the deterrent or preventive capabilities of CCTV.
A study at the University of Maryland (Alvarado et al., 2011) evaluated the implementation of CCTV in student residential areas that were hot spots for larceny, burglary, and robberies. Pre/post crime statistics analysis and a student perception survey revealed no significant decrease in crime after implementation of CCTV and students perceived a decreased sense of safety after camera implementation (Alvarado et al., 2011). To summarize, the research literature on CCTV in educational and university settings is sparse. While there is a generalized belief in the deterrent capability of CCTV, this premise has not been empirically examined.
Data and Method
Sample Description
A list of 4-year degree granting institutions was generated using the Carnegie Classification system. Colleges identified as a baccalaureate, master, or doctoral granting institution that were 4-year public or private, not-for-profit institutions were included. Service academies, institutions in Guam and Puerto Rico, and special focus institutions such as seminaries, or professional schools with a limited focus on health, business, or law careers were excluded. Thus, a total of 1,361 institutions constitute the universe of colleges and universities for this study.
From this universe, a stratified random sample of 370 institutions was generated. The strata were defined by (a) region of the country; (b) urban, suburban, or rural/town area; (c) whether the institution was public or private; and (d) whether the student body was primarily residential or commuter. All analyses are weighted by the probability of selection from the universe of 1,361 colleges and universities allowing us to make estimates about the larger population of universities in the sampling frame.
We utilize the crime data supplied by colleges through the Clery Act reporting system. There are recognized weaknesses of Clery data (Gregory & Janosik, 2002). Nonetheless, they are the only legally required and systematically collected data on campus crime and shape public perception of crime on college campuses. 4 Under the Clery Act, college and universities must report offenses in three general categories: (a) criminal offenses known to campus police, (b) hate crimes and bias-motivated incidents, and (c) arrests and disciplinary referrals for weapons and drug violations. In addition, the Act requires campuses to report crime by three locations: (a) on campus, (b) on public property within or adjacent to campus, and (c) noncampus buildings or property owned or controlled by the institution. 5
Three institutions in our sample are exempted from reporting Clery Act data. One school was a religious-run institution that refuses Title IV financial aid for students and the other two schools were online-only schools. An additional 31 schools are omitted due to missing data on one or more independent variables. The resulting final sample size is 336.
Dependent Variable: Campus Crime
The dependent variable is criminal offenses known to the campus police in any of the locations under campus jurisdiction, including facilities separate from the main campus. Reported criminal offenses for the calendar years 2009, 2010, and 2011, across the three relevant institutional locations (see above), were combined over the three reporting years. 6 As offenses for any given institution can greatly fluctuate from year-to-year, combining across reporting years stabilizes them.
Under Clery, criminal offenses include criminal homicide, forcible and nonforcible sexual crimes, robbery, aggravated assault, burglary, motor vehicle theft, and arson. These data mirror Part I Uniform Crime Report data with one important exception: They exclude larceny/theft. Larceny is the most commonly reported Part I crime, and its absence in Clery data has been criticized, suggesting that Clery data seriously underrepresents the true amount of campus crime (Bromley, 1995a; Fisher et al., 1995; Hummer, 2004).
This underrepresentation is significant. For campuses reporting both Clery and uniform crime reporting (UCR) in our sample, the average property offenses per campus for the years 2009-2011 in total is 98.7 (Clery) and 576.65 (UCR). Thus, for every reported property crime in Clery, the UCR report contains six. This is largely due to Clery excluding the larceny-theft category. The differences are not as great for violent offenses. The average of violent offenses per campus reported to Clery over this time frame is 36.4, whereas the average of reported offenses to UCR is 19.3. Thus, Clery data reflect almost twice as much violent crime on campus than UCR data.
Independent Variable: Presence of CCTV
Identifying the presence of CCTV in our sample involved a multistep process. First, a systematic keyword search of university websites was conducted to discern whether the campus had a CCTV policy or whether there was evidence of CCTV in use. Examples of evidence included mentioning CCTV in student handbooks, meeting minutes, or university budgets. Second, emails were sent to the chief information officer and chief of police of all 370 institutions in the original sample, asking whether they used CCTV and whether the institution had a policy for administering the camera system. Third, Peterson’s Guide to Undergraduate Institutions identified security practices, including CCTV.
Control Variables
Additional security features
Research indicates other campus security practices that may impact campus crime (Barton, Jensen, & Kaufman, 2010). We utilized Peterson’s Guide (2009) to identify the security practices reported by universities in our sample: (a) 24-hr emergency alert systems (e.g., blue-light phones, text alerts), (b) controlled dormitory access (e.g., key card), (c) security patrols by campus police, (d) voluntary student patrols, and (e) a campus transportation/escort service. The first two are technologically based practices like CCTV, while the latter requires a person to carry out the practice. Each of these variables was included as a dummy-coded variable.
Institutional characteristics
The Carnegie Classification system provided data on the location of schools, the residential/commuter status of students, and whether the school is public or private. 7 Institutions were classified as either urban, suburban, and town/rural. Urban and rural locations were dummy-coded variables with town/rural as the reference category. Primarily residential and highly residential colleges were combined and classified as residential; primarily nonresidential institutions constitute the commuter campuses. Commuter campus was dummy-coded with residential campuses, the reference category.
Finally, we controlled for the rate of crime for the geographic area where each school is located. The argument is that the campus crime rate could reasonably be related to the crime rate of the surrounding environment. For example, a campus located in a high-crime area might have a higher campus crime rate. The smallest geographic area for which each school could be matched was the county level. County crime rates were taken from the Uniform Crime Reports. 8 For our analysis, we used the county UCR violent crime rate (per 100,000) for analyses of campus violent crime, and county UCR property crime rate (per 100,000) for analyses of campus property crime.
Student-body characteristics
Following standard practice, we controlled for race and gender. The percentage of minorities in the student body and the percentage of male were included as control variables. We used data on the proportion of students receiving Pell Grants as a proxy measure of social class and economic background. Pell Grants are determined and valued based on student need. Thus, the greater the proportion of an institution’s student body receiving a Pell Grant, the lower the socioeconomic status of that student body. Student demographic and Pell Grant data were taken from the Integrated Postsecondary Education Data System (IPEDS). 9
Research has suggested that student alcohol and drug use increases levels of campus crime (Harford, Wechsler, & Muthen, 2003; Scribner et al., 2010). Clery data on arrests of students (per 1,000 students) for alcohol and drug use violations served as a proxy measure of substance abuse, recognizing that arrest data underestimate the amount of substance abuse by students.
Analytic Strategy
The standard approach to analyzing crime rates uses ordinary least squares applied to the natural logarithm of the crime rate per 100,000 residents. This approach leads to problems with campus crime data. Nearly half of our sample (47.0%) reports no violent crime, and one sixth of the sample (16.2%) reports no property crime. 10 The ordinary regression approach fails under such circumstances. Osgood (2000) suggests a solution involving the use of a Negative Binomial regression of crime offense counts, rather than using crime rates. By using the population base of the reporting unit as an offset variable, crime rates are embedded within the analysis. Thus, our response variable consisted of the total count of violent or property offenses reported to Clery for the 3-year period 2009-2011. We used the total of student enrollment over those years as the base population in an offset variable. 11
An advantage of the negative binomial model regressions of total offenses while including student enrollment as an offset variable is the ease of interpretation. Estimated coefficients are conveniently viewed as direct multipliers of the crime rate per enrolled student. We estimated four models each for violent and property crime rates. The first model contained the CCTV variable, the second added the additional security practices, the third added institutional characteristics, and the fourth introduced student-body characteristics.
Results
Table 1 provides descriptive statistics. The mean campus violent crime rate is 105.11 per 100,000, and the mean campus property crime rate is 359.74 per 100,000. The campus violent crime rate is roughly one quarter the size of the county violent crime rate. However, the campus property crime rate is about one eighth the size of the county property crime rate, which is not surprising given Clery reporting requirements exclude larceny or theft.
Descriptive Statistics (Weighted by Probability of Sample Selection, n = 336).

Note. CCTV = closed circuit television; UCR = uniform crime reporting.
Campuses use an array of security practices. Just over one third (38.3%) utilize CCTV, our independent variable. Other technologically based security practices include 24-hr emergency alert systems (87.6%) and electronically controlled dormitory access (72.9%). The dominant person-based security practices include scheduled security patrols by campus police (90.5%), the use of transportation/escort services (85.4%), and voluntary student patrols (42%).
The institutions are likely to be urban (46.4%), residential (77.9%), and public (62.2%). The average number of students per acre (density) is 85.2 and about half of the campuses have fraternity/sorority systems. The average tuition and fees is US$17,555. The student population is predominantly White (64.7%), female (58.1%), and slightly more than one third receive Pell Grants. There are about 490 campus arrests per 100,000 students for drug or alcohol violations.
CCTV and Violent Crime
Negative binomial regression results for violent campus offenses are presented in Table 2. Model 1 contains the independent variable CCTV and the control for county violent crime rate. In Model 2, additional security practices other than CCTV are added. In Model 3, institutional characteristics are introduced to control for any structural differences among colleges in the sample. Finally, in Model 4, student characteristics are included to control for differences in student populations.
Negative Binomial Regression of Violent Crime.
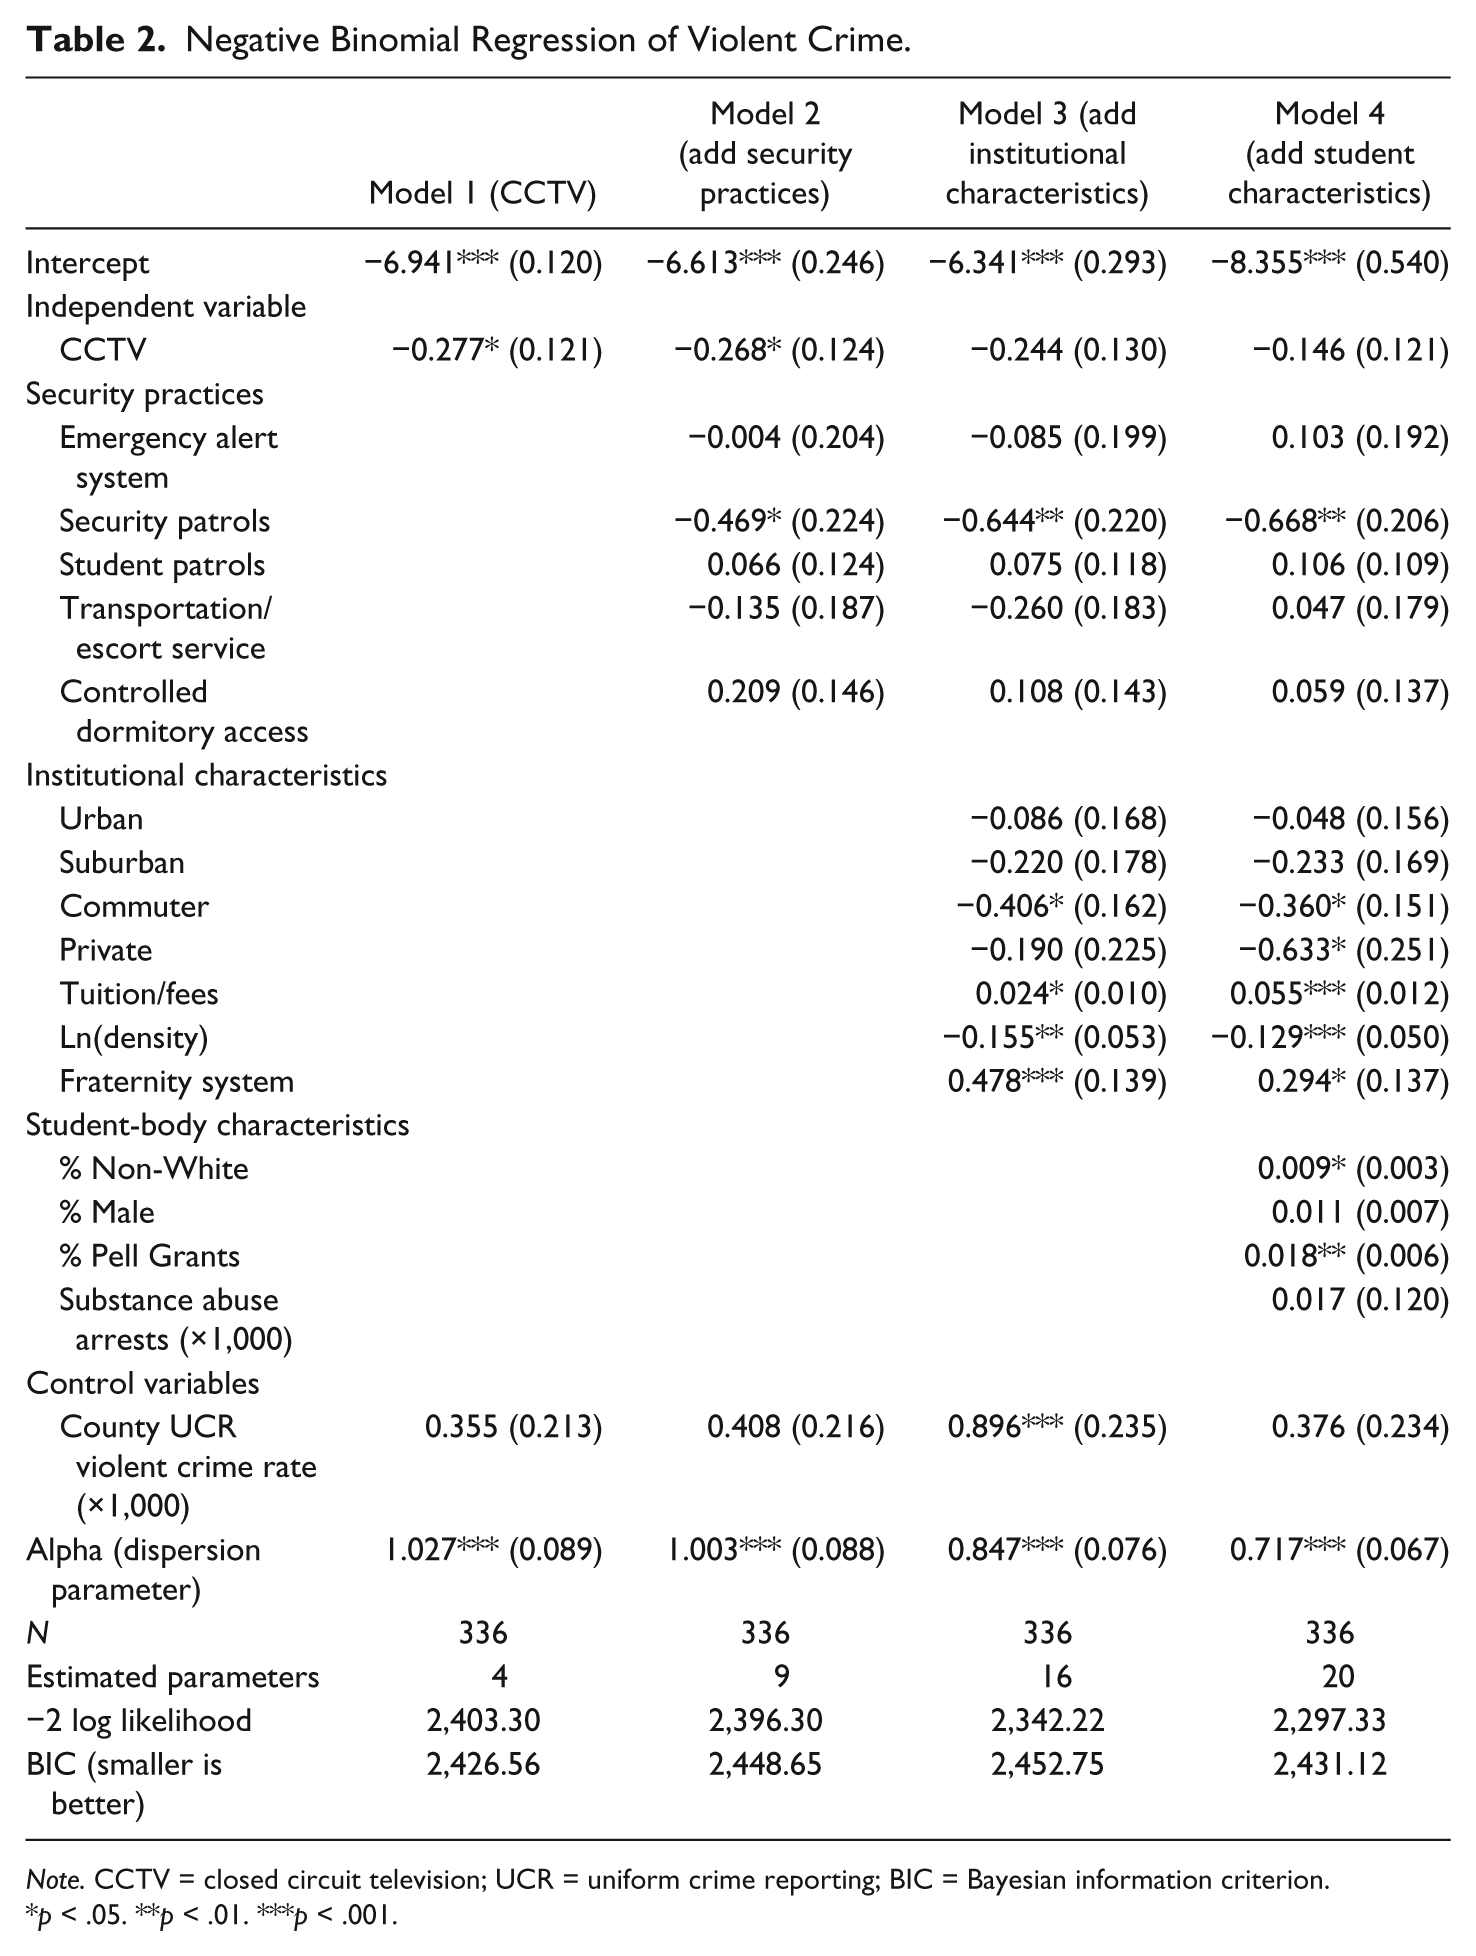
Note. CCTV = closed circuit television; UCR = uniform crime reporting; BIC = Bayesian information criterion.
p < .05. **p < .01. ***p < .001.
The effect of CCTV is statistically significant in the first two models. However, as additional variables are included, the impact of CCTV is no longer significant, suggesting that CCTV has a limited contribution to the crime rate once differences among institutions and the student population are controlled. In Model 2, CCTV’s impact is overshadowed by regular security patrols, which is significant and has a much larger effect, a 37.4% reduction in violent crime versus a 23.5% reduction for CCTV. 12 Security patrols have the largest impact on violent crime in the final model, with a reduction of 48.7% (Model 4). This strongly suggests more traditional methods of crime prevention (i.e., preventive patrol and police visibility) and are more effective than technological methods (CCTV, dormitory controlled access, and 24-hr emergency alert systems) when it comes to violent crime.
Institutional characteristics are introduced in Model 3, the majority of which are significant in both Model 3 and Model 4. Significant effects in Model 4 include (a) being a private institution, (b) the level of tuition and fees, (c) student population density, and (d) having a fraternity system.
Private universities have a statistically significant lower violent crime rate than public institutions. Indeed, the crime rate is 46.9% lower than for public institutions. However, the size of this effect may be due to reporting practices of private colleges who may suppress the reporting of violent crime.
The higher an institution’s tuition and fees regardless of whether the institution is public or private, the higher the violent campus crime rate. For every US$1,000-dollar increase in tuition and fees, violent campus crime increases by 5.7% (Model 4). This effect takes into account the impact of less affluent students on campus (i.e., % Pell grant). Thus, more affluent campus settings, as measured by how much it costs to attend a university, appear to place students more at risk of violent criminal encounters. Why this is the case cannot be addressed by these data.
By contrast, student density has a negative effect on the violent crime rate; for every increase of one student per acre of campus space, violent campus crime decreases by 12.1%. In addition, having a fraternity/sorority system increases the violent crime rate by 34.2%.
There are student-body characteristics associated with increases in violent campus crime. Specifically, the percent minority and the percent students receiving Pell Grants lead to an increase in the rate of violent campus crime, though the contributions to the crime rate by these two variables is small compared with the effect of other significant variables in Model 4 discussed above. For every 1-point increase in the percentage of minority students, the violent crime rate on campus increases 0.9%. For every 1-point increase in the percentage of students with Pell Grants, the model estimates an increase to the violent crime rate of 1.8%.
In summary, CCTV’s impact on violent campus crime is not significant once control variables measuring institutional characteristics and student population are considered. These control variables better account for violent campus crime rates, though specifying the operative mechanisms would be suggestive at best.
CCTV and Property Crime
Negative binomial regression results for campus property offenses are presented in Table 3, which parallels the presentation of violent crime in Table 2.
Negative Binomial Regression of Property Crime.
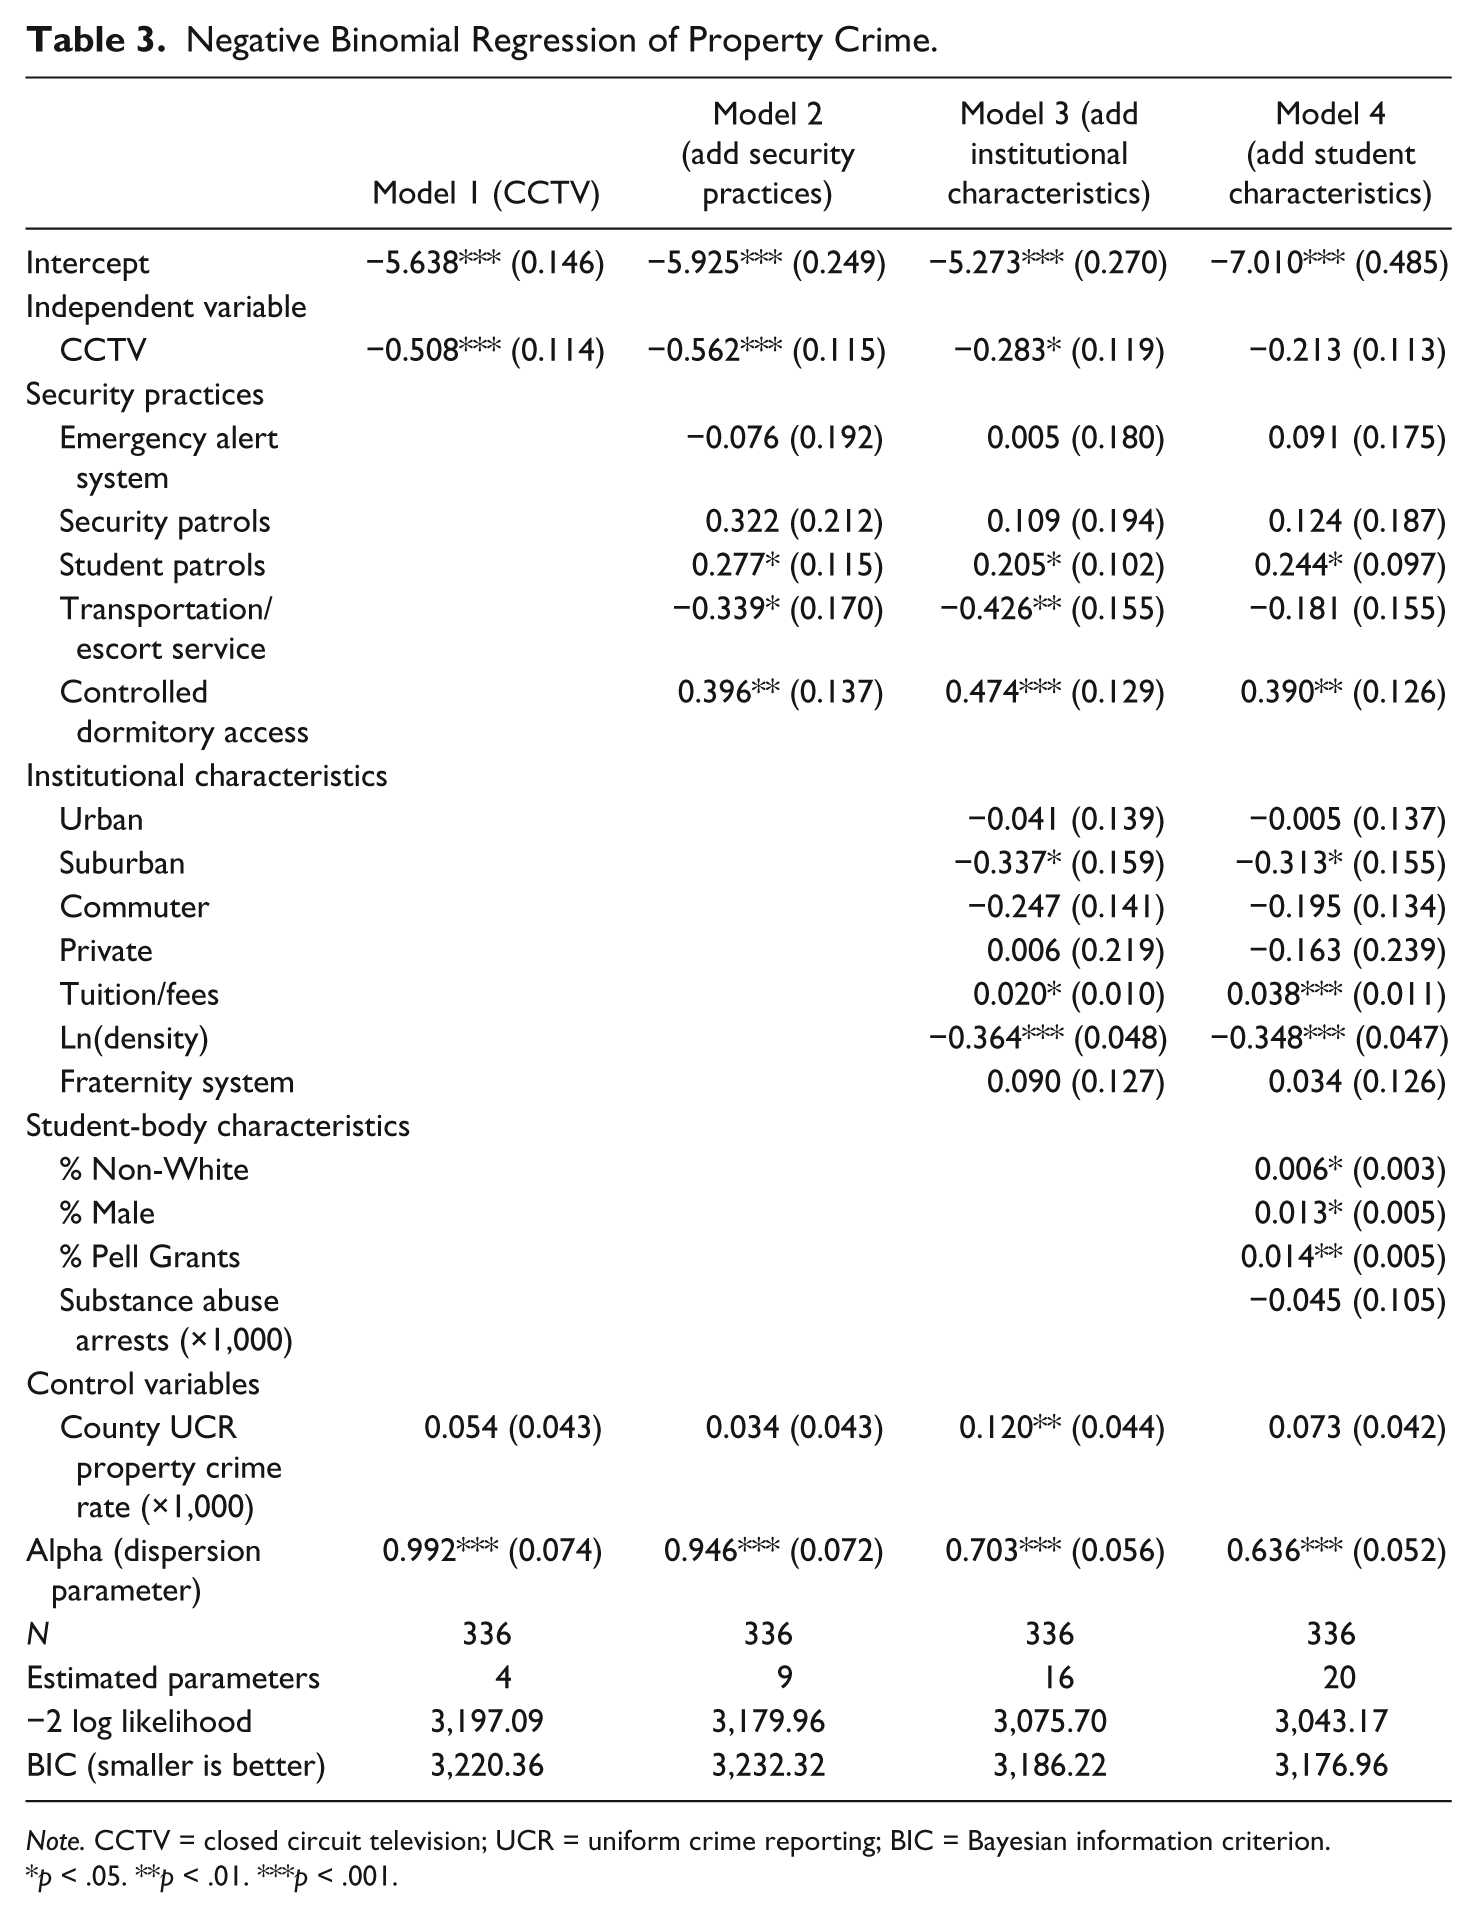
Note. CCTV = closed circuit television; UCR = uniform crime reporting; BIC = Bayesian information criterion.
p < .05. **p < .01. ***p < .001.
Similar to the finding of violent crime, CCTV has a limited contribution to the property crime rate as one observes its impact across all four models. The effect of CCTV is negative and statistically significant in Models 1, 2, and 3, though the size of the effect declines greatly in Model 3 once other security practices and institutional characteristics are included. This was not the case for violent crimes. However, once student characteristics are included (Model 4), the impact of CCTV on the property crime rate is no longer significant. Thus, consistent with the analysis of violent crime rates, CCTV has no discernible impact on property crime rates.
In Model 4, campuses with voluntary student patrols have a 27.6% higher property crime rate than those without such patrols. Similarly campuses with controlled dormitory access have a 47.7% higher property crime rate than those without controlled access, suggesting that these practices increase the property crime rate. This result is puzzling. One would expect that security measures would have a negative impact on crime, if any impact at all. However, these positive effects are likely best understood to indicate that campuses with higher property crime rates are likely implementing these strategies in response. Given the cross-sectional nature of our data, we cannot exclude causal directions of this kind, and such an interpretation seems plausible.
Turning to Institutional Characteristics, being located in a suburban locale, the level of tuition and fees, and student density all have significant effects on property crime in both Model 3 and Model 4. None of the remaining institutional variables are significant in either model. Universities in suburban locations have a 26.9% lower property crime rate (see Table 3, Model 4). The higher a university’s tuition/fees, regardless of whether the institution is public or private, the higher the property crime rate. For every US$1,000-dollar increase in tuition and fees, campus property crime increases by 3.9%. Thus, similar to violent crime, students and campus facilities are more at risk of property victimization on affluent campuses. In contrast, student density has a negative effect on the property crime rate; for every increase of one student per acre of campus space, campus property crime decreases by 29.4%.
Similar to violent crime, there are student-body characteristics associated with small increases in campus property crime: (a) percent minority, (b) percent male, and (c) percent students receiving Pell Grants. For every 1-point increase in the proportion of male students, the property crime rate increases by 1.3%. For each 1-point increase in the proportion of minority students, the model estimates an increase to the property crime rate of about 6.0%. Finally, the model estimates an increase of 1.4% in the property crime rate for each 1-point increase in the proportion of students receiving Pell Grants.
Table 4 summarizes the significant effects presented in the final models (Tables 2 and 3, Model 4) for both violent and property crime. Importantly, having a CCTV system has no effect on either violent or property crime rates. While there are differences by type of crime, there are some important similarities regardless of type of crime. That is, institutions with higher in-state tuition/fees, a higher percentage of minority students, and a higher percentage of students with Pell Grants have both higher violent and property crime rates, whereas greater student density decreases both property and violent crime.
Summary of Significant Effects in Analysis.
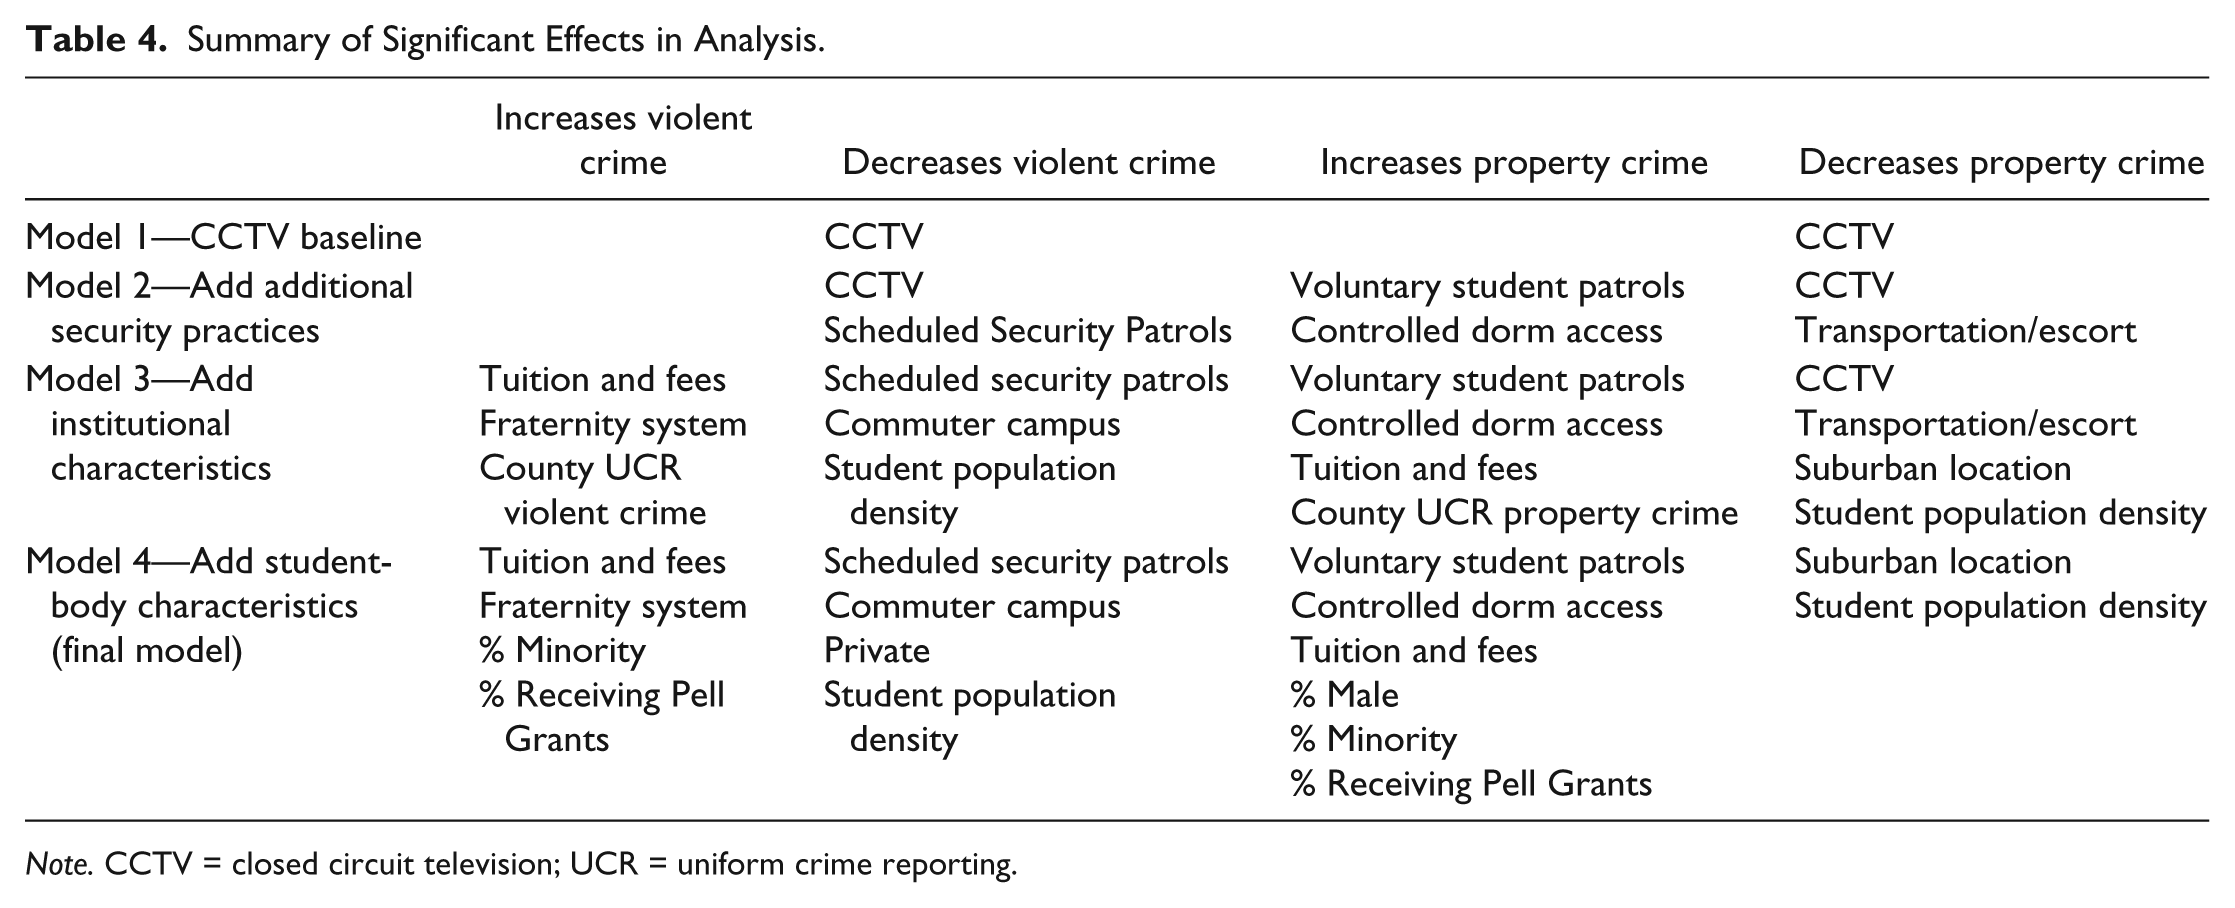
Note. CCTV = closed circuit television; UCR = uniform crime reporting.
The major differences between types of crimes are found in security practices used and institutional characteristics. While security practices affect both violent and property crime, there is a difference by practice type. Scheduled security patrols have a strong negative impact on violent crime, but no impact on property crime. Volunteer student patrols and controlled dormitory access are related to property crime but not violent crime. Furthermore, where campuses are situated (suburban areas) has a negative impact on property crime, and the type of institutional control (i.e., private) has a negative effect on violent crime. Notably, the presence of a fraternity system increases violent crime.
Summarizing, while CCTV appears to initially have some impact on property crime, this effect dissipates just like for violent crime. This analysis casts serious doubt on the perceived deterrent effect of CCTV that universities extol in their CCTV policies. While we observed that CCTV has a negative effect in some models for both property and violent crimes, when other variables are added to the model, the effect of CCTV on university campus crime is no longer significant. Even within the limitations of this cross-sectional research design and the crime data typically used to study college crime, some evidence supporting a deterrent effect of CCTV should have been found. However, this is not the case. The analysis suggests that CCTV’s role in deterring crime is at best, limited, and should not be uncritically embraced.
Discussion
Our overall findings about CCTV are not surprising given the empirical literature in criminology which has questioned the effectiveness of CCTV in preventing crime (Gill & Spriggs, 2005; Welsh & Farrington, 2003, 2009b). Our findings are also consistent with findings that certain security practices such as scheduled security patrols have a greater impact than CCTV.
To our knowledge, ours is the first study to rigorously examine the relationship between CCTV and crime on university campuses. As with any single study, there are limitations that future research could address. First, this is a cross-sectional analysis that precludes assessing causal direction. However, the lack of a significant correlation between CCTV and the dependent variables renders causality moot. Second, the ability to discern with absolute certainty the presence or lack of CCTV at a specific university campus is a challenge. Our use of university webpage searches combined with a survey of campus officials yielded very good information, but not without some ambiguities. Furthermore, CCTV systems are not the same across contexts (Haggerty, 2009), and our data cannot distinguish between the myriad variations found among them. For example, we do not know the number, density, and location of cameras; whether they are fixed and/or mobile; or whether they are monitored in real time or not; and if so, by whom. CCTV performance could conceivably be affected by any combination of these factors. Thus, our measure of CCTV is admittedly imprecise. From a policy perspective, this could be remedied by a legislative change requiring colleges and universities to include in their mandatory Clery Report, whether the campus utilizes CCTV, and a select set of CCTV system characteristics, as well as other types of security practices (e.g., campus escort program, blue-light stations, lighting programs, etc.). In addition, requiring universities to report in their Clery data larceny/theft would enable better research on campus crime and provide a stronger test of CCTV’s effectiveness.
Another limitation is that our sample does not include community colleges. This population is primarily commuter based and may generally include a student population of lower socioeconomic status. While we believe our data capture this sort of mobile student population and its relationship to campus crime, community college settings deserve specific analysis as these student populations may differ in other ways too.
Our study has important implications for policy discussions that propose CCTV as a substitute or replacement of regular security patrols (see Fickes, 2010b). In our data, CCTV has no effect on violent crime, the dramatic occurrence of which pushes universities to embrace technologies like CCTV. Indeed, policy makers should make it unambiguously clear to campus stakeholders that among security practices, CCTV technology at best augments other more effective and labor-intensive practices by campus police as well as student volunteer patrols. Security practices should be combined with programs aimed at engendering greater community awareness of effective preventive strategies (e.g., target hardening) and strengthening the cultural values and norms surrounding safety that decrease one’s risk of victimization, without succumbing to tendencies to blame the victim.
Based on what is known about campus incidents involving rape, the problems of misogyny, homophobia, and a party culture that celebrates alcohol and drug use are the tough cultural ingredients that when combined with the “right” opportunity structure facilitate the commission of violent interpersonal crime. CCTV may appear to be a technological fix, but its value as a solution to constraining more entrenched cultural norms and behaviors is questionable. Put into the context of the original impetus for the Clery Act, which was a violent crime, the limited effectiveness of CCTV is not surprising. The majority of violent offenses do not lend themselves to technological preventions like CCTV under the best of circumstances. This is a finding repeatedly borne out in the literature; yet, there persists in public discourse the belief that CCTV will serve as a deterrent. Violent crimes between persons frequently occur inside in private spaces (not in public where CCTV is more likely to be utilized). In the typical case, they begin as interpersonal disputes between acquaintances, and are often crimes of opportunity (typically, property focused) that evolve into violent encounters. 13 Decision making (whether criminal in intent or not at the outset) is further complicated by the role of alcohol and drugs which act as both a catalyst and accelerant to violence.
In addition, consistent with extant literature, institutional characteristics have an important influence on campus crime. That is, the variables that have the most consistent and significant impact on violent and property crime are the cost of attendance (tuition and fees) and population density (students per acre). Both variables lend themselves to explanations of crime found in the criminological literature (Felson, 2002). The opportunity structure for crime increases when there is an increase in targets (i.e., students and their property) that have greater value, or more valuables in their possession, given the economic requirements to attend the university (i.e., cost of attendance). That is, tuition and fees serve as an indicator of the economic assets of the campus and what students bring to the campus environment. Both are attractive to criminal opportunities.
Finally, student demographics are consistently related to increases in both violent and property campus crime, specifically the percent receiving Pell Grants and percent minority. Although these effects are modest compared with other factors, this suggests that the correlates of campus crime are not unlike those in noncampus environments. In this respect, while universities may enjoy a safer environment because crime is lower in those settings, they share in common with non-university environments, a source of crime that is not amenable to active institutional control without excluding significant portions of the college-age population in the name of security. Such a measure would run counter to educational values and certainly not withstand legal scrutiny.
Technological Fixes, Symbolic Politics, and Public Discourse
If CCTV has little to no discernible effect on campus crime, the discourse surrounding its use must include the social costs pertaining to higher education. Our data suggest that the limited effects of CCTV technology on campus crime not only should be acknowledged but also made more central to public discourse and further research on the topic. At a minimum, we need to better understand the social costs that have already accrued in the rush to embrace CCTV. Specifically, we know little about how these technologies alter the educational environment (e.g., freedom of movement) and threaten educational values (e.g., freedom of inquiry).
In addition, such technologies are economically costly, in the short term (e.g., purchase/installation) and long term (e.g., maintenance, system integration, and technological obsolescence). An important policy implication is that decisions regarding installing and operating CCTV systems should use cost-benefit analyses. A true cost-benefit analysis would include not only hard costs and benefits for the short and long term, but also soft costs and benefits such as loss of privacy and academic freedom as well as potential indemnification. Rather than assuming the effectiveness of CCTV systems, which this research questions, a cost-benefit analysis would provide grounding for a dialog that would not only involve the full complement of costs and benefits but also a full slate of campus stakeholders.
How might such recommendations be received and what shape might this discourse take? The history of CCTV research suggests significant challenges to such a message. Haggerty (2009) notes the social scientific and public discourse surrounding CCTV evaluations are largely “methodological knife fights” that focus on limited and often vaguely specified criteria for success, placing opponents, or those who might pose serious questions about CCTV’s efficacy or value, in a less powerful position to challenge its post facto deployment. With the metaphorical CCTV train having already left the station, what remains are debates about the efficacy of technologies in fulfilling their promises that fail to address more fundamental questions concerning their development and deployment. Haggerty notes that evaluation studies of CCTV’s efficacy (even when inconclusive) are often interpreted in the most positive light becoming “a rhetorical gloss or post facto rationalization for decisions made for more ideological, political or crassly commercial reasons” (p. 288).
While it might be tempting to suggest this conclusion typifies the position of CCTV critics, it aligns with one recommendation from the National Summit on Campus Public Safety which occurred over 10 years ago:
There is significant debate over the degree to which colleges and university campuses should sustain environments allowing unrestricted movement of people and material. . . . There is a need for more research on and study of recent practices to determine if increased security, in any way, has inhibited the freedoms associated with excellence in higher education. (Greenberg, 2005, p. 63, emphasis added)
Sadly, such research has not taken place. Rather, the CCTV train rolls on, with enhancements such as video analytics, biometrics, and license plate readers on the way promising that they will make a difference.
Footnotes
Acknowledgements
The authors thank Heidi Lyons and Wendi Johnson for their comments on earlier drafts of this article and the editors and reviewers for their helpful comments and assistance. Albert J. Meehan and Thomas Lauer gratefully acknowledge their friend and coauthor Raymond Liedka (1958-2016) who passed away on April 1, 2016, after a lengthy and valiant battle against cancer. Ray was a brilliant and humble person whose kindness touched colleagues and students alike. We miss him dearly.
Declaration of Conflicting Interests
The author(s) declared no potential conflicts of interest with respect to the research, authorship, and/or publication of this article.
Funding
The author(s) received no financial support for the research, authorship, and/or publication of this article.