



Abstract
This study evaluates Porter’s (1997) premise that inner-city economic development could be facilitated by integrating inner-city businesses into regional clusters. Prior work shows that the presence of clusters creates externalities that improve regional performance. The authors extend that work by developing a framework to examine the role of clusters of related industries on job creation in the inner city. Unique data sets from the Initiative for a Competitive Inner City and from the U.S. Cluster Mapping Project are utilized to analyze the relationship between the strength of a regional cluster and the employment growth of inner-city industries during 2003 to 2011. The authors find that the initial strength of the cluster in the inner city, in the proximate city, and in the rest of the metropolitan statistical area are positively associated with employment growth within the inner-city cluster.
Keywords
The state of American cities is a manifestation of the growing inequality characterizing the nation’s economy. While some formerly distressed areas in cities have been revitalized and are attracting new residents, pockets of concentrated poverty and high unemployment rates (i.e., inner cities) persist. In 2011, 30 million people, or 10% of the U.S. population, lived in inner cities. To paraphrase Porter (1997), the intractability of American inner cities is one of the most pressing issues facing the nation.
To date, inner city economic development policies have largely focused on job creation through business attraction incentives, with mixed results (Bartik, 2010; Busso, Gregory, & Kline, 2010; Kenyon, Langley, & Paquin, 2012; Kline & Moretti, 2014; Osgood, Opp, & Bernotsky, 2012; Wachter & Zeuli, 2014). This research advances the policy debate by examining the role of clusters—groups of closely related industries colocated in a region—on employment growth in inner cities. We evaluate the premise, first advanced by Porter (1997), that the connection of inner-city industries to strong regional clusters will improve employment outcomes in inner cities.
Building on prior research that analyzes the influence of nearby geographies on inner-city economic development (Blair & Carroll, 2007; Jun, 2014; Savitch, Collins, Sanders, & Markham, 1993), we use a cluster framework (Delgado, Porter, & Stern, 2014; Porter, 2003) to evaluate the extent to which inner cities are economically connected to their surrounding region. We analyze whether clusters that are strong (i.e., high relative employment presence) in both the inner city and in its surrounding region (i.e., “connected” clusters) matter for employment growth in the inner city. For example, consider the Financial Services cluster in Boston, which is strong in both the inner city and in the surrounding city. As a result, the inner-city cluster is connected to the regional cluster through inputs, outputs, skills, or other potential linkages.
This study analyzes the impact of these intraregional cluster linkages on employment growth in the inner city. Specifically, if economies of agglomeration occur within an inner city cluster and also across the same cluster in the surrounding region, then we can expect that an industry in an inner city within a connected cluster will grow faster than the same industry in an inner city with a cluster that is disconnected (i.e., weak in either the inner city or the nearby region). This empirical hypothesis is based on prior studies that find that agglomeration effects of various types occur across related industries within regional clusters and improve regional industry performance (e.g., Delgado, Porter, & Stern, 2010; Delgado, Porter, et al., 2014). In this study, we examine whether this also holds for clusters in the inner city. Economies of agglomeration could be hindered in inner cities because of their smaller size, lower skills, or relatively worse social conditions (Jargowsky, 1997; Moretti, 2012; Wilson, 1987). However, agglomeration effects could be fostered in inner cities because of their higher population and employment density and their proximity to the rest of the city (Ciccone & Hall, 1996; Glaeser, Kahn, & Rappaport, 2008; Henderson, 2003; Porter, 1997).
We evaluate these questions using the inner city definition established by the Initiative for a Competitive Inner City (ICIC) and cluster definitions developed by the U.S. Cluster Mapping Project (USCMP). Inner cities are defined as the economically distressed areas of the city, those with a high concentration of poverty and unemployment. They can be located in any part of the city, not necessarily in the downtown area. ICIC identifies 328 inner cities, belonging to 328 central cities and 188 metropolitan statistical areas (MSAs). 1 The USCMP database includes a set of U.S. Benchmark Cluster Definitions (BCD) developed in Delgado, Porter, and Stern (2016). The BCD delineates 51 clusters incorporating 778 traded industries (six-digit NAICS) covering services and manufacturing.
To assess the effect of clusters on inner-city industry growth, we draw on the empirical method developed by Delgado, Porter, et al. (2014). Using a similar approach, we analyze the employment growth between 2003 and 2011 of an industry located in an inner city as a function of the initial employment of the inner-city industry and the initial strength of the cluster at three levels of (mutually exclusive) geography within a region: the inner city, the surrounding central city, and the rest of the MSA (i.e., the metropolitan statistical area outside the central city). This specification allows us to study intraregional linkages between an inner-city cluster and the same cluster in the surrounding region.
We find that industry employment growth in inner cities is positively associated with the strength of the cluster that surrounds the industry at different levels of nearby geographies within a region. The strength of the same cluster in the inner city, in the proximate central city, and to a lesser extent, in the rest of the MSA, are all positively associated with the employment growth of the industry within the inner-city cluster. Relatedly, we find that industries located in inner cities within a cluster that is strong in the three levels of nearby geographies grow faster than industries in inner cities where the cluster is weak in the inner city or in the nearby geographies. Finally, inner-city-industry employment growth is also facilitated by the strength of related clusters in the surrounding central city, suggesting that intraregional linkages also take place across the inner-city cluster and related clusters in the region.
Overall, these findings suggest that cluster-driven agglomeration effects on employment occur in inner cities and that they are facilitated by intraregional linkages between an inner-city cluster and the same cluster (and related clusters) in the rest of the region. Inner cities characterized by a cluster composition that is connected to clusters within their regions will thus perform better than inner cities that are disconnected from the regional clusters. This would imply that policy interventions to create jobs in inner cities would need to focus not only on the inner city but also focus on regional cluster development.
The remainder of the study is organized as follows: The second section describes the role of clusters in the performance of inner cities and develops the main hypotheses. The third section presents the empirical framework, which is followed by a section explaining the data, geographical units, and cluster definitions. The variables are then described, while the sixth section offers descriptive findings on the cluster composition of inner cities and illustrative examples of cluster specialization at different levels of geography within regions. The seventh section discusses the findings on the role of clusters in inner-city-industry employment growth. The final section concludes the study and offers some policy recommendations and numerous suggestions for future research.
The Role of Clusters on Inner City Performance
The presence of a strong cluster in a given location—with closely related industries and supporting institutions—may give rise to economies of agglomeration of various types (skills, demand, supply, knowledge, and other linkages) that improve regional performance (Audretsch, 1998; Delgado et al., 2010; Delgado, Porter, et al., 2014; Feldman & Audretsch, 1999; Glaeser & Kerr, 2009; Marshall, 1920; Porter, 1990, 1998, 2003; Saxenian, 1994). Our research adds to this body of work by examining the effect of strong clusters on employment growth within inner cities. Specifically, we study three empirical questions: Do inner city industries benefit (i.e., grow faster) from agglomeration effects within the inner-city cluster, within the same cluster in the surrounding region, and across related clusters in the inner city and its surrounding region?
If agglomeration effects arise within clusters in an inner city, then the strength (i.e., relative employment presence) of a cluster in the inner city will facilitate the growth of industries participating in that cluster. For example, consider the theater industry in a given inner city, which is part of the Performing Arts cluster. With agglomeration effects, the theater industry will grow faster if the inner city has high employment specialization in the set of other related industries within the Performing Arts cluster (e.g., dance companies, musical groups, and promoters and managers of performing artists).
Economies of agglomeration could be hindered in inner cities because of relatively fewer businesses, lower average educational attainment of residents, and worse social conditions (i.e., poverty, unemployment, and crime). For example, some studies point to the lower skill levels of residents in distressed communities as a constraint on knowledge spillovers and innovation (Jargowsky, 1997; Moretti, 2012; Wilson, 1987). In turn, this constrained level of innovation could reduce the potential of clusters to create jobs (Delgado, Porter, et al., 2014; Gittell, Sohl, & Tebaldi, 2014). Lower quality of transportation and communication infrastructure, and zoning regulations may also impede the ability of inner cities to support new businesses that would strengthen clusters; however, certain characteristics of inner cities could foster agglomeration. Their high population and employment density together with the presence of complementary industries in an inner-city cluster may give rise to positive externalities (e.g., better access to demand and inputs) that will facilitate the growth of the constituent industries (Ciccone & Hall, 1996; Delgado et al., 2010; Delgado, Porter, et al., 2014; Glaeser et al., 2008; Porter, 1997).
The second question we explore is whether agglomeration effects arise across the same cluster in the inner city and in its surrounding region. If such intraregional agglomerations exist, then the strength of the cluster in the surrounding region will facilitate the employment growth of industries within that cluster in the inner city. Industries in the inner city could access demand, supply, skills, or institutions in the cluster in the surrounding central city and in the rest of the MSA. 2 We expect that benefits from the strength of the central city cluster will be greater than benefits from the strength of the MSA cluster since the central city is closer to the inner city and agglomeration economies decline with distance (Agrawal, Galasso, & Oettl, 2014; Aharonson, Baum, & Feldman, 2007; Henderson, 2003). The central city also has higher employment density than the MSA, generating more opportunities for linkages between the same cluster in the inner city and the nearby central city.
Cluster-driven agglomerations in inner cities could be increased if the cluster is strong both in the inner city and in the neighboring region (i.e., the cluster is “connected”). In that case, an industry located in an inner city within a connected cluster will grow faster than the same industry located in an inner city with a cluster that is weak in either the inner city or the nearby region. For example, if an inner-city theater industry is surrounded by a strong Performing Arts cluster in the inner city and in its nearby region, it will be able to exploit greater externalities and grow faster than if the cluster is weak inside or outside the inner city.
Finally, we also explore whether agglomeration effects take place across distinct but related clusters (e.g., between Performing Arts and Marketing Service clusters). Delgado, Porter, et al. (2014) show that agglomerations also occur among related clusters. Thus, the presence of related clusters in the inner city or in its nearby region may spur growth in the inner-city cluster. In that case, inner-city-industry employment growth will be positively associated with the presence of related clusters in the inner city or in its surrounding region.
Econometric Model: Industry Employment Growth in Inner Cities
To examine the role of clusters in inner-city industry growth, we draw on the empirical approach developed by Delgado, Porter, et al. (2014). Their method examines agglomeration within a cluster of related industries that surrounds a regional industry, while accounting for the size of the regional industry. Similarly, we specify inner-city-industry employment growth as a function of the initial level of employment in the inner-city industry and the initial strength of the cluster around that industry. We measure the strength of the cluster in three different levels of geography within an MSA r: the inner city (r1), its surrounding central city (r2), and the rest of the MSA (r3) (i.e., MSA region r = r1 + r2 + r3). Our core econometric specification for inner-city-industry employment growth is as follows:
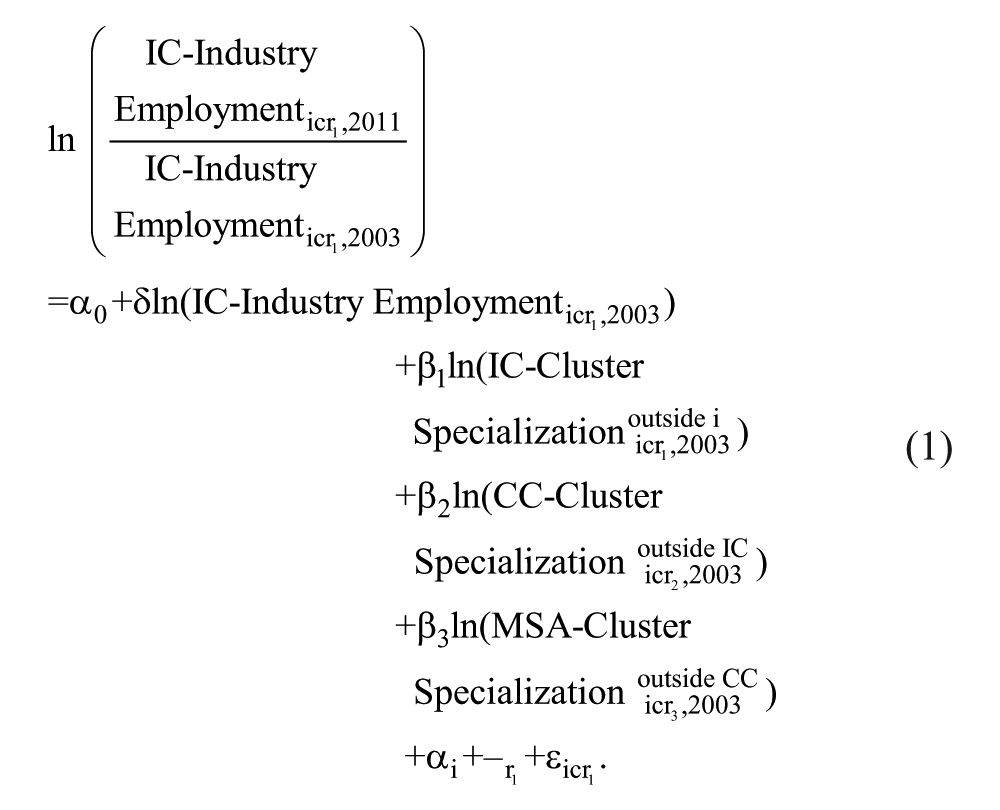
The dependent variable is industry i employment growth in the inner city over the period 2003 to 2011 (IC-Industry Employment Growth). To control for convergent forces at the inner-city-industry level, the model includes (log of) inner-city employment in the industry (Ln IC-Industry Employment) in the initial year.
To examine the impact of cluster strength on the growth of industries located in inner cities, we use measures of cluster specialization at different levels of geography (see Sample Description and Variable Definitions section for a precise definition of these measures): in the inner city outside the industry i (IC-Cluster Specialization), in the central city outside the inner city (CC-Cluster Specialization), and in the rest of the MSA (MSA-Cluster Specialization). The variables are specified at the initial date, 2003, which allows for the long-term effect of cluster agglomerations on inner-city-industry performance. Because nearby geographies within a region may specialize in similar clusters, there might be spatial correlation between the cluster in the inner city and in the rest of the region. We account for this directly by including in the model the cluster presence at the three mutually exclusive levels of geography.
We compare the growth rates of inner-city industries, accounting for the overall growth of the industry (with the inclusion of industry fixed effects, αi) and the overall growth of the inner city (with the inclusion of inner city fixed effects, αr1). The source of identification in Equation 1 is the cross-sectional variation in cluster employment across inner cities and their respective central cities and MSAs. To account for correlation of the error terms across industries within an inner-city cluster, the standard errors are clustered by inner-city cluster. 3
We expect industries located in inner cities with a strong cluster in the inner city, in the nearby central city, and in the rest of the MSA to perform better than inner-city industries in regions lacking cluster strength inside or outside the inner city (β1 > 0, β2 > 0, and β3 > 0). We also expect that agglomeration benefits from the strength of the central-city cluster will be greater than the benefits from the strength of the MSA cluster (β2 > β3), since the central city is geographically closer to the inner city and has greater employment density than the rest of the MSA.
To illustrate the model, consider the example of the inner city in Odessa, Texas, and the industry Support Activities for Oil and Gas Operations (NAICS 213112) within the Oil and Gas Production and Transportation cluster (see Table 1 for the cluster definition). To examine the employment growth of this industry, we use Support Activities for Oil and Gas Operations employment in the inner city (IC-Industry Employment); the employment specialization in related industries within the Oil and Gas cluster (excluding NAICS 213112) in the inner city (IC-Cluster Specialization); and the employment specialization in the same cluster in the surrounding central city (CC-Cluster Specialization) and in the rest of the Odessa, Texas, MSA (MSA-Cluster Specialization).
Oil and Gas Production and Transportation Cluster.

Source. Delgado, Porter, and Stern (2016).
Data: Definition of Geographies and Clusters
In this section, we define the three levels of geography we consider in this study. We then explain the cluster definitions and the estimation of total, cluster, and industry employment for the three geographies. We complete this section by benchmarking the attributes of MSAs, central cities, and inner cities.
Definition of MSAs, Central Cities, and Inner Cities
MSAs are meaningful urban regional units defined by the U.S. Census Bureau. 4 Central cities (CCs) are located within the MSA. They are formally designated by the federal Office of Management and Budget (OMB), and represent the largest city in each MSA and additional cities within the MSA that meet specific population size and commuting-pattern criteria. Our list of central cities also includes a few additional cities that are not OMB-designated central cities but that represent large population and employment centers within their MSAs. We follow convention and use the term central cities to refer to all of these cities.
Inner cities (ICs) are located within central cities. The term inner city is used to refer to distressed areas of cities, characterized by concentrated poverty and high rates of unemployment. We use the inner city definition established by ICIC. 5 This definition is based on the federal government’s empowerment zone criteria for designated areas of high poverty and unemployment set forth in 1993 and on related measures of spatially concentrated poverty (Jargowsky, 1997; Wilson, 1987). ICIC defines an inner city as a set of contiguous census tracts in a central city that have higher poverty and unemployment rates than the surrounding MSA and, in aggregate, represent at least 5% of a central city’s population. Each inner-city census tract must meet either of two criteria: (1) an absolute poverty rate of at least 20% or (2) a relative poverty rate that is at least 150% greater than that of the MSA, as long as the unemployment rate is at least 150% greater than that of the MSA and/or the median household income is 50% or less than that of the MSA. 6
Applying ICIC’s inner city definition to 2011 American Community Survey data for all U.S. cities with populations greater than 75,000 generates a sample of 328 inner cities. These inner cities are located within 328 central cities and 188 different MSAs. Inner cities are located within a unique central city and MSA, but their respective MSAs may comprise more than one inner city (Figure 1). The number of inner cities per MSA ranges from 1 to 22. The majority of MSAs in our sample (144) contain only one inner city. For example, the Odessa, TX, MSA includes only one inner city (Figure 2). The Los Angeles-Long Beach-Anaheim, CA, MSA is the MSA with 22 inner cities. The inner city, central city, and MSA geographical boundaries are all fixed in 2011 for the longitudinal analysis.

Mapping MSAs with inner cities.
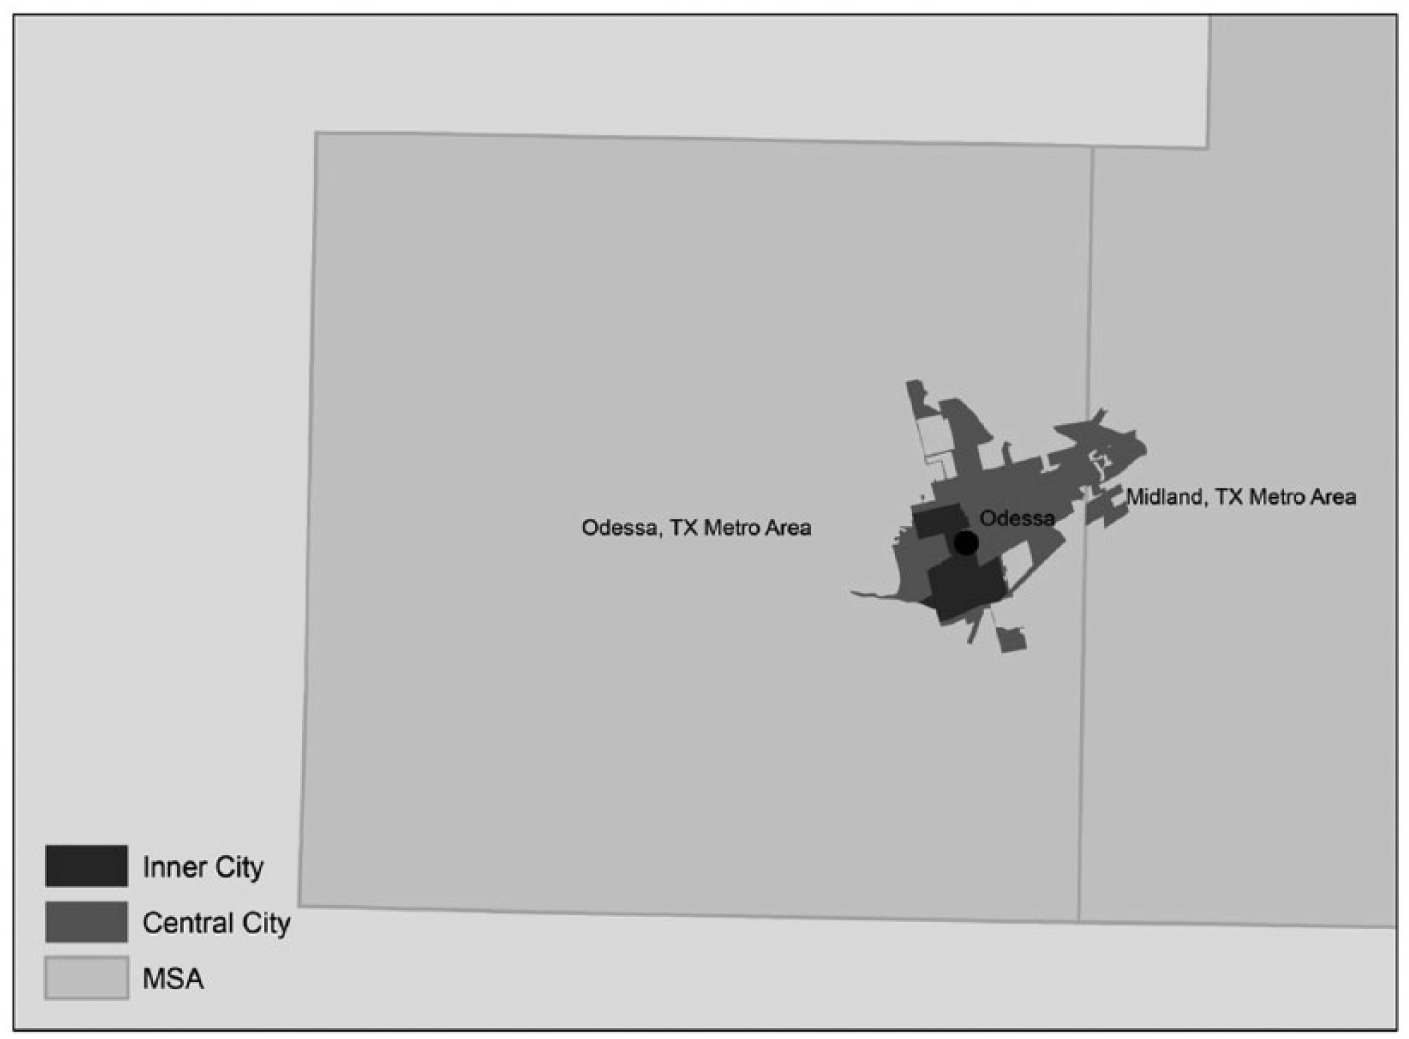
Odessa, TX, MSA and its central city and inner city.
Cluster Definitions
We use the Delgado et al. (2016) set of BCD, which groups industries that are related based on input–output linkages, labor occupation linkages, and the colocation patterns of industries. The BCD groups 778 traded industries (six-digit NAICS) into 51 mutually exclusive clusters (see Table 2 for the list of clusters). Traded industries are those that concentrate in particular regions and sell products or services across regions and countries. In contrast, local industries are those that serve primarily the local markets (e.g., retail) and whose employment is evenly distributed across regions in proportion to regional population (Delgado, Bryden, & Zyontz, 2014; Porter, 2003). Thus, to examine whether economies of agglomeration arise in inner cities, we focus on traded industries and their clusters. For example, the Oil and Gas Production and Transportation cluster includes 12 traded industries in service and manufacturing (Table 1).
Cluster Composition of Inner Cities, 2011.
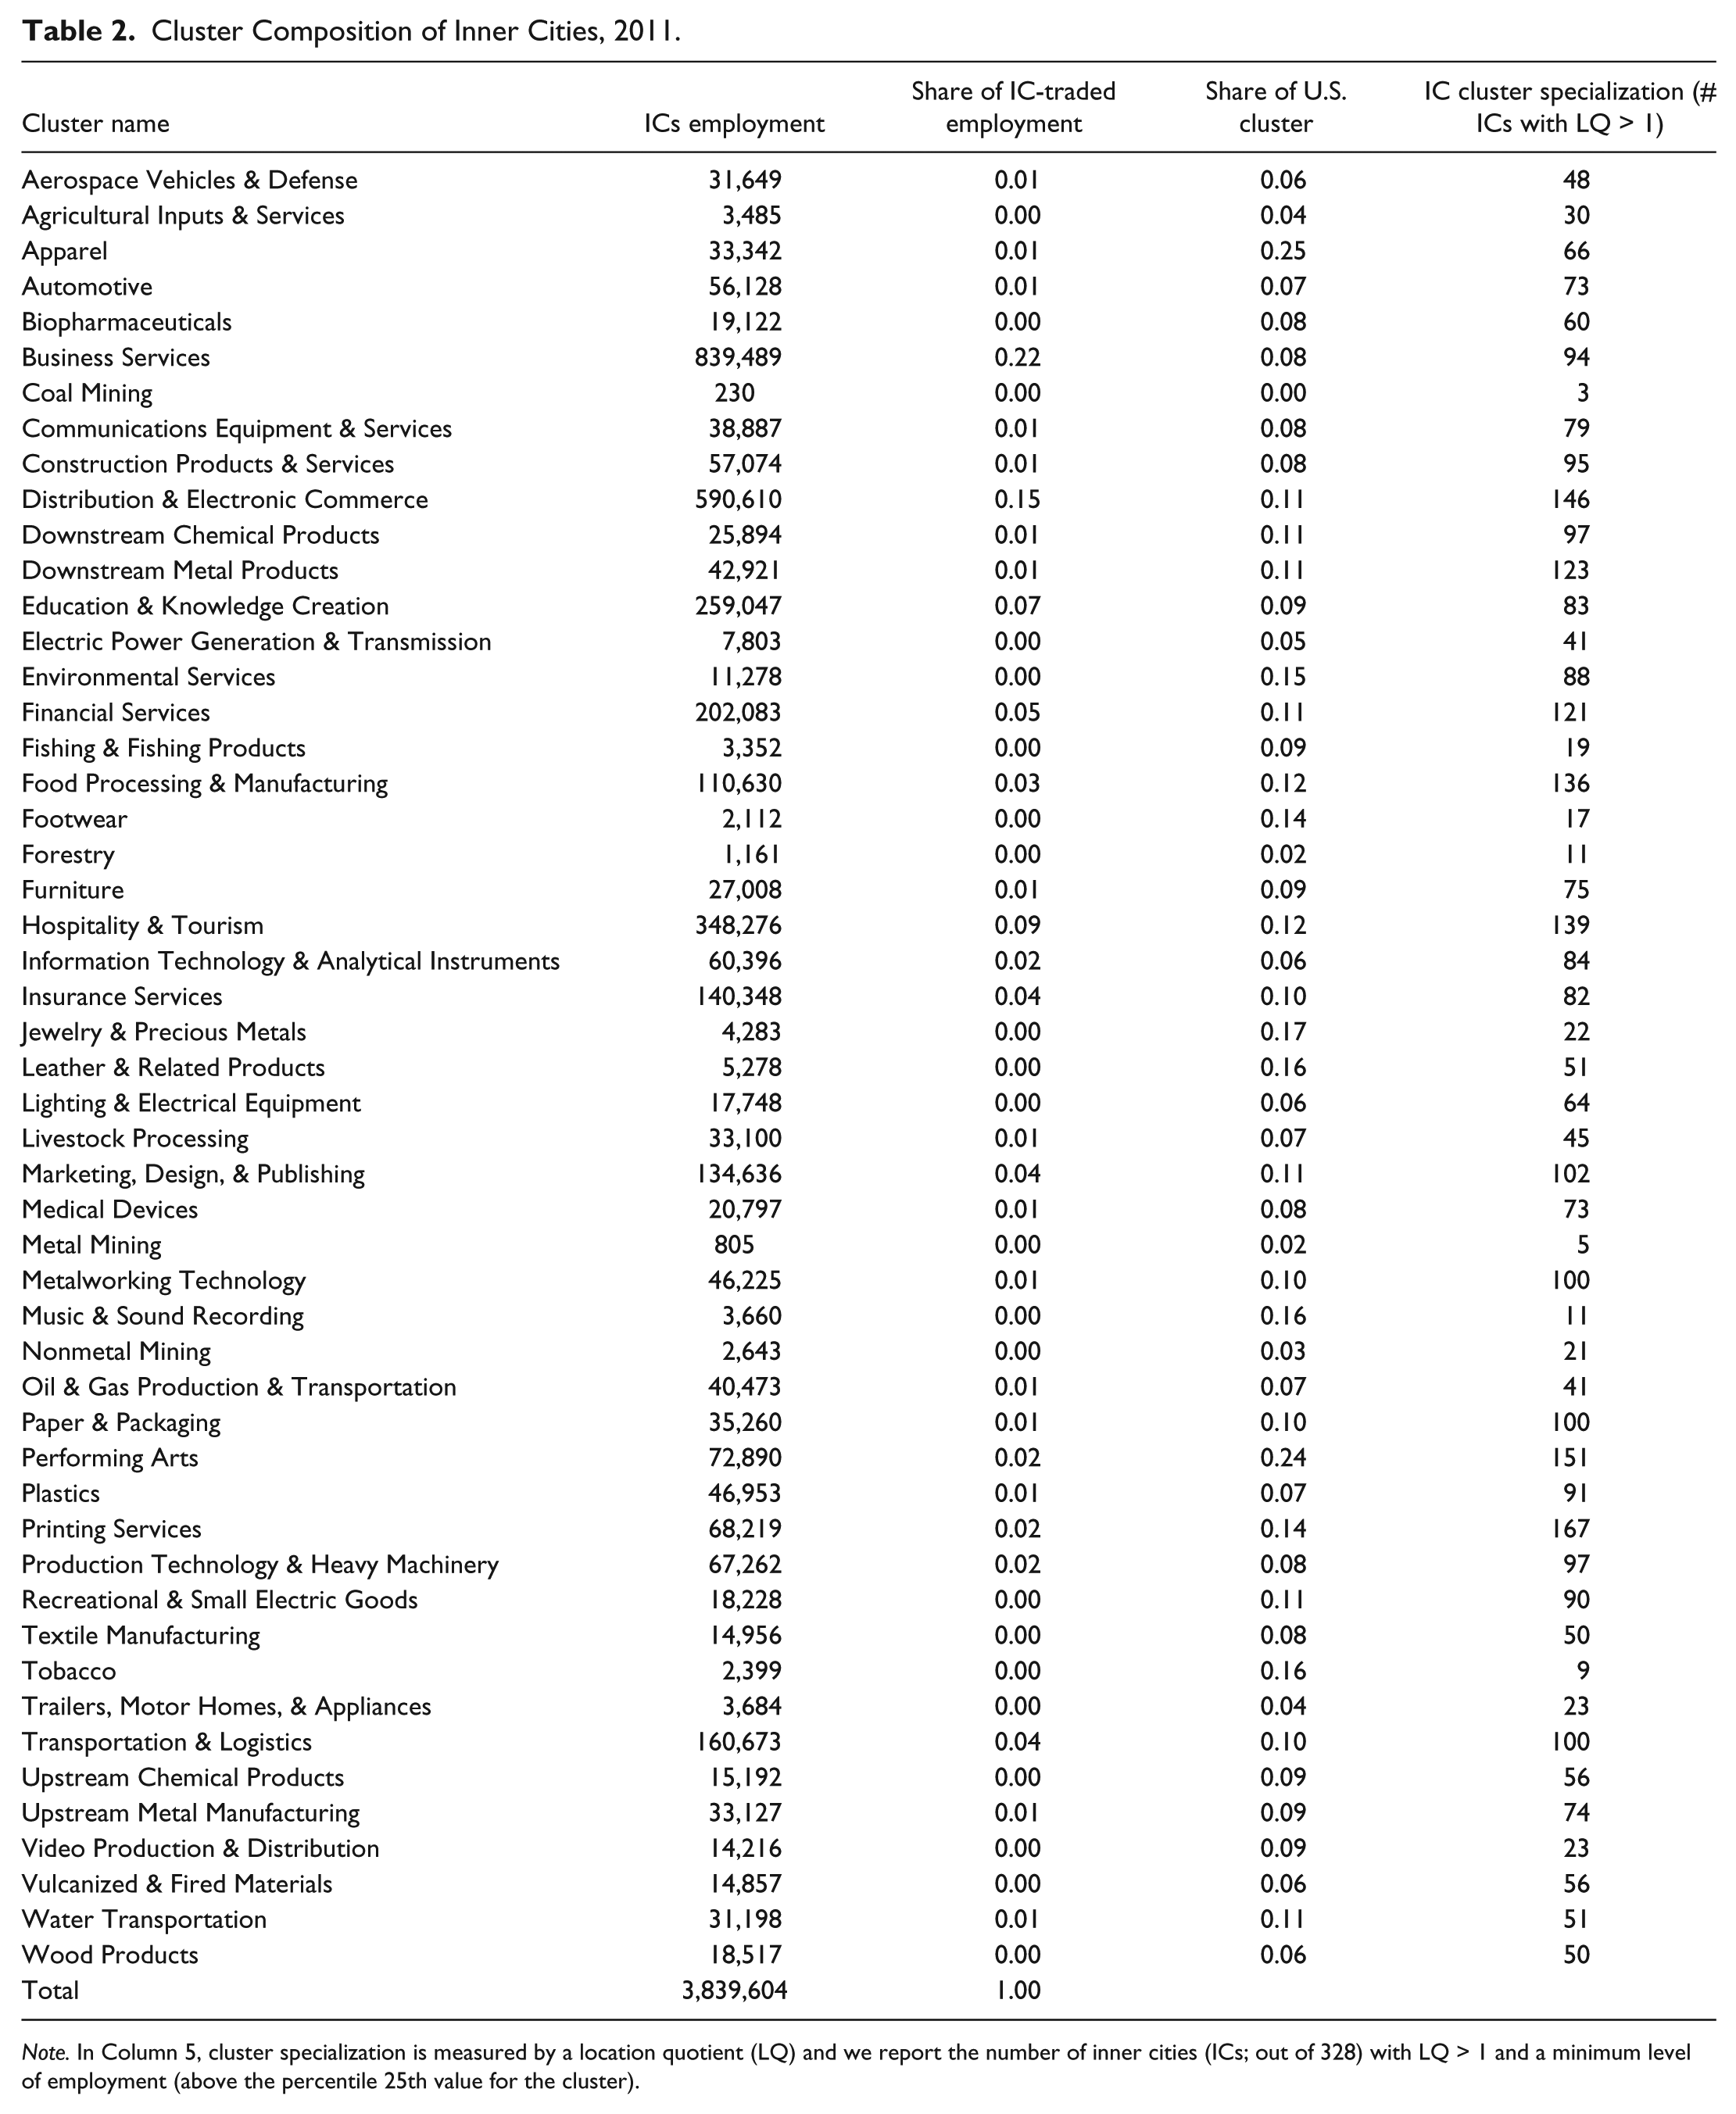
Note. In Column 5, cluster specialization is measured by a location quotient (LQ) and we report the number of inner cities (ICs; out of 328) with LQ > 1 and a minimum level of employment (above the percentile 25th value for the cluster).
Data from the U.S. Census Bureau’s County Business Patterns (CBP) and ZIP Code Business Patterns (ZBP) data sets are coded with cluster definitions drawn from the U.S. Cluster Mapping Project. 7 The CBP and ZBP are publicly available databases that provide annual county-level and zip-level measures of private-sector nonfarm employment at the level of six-digit NAICS codes. 8
To compute the MSA cluster data, the CBP data are aggregated to the MSA-industry level and then to the MSA-cluster level. We construct inner city and central city employment by aggregating ZIP code data from the ZBP. Because some ZIP codes partially overlap the inner city or central city (see Figure A2 for an illustration for Chicago), we use ZIP code weights developed by ICIC to allocate the percentage of ZIP employment (industry and total) to be attributed to the inner city and central city. These weights are defined as the percentage of total ZIP employment in census blocks that belong to the inner city or central city. The maximum weight is 1, which represents those ZIP codes wholly included in the inner city or central city boundaries. Because of data limitations, we cannot compute the ZIP code weights at the industry level. Thus, the ZIP-weighting method assumes that the employment distribution within a ZIP code is the same for total employment than for each traded industry. We recognize that this assumption is a limitation and our method can introduce noise in cluster employment estimation (see the appendix for a detailed explanation of the method to compute these weights).
Benchmarking MSAs, Central Cities, and Inner Cities
The 188 MSAs in our data set represent 79% of U.S. employment and 73% of the nation’s population (Table 3). The 328 inner cities represent 11% of U.S. employment and 10% of U.S. population. They account for 14% of their MSA employment and 32% of central-city employment.
Total Size of Metropolitan Statistical Areas (MSAs), Central Cities (CCs), and Inner Cities (ICs).

Note. ICIC = Initiative for a Competitive Inner City; USCMP = U.S. Cluster Mapping Project; CBP = U.S. Census Bureau’s County Business Patterns; ZBP = ZIP Code Business Patterns. Data sources ICIC and USCMP. Underlying data sets are CBP and ZBP (for employment), U.S. Census Bureau 2011, and American Community Survey 5-year estimate (for population).
Our sample of MSAs, central cities, and inner cities are located across the United States (Figure 1). They vary in their population size, land area, and population densities (Table 4). The average population size of inner cities is 92,608 people. On average, the inner cities represent just over 8% of their MSA population and 35% of their central-city population, although this also varies greatly across the inner cities. The range of land area is equally diverse, with inner cities comprising the least amount of land (1.6-195 square miles). Of the three different geographies, inner cities have the greatest population density, ranging from 779 to 42,405 people per square mile, with an average of 5,898 people per square mile. By contrast, the average population density for central cities and MSAs is 4,038 and 318 people per square mile, respectively.
Endowments of MSAs, Central Cities, and Inner Cities (2011).

Note. MSA = metropolitan statistical area; CC = central city; IC = inner city. Each inner city is linked to only one MSA and one central city.
Using our unique data set, we compare the economic performance and social conditions of inner cities with their respective central cities and MSAs across a standard set of indicators in 2011 (Table 5). On average, for all indicators, as expected and by definition, inner cities represent the worst economic performance and social conditions, followed by the central cities and then the MSA. For example, on average, the inner cities have a 30% poverty rate. This is double the poverty rate of the MSAs, at 14% on average, and higher than the central cities on average (17%). 9 Likewise, average income per capita is significantly lower for inner cities: $16,186 compared with $24,625 in central cities and $26,649 in MSAs. Education rates follow a similar pattern: Only 13% of inner-city residents (18 years or older) hold a bachelor’s degree or higher, compared with 24% in central cities and 25% in MSAs.
Attributes of MSAs, Central Cities, and Inner Cities (2011).
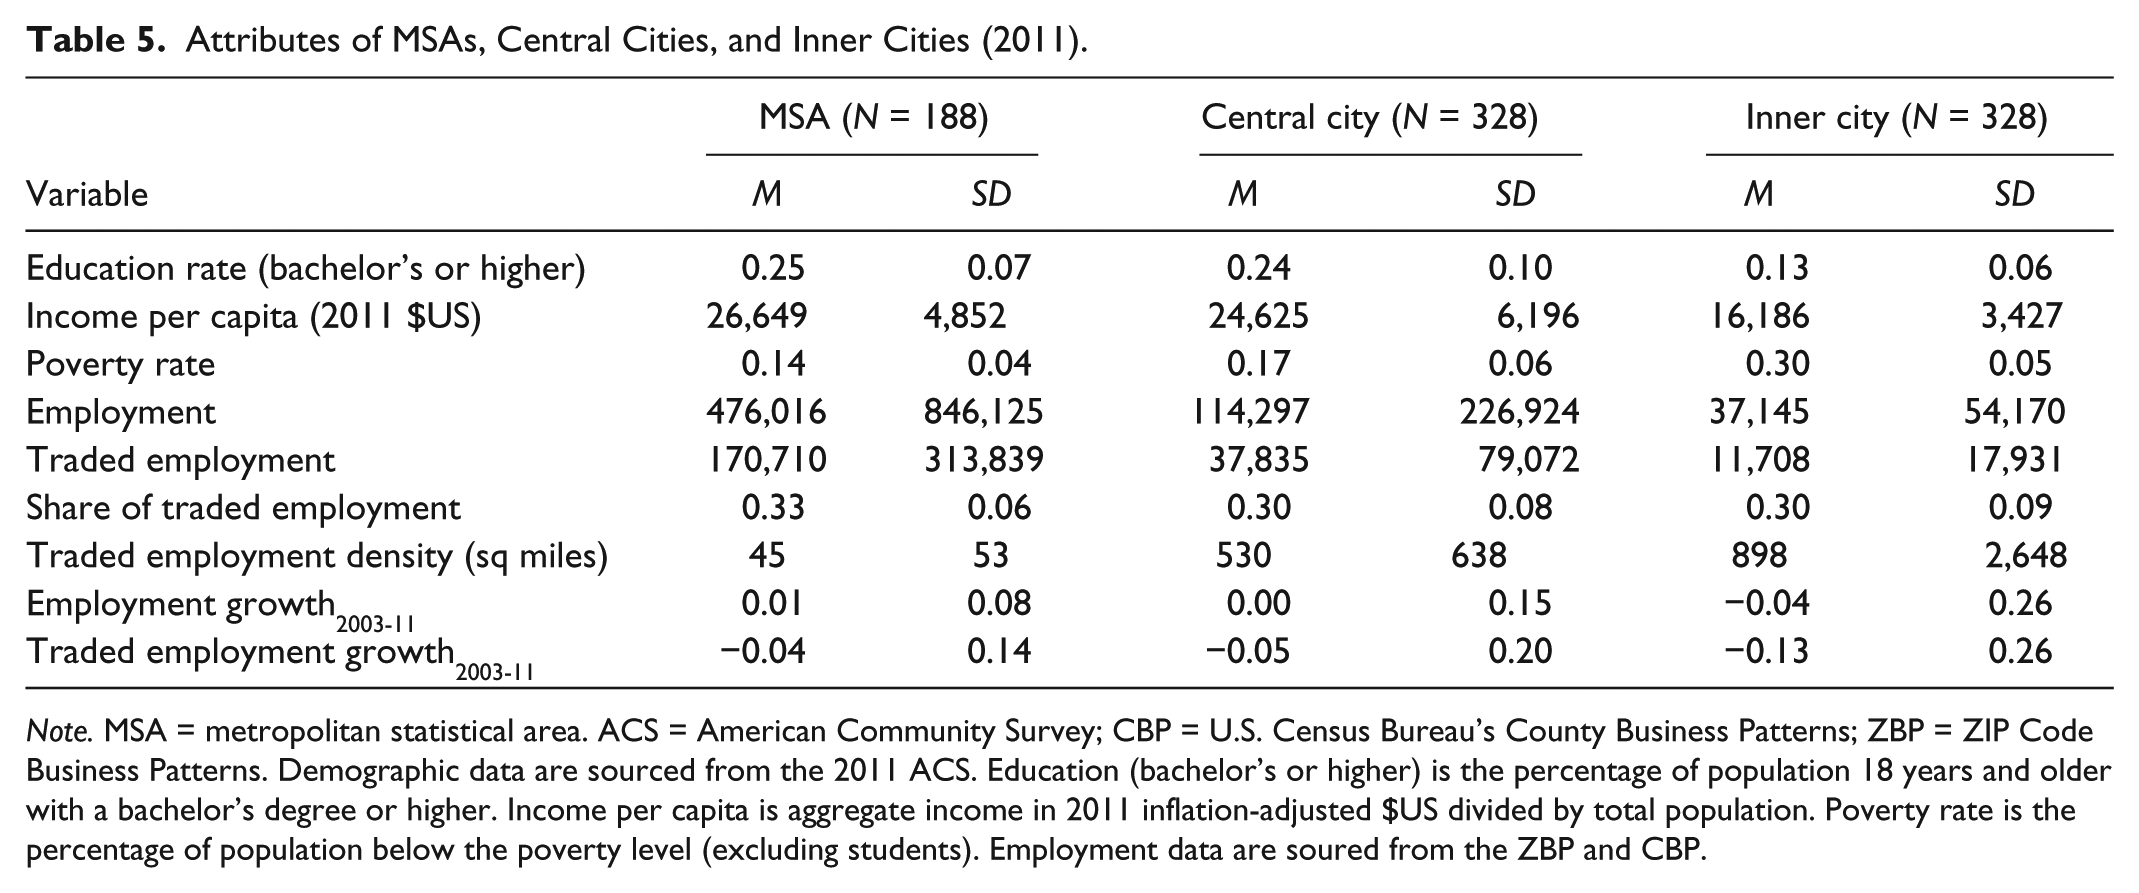
Note. MSA = metropolitan statistical area. ACS = American Community Survey; CBP = U.S. Census Bureau’s County Business Patterns; ZBP = ZIP Code Business Patterns. Demographic data are sourced from the 2011 ACS. Education (bachelor’s or higher) is the percentage of population 18 years and older with a bachelor’s degree or higher. Income per capita is aggregate income in 2011 inflation-adjusted $US divided by total population. Poverty rate is the percentage of population below the poverty level (excluding students). Employment data are soured from the ZBP and CBP.
Some inner cities are well known for their challenging socioeconomic conditions, such as Detroit, Baltimore, and Newark. However, the social conditions across inner cities vary greatly. For example, the poverty rate (excluding student population) ranges from 17% in Bloomington, Minnesota’s inner city to 43% in Dearborn, Michigan’s inner city.
In terms of employment, inner cities are characterized by relatively low employment levels, 37,144 jobs on average, versus 114,297 jobs in central cities and 476,016 jobs in MSAs. Interestingly, the share of traded employment is relatively constant, at 30% for inner and central cities and 33% in MSAs. Given the higher population density found in inner cities (Table 4), it is not surprising that employment density is also higher in inner cities than in central cities and MSAs. On average, there are over 20 times the number of traded jobs per square mile in inner cities versus MSAs (898 vs. 45 jobs per square mile), with central cities between the two at 530 jobs per square mile. Employment growth was weak for all three areas from 2003 to 2011, which reflects broader recessionary conditions. Employment growth declined in inner cities on average by 4%, while there was no growth in central cities and just a slight increase in MSAs (1%). Traded employment declined during that period in all three areas: 13% in inner cities, 5% in central cities, and 4% in MSAs.
Sample Description and Variable Definitions
The empirical analysis examines the growth of inner-city industries that existed in 2003. Our sample includes 35,641 inner-city industries that have at least 10 employees in 2003, 327 inner cities, and 755 industries (six-digit NAICS) belonging to 51 traded clusters. 10 For this sample, we define our dependent variable as the employment growth of inner-city industries from 2003 to 2011 (IC-Industry Employment Growth). We compute the growth rate by scaling employment data by adding one employee so that we can include industries with zero employment in 2011: ln(1 + Employmentir1,2011/1 + Employmentir1,2003). 11 The mean inner-city-industry employment growth over 2003 to 2011 was −0.869 (Table 6).
Descriptive Statistics: Inner-City-Industry Growth Model.

Note. MSA = metropolitan statistical area; CC = central city; IC = inner city. Sample of IC industries with at least 10 employees in 2003 (327 ICs in 188 MSAs, 755 industries, and 51 clusters). Pc25-50-75 refer to the percentiles 25th, 50th, and 75th, respectively.
The growth model includes the (log of) inner-city employment in the industry in 2003 to account for the initial size of the industry (Ln IC-Industry Employment = ln[1 + Employmentir1,2003]).
To define our variables measuring the strength of a cluster, we draw on prior work that uses location quotients (LQ) as a primary measure of regional cluster specialization (Porter, 2003, among others). For a particular inner-city industry, the employment specialization of the inner city r1 in cluster c is measured by the share of inner-city traded employment in the inner-city cluster (outside the industry i) as compared with the share of U.S.-traded employment in the national cluster (outside the industry i):
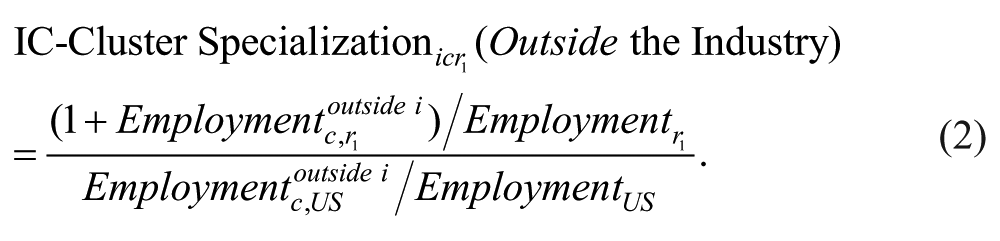
In our sample, the average IC-Cluster Specialization in 2003 is 1.493 and the standard deviation is 4.031 (Table 6).
Similarly, we measure the specialization of the cluster in the central city area that surrounds the inner city (i.e., excluding the cluster employment in the inner city) and in the MSA area that surrounds the central city (i.e., excluding the cluster employment in the central city):
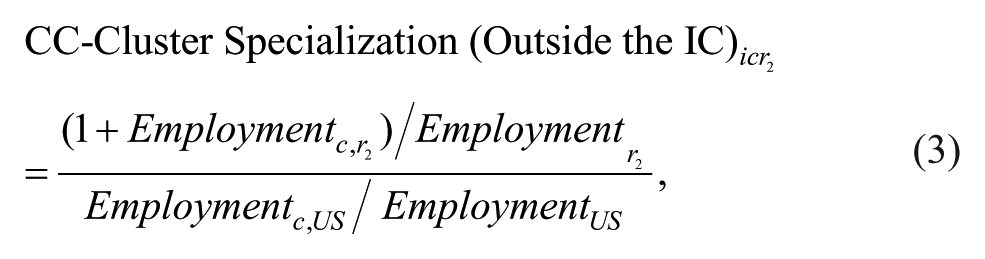
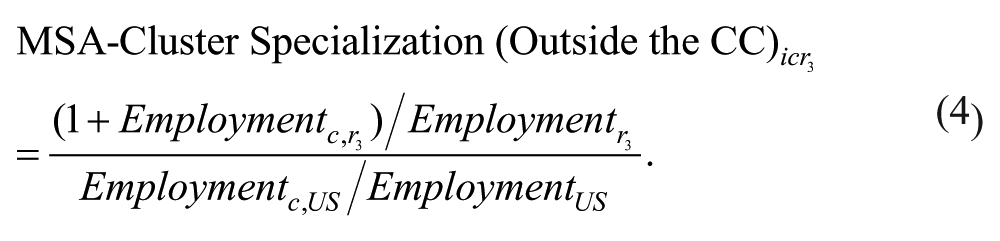
It is useful to note that in our model (Equation 1) with inner city and industry fixed effects, the independent variation utilized in the regressions comes from the employment in a given inner-city cluster and the employment in the surrounding cluster in the central city and the MSA. 12
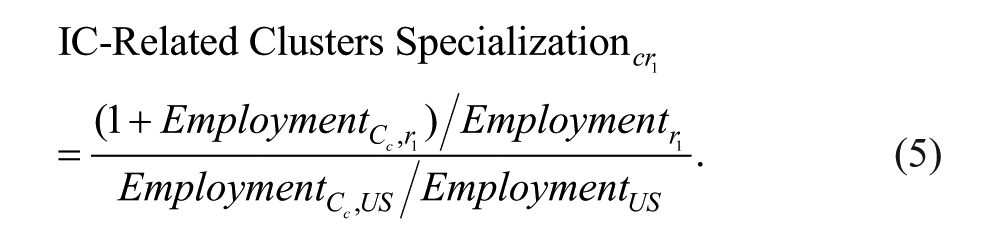
Although our analysis focuses on linkages across geographies within a given cluster, we also take into account linkages across related clusters. We use the definition of related clusters developed in Delgado et al. (2015, 2016). For any cluster category c they identify the set of meaningfully related clusters Cc. For example, the Automotive cluster has three related clusters Cc: Metalworking Technology, Production Technology and Heavy Machinery, and Plastics. Similarly to Equations 2 to 4, we then measure for each focal cluster the specialization in the related clusters in the inner city, the surrounding central city, and the rest of the MSA. For instance, for a particular cluster c, the employment specialization of the inner city in the related clusters is measured by the share of inner-city traded employment in the inner-city-related clusters as compared with the share of U.S.-traded employment in the national related clusters:
In the next section, we offer descriptive findings on the cluster composition of inner cities and illustrative examples of cluster specialization at different levels of geography within regions.
Cluster Composition of Inner Cities
To understand the economic structure of inner cities, we measure their cluster composition in 2011 using the 51 traded cluster definitions established by Delgado et al. (2016). We first examine which national clusters have a large employment presence in inner cities (Table 2, Columns 2-4). We then show differences across inner cities in their specialization in particular clusters (Table 2, Column 5), and conclude that inner cities vary in their cluster composition.
Five large U.S. clusters each support more than 200,000 jobs in the 328 inner cities (Table 2, Column 2). They include Business Services, Distribution and Electronic Commerce, Education and Knowledge Creation, Financial Services, and Hospitality and Tourism. Together they represent 58% of traded employment across all inner cities and individually a relatively large share of inner-city traded employment. For example, 22% of all inner-city traded employment is in the Business Services cluster. This is consistent with the fact that the national Business Services cluster is very large, accounting for roughly 24% of U.S.-traded employment.
When we look at the share of national cluster employment located in inner cities, however, a different set of clusters stand out (Table 2, Column 4). In the Apparel cluster, for example, 25% of all apparel jobs are located in the inner city. In the Performing Arts cluster the share is 24%. Environmental Services, Jewelry and Precious Metals, Leather and Related Products, Music and Sound Recording, and Tobacco all have employment shares between 15% and 17%. The findings suggest that inner cities in general offer some locational advantages for these five clusters; however, as we show next, not all the inner cities are specialized in these clusters.
We find that inner cities are unique and specialize in particular sets of clusters. When we examine the distribution of the cluster specialization of inner cities for each cluster category, it is evident that the strength of a cluster varies across inner cities (Table 2, Column 5). For example, the Apparel cluster is only strong (i.e., LQ greater than 1 and some minimum level of employment) in 20% of inner cities (66 out of 328). 13
Cluster Specialization at Different Levels of Geography
Inner cities vary both in their cluster composition and the extent to which their clusters are connected with those of the nearby region. Tables 7 to 9 illustrate whether particular inner cities are specialized in the same cluster(s) as that of their surrounding region in 2011. As an example, we return to Odessa, Texas (Table 7). In this region there are seven clusters that are strong (LQ > 1) at either the inner city, central city, or the MSA levels. In the Odessa MSA, the three strongest clusters in 2011 are Oil and Gas Production and Transportation, Construction Products and Services, and Distribution and Electronic Commerce. These three clusters are strong in the inner city, the surrounding central city, and in the rest of the MSA (i.e., they are connected clusters). However, there are also clusters that are weak in the inner city but strong in its nearby region (e.g., Transportation and Logistics). As we show in the following section, connected clusters in the Odessa inner city (such as Oil and Gas) are associated with greater employment growth in the inner city than disconnected clusters.
Cluster Specialization in Odessa, TX, Inner City and in Its Central City and MSA.
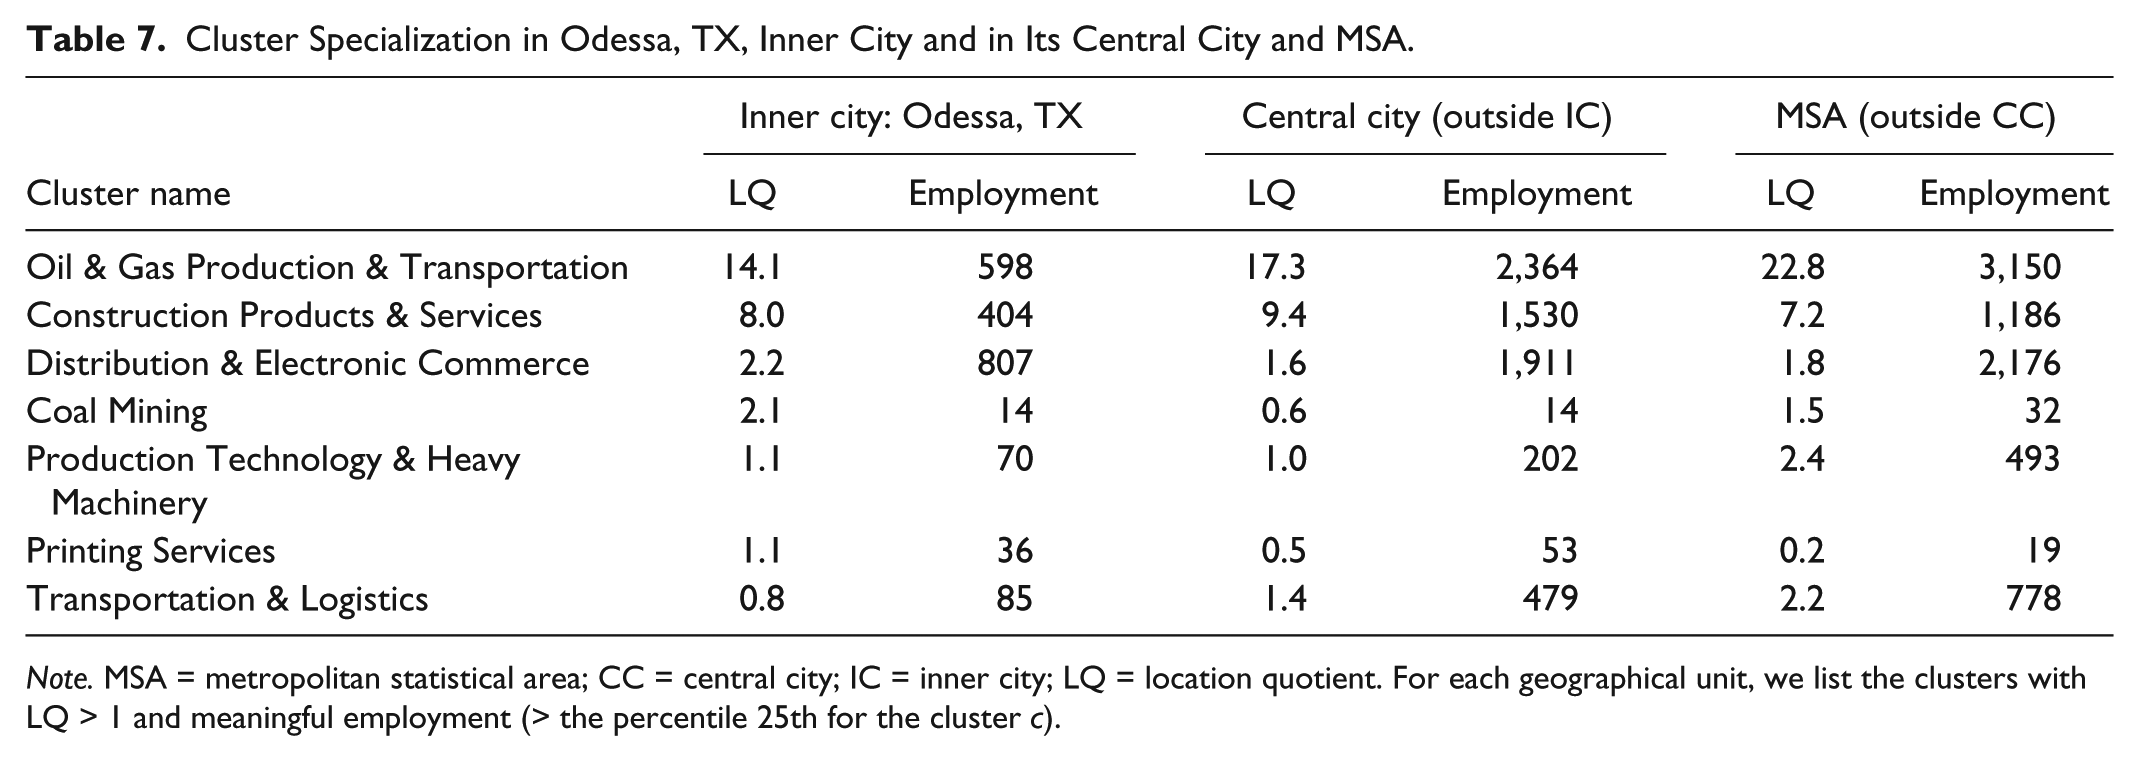
Note. MSA = metropolitan statistical area; CC = central city; IC = inner city; LQ = location quotient. For each geographical unit, we list the clusters with LQ > 1 and meaningful employment (> the percentile 25th for the cluster c).
Cluster Specialization in Boston, MA, Inner City and in Its Central City and MSA.

Note. MSA = metropolitan statistical area; CC = central city; IC = inner city; LQ = location quotient. The MSA is Boston-Cambridge-Newton, MA-NH.
Cluster Specialization in Cambridge, MA, Inner City and in its Central City and MSA.

Note. MSA = metropolitan statistical area; CC = central city; IC = inner city; LQ = location quotient.
When we look at multiple inner cities within the same MSA, such as Boston and Cambridge in the Boston-Cambridge-Newton, MA-NH, MSA, we find that the connected clusters are not necessarily the same for all inner cities—again, supporting the concept that each inner city, even within the same region, is unique in its cluster composition (Tables 8 and 9). Some of the clusters are strong across all three geographies in both Boston and Cambridge (e.g., Education and Knowledge Creation) but others are not. For example, Financial Services is a strong cluster in Boston’s inner city and its nearby region, but it is a weak cluster in Cambridge’s inner city. Similarly, Information Technology and Analytical Instruments is a strong cluster in the Cambridge inner city and its nearby region, but it is a weak cluster in Boston’s inner city. These examples show that inner cities within the same MSA may not be connected to the same clusters in the region.
Findings: Clusters and Employment Growth in Inner Cities
We find that industry employment growth in inner cities is positively associated with the strength of the cluster that surrounds the industry at different levels of geographies within a region. The analysis is presented in Tables 10 and 11. We begin in (Table 10, Model 1) with a model relating inner-city-industry employment growth to the (log of) initial level of employment in the industry (IC-Industry Employment), and a comprehensive set of industry and inner city fixed effects. The estimated coefficient is negative, suggesting that convergence forces prevail at the level of the inner-city industry (i.e., larger inner-city industries are growing more slowly).
Industry Employment Growth in Inner Cities (N = 35,641).

Note. MSA = metropolitan statistical area; CC = central city; IC = inner city; LQ = location quotient; FE = fixed effects. Standard errors are clustered by inner-city cluster.
Refer to coefficients significant at 1% level.
Industry Employment Growth in Inner Cities: Nonlinear Effects of Cluster Specialization.

Note. MSA = metropolitan statistical area; CC = central city; IC = inner city; LQ = location quotient; FE = fixed effects. Standard errors are clustered by IC cluster. The omitted dummy is IC-Weak & CC-Weak & MSA-Weak (the cluster is weak at the three geographies). Table 11, Model 2, uses all MSA industries that existed (+10 employees) in 2003 and their corresponding IC industries.
and ** refer to coefficients significant at 1% and 5% levels.
In Table 10, Model 2, we introduce a second variable (IC-Cluster Specialization), the initial specialization of the inner city in the set of related industries comprising the cluster (excluding the focal IC-industry). Although the coefficient on IC-Industry Employment continues to be negative (and of similar magnitude), the strength of the cluster in the inner city where the industry is located has a positive effect on the industry growth (positive coefficient of Ln IC-Cluster Specialization variable). This suggests that agglomeration effects may be at work within inner-city clusters. However, the estimated effect is biased since the model abstracts from the presence of the cluster in the proximate central city and the rest of the MSA.
To evaluate if cluster agglomerations are present inside the inner city and its proximate region, in Table 10, Model 3, we estimate our core specification (Equation 1), which includes the relative presence of the cluster at the three levels of mutually exclusive geographies: in the inner city (IC-Cluster Specialization), the surrounding central city (CC-Cluster Specialization [outside the IC]), and in the rest of the MSA (MSA-Cluster Specialization [outside the CC]). We find that each of the cluster specialization variables has a positive estimated coefficient, suggesting that cluster agglomerations in inner-city-industry employment growth take place at multiple levels of geographies within a region. The estimated effects of the cluster specialization in the inner city and the surrounding central city are each greater than in the rest of the MSA. As noted above, the lower estimated effect for the surrounding MSA cluster is consistent with prior studies that find that agglomeration economies are facilitated by proximity and density (Ciccone & Hall, 1996). 14
In Table 10, Model 4, we examine the role of cluster specialization in the whole MSA, outside the inner-city industry (Ln MSA-Cluster Specialization). The estimated effect is positive and significant suggesting that cluster agglomerations that influence IC-industry employment growth are present at the overall MSA level. However, the findings in Table 10, Model 3, suggest that to understand inner-city growth we should not focus on either the inner city or the overall MSA, but rather take into account the strength of the clusters in the inner city and its nearby region.
We have examined the linkages between a given inner-city cluster with the same cluster at nearby geographies. A cluster can also have linkages with related clusters in the region (e.g., a Financial Services cluster can benefit from the presence of an Insurance cluster in the region). We examine the role of related clusters in inner-city industry growth in Table 10, Model 5, by including the specialization in related clusters in the inner city (IC-Related Clusters Specialization), the surrounding central city (CC-Related Clusters Specialization [outside the IC]), and in the rest of the MSA (MSA-Related Clusters Specialization [outside the CC]). Our baseline model (Table 10, Model 3) findings are robust. IC-industry growth is facilitated especially by the presence of the same cluster in the inner city and its nearby regions, but the presence of related clusters in the central city also matters. 15
Finally, to reinforce the analysis and facilitate the interpretation, we also allow for nonlinearities in the effect of the cluster variables. The goal is to examine whether or not agglomeration benefits for inner cities can arise when the cluster is strong inside the inner city but weak outside the inner city (or the opposite, when the cluster is only strong outside the inner city). To examine potential nonlinearities in the relationship between cluster strength at the three levels of nearby geographies and inner-city-industry growth, we transform each of the cluster specialization variables in Table 10, Model 3, into dummies for “strong” versus “weak” cluster (i.e., strong if LQ is greater than 1). For example, IC-Strong indicates that IC-Cluster Specialization2003 is greater than 1. We then estimate Equation 1 using a set of eight dummies that capture whether the cluster is strong/weak in the inner city or in the surrounding central city or in the rest of the MSA. The omitted dummy variable is the case when the cluster is weak at the three levels of geographies (IC-Weak & CC-Weak & MSA-Weak).
Table 11 shows the findings for our core sample (Table 11, Model 1). We find that having some strength at any of the levels of geographies (IC, CC, or MSA) is better than being located in an inner city where the cluster is weak at all levels of geographies (i.e., all the coefficients are positive and significant relative to the omitted IC-Weak & CC-Weak & MSA-Weak variable). Importantly, the findings confirm the connected cluster results in our baseline specification (Table 10, Model 3). Industries located in inner cities with a strong cluster at the three levels of geographies register higher employment growth than industries in inner cities where the cluster is weak inside or outside the inner city (i.e., disconnected). The same findings hold in Table 11, Model 2, using a broader sample that includes all the existing MSA industries in the initial year to allow for cases where the cluster may be strong in the MSA even if the industry does not exist in the inner city.
Cluster Heterogeneity
To explore whether our findings vary across different types of clusters (e.g., service oriented versus manufacturing oriented), we estimate the baseline inner-city-industry growth model (Equation 1; Table 10, Model 3) allowing for cluster-specific coefficients for the IC-Industry Employment (δc) and the cluster specialization variables (β1c, β2c, β3c). The estimated coefficient of the inner-city cluster specialization variable (β1c) is positive for most clusters and statistically significant for 14 clusters (Table 12). This suggests that strong clusters in the inner city, regardless of specific types of clusters, matter for the employment growth of inner city industries. The estimated coefficients of cluster specialization in the surrounding central city (β2c) and in the rest of the MSA (β3c) are also positive for most clusters, reinforcing our result that agglomeration effects arise across the same cluster in the inner city and in its surrounding region. Clusters with a statistically significant estimated effect for cluster specialization inside and outside the inner city include Music and Sound Recording, Footwear, Business Services, Metalworking Technology, Apparel, and Transportation and Logistics, which suggests that intraregional cluster links may be especially important for them. Finally, the joint estimated effect of cluster specialization in the inner city, the surrounding central city, and the rest of the MSA is positive and statistically significant for 33 clusters (i.e., β1c + β2c + β3c > 0 at 10% significance level; Table 12). 16 These findings suggest that, for most cluster categories, industries located in inner cities with a stronger cluster inside or outside the inner city will grow faster.
Industry Employment Growth in Inner Cities: Coefficients of Cluster Specialization by Cluster (Table 10, Model 3, N = 35,641).

Note. MSA = metropolitan statistical area; CC = central city; IC = inner city. We estimate Equation 1 allowing for cluster-specific coefficients for the IC-industry employment (δc) and the cluster specialization variables (β1c, β2c, β3c). The last column reports the joint cluster effect on IC-industry employment growth.
, **, * refer to coefficients significant at 1%, 5%, and 10% levels.
Overall, our results suggest that industries located in inner cities with a strong cluster in the inner city or in the nearby region exhibit greater employment growth, a finding that is robust across many cluster categories. We recognize that this relationship could be correlated with unobserved region-industry specific initiatives implemented before or during our time period, such as policies that support the growth of particular industries and clusters in the region (e.g., lower tax rates or other subsidies for particular industries). To capture some of these unobservable drivers, we controlled for the employment growth of the MSA industry and our findings were robust. Although we cannot make a causal assertion in the absence of exogenous variation in the cluster (e.g., changes because of the exit or entry of anchor firms in the cluster), our findings suggest a positive relationship between the initial cluster strength in the inner city and its nearby region and inner-city industry growth.
Conclusion
This study offers a formal definition of an inner city and its clusters, which allows us to measure the unique cluster composition of inner cities and their nearby regions. Using these data, we evaluate whether agglomeration effects occur in inner cities. We find evidence consistent with agglomeration effects arising within inner-city clusters. Industries located in an inner city with higher initial cluster strength are associated with higher employment growth. We also find evidence consistent with agglomeration effects across the same cluster in the inner city and its nearby region. The strength of the same cluster in the surrounding central city and in the rest of the MSA, and the strength of related clusters in the surrounding central city are also positively associated with the growth of the industries in the inner-city cluster. These findings suggest that cluster agglomeration in inner cities are facilitated by intraregional linkages between an inner-city cluster and the same cluster (and related clusters) in the nearby region, validating Porter’s (1997) premise that inner-city job creation could be facilitated by integrating inner-city businesses into regional clusters.
Our findings add to a growing body of scholarly work addressing inner-city economic development. By examining the relationship between the cluster compositions at different levels of geography within the same region, we offer a new approach to explain inner-city economic development. This study provides a first step in better understanding intraregional cluster linkages and specifically their impact on inner-city-industry employment growth. Our analysis offers several directions for future research that are necessary to develop the right strategies to support cluster growth.
First, the study abstracts from cluster formation and dynamics, which is an important area for future research. We do not know whether a cluster originated inside or outside the inner city, and how the formation process of the cluster influences the type and degree of intraregional cluster linkages (Klepper, 2010). The cluster may have originated in the central city or in other parts of the MSA and only later generated benefits for inner-city industries, or the cluster may have expanded out from the inner city to the rest of the region.
Second, we need a better understanding of the type of agglomerations in the inner city and its proximate geographical areas. Various types of agglomerations can be at work in clusters (input–output links, access to demand, shared labor occupations and skills, and knowledge linkages), and their prevalence may differ for the same cluster inside versus outside inner cities. For example, knowledge linkages may be less prevalent in the inner city since firm research and development activities tend to be located outside the inner city. Relatedly, the relationship between the strength of clusters in the region and inner-city growth is in part explained by the location choices of firms. In some cases, start-ups and incumbent firms may choose to locate in the inner city because of locational advantages and external agglomerations (i.e., cheaper rent and proximity to customers, suppliers, knowledge, or skills in the inner city and nearby city). In other cases, incumbent firms may choose to open new facilities in the inner city because of proximity to same-firm facilities in the region (i.e., to exploit internal agglomerations; Alcacer & Delgado, in press).
Finally, we need to incorporate the local economy in our analysis to examine how the interaction of the traded and the local economy influences employment growth in inner cities. For example, the local economy may be underserved in inner cities (Weiler et al., 2003) and this could limit the growth of their traded clusters. Two types of local industries should be considered (Delgado & Mills, 2015): business-to-business (i.e., industries that focus on selling to businesses) and business-to-consumer (i.e., industries that focus on selling to consumers). They both may be important to the growth of traded clusters in inner cities. Firms may be less likely to choose locations where business-to-consumer activities, including restaurants and other amenities, are lacking (Brueckner, Thisse, & Zenou, 1997; Florida, 2002). Firms may also be reluctant to locate in inner cities lacking suppliers of local business services (like logistical and office administrative services). Conversely, the presence of strong traded clusters may foster the growth of certain local industries.
Our findings also offer several important policy implications for inner-city economic development. First, to maximize impact, inner-city job creation strategies should focus on clusters that are strong or emerging, not just in the inner city but also in the overall region. By doing so, they will leverage competitive advantages present within a region, which is necessary to create sustained growth but too frequently overlooked (Porter, 1997). Without a deeper understanding of regional, city, and inner city economic relationships, our analysis suggests that generic place-based policies to attract any type of firm (e.g., empowerment zones) will be less effective, especially in areas where cluster linkages between the inner city and the rest of the region are broken (e.g., Newark, New Jersey, and Hartford, Connecticut). Choosing popular clusters (e.g., Biopharmaceutical or Performing Art clusters) will also be less effective in creating jobs in the inner city if the clusters are not already emerging or strong in the region. As our analysis shows, inner cities and their regions vary greatly in their cluster composition, and an effective cluster strategy for one inner city will most likely not translate to another.
A full discussion of the strategies to accelerate cluster growth in inner cities is beyond the scope of this research 17 ; however, our findings suggest that policy makers should begin by mapping the cluster composition of their inner city and nearby region, and identifying strong and emerging clusters in the region that have some strength in the inner city. Within those clusters, the goal will be to implement targeted policies to enhance the benefits from connected inner city and regional clusters. These initiatives should focus on developing the necessary workforce in the clusters and the infrastructure to allow for efficient movement of ideas, people, goods, and services. For example, cities should work on aligning workforce development with specific cluster skills and develop complementary education policies to deal with the low education attainments in the inner city (Moretti, 2012).
In addition, cities should invest in transportation and communication infrastructure that facilitates the links between firms operating in the inner city, and firms operating in the same and related clusters outside the inner city. Transportation infrastructure can facilitate the diffusion of knowledge within regions (Agrawal et al., 2014), thereby improving the performance of regional clusters.
Another way to strengthen the inner city clusters is to support entrepreneurship. Policies to promote both local entrepreneurship and innovation-driven entrepreneurship (Acs, Audretsch, Braunerhjelm, & Carlsson, 2009; Feldman, Francis, & Bercovitz, 2005; Guzman & Stern, 2015) could create jobs for residents and minorities that contribute to a sustainable development of inner cities.
We recognize that job creation per se may not necessarily lead to improved social conditions in inner cities. Policies focused on housing, health care, education, credit, and safety may be required to ensure equitable outcomes for inner-city residents. However, our findings suggest a more strategic approach to economic development within inner cities that supports the connection of inner cities to their regional economies and may create greater economic growth than existing interventions.
Footnotes
Appendix
Acknowledgements
We thank Austin Nijhuis and Rich Bryden for their very valuable assistance with the data analysis. For very helpful comments, we are grateful to the two anonymous reviewers as well as Alfonso Gambardella, Iain Cockburn, David Colino, Jeff Furman, Christian Ketels, Frank Neffke, Michael Porter, Scott Stern, and participants at the NBER Productivity Lunch Seminar, and the Inner City Economic Summit in Detroit.
Declaration of Conflicting Interests
The author(s) declared no potential conflicts of interest with respect to the research, authorship, and/or publication of this article.
Funding
The author(s) received no financial support for the research, authorship, and/or publication of this article.