
Abstract
This study examines the effect of tax increment financing (TIF) on economic growth in Indiana. TIF areas are designated with the intent of spurring economic development characterized primarily by growth in assessed value and in employment within the TIF area. We examined property-level data from 2004 to 2013 and found that the average property in a TIF area may display higher assessed values than the average property in a similarly situated non-TIF area. While both TIF and non-TIF properties tended to grow over time, the average property in a TIF area may grow by slightly more than its non-TIF counterpart. We also found that TIF does not statistically significantly affect employment or employment growth over time. While there does not appear to be a multiplicative effect of the presence of enterprise zones and TIF on employment, TIF works with property tax abatements in incentivizing job creation. Our analysis of the effect of TIF on economic development outcomes informs policy makers of the likelihood that a given area will adopt TIF in the context of the “but-for” question.
Tax increment financing (TIF) is an incentive tool that has been used by a majority of U.S. states with the intent of economic development. TIF areas are supported by the tax revenue generated on the assessed value exceeding the base assessed value (the assessed value in the area before its designation as a TIF area). This tax increment is used to construct infrastructure and fund economic development programming.
The relationship between TIF adoption and economic development has often been modeled on the premises of the “but-for” question. While proponents of TIF claim that economic development would not have occurred but for the adoption of TIF, opponents argue that an economy would have grown anyway. The but-for question is especially relevant for local governments. If economic development would have occurred without the establishment of TIF and a municipality instead adopts TIF, any growth in property values is not available to local governments until the public investment has been fully financed. This could be accomplished through debt financing, whereby a bond may be paid off earlier or later than anticipated, or through direct spending of revenue as it is collected. If economic development would not have occurred but for the establishment of TIF, then the goal of the program is achieved. It is often difficult to assess whether the program itself is responsible for economic growth.
This study aims to quantify the relationship between TIF adoption and economic development outcomes as measured by assessed value and employment. As such, we raise the following research questions: (1) To what extent does the presence of TIF influence the assessed values and employment of TIF areas versus their counterparts? (2) Is a municipality’s decision to adopt TIF dependent on its proximity to an existing TIF area? and (3) What are the implications for the but-for question? In an attempt to answer the research questions, this research makes two contributions to the literature. One, we tackle the endogeneity between TIF adoption and economic development outcomes with propensity score matching on property-level data. Two, we consider the existence of spatial dependence across local taxing districts. We expect that economic development projects that affect assessed values (employment) within a TIF area may not only affect assessed values (employment) immediately outside the TIF area but may also affect them in neighboring taxing districts (Dye & Sundberg, 1998).
We analyzed TIF areas in Indiana from 2004 to 2013. After we controlled for various characteristics that influence TIF adoption, we found that the average property in a TIF area may display higher assessed values than the average property in a similarly situated non-TIF area. While both TIF and non-TIF properties tend to grow over time, the average property in a TIF area may grow by slightly more than its non-TIF counterpart. We also found that TIF does not statistically significantly affect employment or employment growth over time.
The first section of this study summarizes the relevant literature. The second section describes the data sample and the final two sections provide empirical results and the conclusion.
Literature Review
Much of the literature relevant to TIF areas relies on the but-for question. Lester (2014) found that TIF assignment throughout the city of Chicago fails the but-for question, as TIF implementation had not resulted in any positive net employment benefits for Chicago’s residents. Byrne (2006) discussed the low levels of density within a blighted area of a municipality, where natural growth in property values is likely regardless of the adoption of TIF. Although he found that TIF areas grow about 29% greater than their municipalities, Byrne noted the large variation in success across space. Specifically, he showed that TIF adoption is most successful in visibly blighted areas where local officials recognize the need for economic improvement.
As TIF areas are generally established by local policy makers with specific goals in mind, there exists an inherent selection bias. To treat that bias, sound econometric methodology recommends the estimation of TIF adoption prior to the estimation of economic development outcomes. Smith (2009) used a treatment effects model to test for selection bias and found that commercial properties located within TIF areas experience higher rates of appreciation than comparable properties in non-TIF areas. Similarly, Carroll (2008) found that properties located within an active TIF area in Milwaukee, Wisconsin grew more than properties not exposed to TIF policy at any time over a period of 20 years. However, Dye and Merriman (2000) found that municipalities that adopted TIF may grow more slowly than otherwise if the TIF redistributed growth toward blighted areas.
A locality’s adoption of TIF is certainly motivated by competition. Man (1999) studied Indiana cities and found that growing cities are not more likely to adopt TIF. Rather, cities tend to compete with each other, thus providing an impetus for TIF adoption. Similarly, Byrne (2006) found that TIF adoption among municipalities in the metropolitan Chicago area is the result of competition among neighboring municipalities for private development. Moreover, Warner and Zheng (2014) found that governments that rely more heavily on tax incentives tend to face more competition than governments that rely on other types of incentives. Anderson (1990) also found that a municipality may establish a TIF area based on its neighbors’ decisions to adopt TIF, possibly because of competition for new businesses. However, Byrne (2005) found that districts are less likely to consider their neighbors’ decisions to adopt TIF and more likely to consider their own fiscal stresses and financial needs when deciding whether to adopt TIF.
Due in part to competition, spatial interactions are often thought to exist among local governments (Boadway, 1989; Brueckner, 2003; Gebremariam, Gebremedhin, & Schaeffer, 2006). To capture spatial spillovers among the assessed values of TIF areas and their neighbors, Weber, Bhatta, and Merriman (2007) modeled the effect of distance on the present value of a property and found that, while proximity to the average TIF area has a negative effect, proximity to a commercial TIF area, in particular, has a positive effect. Alternatively, an area may be competing with adjacent areas as a byproduct of its fear of loss in its own assessed valuation (AV), as proffered by a reviewer. In that regard, Mason and Thomas (2010) found that one city’s adjacency to another city that uses TIF increases the likelihood that a city will approve a TIF as a result of competitive dynamics.
Data
TIF areas are often established by policy makers for two reasons: to improve blighted areas and to capture property tax revenues of areas expected to have high growth. Anderson (1990) found that city officials may establish a TIF area to capture the property tax base of a municipality that began experiencing growth prior to its designation as a TIF. So, it could be that TIF is adopted to promote redevelopment within blighted areas, potentially leading to economic growth. On the other hand, positive economic development that is already evident could induce policy makers to adopt TIF. We addressed the reverse causality between TIF adoption and economic development outcomes by using the propensity score matching technique (Rosenbaum & Rubin, 1983).
Treatment
Parcel-level data on TIF areas in Indiana are provided by TIF Management, a database managed by the Indiana Department of Local Government Finance. The total number of TIF areas in Indiana may be 700 to 800, but the exact number is unknown due to data discrepancies. There are 85 counties with at least one TIF area, and 84 of those have reported some or all their data. The only county that did not report its data was dropped for this analysis. Some counties that reported TIF data failed to report all their data, which presented a limitation for this analysis. As submitters become more familiar with the data management program, compliance should increase, which would allow for a more complete analysis in the future.
The original sample contains approximately 123,000 properties in 579 TIF areas. Several local units reported the same parcel number for multiple TIF areas, which is infeasible. After dropping duplicate parcel numbers and observations with missing TIF initiation years, we analyzed approximately 110,000 parcels in 579 TIF areas (or 3.15% of all parcels in the state).
Outcomes
Assessed Value
Table 1 shows the change in AV from 2004 to 2013 for TIF and non-TIF properties. The largest percentage change in AV for non-TIF and TIF properties occurred during 2006 to 2007, the period immediately preceding the Great Recession. The periods from 2008 to 2009 and 2009 to 2010 showed year-over-year declines in AV for non-TIF properties but growth for TIF properties. During the period from 2012 to 2013, non-TIF properties declined in AV by approximately 2% on average, while TIF properties declined by approximately 1%.
Average AV Per Property by Year.
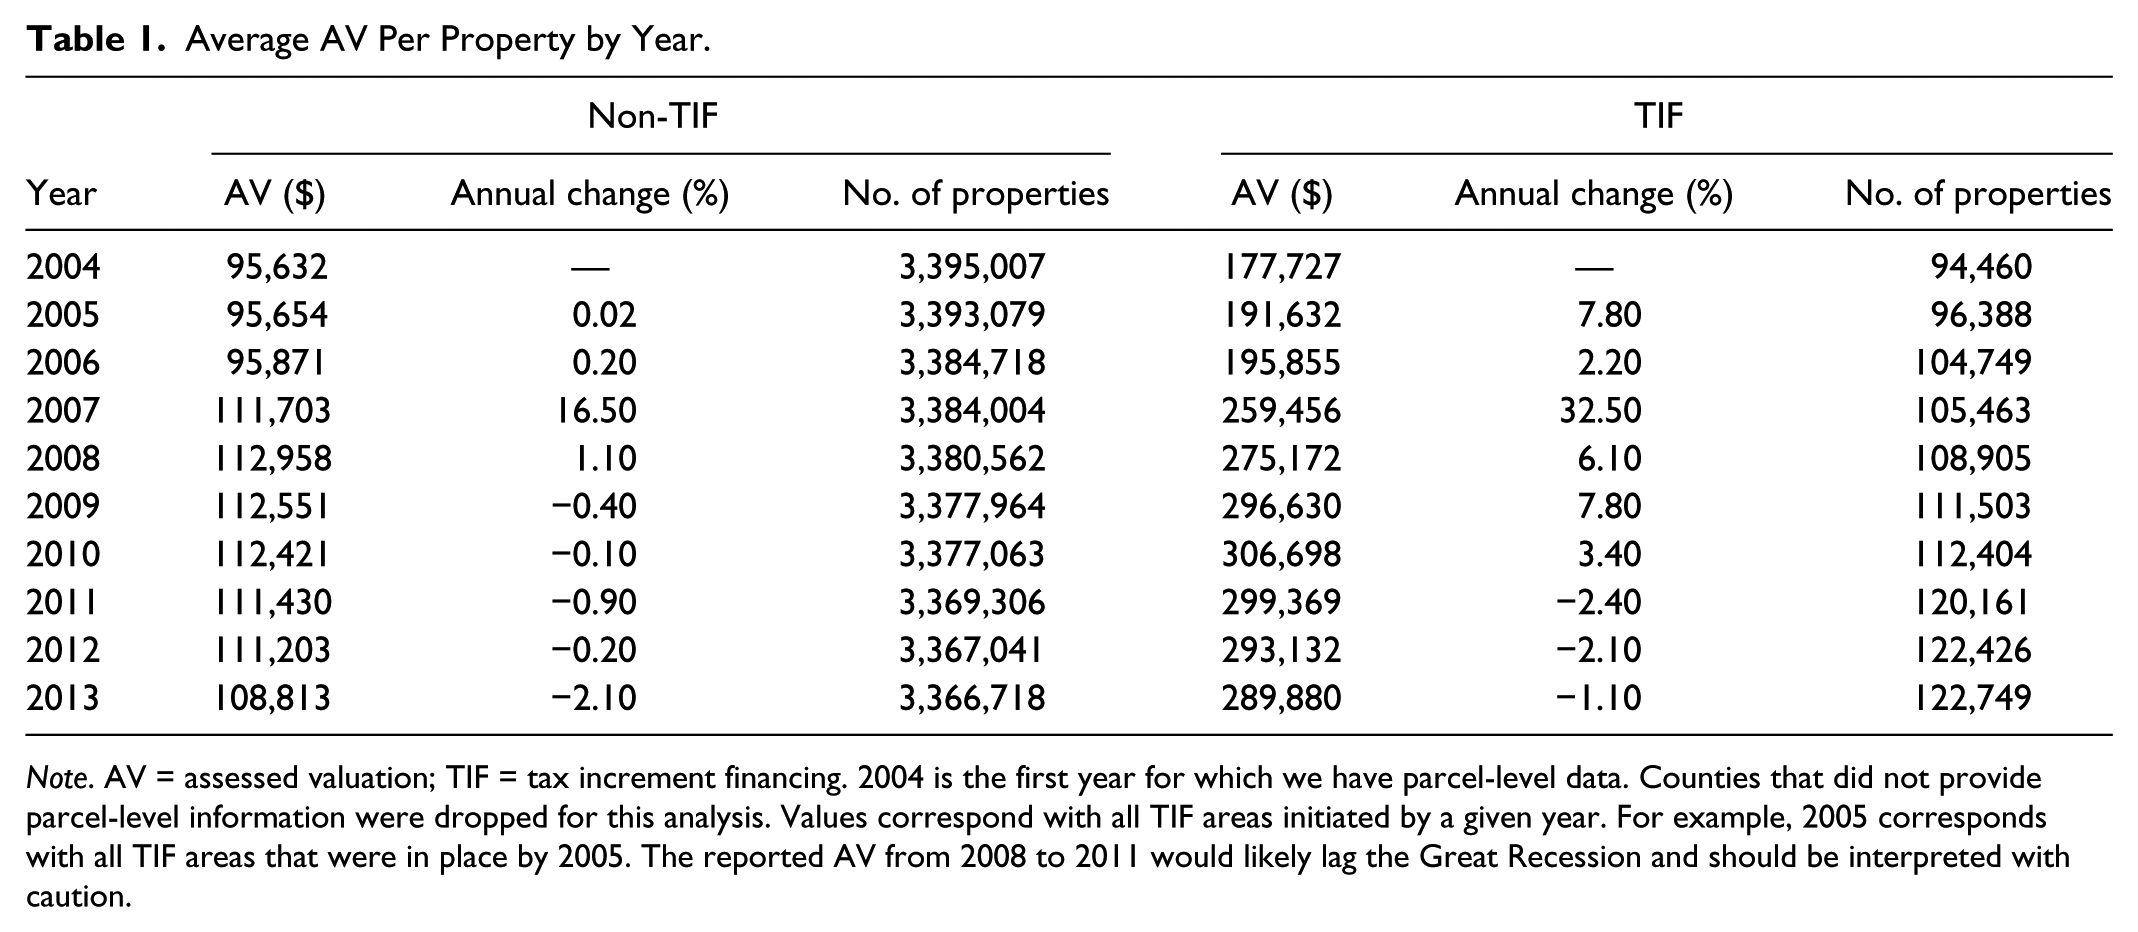
Note. AV = assessed valuation; TIF = tax increment financing. 2004 is the first year for which we have parcel-level data. Counties that did not provide parcel-level information were dropped for this analysis. Values correspond with all TIF areas initiated by a given year. For example, 2005 corresponds with all TIF areas that were in place by 2005. The reported AV from 2008 to 2011 would likely lag the Great Recession and should be interpreted with caution.
Table 2 shows TIF properties by type. The majority of TIF properties are identified as residential properties, followed by commercial properties. Properties classified as mobile homes and gas or oil are excluded from this analysis because they are unlikely to be included in a TIF area. The average AV of TIF properties in 2013 is higher than that of non-TIF properties for all property types except residential and agricultural, suggesting that TIF may not affect those properties as strongly as commercial and industrial properties. In contrast, AV for commercial properties in TIF areas are approximately 2.1 times higher than their non-TIF counterparts, while AV for exempt and industrial properties are 1.3 and 2.3 times higher, respectively.
Non-TIF and TIF AV by Property Type, 2013.
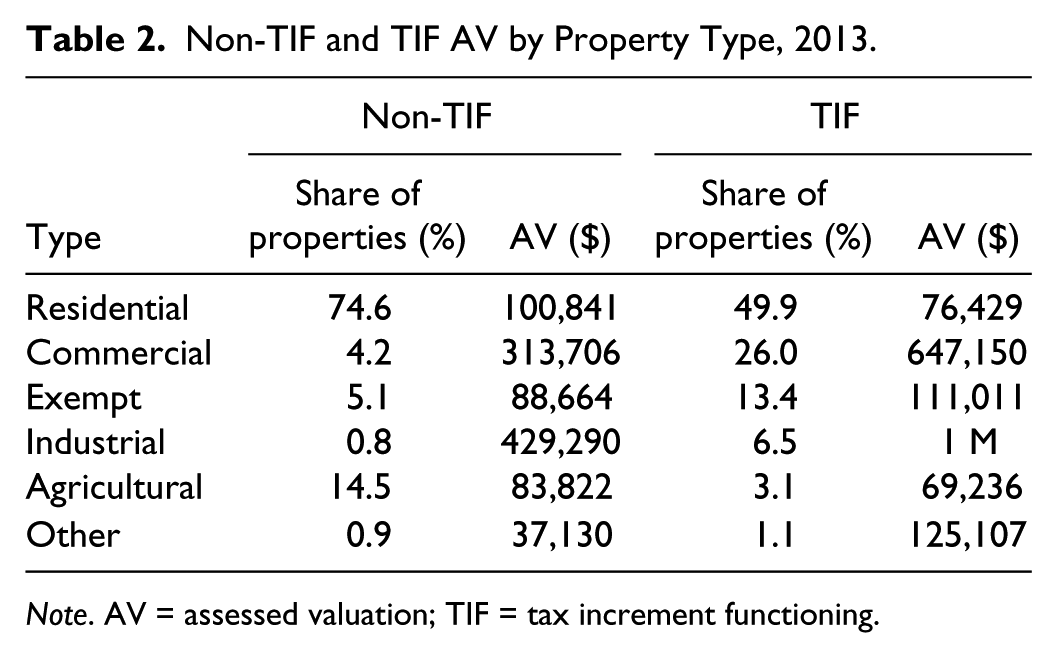
Note. AV = assessed valuation; TIF = tax increment functioning.
Employment
While AV provides some indication of economic growth, an examination of employment may be more appropriate as TIF is often intended to stimulate job creation. Table 3 presents the monthly average number of jobs per year for TIF and non-TIF firms. Establishments within TIF areas employed more people annually (based on monthly averages) than those outside TIF areas over the period 2004 to 2013. TIF and non-TIF establishments felt the effects of the Great Recession from 2007 to 2009 and reduced their employment accordingly. However, TIF establishments suffered less than their counterparts by about 1% to 6%, on average. Both types currently show growth, although the 2012 to 2013 growth in employment for non-TIF establishments exceeded that of TIF establishments.
Monthly Average Jobs and Annual Change in Jobs per Establishment by Year.

Note. TIF = tax increment functioning.
Table 4 shows the distribution of the monthly average number of jobs per establishment in TIF and non-TIF areas by industry. Trade/transportation and information/finance industries are most prevalent among TIF and non-TIF areas. The average establishment in a TIF area contains either the same number of jobs or more than the average establishment in a non-TIF area for every industry except public administration. In particular, the average jobs per establishment is significantly higher for TIF manufacturing establishments than non-TIF manufacturing establishments.
Monthly Average Jobs per Establishment by Industry, 2013.
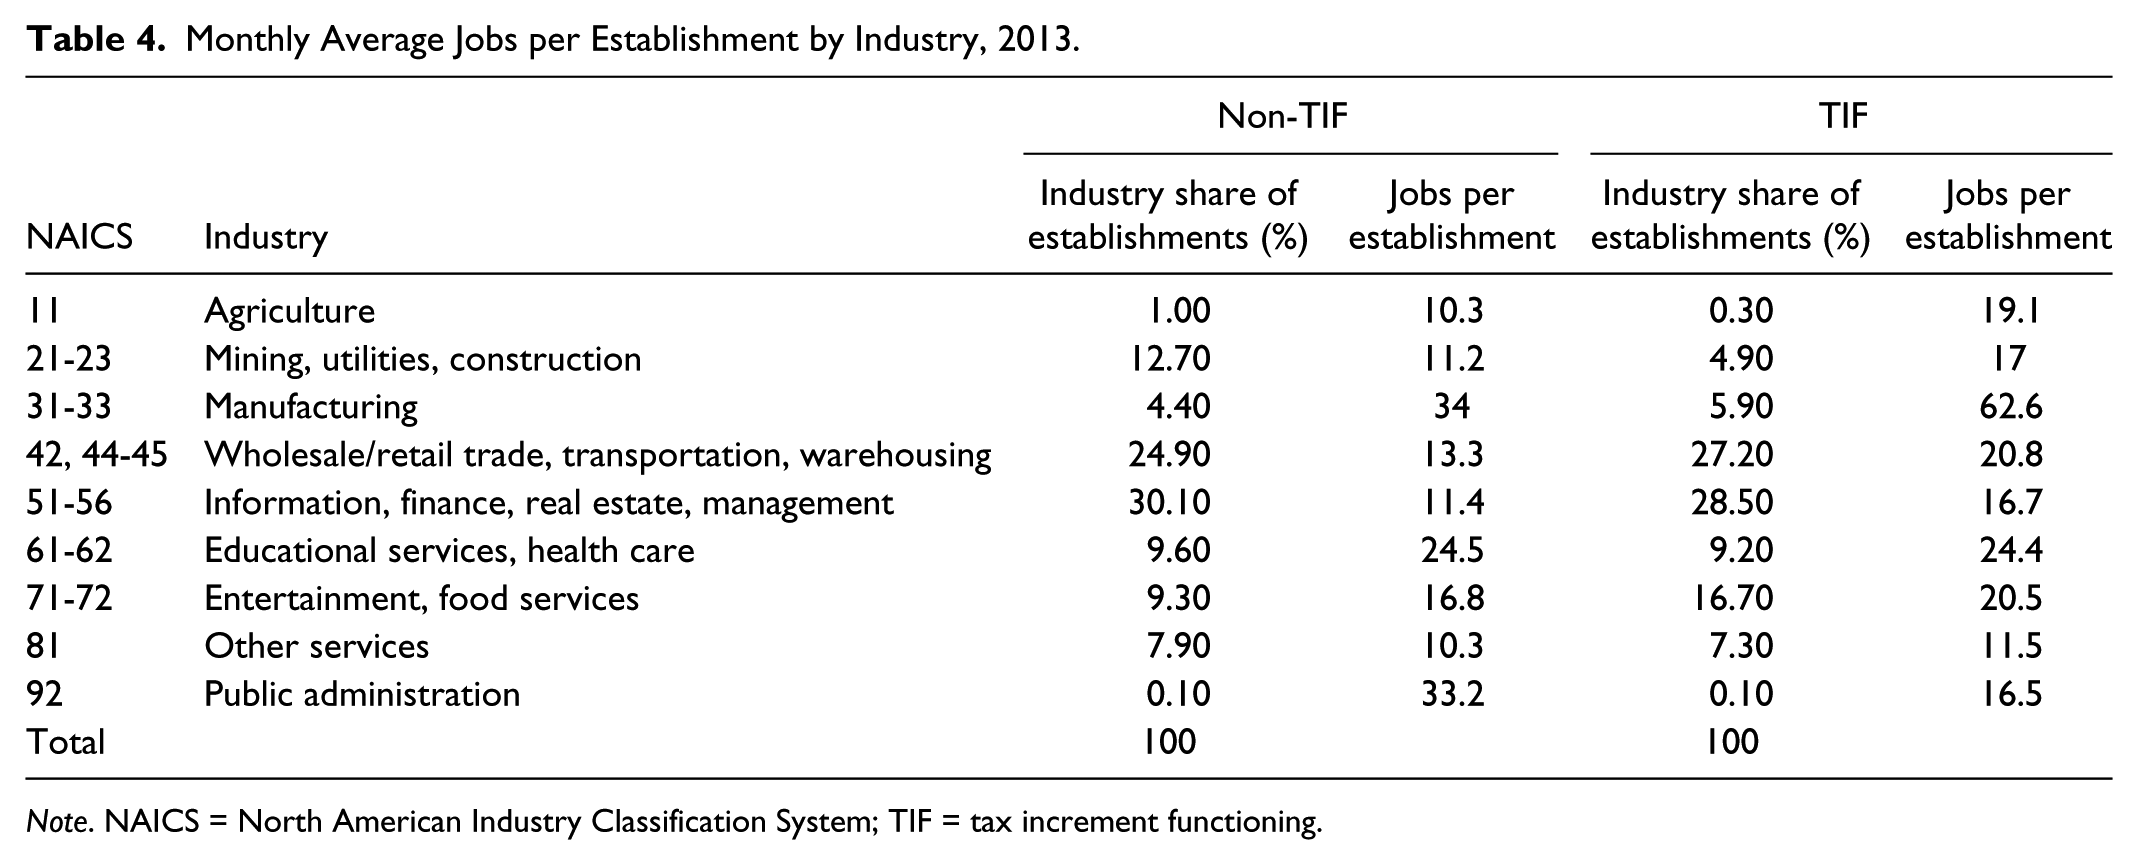
Note. NAICS = North American Industry Classification System; TIF = tax increment functioning.
Currently, we are unable to assess whether these jobs are new, and if jobs are being filled by employees from outside the region or are the result of displacement from one company to another in the same region. Regional data may be used to address this point and is a natural direction for future research.
Controls
Based on Man (1999), we identified fiscal, economic, structural, and demographic characteristics used to determine the likelihood of TIF adoption. As TIF areas are often established to promote economic development, we expected TIF adoption to be a function of historical effective tax rates 1 and assessed values. A positive relationship between either and TIF adoption would indicate that prior growth contributes to the designation of an area as a TIF.
As Byrne (2005) hypothesized, cities with higher municipal tax rates are more likely to establish a TIF area, as raising tax rates for economic development would undoubtedly upset taxpayers more than would adopting TIF. Similarly, as Man (1999) stated, it may be that TIF areas are adopted as an alternative mechanism to fund economic development, especially in the face of voters’ growing resistance to property tax increases.
The National Center for Education Statistics provides economic and demographic variables at the school district level. Specifically, we examined income, unemployment rate, population density, percent of the non-White population, percent of the population age 65 years and older, percent of the population with a bachelor’s degree or higher, and industry type provided by the National Center for Education Statistics School District Demographics System. These variables are averaged across the period 2008 to 2012. Warner and Zheng (2014) found that higher business incentive use is associated with lower property taxes and higher rates of unemployment. Although relatively poor communities stand to benefit more from TIF, they are less likely to generate enough local tax revenue to retire the debt undertaken to finance economic development projects within TIF areas (Felix & Hines, 2013). Additionally, population provides an idea of the size of the TIF area, as larger localities tend to be more active in promoting economic development (Reese, 2006). In Indiana, the average TIF area and its surrounding school district contain about 23,000 more people than the average non-TIF school district.
We also examined structural characteristics. Based on county assessor and auditor data, the predominant property land uses include agriculture, residential, exempt, commercial, and industrial. 2 Wassmer (1994) stated that nonindustrial economic development is less likely to be influenced by local incentives than other types of development. Weber et al. (2007) found that proximity to older, industrial TIF areas caused slower appreciation of property values (presumably due to noise, pollution, and overall lack of appeal) and proximity to mixed-use TIF areas causes more rapid appreciation of nearby housing. Contrarily, Byrne (2006) established that industrial TIF areas experience larger growth than other types of TIF areas.
Additionally, we controlled for the possible influence of enterprise zones (EZs) and property tax abatements in the designation of TIF. Man (1999) showed that controlling for economic development incentives other than TIF helped explain a locality’s decision to adopt TIF. Briffault (2010) compared TIF to EZs and tax abatements, and points out that officials are more able to defend their intentions toward adopting TIF in the absence of a tax abatement.
Finally, we considered spatial dynamics across local taxing districts, which tend to affect each other in their public spending decisions such that one local government has a spillover effect on its neighbor (e.g., Charlot & Paty, 2010; Kauder, 2015). We could build a spatial weight matrix based on a shape file, preferably at the lowest level of spatial aggregation, the parcel. Although the Indiana Geological Survey provides these data, we cannot analyze the database of more than 3.6 million records at a reasonable speed or with accuracy. Therefore, we control for distance between each parcel and the center of the geographically closest TIF area based on previous research (e.g., Weber et al., 2007). In our sample, the average property in a TIF area and a non-TIF area is located approximately 1.7 miles and 4.1 miles, respectively, from the center of the nearest TIF area.
Results
Figure 1 shows t-test p values before and after propensity score matching. Clearly, TIF parcels and non-TIF parcels are completely incompatible. In fact, the mean difference for every variable was highly statistically significant prior to matching. After matching, the balance is significantly improved and the mean differences of 6 of 22 variables remain statistically significant after matching; however, the mean differences are more compatible. For example, although the mean difference for Parcel-TIF distance was −2.4 before matching, it became 0.1 after matching; the mean difference for Land per acre was −4.1 before matching, but it became 0.6 after matching. This provided an indicator of the matching technique’s effectiveness in removing biases among the covariates such that the only observable difference between municipalities was their TIF designation.
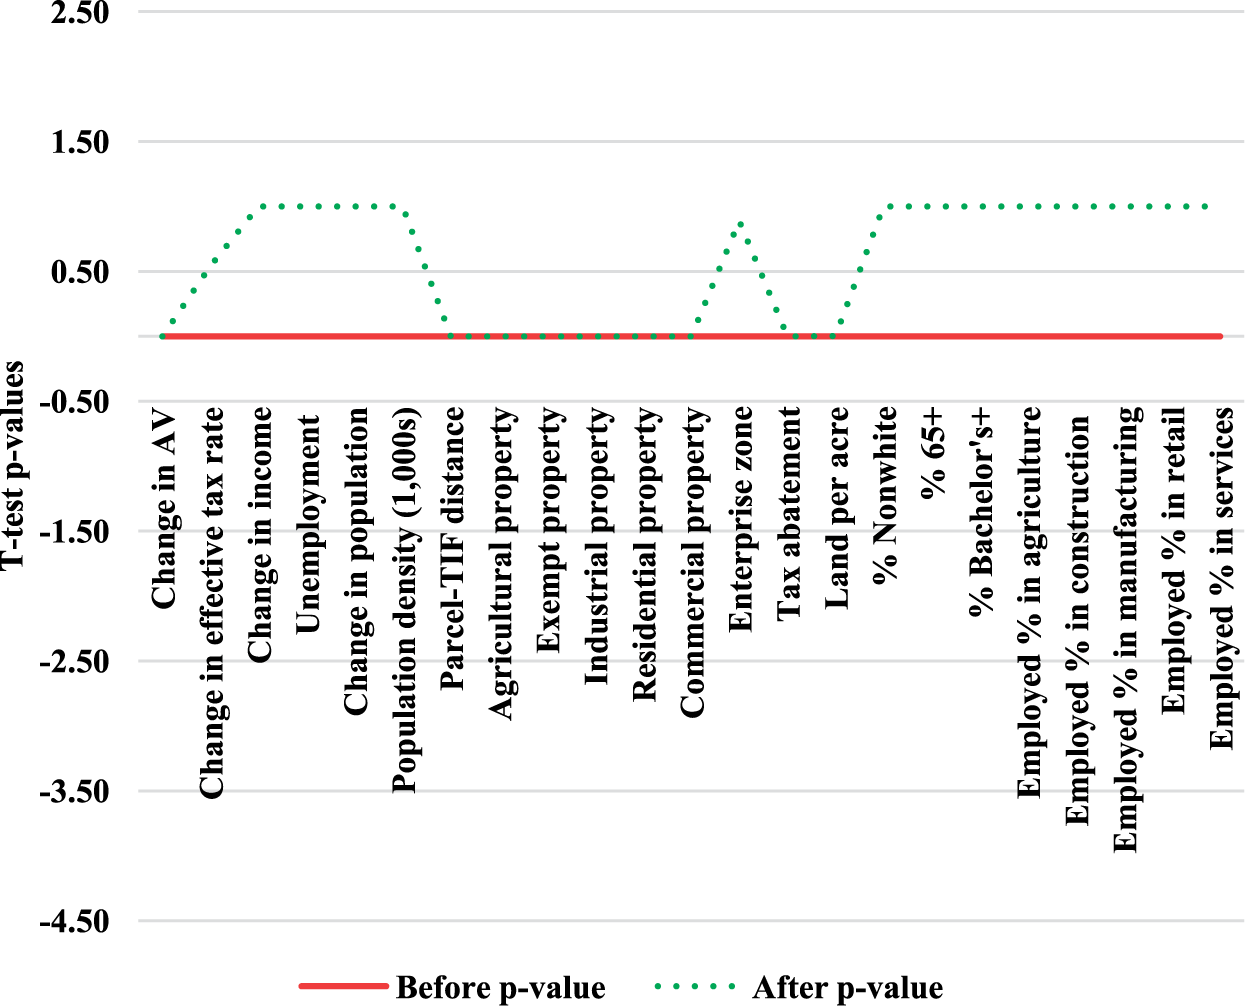
Before and after propensity score matching t-test p values.
Table 5 presents the logit estimation results of the treatment equation, or the first stage of the propensity score matching technique, which is estimated with R’s Matching Package (Sekhon, 2011). The change in AV provides an indication of the type of TIF designation, redevelopment, or new economic development. The results suggested that a 100% increase in AV growth from 2004 to 2013 increased the probability of TIF adoption by 0.02 percentage points. Although the result is economically small, it indicates that local units may adopt TIF to capture prior growth. Similarly, we examined change in income to assess blight as a prerequisite for TIF adoption. The results suggested that a 100% increase in income growth increases the likelihood of TIF adoption by approximately 0.1 percentage point, which is counterintuitive to the general idea of initiating TIF to promote redevelopment. As with AV growth, local units may adopt TIF to capture prior growth as witnessed by rising levels of income.
Logit Estimation Results of TIF Adoption (First Stage of Propensity Score).
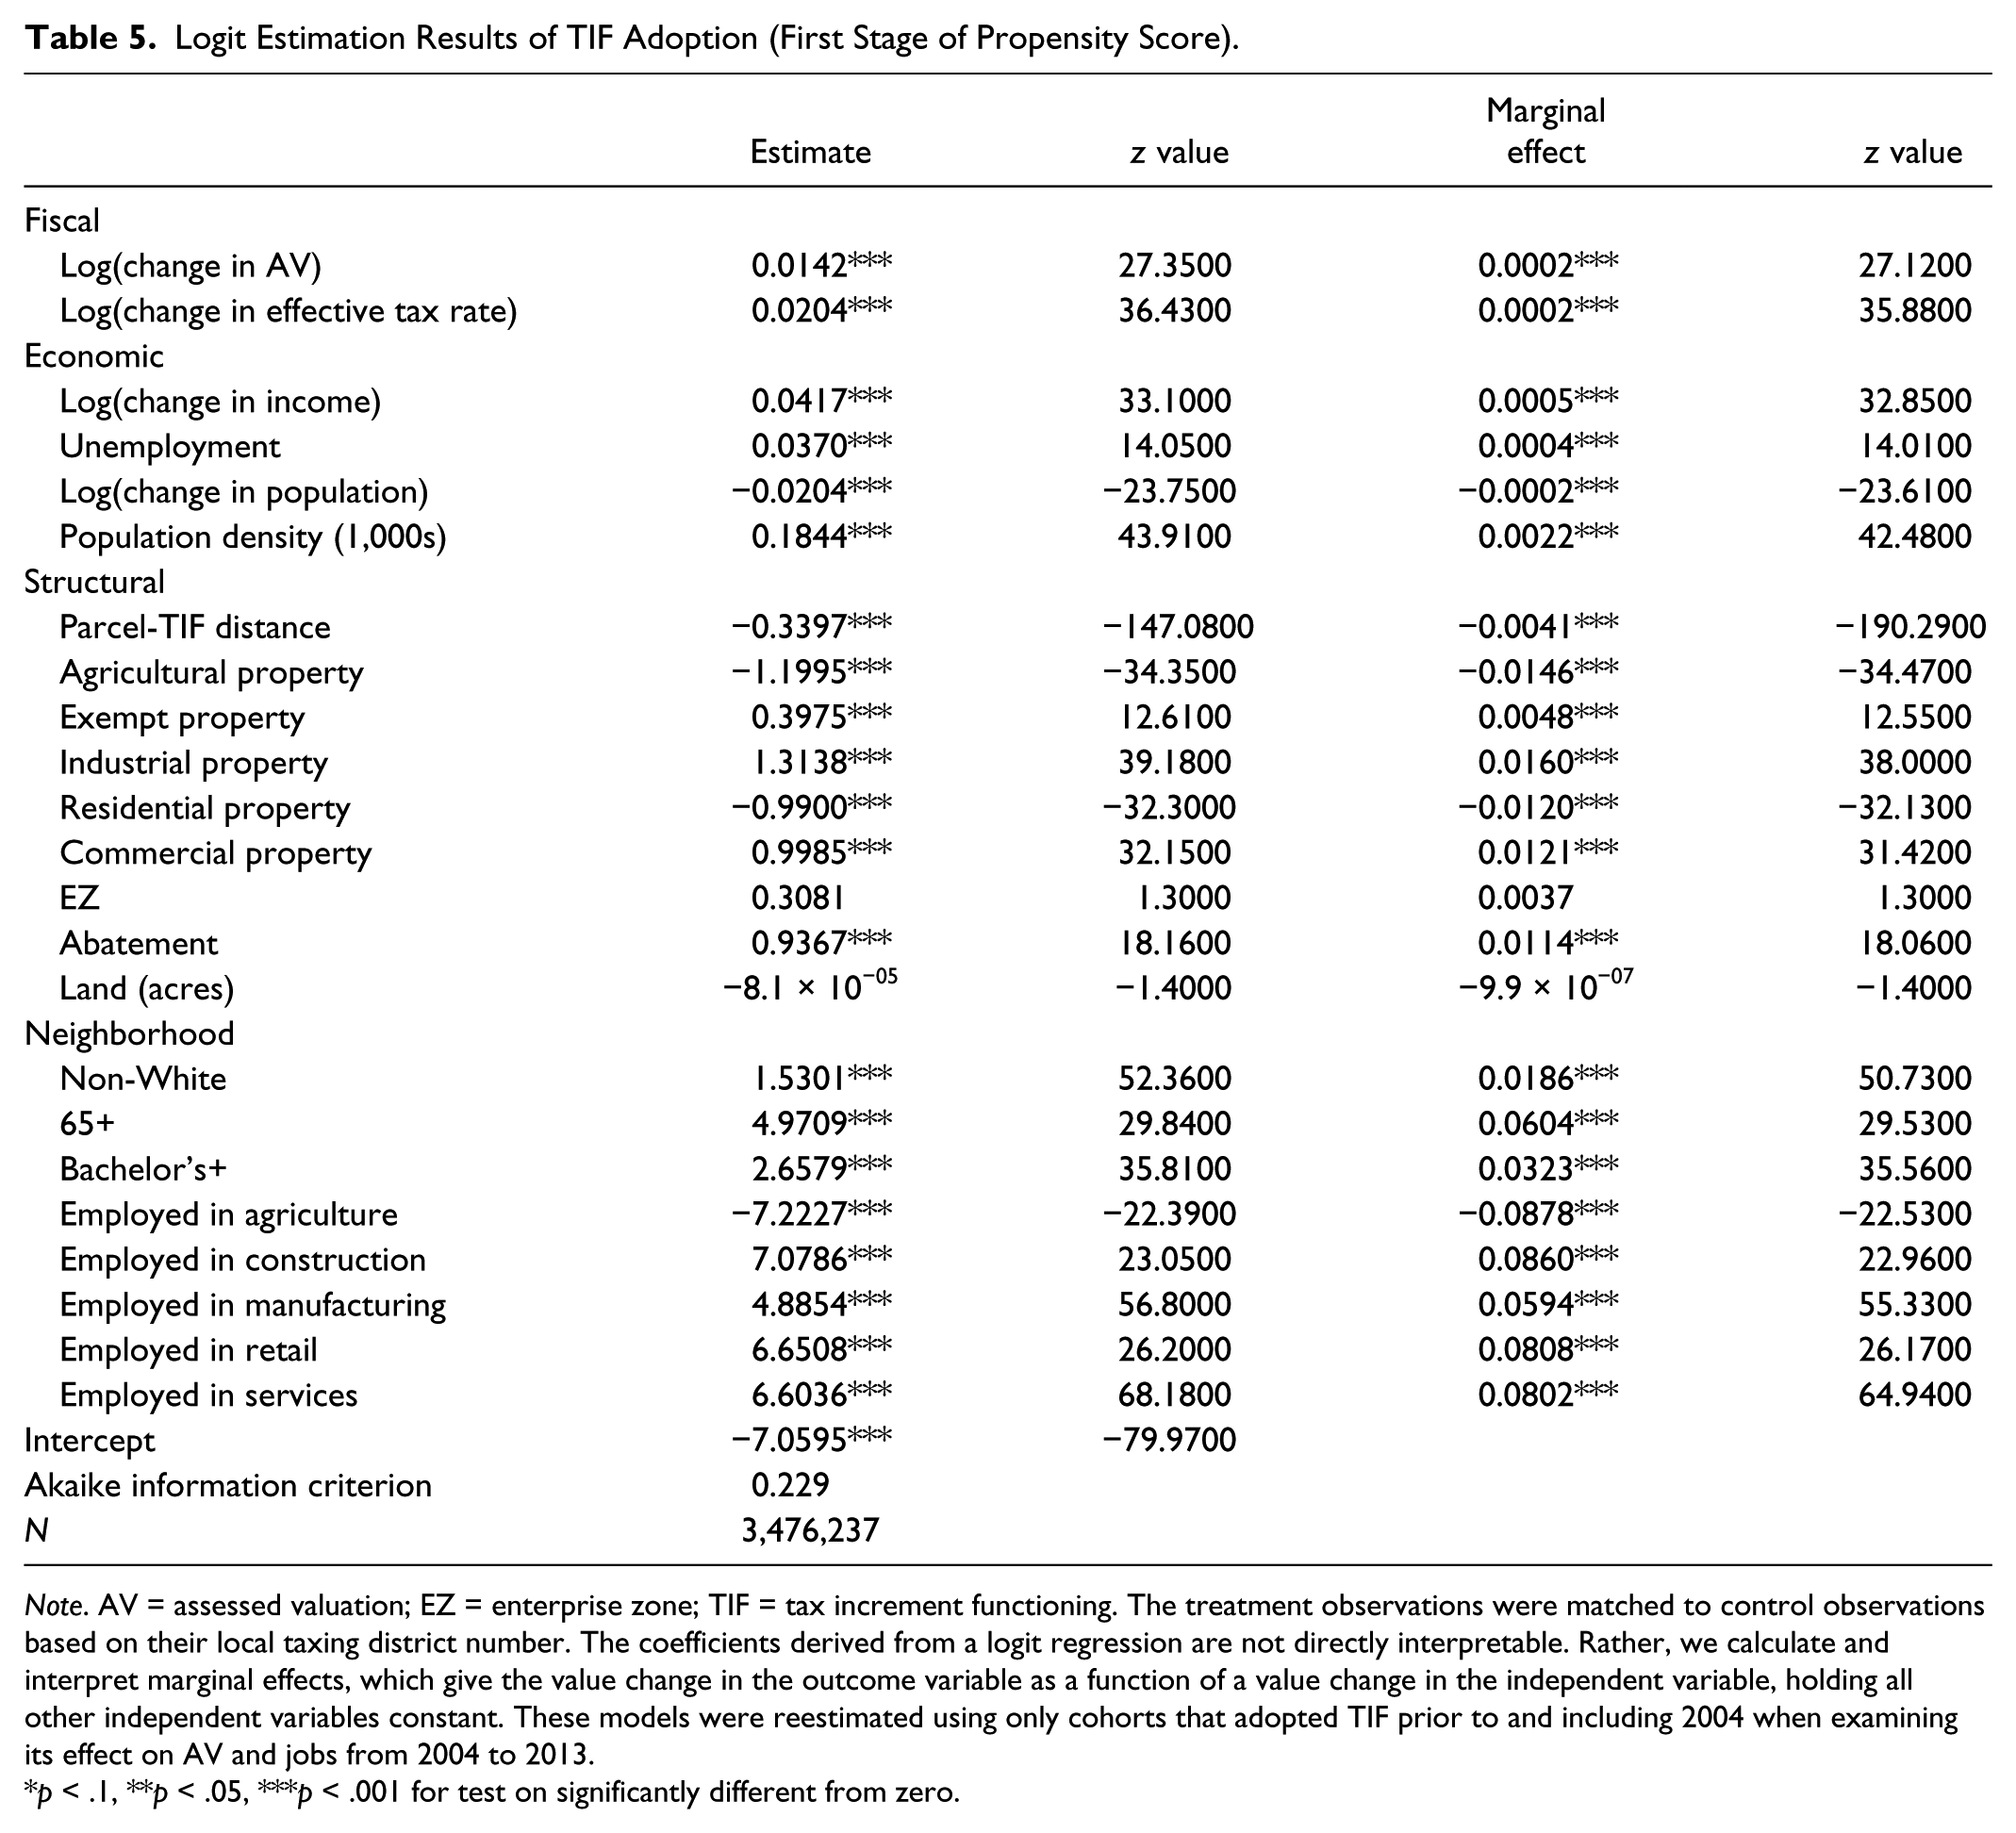
Note. AV = assessed valuation; EZ = enterprise zone; TIF = tax increment functioning. The treatment observations were matched to control observations based on their local taxing district number. The coefficients derived from a logit regression are not directly interpretable. Rather, we calculate and interpret marginal effects, which give the value change in the outcome variable as a function of a value change in the independent variable, holding all other independent variables constant. These models were reestimated using only cohorts that adopted TIF prior to and including 2004 when examining its effect on AV and jobs from 2004 to 2013.
p < .1, **p < .05, ***p < .001 for test on significantly different from zero.
In addition to these measures, the relevant literature discusses the salience of population growth as an indicator of TIF adoption; however, the direction of the impact is unclear. Growing cities may adopt TIF in anticipation of capturing any additional property tax revenue resulting from in-migration. As migrants sort themselves into localities with better schools, better amenities, or in closer proximity to family and friends, the added demand capitalizes into housing prices and thereby generates additional tax revenue. As Smith (2009) found, property value growth within a TIF area may be attributable to the capitalization of higher quality public services offered in the area. On the other hand, localities experiencing a stall in population growth or even depopulation may not consider the adoption of TIF, especially if their neighbors have not done so. Conforming to the latter hypothesis, the results suggested that a 100% increase in population growth from 2004 to 2013 decreases the likelihood of TIF adoption by 0.02 percentage points.
Generally, industrial and commercial properties are more likely to be located in TIF areas than are other property types. As such, the results suggested that industrial properties exhibit a 0.016-unit higher likelihood of TIF adoption and commercial properties exhibit a 0.012-unit higher likelihood than their counterparts. Contrastingly, agricultural and residential properties tend to exhibit a lower likelihood of TIF adoption when controlling for all other factors likely to affect TIF adoption.
These findings support the claim by Greenbaum and Landers (2014) that, in general, there appear to be minimal differences between adopters of TIF and their counterparts. Using the 2009 International City/County Management Association Economic Development Survey of Municipal and County Governments, the authors found that past and future economic performance does not differ markedly between adopters and nonadopters. This suggested that factors other than economic behavior may be influencing local governments’ propensity to adopt TIF. Of course, these factors may be politically driven and may not necessarily be observed, making the propensity score matching technique appropriate for the analysis of TIF.
Finally, we answer the question of whether a municipality’s decision to adopt TIF is spatially motivated by examining the distance between a parcel and the center of the geographically closest TIF area. The results suggested that areas whose properties are farther from a designated TIF area are less likely to adopt TIF themselves. This indicated the presence of spatial spillovers, whereby properties close to TIF areas are indirectly benefiting from growth in assessed values. As a TIF area begins to achieve financial stability through assessed value growth, its success may be disseminated to surrounding areas that may be able to reap the benefits without having to designate a TIF area of their own. Communities farther from a TIF area have less incentive to adopt TIF because they are less familiar with TIF as an economic development tool.
Table 6 presents the estimation results of the economic development outcomes using matched samples derived from the propensity score matching technique. Generally, the mean of the outcome in treated (TIF) areas minus the mean of the outcome in control (non-TIF) areas gives the treatment effect (mean difference). However, separate estimation of the outcome produced more robust results because it allowed us to control for determinants of the outcome that are not captured by the estimation of the treatment. Therefore, matched TIF and non-TIF observations were estimated using ordinary least squares, which produced unbiased estimates (comparative results derived from ordinary least squares estimation without propensity score matching may be provided on request). We used these results to calculate treatment effects (estimated coefficient times mean difference) at the average of each economic development outcome.
OLS Estimation Results of Economic Development Outcomes (Second Stage of Propensity Score).
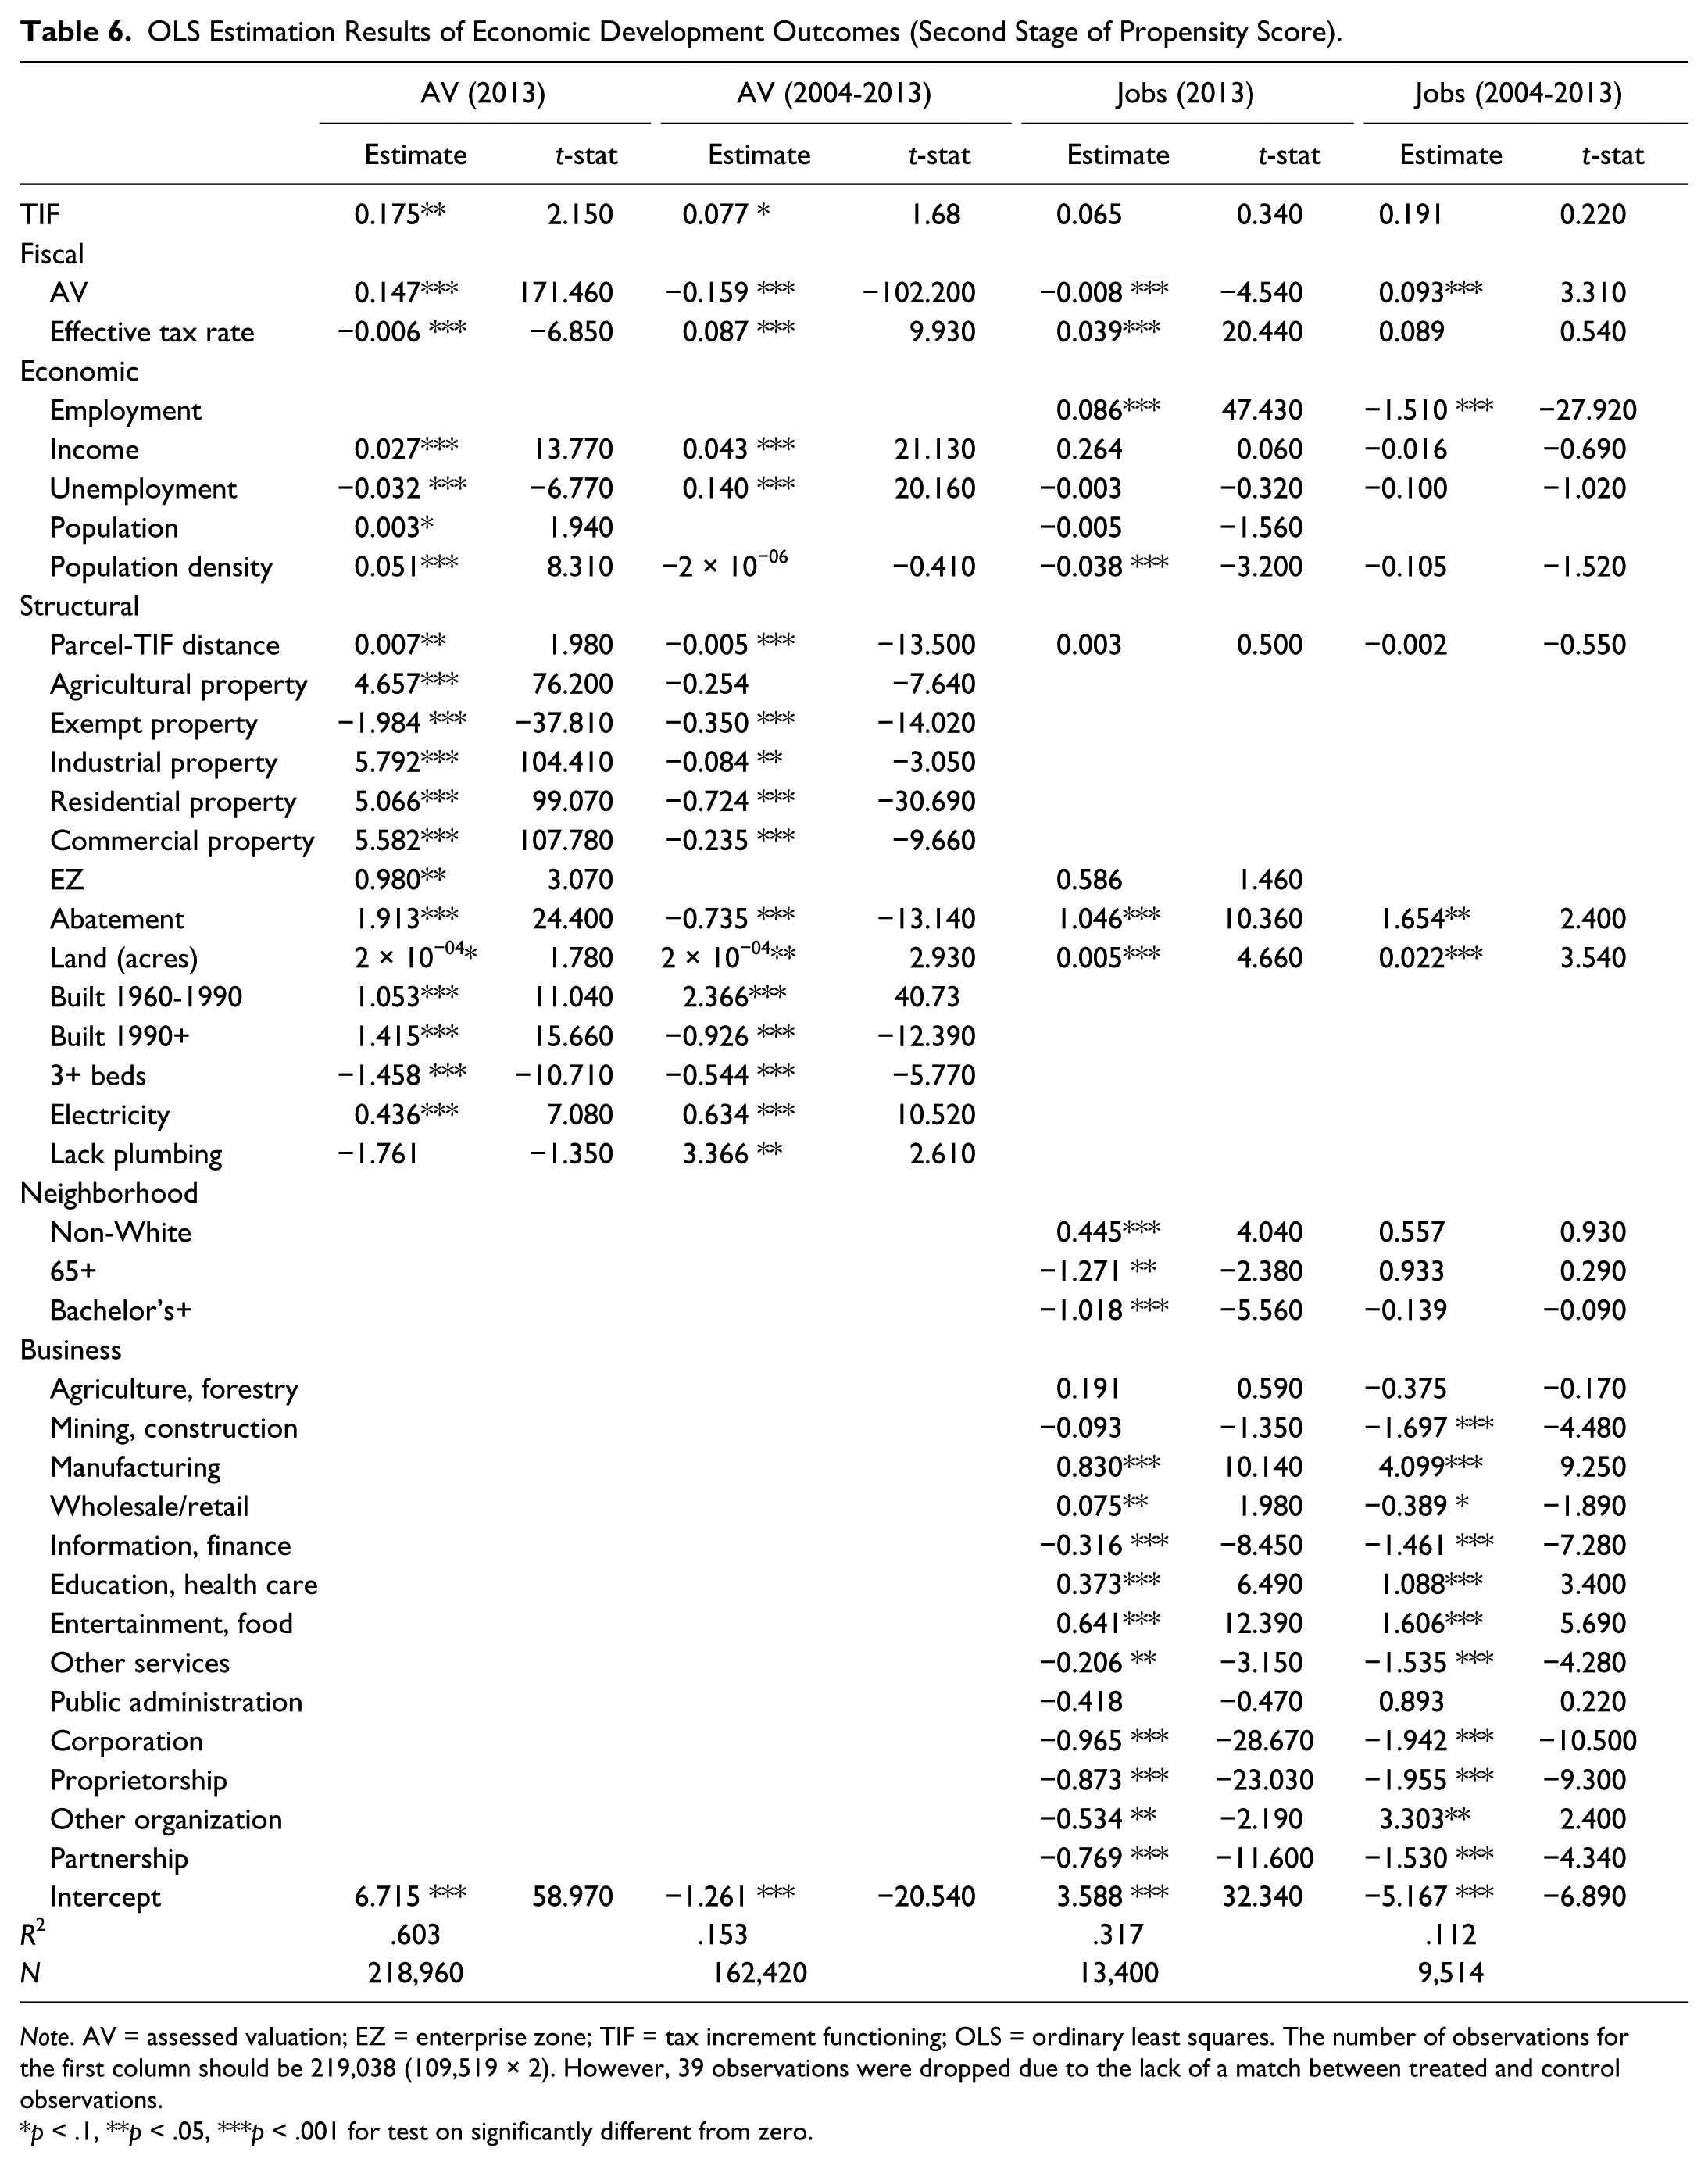
Note. AV = assessed valuation; EZ = enterprise zone; TIF = tax increment functioning; OLS = ordinary least squares. The number of observations for the first column should be 219,038 (109,519 × 2). However, 39 observations were dropped due to the lack of a match between treated and control observations.
p < .1, **p < .05, ***p < .001 for test on significantly different from zero.
Because of the largeness of the sample, we analyzed outcomes as a level at one point in time, 2013, and as a growth rate from 2004 to 2013 (where all explanatory variables are evaluated at the beginning of the period, or 2004). The growth rate is considered a difference-in-differences or change in outcome over time. A panel analysis of outcomes for each year from 2004 to 2013, which would yield nearly 40 million records, may strengthen our analysis and remains a natural direction for future research. Additionally, growth rates from later cohorts, say 2005 to 2013, may produce different results and remain for future research.
As noted in the relevant literature, the effect of TIF must be interpreted with caution due to the but-for question. While the average AV per TIF property was $181,000 greater than that of the non-TIF property in 2013 (see Table 1), we cannot say that is solely because of the presence of TIF. In other words, we cannot infer that growth would not have happened but for TIF. Since we do not know in all cases whether prior economic growth influences the adoption of TIF or whether TIF adoption spurs economic development, we controlled for characteristic differences between TIF and non-TIF areas.
The results suggested that the average TIF property tends to display AV of approximately $14,700 (see the appendix for descriptive statistics of the matched sample for all outcomes) more than non-TIF properties that exhibited very similar characteristics. This amounts to approximately 13% of the average AV per property (TIF and non-TIF) of $115,000. Hicks, Faulk, and Quirin (2015) similarly found that TIF positively influences AV growth. The authors showed that a $1 million increase in TIF AV leads to an increase of $4.43 to $5.26 per capita in AV in the county, a small but positive effect.
When analyzing the change in AV over time, we examine only cohorts that adopted TIF between 1967 (the first year of initiation) and 2004. Adding other cohorts (such as those that adopted TIF more recently) may confound the effect of TIF over time, especially since they may not have had much time to grow. Note that any properties established or built between 2004 and 2013 may not capture the effect of TIF, posing a limitation to this research.
The results suggested that over a 10-year period prior to which properties were designated in a TIF area, both TIF and their control non-TIF properties experienced positive growth. However, TIF properties tended to grow by only 0.02 percentage points more than their counterparts. This difference is economically small and suggests that, while TIF properties exhibit higher growth, they tend to grow only marginally over time compared with non-TIF properties. This finding coincides with Dardia (1998), who found that California property values inside TIF areas grow faster than their matched non-TIF pairs, but that the growth is not large enough to allow the projects to be self-financing.
As properties tend to experience naturally occurring growth in assessed values over time, it is important to examine the effect of TIF on other measures of economic development. As TIF is often intended to stimulate job creation, an examination of employment may be more appropriate. The but-for question is still valid, as growing establishments may induce the adoption of TIF and TIF adoption may lead to job creation. Recall from Table 3 that the average TIF establishment had 7.4 more employees than the average non-TIF establishment. After we controlled for characteristics that influenced TIF adoption, we found, however, that the average TIF establishment does not fare any better than its counterpart in creating jobs. Additionally, the results suggest that over a 10-year period, TIF did not statistically significantly affect job creation.
These results suggest that TIF fails to have any meaningful impact on employment or employment growth. As Beekmans, Ploegmakers, Martens, and van der Krabben (2015) surmised, local economic development policies appear to have little to no effect on redevelopment or revitalization. Instead, other criteria such as politics may be influencing an area’s decision to adopt TIF. Ploegmakers and Beckers (2015) likewise found that regeneration policies fail to effect desired improvements to deprived urban areas, bringing to question whether public monies are being allocated appropriately.
Evidence on the effectiveness of TIF on employment is more mixed than that on property values, which, while considered an economic development outcome, does not measure economic activity holistically. Of course, the larger consensus on the positive effect of TIF on property values could be reflecting the underlying mechanism of TIF, whereby property values are expected to increase for the designated area to be self-financing. To bridge the gap, we further analyzed employment.
TIF and non-TIF businesses behave and evolve differently, making the use of spatial regimes appropriate. The regime shift permits explanatory variables to vary over space (i.e., TIF/non-TIF spectrum), providing a way to combat spatial heterogeneity. As such, we interacted a dummy variable indicating whether a parcel is contained within a TIF area with all explanatory variables and the intercept (Table 7).
Estimation Results of Employment With Interaction Effects.

Note. AV = assessed valuation; EZ = enterprise zone; TIF = tax increment functioning.
p < .1, **p < .05, ***p < .001 for test on significantly different from zero.
The results suggested that after matching on the propensity score, prior employment growth and prior AV growth were statistically significantly different in TIF and non-TIF areas. The figures show no indication of both TIF and non-TIF establishments converging in job creation (Figure 2). Interestingly, high prior AV growth has the same effect on employment as low growth, implying that property value does not affect job creation. Prior employment growth does affect current employment, however. This is perhaps expected, as establishments tend to maintain administrative budgets based on past experiences.
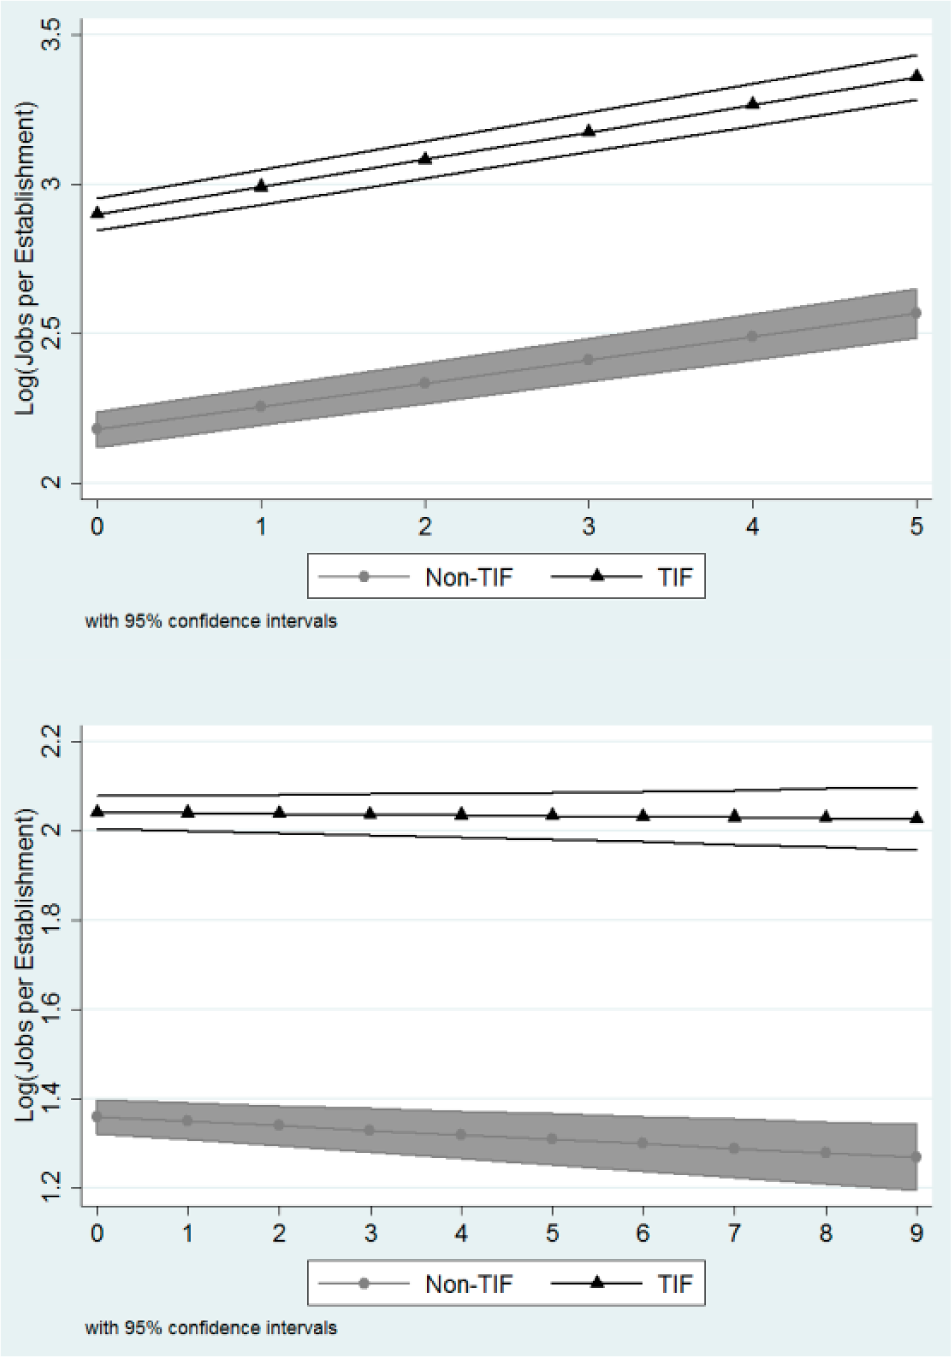
The effect of prior AV (top) and employment (bottom) growth on job creation for non-TIF and TIF establishments. AV = assessed valuation; TIF = tax increment financing.
Next, we discuss effective tax rates, which consider local income taxes, property tax caps, exemptions, and deductions. The results showed that TIF and non-TIF establishments behave differently along the entire range of effective tax rates, with TIF establishments creating more jobs than their counterparts at low and high effective tax rates alike. As Hicks et al. (2015) surmised, it may be that areas with higher effective tax rates use TIF more intensively than areas with comparatively lower tax rates.
But that does not tell the entire story. Think about city planning and population. The largest cities in Indiana obviously boast the largest populations, which create increased demand for public services such as schools, libraries, police officers, and firefighters. Thus, the net tax in these areas tends to be higher than the average, therefore leading to higher-than-average effective tax rates. At the same time, these urban and suburban areas are where economic development is already evident. In Indiana, these areas and their surrounding areas have predominantly adopted TIF. So, it makes sense that TIF establishments with higher effective tax rates tend to use TIF more intensively than their counterparts. Additionally, the results showed that the differential effects of effective tax rates in TIF versus non-TIF areas on employment tend to converge at higher rates. This suggests that non-TIF establishments begin to respond more like their counterparts at higher effective tax rates.
At the other end of the range, low effective tax rates are a function of low net taxes, which could be a function of various forms of property tax relief. It could be that TIF establishments could create more jobs than their counterparts in areas with greater property tax relief and lower effective tax rates as residents shift their income toward other goods and services. This scenario is more likely where property tax relief takes the form of exemptions and deductions. Alternatively, low net taxes could be a function of high assessed values, which provide an indication of community wealth and suggest that TIF establishments in wealthier communities tend to create more jobs than their counterparts. This coincided with the argument that TIF in Indiana is not being used to promote redevelopment within blighted areas.
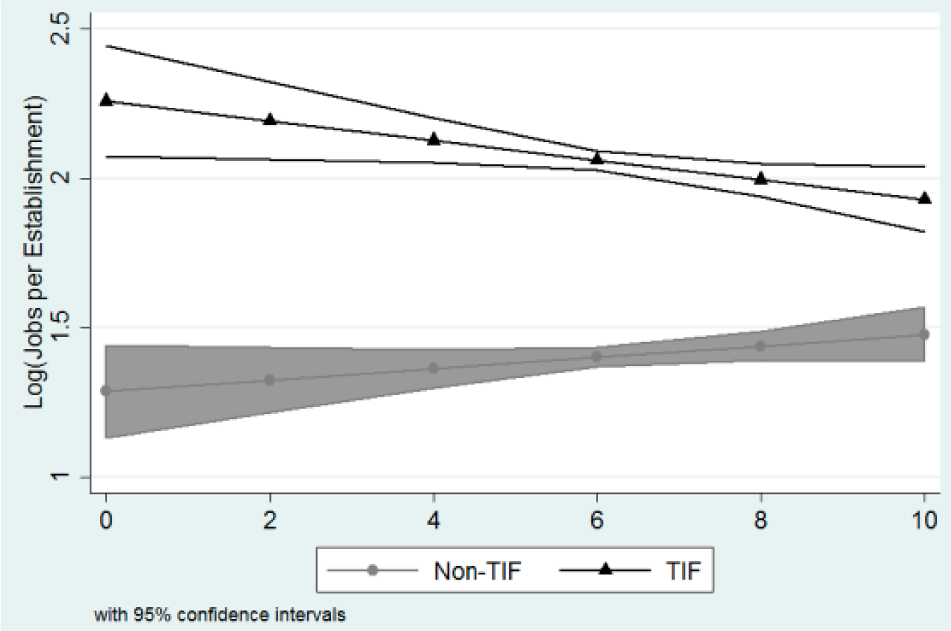
However, when compared with the effect of population density on employment, TIF establishments tend to create fewer jobs at high levels of population density than at low levels, albeit still more than non-TIF establishments. There is indeed a strong relationship between population density and employment. As Baumont, Ertur, and Le Gallo (2004) stated, urban growth has resulted in employment decentralization from the central city toward the suburbs (see also, Stansel, 2005, for an analysis of U.S. metropolitan areas and Kim, Hewings, & Nam, 2014, for an analysis of the Seoul Metropolitan Area). Additionally, McMillen (2004) cited U.S. Census data in describing the decentralization of employment for a group of Midwestern metropolitan areas. As the percentage of suburban residents working in the city declined, the percentage of city residents working in the suburbs rose, implying that employment has moved away from concentrated to less densely populated areas (Figure 3).

The effect of effective tax rate (top) and population density (bottom) growth on job creation for non-TIF and TIF establishments. Note. TIF = tax increment financing.
Based on U.S. Public Interest Research Group Education Fund’s (2011) statewide study of TIF, a majority of the states required the presence of blight (however defined in a state’s statute) and/or a but-for test for a local unit to create a TIF area. In Indiana, however, a TIF area may be established within a blighted area to promote redevelopment or within a nonblighted area to promote economic development. Still, it is worthwhile to examine whether TIF has a bigger impact in distressed areas than in nondistressed areas. Figure 4 presents estimated probabilities of the effect of TIF on employment across establishments with varying levels of unemployment. TIF establishments tend to create more jobs than non-TIF establishments at all levels of unemployment. Figure 4 also shows that TIF establishments tend to create more jobs at low levels of unemployment than at high levels of unemployment, suggesting that TIF in Indiana is not necessarily being used to promote redevelopment within blighted areas.
The effect of unemployment rate on job creation for non-TIF and TIF establishments. TIF = tax increment financing.
As motivated above, non-TIF incentives such as EZ provisions and property tax abatements tend to influence the likelihood that a TIF area will be adopted. For example, Gibson (2003) noted that TIF areas are often connected to empowerment zones, which are the federal equivalent of state-designated EZs. Similarly, using the 2009 International City/County Management Association data, Greenbaum and Landers (2014) found that 120 of the 199 municipal and county governments that offered EZs also offered TIF, and that 224 of the 359 governments that offered tax abatements also offered TIF. This provides an impetus for studying the interaction of TIF with each of these incentives. While a positive effect on either interaction would suggest a complementary relationship between TIF and a non-TIF incentive, a negative effect would suggest that the overlapping economic development incentives actually hinder economic growth. It may be that one incentive crowds out the other incentive such that neither can fully reach its potential to effect growth in economic activity.
There did not appear to be a multiplicative effect of the presence of EZs and TIF on employment. This could be because the recent literature on EZs finds that they have little to no impact on economic growth outcomes (e.g., Bondonio & Greenbaum, 2007; Elvery, 2009; Reynolds & Rohlin, 2015; Whitacre, Shideler, & Williams, 2016). The results suggested, however, that TIF works with property tax abatements, which can be used to encourage businesses to locate to or expand at a location, in incentivizing job creation. Both incentives appear to reinforce each other’s effect on employment. The results suggested that the average establishment that is included in a TIF area and claims property tax abatements tends to create more jobs than its counterparts, signifying the complementary relationship between property tax abatements and TIF, both of which are hugely popular among local governments.
It is possible that property tax abatements are offered to some firms with the intention of attracting subsequent firms. It is also possible that firms themselves identify attractive locations and request abatements (Reese, 2006). As firms begin to relocate to an area based on lower taxes, other firms may follow, thereby leading to the agglomeration of an industry (Coulson, Liu, & Villupuram, 2013). Additionally, He and Romanos (2016) found that vertical and horizontal linkages between suppliers and the market tend to influence the movement of a firm to an area with industrially similar firms. That is, sector-specific firms tend to move to areas where they can harness the resources and knowledge already available. As a result, lower tax rates may not necessarily attract firms in search of operational support (Gerritse, 2014), but may provide a breeding ground for leading firms.
Conclusion With Policy Recommendations
TIF areas are designated with the intent of spurring economic improvement within the TIF area. Our research set out to quantify the extent to which the presence of TIF influenced the assessed values and employment of TIF areas versus their counterparts. The use of TIF to promote redevelopment or spur economic development should lead to growth in assessed values and/or employment. However, prior research found inconclusive results on the effectiveness of TIF. We used propensity score matching models to estimate the statistical relationship between the presence of TIF and (1) assessed values and (2) employment. We aimed to determine whether these economic development outcomes are systematically different between TIF and non-TIF areas. We investigated this by statistically comparing TIF properties and TIF establishments and their similarly situated non-TIF counterparts.
While the descriptive statistics suggested much higher growth in AV and employment in TIF areas and thereby attribute any differences in economic growth between TIF and non-TIF areas solely to the presence of TIF, the results of the propensity score matching technique suggested otherwise. The econometric estimates of the growth rate differences are much lower, which had an important bearing on the but-for question as it relates to TIF. Our estimates suggested that most of the differences in AV and employment between TIF and non-TIF areas are not attributable to the TIF program. Rather, it is attributable to other policy, economic, and geographic factors.
As found in previous research, local officials sometimes adopt TIF to capture the property tax base of a locality that began experiencing growth prior to its designation as a TIF. In other words, they may attempt to capture growth that is already occurring. As TIF areas were originally established to reduce blight and spur economic development, their relatively small concentration in rural areas, which tend to have less wealth and prosperity than urban areas, is surprising. As rural counties tend to suffer from more outmigration and less ability to recover from economic downturn than their urban counterparts, one would expect local officials to designate more rural TIF areas.
One way to measure rurality is population density. We found that TIF establishments tended to create more jobs than non-TIF establishments at low and high levels of population density. If urban growth leads to decentralization of employment from the city center toward its suburbs, we should see establishments in low-density areas creating more jobs than in high-density areas. While we found this to be true for TIF establishments, it is not true for their counterparts. In fact, non-TIF establishments tended to create a similar number of jobs regardless of the population density of the surrounding area.
Clearly, TIF establishments have some advantage over non-TIF establishments with respect to job creation. But is it necessarily their designation? Or could it be other factors? The relationship between TIF adoption and economic development has often been modeled on the premises of the but-for question. If the opponents of TIF are correct, then rural counties that do not adopt TIF may be exempt from possible displacement of property tax revenue. However, if the proponents are correct, rural counties may be missing out on an opportunity for economic growth.
Property tax abatements can be used to encourage businesses to locate to or expand at a location, thereby incentivizing job creation. Local officials tend to adopt TIF where property tax abatements are present. As a result, the average establishment that is included in a TIF area and claims property tax abatements tends to create more jobs than its non-TIF counterparts, signifying the complementary relationship between property tax abatements and TIF, both of which are hugely popular among local governments. Just as a majority of TIF areas are located in urban counties, a majority of tax abatements are given to businesses in urban counties, bringing to question whether rural counties are generally less likely to use tax abatements and TIF to attract businesses or whether businesses, especially new businesses that are not already knowledgeable about abatements, are less likely to respond to those incentives.
Additionally, the decision to adopt TIF may be spatially motivated, whereby a local unit may adopt TIF based on its proximity to an existing TIF area. This indicates the presence of spatial spillovers, whereby properties close to TIF areas may be indirectly benefiting from growth in AV. As a TIF area begins to achieve financial stability, its success may be disseminated to surrounding areas that might reap the benefits without having to designate a TIF area of their own. Communities farther from a TIF area have less incentive to adopt TIF because they are less familiar with TIF as an economic development tool. Rural counties tend to be farther from a TIF area, meaning they may not be able to reap any positive spillovers from other TIF areas.
As noted in previous research, the higher frequency of TIF in urban areas could be a function of the “rich getting richer.” While the premise of TIF lies in the redevelopment of blighted areas, a majority of Indiana TIF areas have been created for the broader purpose of economic development. Local commissions must rigorously defend their decisions to designate an area as a TIF before getting approval from a hearing body. But, many rural areas lag behind urban areas in their resources and administrative capacity, making them susceptible to further inequities.
Footnotes
Appendix
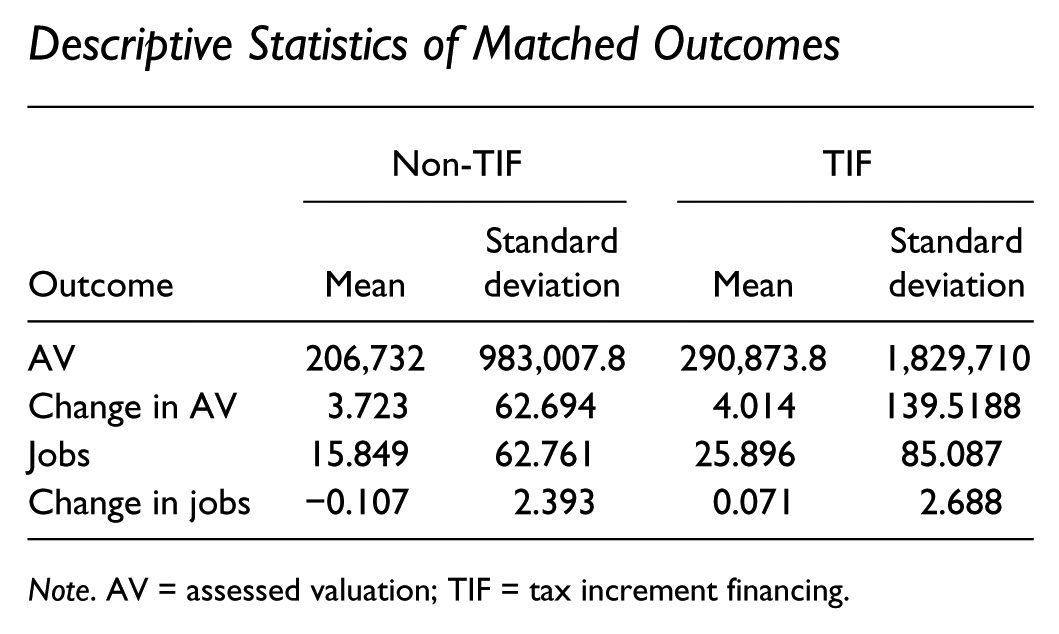
Descriptive Statistics of Matched Outcomes
| Outcome | Non-TIF |
TIF |
||
|---|---|---|---|---|
| Mean | Standard deviation | Mean | Standard deviation | |
| AV | 206,732 | 983,007.8 | 290,873.8 | 1,829,710 |
| Change in AV | 3.723 | 62.694 | 4.014 | 139.5188 |
| Jobs | 15.849 | 62.761 | 25.896 | 85.087 |
| Change in jobs | −0.107 | 2.393 | 0.071 | 2.688 |
Note. AV = assessed valuation; TIF = tax increment financing.
Declaration of Conflicting Interests
The authors declared no potential conflicts of interest with respect to the research, authorship, and/or publication of this article.
Funding
The authors received no financial support for the research, authorship, and/or publication of this article.