
Abstract
Introduction
Obesity levels have risen in all age groups in industrialised countries, but the prevalence of obesity is particularly high in older adults (Witham & Avenell, 2010). According to the National Heart Forum, for example, the proportion of people who are obese is rising in the United Kingdom whereas the proportion of normal weight individuals in the United Kingdom is falling, and the percentage of those who are overweight remains relatively steady (Brown, Byatt, Marsh, & McPherson, 2010). Much of the data on obesity is based on body mass index (BMI) but when considering obesity especially in older people, waist circumference (WC), a measure of abdominal obesity, may also be relevant (Visscher et al., 2001). WC may have a role in physical health outcomes that is partially independent of BMI (Testa et al., 2010), and a large waist is a strong anthropometric predictor of vascular events and diabetes (Haslam, Sattar, & Lean, 2006). In 2008, 44% of English women and 34% of men had a high-risk WC and the prevalence increased with age in both sexes (NHS Information Centre, 2008).
Although much of the research on the determinants of obesity has focused on behavioral (e.g., dietary patterns, physical activity) and biological factors (e.g., metabolic rate; Du, & Feskens, 2010), more recently, aspects of the social environment that may shape these obesity-related behaviors and biology have gained attention (Ali & Lindström, 2006; Jenkins & Fultz, 2008; Kamiya, Whelan, Timonen, & Kenny, 2010; Poortinga, 2006). One hypothesis is that social participation, that is, taking part in social networks, groups and associations, and cultural and other social and civic activities (Kamiya et al., 2010), may help in maintaining a healthy weight by favourably influencing behavioural choices, coping resources, and even the functioning of biological regulatory systems (Everson-Rose & Lewis, 2005; Gruenewald, Seeman, Ryff, Karlamangla, & Singer, 2006). Although social participation has been suggested to decrease as people age (Baum et al., 2000), participation in socially productive activities is likely to be most salient in later life when people are less involved with the activities of paid employment and child rearing (McMunn, Nazroo, Wahrendorf, Breeze, & Zaninotto, 2009). Therefore, it can be hypothesized that social participation is particularly beneficial in terms of maintaining healthy WC in cohorts of older adults.
Previous research has shown that regular participation in social and productive activities may be beneficial to older people’s health (Lennartsson & Silverstein, 2001; Mendes de Leon, Glass, & Berkman, 2003), but few studies have specifically examined effects of social participation on healthy body weight and the existing evidence is inconsistent including both positive (Ali & Lindström, 2006; Jenkins & Fultz, 2008; Kamiya et al., 2010; Veenstra et al., 2005) and null findings (Greiner, Li, Kawachi, Hunt, & Ahluwalia, 2004; Moore, Daniel, Paquet, Dubé, & Gauvin, 2009; Poortinga, 2006). Furthermore, in one study, greater social participation was associated with higher BMI (Zettel-Watson & Britton, 2008). Several factors related to study design and measurement may have contributed to these mixed findings. First, previous evidence comes mainly from cross-sectional studies but longitudinal research is needed to establish the temporal order between social participation and body weight. It would also be important to control for underlying chronic illnesses that may lead to weight loss or low body weight, and decreased participation in social activities. Second, many of the previous studies used self-reported height and weight, rather than clinical anthropometric measurements. In fact, with the exception of the study by Moore and colleagues (Moore et al., 2009), previous studies have not assessed WC despite it being a useful indicator of fat mass especially in older age groups (Testa et al., 2010). Third, earlier studies have not differentiated between those with recommended WC at baseline and those with large WC. It has been shown that obesity spreads through social networks (Christakis & Fowler, 2007), and the effect of social participation may, therefore, depend on the prevailing health-related norms of the group the person is interacting with; these norms can be either health promoting or detrimental (Kawachi & Berkman, 2001). It is possible that people with high levels of WC are more often members of groups consisting mainly of overweight people whereas the reverse could be true for those with WC within the recommended range.
To overcome these limitations, the present study used longitudinal data from the English Longitudinal Study of Ageing (ELSA) to examine the association between different types of social participation at baseline and maintaining or achieving recommended WC levels at follow-up in community-dwelling older adults.
Method
Design and Participants
The ELSA is a panel study of people living in England aged 50+ years. The ELSA sample was drawn from households who participated in the Health Survey for England (HSE; an annual, nationally representative cross-sectional household survey) in 1998, 1999, or 2001 and who were born before March, 1952. Individuals were classified as core ELSA sample members at Wave 1 if they were included in the HSE and were aged 50 on April 1, 2002 when the first Wave of ELSA took place. ELSA participants are followed up every 2 years. Wave 2 (2004-2005) was the first wave that included a nurse visit and this was repeated in Wave 4 (2008-2009). Only participants with an interview in person were eligible for a nurse visit. Those who dropped out from Wave 1 to Wave 2 were more likely to be of lower SES, to have a longstanding limiting illness, and more likely to be non-White than the respondents to Wave 2 (Scholes, Taylor, Cheshire, Cox, & Lessof, 2008). More detail on sampling and response rates for the ELSA are given elsewhere (Banks et al., 2010).
The present analysis focused on data collected in Waves 2 (baseline) and 4 (2008-2009; follow-up). A total of 7,666 sample members took part in Wave 2, when WC was first measured. The 2,671 participants with missing data on WC at follow-up (i.e., at Wave 4) because they had died, dropped out, or did not have a recorded WC measurement at Wave 4, were excluded from the analysis. We additionally excluded 715 participants who had incomplete data in terms of social participation and/or covariates, leaving a total of 4,280 participants in the final analytic sample (2,373 women and 1,907 men). Compared to the included population, participants in the total baseline population (Wave 2 nurse data) were slightly older (mean age 64.9 in the final analytic sample vs. 66.7 in the baseline population) and had a lower mean WC (101.1 vs. 98.2 in men and 90.5 vs. 87.8 for women).
All participants provided informed consent separately for the interview and nurse’s visit. Data were accessed through the Economic and Social Data Service. Ethical approval for the ELSA study was obtained from the London Multicentre Research and Ethics Committee.
Social Participation
Social participation was measured by asking respondents to indicate whether they were members of any type of organizations, clubs, or societies. The types of the listed activities included the following: (a) political party, trade union, or environmental group; (b) tenants’ or residents’ group or Neighbourhood Watch; (c) church or other religious group; (d) charitable association; (e) education, arts or music group, or evening class; (f) social club; and (g) sports group, gym, or exercise class; (h) other. Because of the diverse nature of the eighth category and because of the strong relationship between leisure-time physical activity and body weight, in the present analysis, only participation in the first six categories of activities was examined.
Waist Circumference
WC, measured during the nurse visit at baseline and follow-up, was defined as the midpoint between the lower rib and the upper margin of the iliac crest. Two measurements were taken using a tape with an insertion buckle at one end. Circumference was recorded to the nearest even millimeter and if the two measurements differed by >3 cm, then a third was taken. The mean values of the two valid measurements (the two that were the closest to each other, if there were three measurements) used in the analysis ranged between 61.3 and 171.6 cm at Wave 2. Cut-off points for recommended WC specific to older adults were employed; ≤ 97cm for men and ≤ 88 cm for women (Heim et al., 2010).
Covariates
Several factors which have been associated with obesity or body weight (Kaplan, Huguet, Newsom, McFarland, & Lindsay, 2003; Kimokoti et al., 2010) were included in the analyses. Covariates were measured at Wave 2. Data on sex, age, ethnicity (White vs. non-White), marital status, and socioeconomic status of the participants were obtained in the interview. Marital status was dichotomized into being married or living with a partner versus being single, separated, divorced, or widowed. Socioeconomic status (SES) was classified according to household wealth quintiles. Total nonpension household wealth was defined as the sum of financial worth, physical worth (such as business wealth, land, or jewelry), and housing wealth after deducting debts; it represents a better measure of the long-term economic status of older people than income (Demakakos, Nazroo, Breeze, & Marmot, 2008).
Participants were asked if they had ever smoked. Individuals who responded in the affirmative were asked whether or not they smoked at present. Participants who responded “yes” to both questions were classified as current smokers. This measure has been validated against saliva cotinine levels in the Health Survey for England (Erens & Primatesta, 2001). The measure of physical activity was adapted from measures developed for the Whitehall II Study (Singh-Manoux, Hillsdon, Brunner, & Marmot, 2005). Participants were asked how often they took part in vigorous, moderate, or mild physical activity. Examples of each type of activity were provided. Participants were categorized as having high physical activity, moderate physical activity, low physical activity, or being sedentary.
Participants were asked if they had one or more illnesses, disabilities, or infirmities that had affected or could affect them for a prolonged period. Those who replied in the affirmative were asked if this condition limited their activities. Participants who replied “yes” to the second question were classified as suffering from a limiting long-standing illness.
The eight-item shortened version of the Centre for Epidemiologic Study Depression Scale (CES-D) (Radloff, 1977) with yes/no response options was used to estimate the prevalence of depressive symptoms. In line with previous studies, those who reported four or more symptoms were classified as having depression (Hamer, Molloy, de Oliveira, & Demakakos, 2009).
Statistical Analysis
Sex-stratified age-adjusted ANOVA models were applied to assess differences in means of WC at Wave 2 (baseline) by covariates. In prospective design, logistic regression was applied to determine whether social participation at baseline predicted maintaining or achieving WC in the recommended range at follow-up. Sex-stratified models adjusted for age, ethnicity, marital status, baseline WC, total wealth, longstanding limiting illness, depressive symptoms, smoking status, and physical activity.
The associations were analysed separately for those participants who were initially (at Wave 2) in the recommended WC category and for those who were initially in the larger waist category. In this way, the analyses investigated both maintaining recommended WC and achieving recommended WC.
As WC at Wave 4 was relatively skewed (skew = .544; SE = 0.056 and kurtosis = 1.244; SE = 112 for men; and skew = .494; SE = 0.05 and kurtosis = .382; SE = 0.100 for women, respectively), it was not considered to be appropriate for analysis as a continuous variable. Instead, we performed additional analyses using WC deciles. WC at Wave 2 and WC at Wave 4 were first divided into deciles (separately for women and men) and the Wave 2 WC deciles were then subtracted from the Wave 4 WC deciles to assess change in WC. Again, the analyses were stratified by Wave 2 WC groups (i.e., those with a recommended level of WC versus those with a high WC).
All analyses were carried out using PASW Statistics 18 (SPSS Inc, Chicago, Illinois).
Results
The mean age of the 4,280 participants (2,373 women) at baseline was 64.9 years (SD = 8.67; range 52 to 90+). Table 1 shows baseline characteristics of the participants and the age-adjusted means of WC at baseline by sex. The mean WC was above the recommended range in both men and women; 101.1 cm (SD = 10.7; range 68.6 to 143.7) in men and 90.5 cm (SD = 12.3; range 61.3 to 47.8) in women. Lower SES (measured as total wealth), having a limiting longstanding illness, reporting depressive symptoms and low physical activity were associated with a higher WC (all p values ≤ .05). The most common types of social participation among men were attending social clubs (23.6% of the participants) and tenants’ groups or Neighbourhood Watch (23.6%). Among women, the most common types of social participation were church or other religious group (27.5%) and charitable associations (21.3%). In men there were no significant differences in age-adjusted means of baseline WC between different types of participation. In women, participation in other types of organizations than charitable associations and social clubs was associated with a slightly lower age-adjusted mean WC at baseline.
Characteristics of Included Participants and Age-Adjusted Means of Waist Circumference (WC) by Study Variables at Baseline (Wave 2)

Note. Only participants with no missing data in any of the variables were included. SE, standard error. p values from ANOVA models.
Table 2 displays the results from logistic regression analyses of the associations between social participation at baseline and the maintaining recommended WC at follow-up. After adjustment for age, ethnicity, marital status, baseline WC, total household wealth, long-term limiting illness, depression, smoking, and physical activity, participation in education, arts or music groups, or evening classes (odds ratio = 2.48, 95% confidence interval = [1.35, 4.57]), and in charitable associations (odds ratio = 1.95, 95% confidence interval = [1.19, 3.21]) were associated with an increased likelihood of maintaining recommended WC in those men whose WC was initially in the recommended range. In contrast, in those with initially large WC, social participation was not associated with achieving recommended levels of WC at follow-up. Table 2 also shows that there were no prospective associations between social participation and maintaining WC in the recommended range in women.
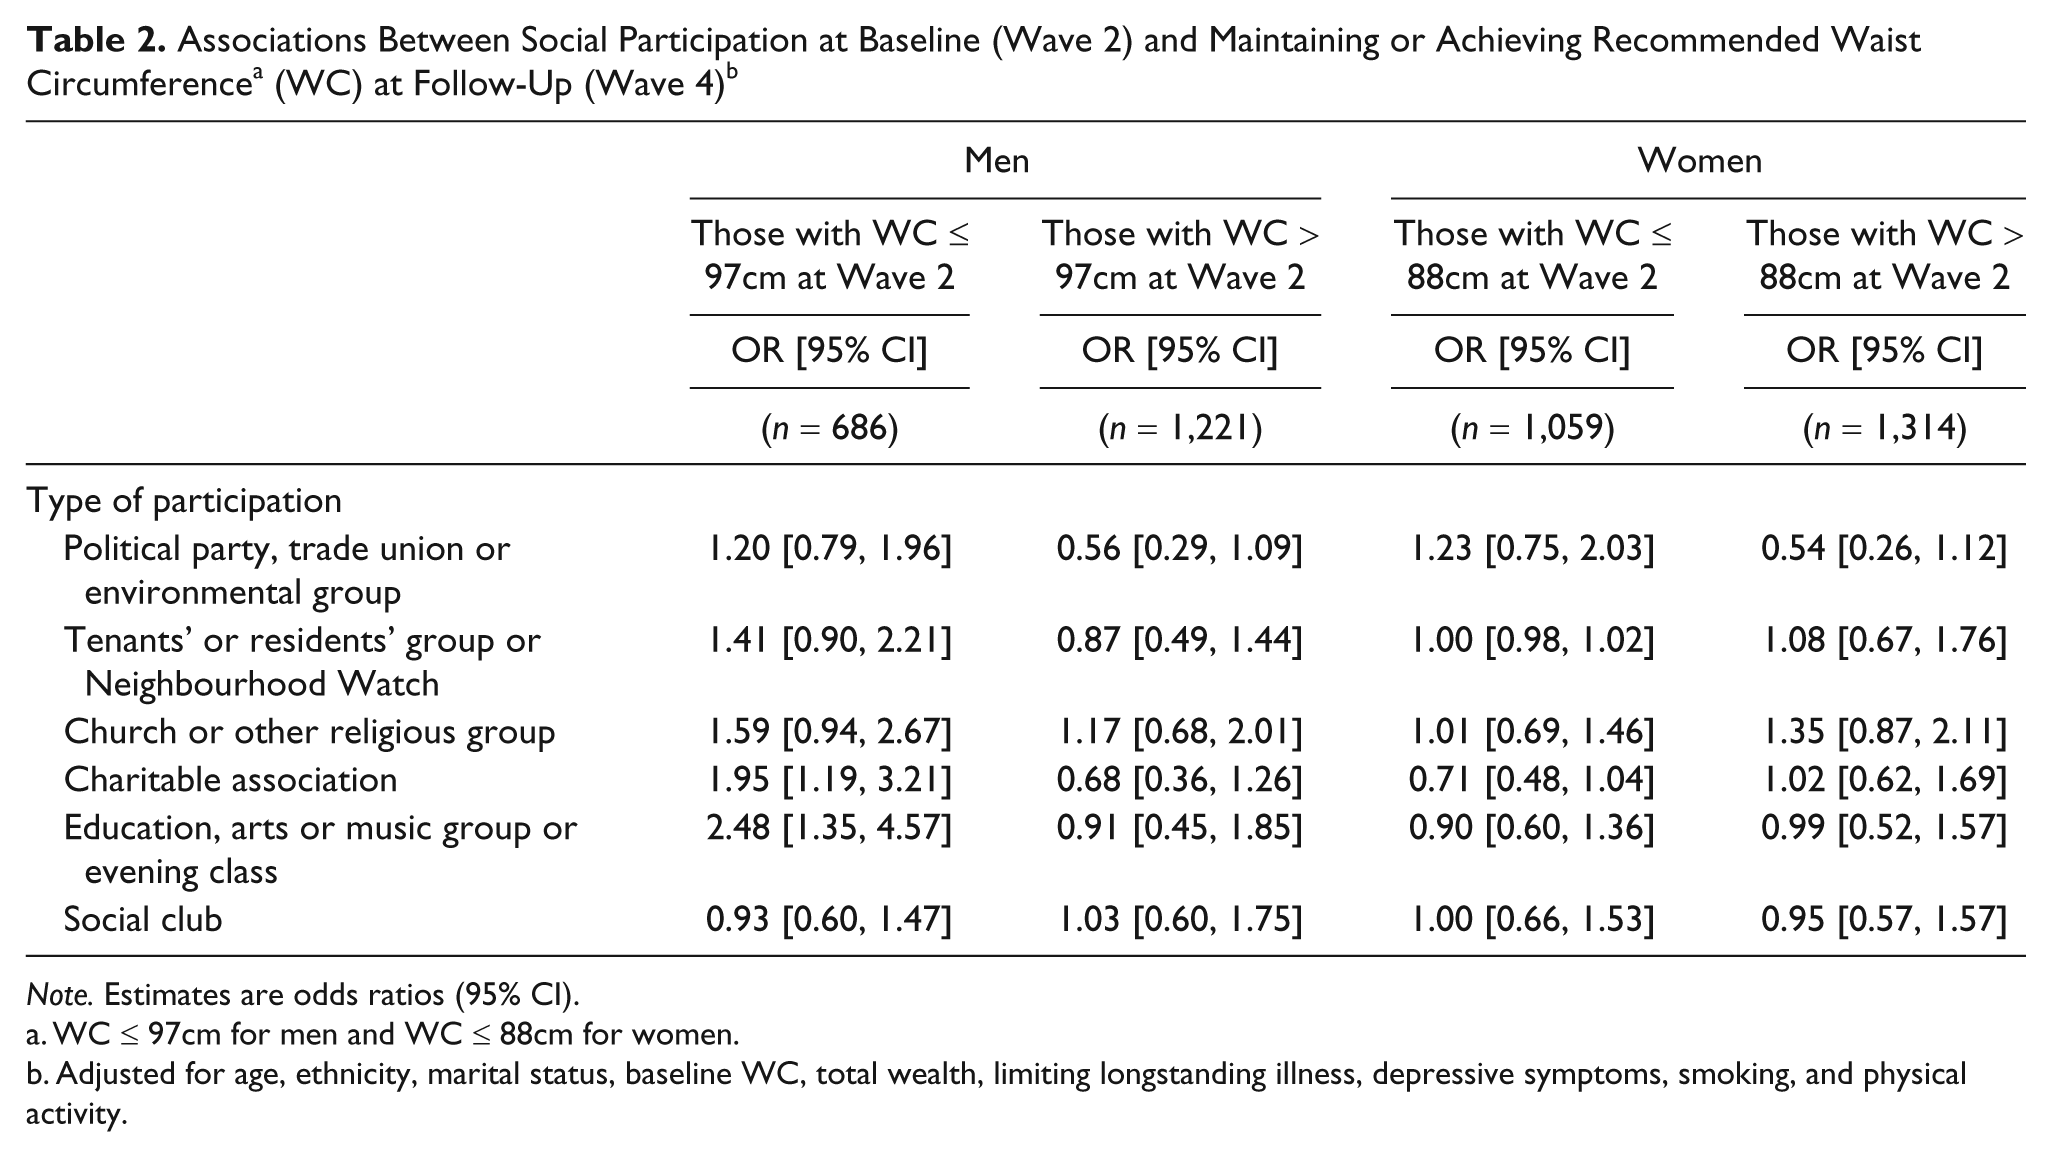
Note. Estimates are odds ratios (95% CI).
WC ≤ 97cm for men and WC ≤ 88cm for women.
Adjusted for age, ethnicity, marital status, baseline WC, total wealth, limiting longstanding illness, depressive symptoms, smoking, and physical activity.
Table 3 presents the results from linear regression analyses using change in WC deciles as an outcome. The results were very similar to those obtained with a binary measurement of WC as an outcome. After adjustment for age, ethnicity, marital status, total household wealth, long-term limiting illness, depression, smoking, and physical activity, participation in education, arts or music groups, or evening classes (β = –.103, p = .008), in charitable associations (β = –.091, p = .02), and in tenants’ or residents’ groups or Neighbourhood Watch (β = –.088, p = .02) were all negatively associated with a WC increase during the follow-up in those men whose WC was initially in the recommended range. There were no associations between social participation and WC increase in women or in those men with initially large WC.
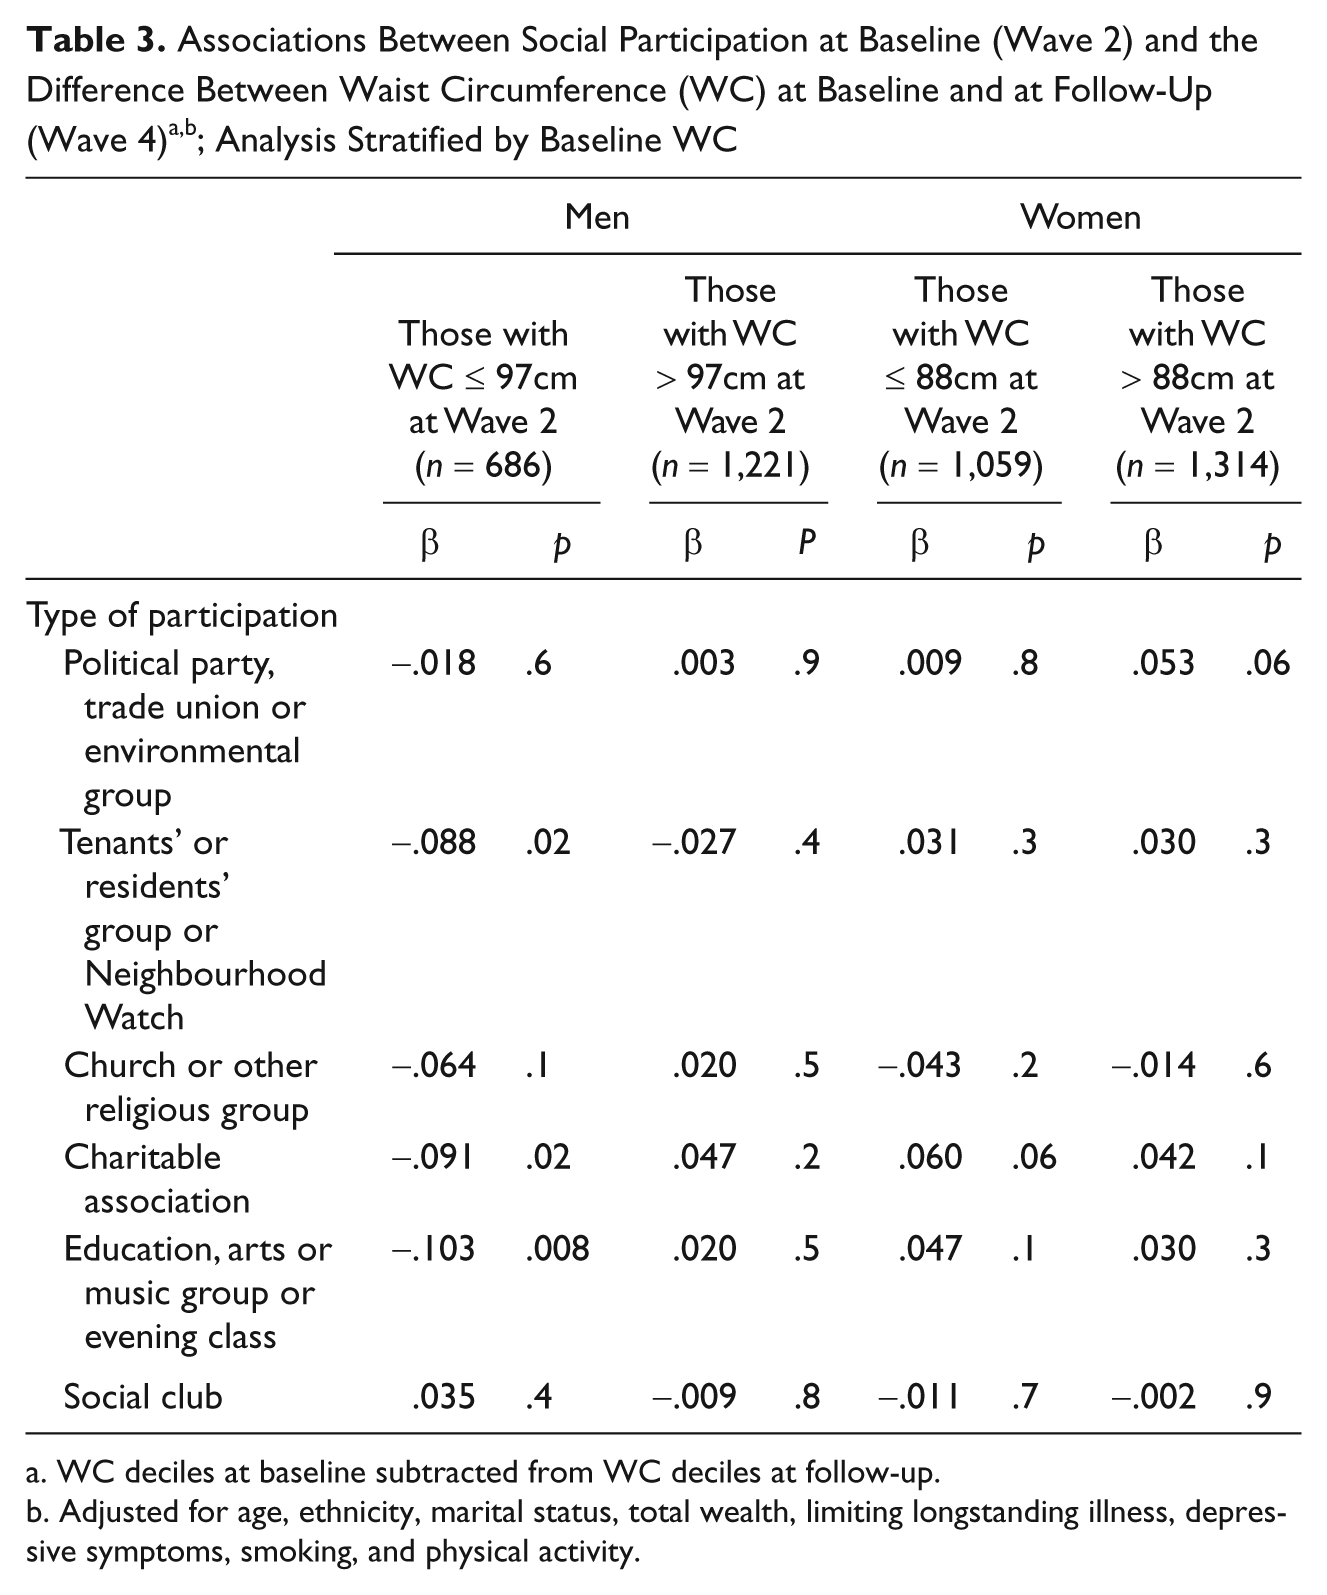
WC deciles at baseline subtracted from WC deciles at follow-up.
Adjusted for age, ethnicity, marital status, total wealth, limiting longstanding illness, depressive symptoms, smoking, and physical activity.
Discussion
In this prospective 4-year follow-up study of people aged 52+ years, social participation in education, arts or music groups, or evening classes, and in charitable associations was associated with maintaining recommended WC only among men who were at recommended WC levels at baseline. In contrast, social participation was not associated with achieving a recommended WC at follow-up among those men who initially had a large waist. For women, there was no clear evidence to suggest that social participation is associated with maintaining or achieving recommended WC.
There are several plausible pathways by which social participation can exert their influence on WC. First, social participation may alleviate stress and affect WC through physiologic pathways including hypothalamic-pituitary-adrenal (HPA) axis response, immune system function, and allostatic load (Berkman, Glass, Brissette, & Seeman, 2000). It has been further proposed, for example, that cultural stimulation, which can derive from participation in arts and cultural associations, may have specific effects on physical and mental health, possibly via psychoneuroimmunological mechanisms (Johansson, Konlaan, & Bygren, 2001). Indeed, earlier research has shown that attendance at certain kinds of cultural events (e.g., visiting the cinema, concerts, museums, or art exhibitions) is associated with better health and longevity (Konlaan, Bygren, & Johansson, 2000).
Second, social participation may also improve psychological well-being (Kiely & Flacker, 2003). Meaningful social roles in society can promote a sense of self-efficacy and self-esteem, and enhance social support; these factors have been linked to important health outcomes in later life (Glass, Mendes de Leon, Marottoli, & Berkman, 1999). Social participation can define and reinforce meaningful social roles which in turn, may provide a sense of value, attachment and belonging (Berkman et al., 2000). In contrast, low participation may indicate loneliness and social isolation, which have both been linked to depression (Cacioppo, Hawkley, & Thisted, 2010) and adverse health behaviors, such as low physical activity (Hawkley, Thisted, & Cacioppo, 2009). However, in the present study an adjustment for physical activity had little effect on estimates, suggesting that the association between social participation and recommended WC in men whose WC levels were initially in the recommended range may primarily be explained by other mechanisms.
Third, social participation may promote more rapid diffusion of health information, increase access to local services and amenities, and promote maintenance of healthy behavioral norms where they exist (Kawachi & Berkman, 2001), such as norms of healthy eating and physical activity. It is possible that healthy behavioral norms commonly prevail in charitable associations, and in education, arts or music groups, and evening classes. This may be connected to the fact that people from higher educational background and from higher SES groups more commonly participate in these types of activities.
In this study, there was no prospective association between social participation and maintaining recommended WC in women. However, it has been suggested that women have higher participation in informal social activities such as visiting/visited by family and friends (Baum et al., 2000). It is possible that in terms of maintaining healthy weight, these informal networks which were not examined in this study, are more important for women.
Strengths and Limitations
The nationally representative nature of the ELSA study and its rigorous design strengthen the present study. The large data allowed sufficient statistical power to examine associations separately for men and women and to make comparisons between those with WC initially in the recommended range and those with initially large WC. Moreover, unlike earlier studies which have often measured only self-reported height and weight, this study used objectively measured WC as an outcome. In addition, the study differentiates between different forms of participation to assess the specific influence of each form on maintaining or achieving recommended WC levels. In terms of health promotion, this may provide greater precision in thinking about how best to intervene on social participation to influence obesity rates.
However, the present results should be considered in light of several limitations; some of which are unavoidable in all long-term prospective studies on health in older adults and some of which are more specific to the present study. First, even though the sample is otherwise nationally representative, with regards to the ethnic composition, the ELSA population is very homogeneous. There are two main reasons why this could be so. First, ethnic minorities in England tend to be younger, reflecting the timing of and the age at past migration. In addition, people who do not speak English were excluded from the HSE sample and, as a result, are virtually absent from ELSA.
Second, a number of individuals died between the two study Waves or were lost to follow-up. The issue of selective survival and selective attrition is common in longitudinal studies in older adults and may lead to the under or overestimation of the true association. However, any differences between the baseline population and the final analytic sample were small, suggesting that selective retention is an unlikely source of major bias in the present study.
Third, the current measure of social participation was relatively crude as it only assessed whether the participant was a member of a particular type of organization or not. Therefore, the frequency, intensity, and level of participation in each type of activity are not known. Moreover, only the types of organizations the participants were members of but not the actual number of organizations was measured. For example, it is possible that some participants were members of several different charitable associations or educational groups and this was not reflected in the measure.
Fourth, the measured social activities vary in the extent to which they are more social or physical in nature. Many of the activities that were assessed also potentially involve some physical activity; it is thus possible that physical activity component partially accounts for the association between social participation and WC (Verkleij, Scheele, & van der Wouden, 2009). However, the association between participation in charitable associations, and education, arts or music groups, or evening classes, and recommended WC in men remained robust after adjustment for physical activity although the possibility of measurement error remains when using self-reported physical activity measures.
Fifth, the analyses were controlled for the possible confounding and mediating effects of baseline WC, health behaviors, depression, longstanding limiting illness, and sociodemographic variables; however, unmeasured factors such as diet or genetic differences might have influenced the results. Furthermore, any study of the association between social participation and weight management is also complicated by the possibility of reciprocal causation, that is, a large WC may also reduce social participation. Obesity often carries a stigma that negatively affects social, emotional, and psychological functioning (Puhl & Heuer, 2010). There is some evidence that this obesity stigma and negative self-concepts related to physical appearance may work as a leisure constraint (Lewis & Van Puymhroeck, 2008). In addition, morbidly obese individuals can be limited in their physical capability to participate in activities. In particular, obesity has been found to be a risk factor for reporting homebound status among community-dwelling older persons (Jensen et al., 2006). Reverse causality cannot be fully discounted. However, taking into account baseline WC provides evidence that the results are not fully explained by reverse causality.
Implications
In the United Kingdom, the age group with the highest proportion of overweight or obese people is the group aged 55 to 74 (Brown et al., 2010). In general, participants most readily recruited to traditional exercise interventions tend to be highly motivated, healthier, and from higher SES groups, and adherence to standard exercise programs quickly drops off (Fried et al., 2004). The model of individual-level intervention focusing on advocating healthy diet and exercise has had limited success (Hill, Wyatt, Reed, Peters, 2003). New methods are needed to reach older adults—especially those who might not otherwise engage in health-promotion programs (Fried et al., 2004). The present results suggest that aspects of social participation may be a potential additional component to be integrated in interventions designed to prevent weight gain in older men with WC in the recommended range. However, the results should be interpreted with caution as the role of social participation for weight loss and among women is unclear and not proven yet and the observed associations may not be causal in nature. Moreover, it is important to keep in mind that social participation works in the wider context of health-related circumstances, such as income inequality, which are not easily amenable (Pickett, Kelly, Brunner, Lobstein, & Wilkinson, 2005).
Footnotes
The data were made available through the UK Data Archive. ELSA was developed by a team of researchers based at University College of London, the National Centre for Social Research and the Institute for Fiscal Studies. The data were collected by the National Centre for Social Research. The developers and funders of ELSA and the Archive do not bear any responsibility for the analyses or interpretations presented here.
The authors declared no potential conflicts of interest with respect to the research, authorship, and/or publication of this article.
The authors disclosed receipt of the following financial support for the research, authorship, and/or publication of this article: The funding for ELSA is provided by the National Institute of Aging in the United States, and a consortium of UK Government departments coordinated by the Office for National Statistics. AK and TC were supported by a grant from the Economic and Social Research Council (ESRC; RES-000-22-3489). TC is supported by grants from the Health and Safety Executive (HSE), UK; Sheffield Hallam University, UK; Yorkshire & Humberside SHA, UK, Babcock International Group plc., and the European Agency for Health and Safety at Work. RDV is partially supported by the Economic and Social Research Council (ESRC). JV and MK are supported by the Academy of Finland (projects 124322, 124271, and 132944). MK is also supported by the EU New OSH ERA Research Programme, the BUPA Foundation, UK, and the National Heart, Lung and Blood Institute (R01 HL036310-20A2) and the National Institute on Aging, NIH, USA (R01AG034454). AV is supported by the Finnish Work Environment Fund (project 109395) and the Academy of Finland (project 128089). TH is supported by the Finnish Work Environment Fund (project 107154) and the Academy of Finland (project 128002). AG is supported by the National Institute of Health Research Service Delivery Organisation Programme, UK, and Babcock International Group plc. The researchers are all independent of the funders.