



Abstract
Over the past three decades, numerous studies have shown that religious involvement—indicated by observable feelings, beliefs, activities, and experiences in relation to spiritual, divine, or super-natural entities—tends to favor health and longevity in the elderly population. These patterns are remarkably consistent across a range of health indicators, including anger (Carr, 2003), depression (Idler, 1987; Idler & Kasl, 1997a; Strawbridge, Shema, Cohen, Roberts, & Kaplan, 1998), anxiety (Cicirelli, 2002; Krause, 2005), non-specific psychological well-being (Fry, 2001; Idler & Kasl, 1997a), life satisfaction (Levin, Markides, & Ray, 1996; Krause, 2003, 2005), cognitive functioning (Hill, Burdette, Angel, & Angel, 2006; Reyes-Ortiz et al., 2008; Van Ness & Kasl, 2003), self-rated health (Idler, McLaughlin, & Kasl, 2009; Krause, 1998, 2006), functional status (Benjamins, 2004; Idler, 1987; Idler & Kasl, 1997b; Park et al., 2008), and stroke (Wolinsky et al., 2009). Not surprisingly, religious involvement is also associated with lower risk of all-cause mortality (Ellison, Hummer, Cormier, & Rogers, 2000; Hill, Angel, Ellison, & Angel, 2005; Strawbridge, Cohen, Shema, & Kaplan, 1997) and mortality linked to circulatory diseases, respiratory diseases, and other specific causes (Hummer, Rogers, Nam, & Ellison, 1999; Oman, Kurata, Strawbridge, & Cohen, 2002; Rogers, Krueger, & Hummer, 2010).
Although this body of work is extensive, researchers have only begun to explore the role of religious involvement across a wide range of biological markers. Biological markers or biomarkers are objective indicators (derived from independent assessments like blood and saliva, not self-reports) of physiological functioning (e.g., cardiovascular and immune functioning) that are known to predict health and mortality risks (Crimmins, Kim, & Vasunilashorn, 2010; Crimmins & Seeman, 2001; McDade, Williams, & Snodgrass, 2007). Like most health outcomes, biomarkers are not randomly distributed in society. They are shaped by repeated and patterned social, psychological, and behavioral processes (Crimmins et al., 2010; Crimmins & Seeman, 2001; McDade et al., 2007; Seeman, Dubin, & Seeman, 2003).
In general, research shows that various indicators of religious involvement are associated with favorable biomarker profiles across sympathetic nervous, hypothalamic–pituitary–adrenal (HPA), cardiovascular, immune, and metabolic systems (Seeman et al., 2003; Seybold, 2007). When limited to studies of older adults, there is evidence that religious involvement is associated with lower levels of blood pressure (Koenig et al., 1998; Krause et al., 2002; Maselko, Kubzansky, Kawachi, Seeman, & Berkman, 2007), C-reactive protein (Gillum, King, Obisesan, & Koenig, 2008; King, Mainous, & Pearson, 2002; King, Mainous, Steyer, & Pearson, 2001), interleukin-6 (Koenig et al., 1997; Lutgendorf, Russell, Ullrich, Harris, & Wallace, 2004), white blood cells (King et al., 2001), epinephrine (Maselko et al., 2007), cortisol (Ironson et al., 2002), and overall allostatic load (Maselko et al., 2007). Body mass is one possible exception to these general tendencies. Several studies demonstrate that religious adults tend to weigh more, not less, than their less religious counterparts (Bruce, Sims, Miller, Elliott, & Ladipo, 2007; Idler & Kasl, 1997a; Kim, Sobal, & Wethington, 2003; Oman & Reed, 1998; Strawbridge et al., 1997). However, research also suggests that religious adults are less likely to be underweight (Musick et al., 2004), which is especially relevant to health and well-being in old age.
Observed religious variations in biological functioning are clearly consistent with the large body of research on religious variations in health and mortality risk. In fact, several researchers consider the broader health and mortality patterns to be at least partially mediated or explained by underlying biological differences (Gillum et al., 2008; Hill, 2010; Hill, Burdette, & Idler, 2011; Koenig, King, & Carson, 2012; Koenig, McCullough, & Larson, 2001; Lutgendorf et al., 2004; Seeman et al., 2003; Seybold, 2007). For example, Lutgendorf and colleagues (2004) demonstrate that the inverse association between religious attendance and all-cause mortality risk in older adults is fully mediated by lower levels of interleukin-6, a biomarker implicated in the development of heart disease, cancer, osteoporosis, frailty, and functional limitations. Although Gillum and colleagues (2008) report a similar pattern for C-reactive protein, their results are less certain because several potential mediators are entered simultaneously.
Although this work suggests that biomarkers can help to explain religious variations in health and mortality risk, we still know very little about how religious involvement gets “under the skin” to contribute to favorable biomarker profiles. Nevertheless, previous research has proposed several social (e.g., social integration and social support), psychological (e.g., meaning and control beliefs), behavioral (e.g., drinking and smoking), and biological (e.g., stress) mechanisms (Hill, 2010; Hill, Burdette, & Idler, 2011; Koenig et al., 2001; Koenig et al., 2012; Seybold, 2007). For example, religious involvement (e.g., religious meaning systems) may help to buffer appraisals of stressful life conditions and, by extension, their physiological consequences. Instrumental support, the sense of control, and moderate drinking practices could help older adults to avoid stressful life conditions (events and appraisals) and chronic activation of the physiological stress response. In the event of stressful life conditions (and the activation of sympathetic systems), religious beliefs and practices, supportive relationships, strong self-concepts, and healthy lifestyles may also favor healthy coping strategies (and efficient activation of parasympathetic systems and various growth responses).
Because stress, mental health, and unhealthy behaviors are reliably linked to religious involvement and the activation of nervous, HPA, cardiovascular, immune, and metabolic systems (McEwen, 1998, 2002), these factors (among others) may function as general mechanisms across markers of allostatic systems. We should note that these mechanisms cannot explain the anomalous positive association between religious attendance and body mass (an important marker of the metabolic system). Explanations for why religious adults tend to weigh more than less religious adults are not firmly established in the literature. However, there is some speculation that poor eating habits, lower rates of smoking, and the sedentary practice of religious media consumption may play a role (Cline & Ferraro, 2006; Kim et al., 2003).
All of these processes are theoretically viable, but researchers must first establish basic associations between religious involvement and biological functioning before they can begin to legitimately explain them. In this article, we use data collected from a large national sample of older adults to examine associations between religious attendance and a range of biomarkers. We contribute to previous research in several ways. First, we attempt to replicate previous studies by observing biomarkers that have been emphasized in the literature (e.g., body mass, blood pressure, C-reactive protein, and overall allostatic load). Second, we examine associations with unexplored or understudied biomarkers (e.g., pulse rate, glycosylated hemoglobin, Epstein-Barr virus, and dehydroepiandrosterone). Finally, acknowledging different coding conventions in the literature, we assess (in the same analysis) how associations with religious attendance might vary depending on how biological functioning is specified.
Method
Data
We use data from the National Social Life, Health, and Aging Project (NSHAP) to formally test these associations. The NSHAP is a nationally representative sample of older adults aged 57 to 85 who live in the United States. The National Opinion Research Center, along with Principal Investigators at the University of Chicago, conducted 3,005 interviews during 2005 and 2006 yielding a sample of U.S. adults aged 57 to 85 years (Suzman, 2009). Data collection took place during face-to-face interviews in respondents’ homes. The overall response rate was 75.5% (see O’Muircheartaigh, Eckman, & Smith, 2009, for more information on the sampling design). Specific biomarker collection procedures were selected to be carried out by NORC interviewers (Jaszczak, Lundeen, & Smith, 2009; Smith et al., 2009). All respondents were asked to participate in the height and weight assessment, saliva collection, and blood pressure and pulse rate screenings. Blood spot collection was randomized to 2,494 respondents (Nallanathan, Williams, McDade, & Lindau, 2008). Overall, 1,746 viable assays were obtained for glycosylated hemoglobin, 1,939 for C-reactive protein, and 1,977 for Epstein–Barr virus. In addition, 1,450 respondents had viable information across all biomarkers. All analyses are weighted to adjust for respondent selection and nonresponse based on age and urbanicity. Table 1 provides descriptive statistics for the study sample.
Descriptive Statistics for Study Variables.

Source. National Social Life, Health, and Aging Project (2005/2006).
Note. BMI = body mass index; CRP = C-reactive protein; EBV = Epstein–Barr virus; DHEA = dehydroepiandrosterone.
ELISA units.
Based on DHEA before reverse coding.
Measures
Biomarkers
Our analyses include eight individual biomarkers. The HPA axis is indicated by dehydroepiandrosterone (DHEA), an androgen produced by the adrenal glands (Juster, McEwen, & Lupien, 2010). DHEA is measured through saliva specimens provided by the respondent (Mendoza, Curran, & Lindau, 2007). Specimens were placed on ice packs immediately following collection, and then transported to a freezer and shipped to a laboratory on dry ice for assessment (Mendoza et al., 2007). DHEA measurements are based on the average of two readings.
Cardiovascular functioning is indicated by respondents’ systolic blood pressure, diastolic blood pressure, and pulse rate. These markers were obtained through the use of a blood pressure cuff on the respondent’s left arm. Blood pressure and pulse rate measurements are based on the average of two or three readings (when the first two readings varied greatly).
Metabolic functioning is indicated by body mass index (BMI) and glycosylated hemoglobin (HbA1c). BMI is measured using direct measurements of respondents’ height and weight. We calculated BMI by dividing weight in pounds (lb) by height in inches (in.) squared, then multiplying by a conversion factor of 703 (formula = [weight (lb)]/[height (in.)]2 × 703; Williams, Pham-Kanter, & Leitsch, 2009). HbA1c, the ratio of glycosylated to nonglycosylated hemoglobin, is a marker of glucose metabolism (Gomero, McDade, Williams, & Lindau, 2008). HbA1c is measured through the use of dried blood spot technology (McDade et al., 2007). The dried blood spots were taken from the respondents’ finger with a lancet, applied to filter paper, and transported to laboratories for assessment (Gomero et al., 2008).
Immune functioning is indicated by C-reactive protein (CRP) and Epstein–Barr virus (EBV). CRP, an acute phase protein, is a marker of inflammation (Nallanathan et al., 2008). EBV, a herpes virus, is an indirect marker of cell-mediated immune function (Glaser et al., 1991; McDade et al., 2000). CRP and EBV are also measured through the use of dried blood spot technology (Nallanathan et al., 2008).
In this article, we use a multiple specification approach to overcome the limitations of any particular coding scheme (e.g., categorical assessments can be arbitrary and insensitive, while continuous or dimensional assessments ignore regions of clinical significance). We examine four specifications of overall allostatic load (i.e., an index of the individual biomarkers) and three specifications of each individual biomarker. Our first specification treats each individual biomarker and overall allostatic load as continuous variables (Karlamangla, Singer, McEwen, Rowe, & Seeman, 2002; Maselko et al., 2007). Most of the individual biomarkers are transformed due to skewness in their original distributions. DHEA is top-coded at 575.55 pg/mL and reverse coded. Each individual biomarker was standardized and averaged to create the continuous measure of overall allostatic load. We use ordinary least squares (OLS) to estimate associations with all continuous specifications.
Our second and third specifications use a high-risk cutoff criterion (Crimmins, Johnston, Hayward, & Seeman, 2003; Geronimus, Hicken, Keene, & Bound, 2006; Seeman, McEwen, Rowe, & Singer, 2001). Respondents who scored in the top 25th percentile of each biomarker (the bottom 25th percentile for DHEA) and the continuous overall allostatic load index are coded 1 and all others 0 (see Table 1 for specific cutoffs). We use binary logistic regression to estimate associations with all binary specifications. We created another overall allostatic load index by taking the sum of the number of biomarkers for which the respondent exceeded the high-risk criterion. We used Poisson regression to estimate associations with this count specification. Poisson regression models are best suited for count data and rely on the assumption that the dependent variable is equidispersed or that the conditional means equal conditional variances (Long & Freese, 2006). Because our count specification of allostatic load is not overdispersed, Poisson regression is preferable to negative binomial regression.
Our fourth specification is based on McEwen’s (1998) definition of allostatic load: “ . . . wear and tear that results from chronic overactivity or underactivity of allostatic systems” (p. 171). To indicate “chronic overactivity or underactivity,” we coded three groups: (1) those in the high-risk (top 25th percentile, except for DHEA) portions of the distributions for each individual biomarker and the continuous allostatic load index, (2) those in the low-risk (bottom 25th percentile, except for DHEA) portions of the distributions for each individual biomarker and the continuous allostatic load index, and (3) those in the middle-risk (middle two quarters) portion of the distributions for each individual biomarker and the continuous allostatic load index. We use multinomial logistic regression to estimate associations with all multiple group specifications. In subsequent analyses, Group 3 (middle-risk) serves as the common comparison group.
Religious attendance
Religious involvement is indicated by religious attendance, the most commonly used measure of religiousness. Religious attendance is measured with a single item. Respondents were asked, “Thinking about the past 12 months, about how often have you attended religious services?” Original response categories for this item included (0) never, (1) less than once a year, (2) about once or twice a year, (3) several times a year, (4) about once a month, (5) every week, and (6) several times a week. We recoded religious attendance by combining categories of attendance that are theoretically and empirically similar (Rote, Hill, & Ellison, 2013). For example, the categories of “less than once a year” and “about once or twice a year” capture sporadic yearly attendance and produce similar means on our focal outcomes. Our final religious attendance measure includes the following categories: (0) never attend, (1) attend less than once a year or about once or twice a year, (2) attend several times a year or about once a month, and (3) attend every week to several times a week.
Subsequent analyses control for a number of factors that may influence the relationship between religious attendance and biological risk. Age is a categorical variable based on the sampling design of the NSHAP and includes those who are 57 to 64 years old (reference category), 65 to 74 years old, and 75 years or older. Gender is coded 1 for female and 0 for males. Race/Ethnicity is based on respondents’ self-report of racial/ethnic identification and is coded as a multiple dummy variable indicating black, Hispanic, and other, with non-Hispanic White as the absent reference category. Education is a multiple dummy variable distinguishing those who have less than a high school degree, a high school degree or equivalent, some college, and a college degree or more (reference category). Income is based on household income per year. For the 29% of the sample missing on income, a series of follow-up questions were asked such as “is your household income at, over or under 50,000.” For respondents who reported an amount, for example, “at 50,000,” we imputed the exact amount. We then used a regression-based imputation procedure (impute) in Stata to retain the other 25% of our analytic sample missing on income (Ambler, Omar, & Royston, 2007). Missing values for all other variables are estimated using the same procedure.
Results
Multivariate Analysis of Allostatic Load
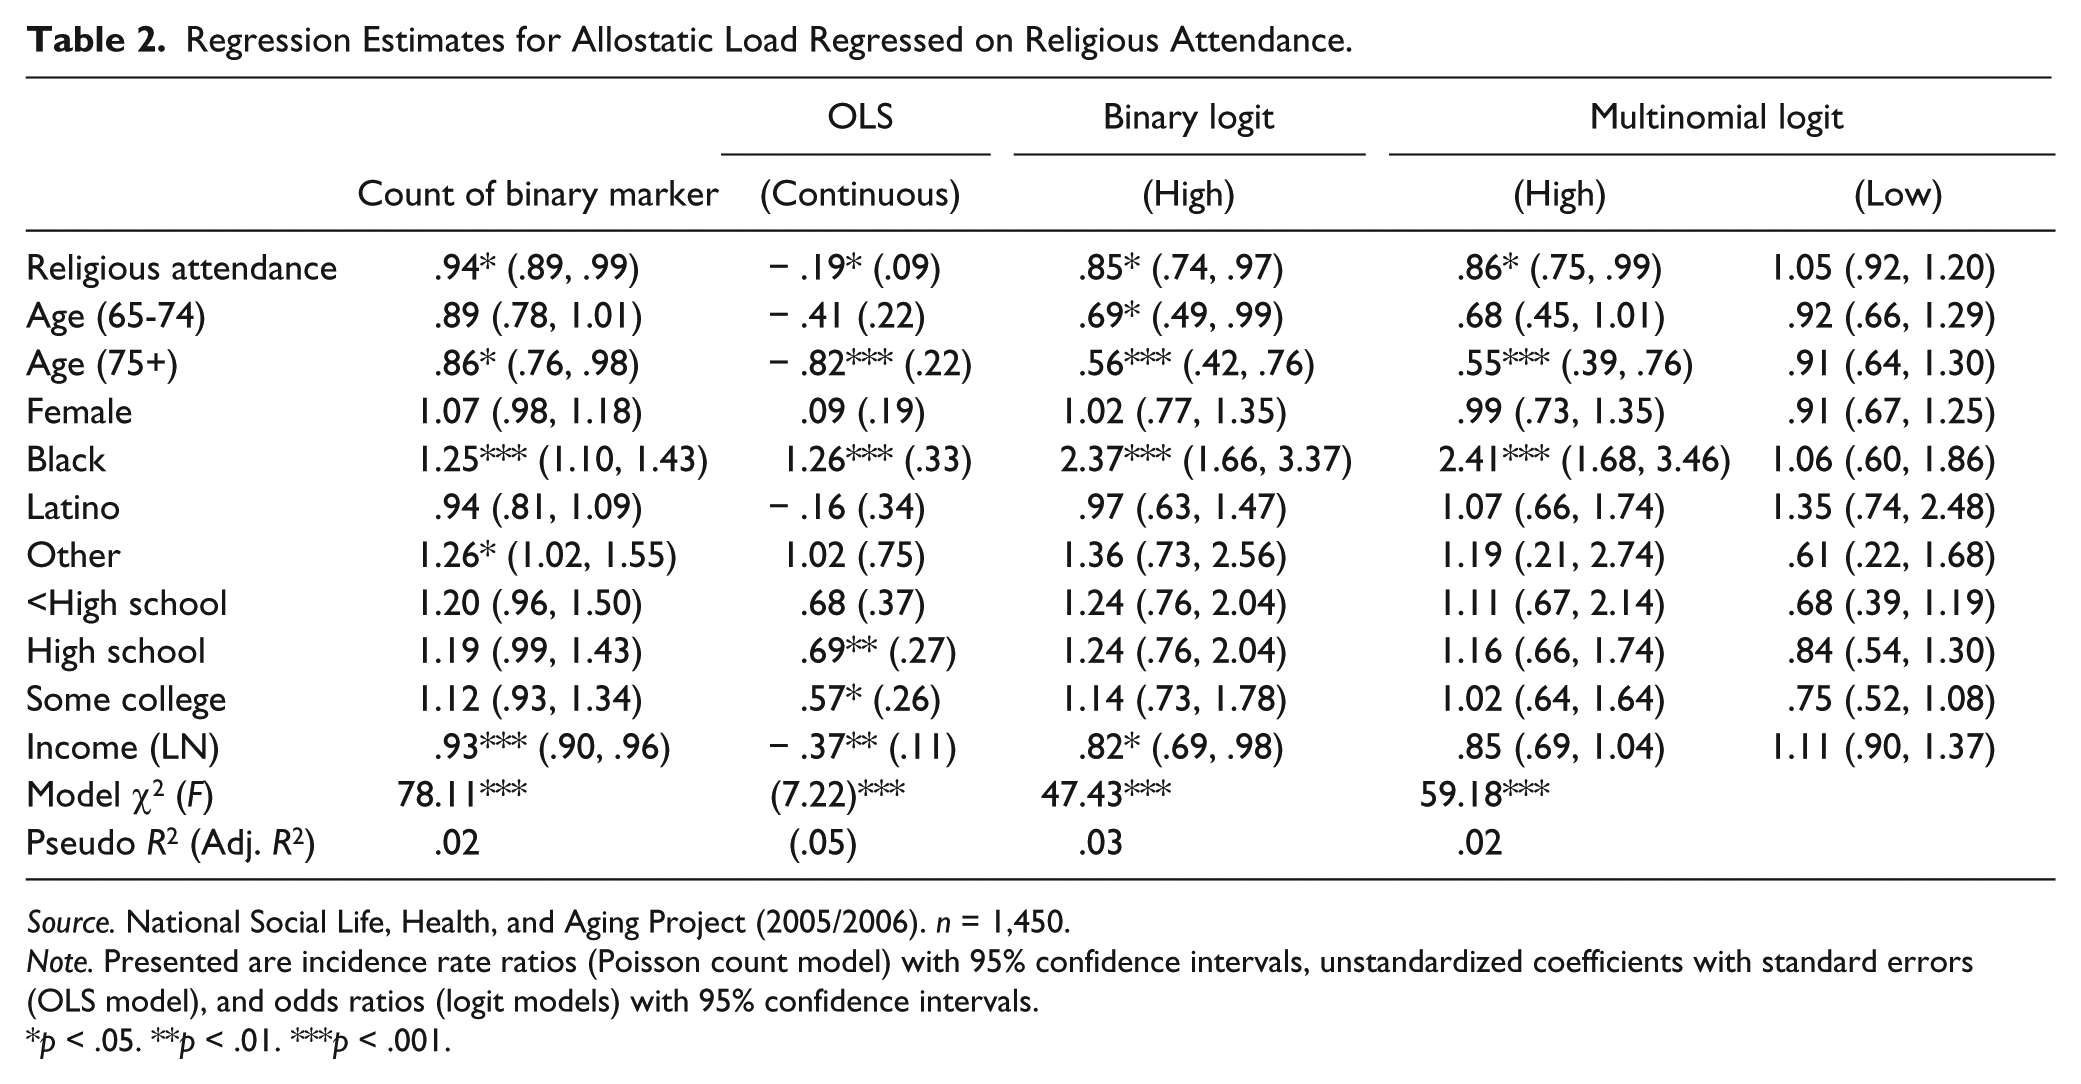
The first column of Table 2 presents the Poisson regression of the count specification of the full allostatic load index. In this analysis, the dependent variable is a count of individual biomarkers that have been dummy-coded to indicate high-risk (i.e., the high-risk quarter of the continuous biomarker distribution). We show incidence rate ratios (IRRs) that are interpreted as the difference in the expected allostatic load count for each one-unit change in an independent variable, while all other variables in the model are held constant. IRRs can be manipulated ([IRR − 1] × 100) to describe the percent difference in the expected allostatic load count for each one-unit change in an independent variable. The IRR for religious attendance (0.94) is statistically significant. Because the IRR is less than 1, the association between religious attendance and allostatic load is inverse. This result indicates that respondents who report higher levels of religious attendance tend to have fewer high-risk biomarkers than respondents who report lower levels of religious attendance. More specifically, each one-unit increase in religious attendance reduces the expected allostatic load count by roughly 6% ([0.94 − 1] × 100). This means that respondents who attend religious services several times a year or about once a month (i.e., the mean level of attendance) exhibit a 12% reduction in the expected allostatic load count. We note that the IRR for attendance is comparable with the IRR observed for income, but smaller than the IRR observed for respondents who are 75 years of age or older (vs. 57- to 64-year-olds).
Regression Estimates for Allostatic Load Regressed on Religious Attendance.
Source. National Social Life, Health, and Aging Project (2005/2006). n = 1,450.
Note. Presented are incidence rate ratios (Poisson count model) with 95% confidence intervals, unstandardized coefficients with standard errors (OLS model), and odds ratios (logit models) with 95% confidence intervals.
p < .05. **p < .01. ***p < .001.
The second column of Table 2 presents the OLS regression of the continuous specification of the full allostatic load index. In this analysis, the dependent variable is a mean of the continuous individual biomarkers. We show unstandardized OLS coefficients that are interpreted as the difference in the expected mean of allostatic load for each one-unit change in an independent variable, while all other variables in the model are held constant. The coefficient for religious attendance is statistically significant and negative. This result indicates that respondents who report higher levels of religious attendance tend to exhibit lower levels of allostatic load than respondents who report lower levels of religious attendance. A comparison of standardized parameter estimates (not shown) suggests that religious attendance is a modest correlate of allostatic load. For example, the standardized parameter estimate for religious attendance (β = −0.07) is smaller in magnitude than the standardized parameter estimate for income (β = −0.10).
The third column of Table 2 presents the binary logistic regression of the dichotomous specification of the full allostatic load index. In this analysis, the dependent variable is dummy-coded to indicate high biological risk (i.e., the high-risk quarter of the continuous allostatic load distribution) versus low to moderate biological risk (the reference category). We show odds ratios (ORs) that are interpreted as the estimated difference in the odds of high biological risk for each one-unit change in an independent variable, while all other variables in the model are held constant. ORs can be manipulated ([OR − 1] × 100) to describe the percent difference in the odds of high biological risk for each one-unit change in an independent variable. The OR for religious attendance (0.85) is statistically significant. Because the OR is less than 1, the association is inverse. This result indicates that respondents who report higher levels of religious attendance tend to exhibit lower odds of high biological risk than respondents who report lower levels of religious attendance. In fact, each one-unit increase in religious attendance reduces the odds of high biological risk by roughly 15% ([0.85 − 1] × 100). This means that respondents who attend religious services several times a year or about once a month (i.e., the mean level of attendance) exhibit a 30% reduction in the odds of high biological risk. We note that the OR for attendance is comparable to the OR observed for income, but much smaller than the OR observed for respondents who are 75 years of age or older.
The last two columns of Table 2 present the multinomial logistic regression of the trichotomous specification of the full allostatic load index. In this analysis, the dependent variable is dummy-coded to indicate (a) high biological risk (i.e., the high-risk quarter of the continuous allostatic load distribution) and (b) low biological risk (i.e., the low-risk quarter of the continuous allostatic load distribution) versus moderate biological risk (the reference category). We show ORs with the same interpretation as the above binary logistic regression analysis.
The OR for religious attendance (0.86) in the high biological risk column is statistically significant. Because the OR is less than 1, the association is inverse. This result indicates that respondents who report higher levels of religious attendance tend to exhibit lower odds of high biological risk versus moderate biological risk than respondents who report lower levels of religious attendance. Each one-unit increase in religious attendance reduces the odds of high biological risk versus moderate biological risk by roughly 14% ([0.86 − 1] × 100). This means that respondents who attend religious services several times a year or about once a month (i.e., the mean level of attendance) exhibit a 28% reduction in the odds of high biological risk versus moderate biological risk. The OR for religious attendance in the low biological risk column is not statistically significant. This means that the odds of low biological risk versus moderate biological risk are comparable across levels of religious attendance.
Multivariate Analysis of Individual Biomarkers
Our multivariate analysis of allostatic load consistently shows that respondents who report higher levels of religious attendance tend to exhibit lower levels of overall biological risk than respondents who report lower levels of religious attendance. The regression results presented in Table 3 are intended to test whether the general associations between religious attendance and overall allostatic load are driven by specific biomarkers. To accomplish this, Table 3 presents associations between religious attendance and each of the eight biomarkers under study. The substantive association between religious attendance and allostatic load does not appear to depend on the specification of allostatic load. However, associations between religious attendance and individual biomarkers do depend on the specification of the biomarker.
Regression Estimates for Individual Biomarkers Regressed on Religious Attendance.

Source. National Social Life, Health, and Aging Project (2005/2006).
Note. n = 1,440. Presented are unstandardized coefficients with standard errors (OLS model) and odds ratios (logit models) with 95% confidence intervals. All regression estimates are adjusted for age, gender, race/ethnicity, education, and income. DHEA (n = 2,398), diastolic BP (n = 2,934), systolic BP (n = 2,934), pulse rate (n = 2,931), HbA1c (n = 1,746), BMI (n = 2,790), CRP (n = 1,939), EBV (n = 1,977). DHEA = dehydroepiandrosterone; BMI = body mass index; CRP = C-reactive protein; EBV = Epstein–Barr virus.
p < .05. **p < .01. ***p < .001.
Table 3 shows that religious attendance is unrelated to DHEA, systolic blood pressure, and HbA1c across specifications. Religious attendance is most consistently associated with favorable diastolic blood pressure and pulse rate profiles. The second row of Table 3 shows that religious attendance is inversely associated with diastolic blood pressure. Each unit increase in religious attendance reduces the odds of high diastolic blood pressure (versus low to moderate diastolic blood pressure) by 9%. The odds of (a) high diastolic blood pressure versus moderate diastolic blood pressure and (b) low diastolic blood pressure versus moderate diastolic blood pressure are comparable across levels of religious attendance. The fourth row of Table 3 shows that religious attendance is inversely associated with pulse rate. Each unit increase in religious attendance reduces the odds of high pulse rate (a) versus low to moderate pulse rate and (b) versus moderate pulse rate by 15%, respectively. The odds of low pulse rate versus moderate pulse rate are comparable across levels of religious attendance.
Rows 6 through 8 show that religious attendance is inversely associated with continuous BMI and CRP, but not continuous EBV. Religious attendance is unrelated to the high-risk specifications of BMI, CRP, and EBV; however, attendance reduces the odds of low BMI (versus moderate BMI) by 10% and increases the odds of low EBV (versus moderate EBV) by 15%. An exclusive focus on the binary specifications of BMI, CRP, and EBV would conceal statistically significant associations with the continuous specifications. The additional multinomial specifications of BMI and EBV reveal associations with religious attendance that would be concealed by the standard high-risk binary specification. In the case of EBV, the multinomial specification produced statistically significant associations when the continuous specification did not.
Discussion
Numerous studies have shown that religious involvement tends to favor health and longevity in the elderly population. Although this literature is extensive, researchers have only recently begun to explore the connection between religious involvement and biological functioning across a wide range of biological markers. In this article, we used data from a large national data source to examine associations between religious attendance and several indicators of biological risk.
Our first aim was to replicate previous studies by observing biomarkers that have been emphasized in the literature. In support of prior work on older adults (Gillum et al., 2008; King et al., 2001; King et al., 2002; Koenig et al., 1998; Krause et al., 2002; Maselko et al., 2007), we find that religious attendance is associated with lower levels of diastolic blood pressure (continuous and binary specifications), CRP (continuous specification), and overall allostatic load (count, continuous, binary, and multinomial specifications). In contrast to previous research (Idler & Kasl, 1997a; Oman & Reed, 1998; Strawbridge et al., 1997), our results suggest that religious attendance is associated with lower levels of body mass (continuous specification). However, using a multinomial specification of body mass, we confirm that religious attendance is associated with lower odds of being underweight (Musick et al., 2004). The inverse association between religious attendance and body mass is uncommon, but not unprecedented (e.g., Cline & Ferraro, 2006). In fact, the mechanisms through which religious attendance might be associated with lower body mass (e.g., congregational support for healthy lifestyles, sanctification of the body, self-control, lower stress, better mental health, lower consumption of alcohol, and greater physical activity) would seem to exceed the mechanisms in favor of greater body mass (e.g., poor eating habits, lower rates of smoking, and religious media consumption) (Ellison, Lee, Krause, Hill, & Marcum, 2009; Hill, Burdette, Ellison, & Music, 2006, 2007; McCullough & Willoughby, 2009).
Our second aim was to examine associations with unexplored or understudied biomarkers. Along these lines, we observe that higher levels of religious attendance are associated with lower levels of pulse rate (continuous, binary, and multinomial specifications) and EBV (multinomial specification). We also find that religious attendance is unrelated to DHEA and HbA1c across all specifications. To the best of our knowledge, we are the first to formally examine associations of religious attendance with pulse rate, EBV, DHEA, and HbA1c. Nevertheless, our results for pulse rate and EBV are generally consistent with other studies of biomarkers related to cardiovascular function, namely, blood pressure (Koenig et al., 1998; Krause et al., 2002; Maselko et al., 2007), and immune function, including CRP (Gillum et al., 2008; King et al., 2001; King et al., 2002), interleukin-6 (Koenig et al., 1997; Lutgendorf et al., 2004), and white blood cells (King et al., 2001). Our findings for DHEA are inconsistent with research concerning the HPA axis, specifically cortisol (Ironson et al., 2002). Our results for HbA1c also fail to conform to the core studies of body mass (Idler & Kasl, 1997a; Oman & Reed, 1998; Strawbridge et al., 1997).
Our third aim was to assess how associations with religious attendance might vary depending on how biological functioning is specified. The patterns for overall allostatic load, DHEA (null), systolic blood pressure (null), and HbA1c (null) are consistent across specifications; however, associations with diastolic blood pressure, pulse rate, BMI, CRP, and EBV are only observed under certain specifications (see above). The multiple specification approach is useful because different specifications have different strengths and weaknesses. Exclusive use of the high-risk categorical specification would have hidden associations with BMI, CRP, and EBV, and, under these conditions, we would have concluded that religious attendance is unrelated to immune function. Exclusive use of the continuous specification would have concealed differences relative to clinically significant ranges for cardiovascular functioning (pulse rate). Finally, the multinomial specification allowed us to directly assess chronic overactivity and underactivity of allostatic systems. This approach provided a more detailed interpretation of pulse rate, body mass, and EBV (see above).
Our analyses are limited in several respects. First and foremost, the data are cross-sectional. This feature presents serious threats to causal inference, namely, the potential for (a) reverse causation (i.e., individuals with poor physiological profiles may be less able or less likely to attend religious services regularly) and (b) selectivity (i.e., individuals with certain personality traits or other unmeasured characteristics may be more likely to have desirable physiological profiles and lower levels of religious attendance). Having said this, we are encouraged by sporadic associations with many of the individual biomarkers. If health selection were a major explanation, we would have expected statistically significant associations with DHEA, systolic blood pressure, and HbA1c, and more consistent associations with immune functioning. We must also acknowledge the restricted content validity of our allostatic load measure. Our measure includes indicators of the HPA axis (DHEA), cardiovascular function (diastolic blood pressure, systolic blood pressure, and pulse rate), metabolic function (BMI and HbA1c), and immune function (CRP and EBV); however, to fully represent the concept, we would also need indicators of the autonomic nervous system (e.g., epinephrine and norepinephrine). The data assessed BMI, but waist-to-hip ratio is generally preferred because it is a more direct indication of stress processes. Our analysis is limited to a single item indicator of religious involvement—religious attendance. Although this measure is most common and most comparable with previous research, single items are generally low in reliability and, as a consequence, our analysis is likely to underestimate the role of religious participation in later life. At the same time, we should not overstate the importance of religious involvement. Our analyses are characterized by modest effect sizes for religious attendance and small R-squared estimates.
Conclusion
Despite these important limitations, our results confirm that religious attendance is associated with healthier biological functioning in later life. Additional research is needed to verify the patterns we have observed with other data sources (especially longitudinal data sources) and to test viable mediators of the association between religious involvement and biological risk. Although some studies have considered indicators of biological risk (e.g., interleukin-6 and CRP) as mechanisms linking religious involvement to longevity, future work should also explore biological links to mental and physical health. Because substantive interpretations often depend on the choice of several valid biomarker specifications, we recommend that researchers use a multiple specification approach instead of focusing on any particular coding scheme. This strategy is the best way to (a) represent the conceptual definition of allostatic load and to (b) avoid potentially misleading conclusions. Research along these lines would provide a more thorough and extensive understanding of religious variations in late life biological functioning.
Footnotes
Declaration of Conflicting Interests
The authors declared no potential conflicts of interest with respect to the research, authorship, and/or publication of this article.
Funding
The authors disclosed receipt of the following financial support for the research, authorship, and/or publication of this article: This work was supported by Grant T32AG00270 from the National Institute on Aging.