



Abstract
Introduction
Poor diet is an important risk factor for chronic diseases and a leading cause of death (Afshin et al., 2019; US Burden of Disease Collaborators, 2018). In 2016, poor diet accounted for 11% of disability-adjusted life-years lost and 529,299 deaths in the United States, with 83.9% of these deaths caused by cardiovascular diseases (US Burden of Disease Collaborators, 2018). It also has a great impact on older adults’ health; previous studies have reported that older adults with poor, unhealthy diet, such as a low quality diet and a high cholesterol intake, were more likely to develop chronic diseases and have a higher mortality risk than those with healthy diet (Houston et al., 2011; Hsiao et al., 2013; Lagström et al., 2020; Reedy et al., 2014; Seo & Hwang, 2021; Xu et al., 2014). While much existing research has focused on major chronic diseases and mortality as health outcomes, there is a growing interest in using biomarkers to understand a complex relationship between diet, nutrition, and health (Picó et al., 2019). This is because biomarkers are sensitive to current health status and capture aspects of health that may precede the development of disease and other health problems (Crimmins et al., 2008; Picó et al., 2019).
An increasing number of studies use biomarkers and report an association between diet and biological risk. For example, Kant and Graubard examined a variety of indicators of risk for obesity, cardiovascular disease, and diabetes, including body mass index (BMI), systolic and diastolic blood pressure (SBP, DBP), total cholesterol (TC), low-density lipoprotein cholesterol, high-density lipoprotein (HDL) cholesterol, triglycerides, plasma glucose, glycated hemoglobin (HbA1C), C-reactive protein (CRP), and leptin to investigate the relationship between overall diet quality and cardiometabolic risk (Kant & Graubard, 2005). They found that high scores of dietary indices (i.e., Healthy Eating Index (HEI), Recommended Foods Score, and Dietary Diversity Score) were negatively associated with BMI, SBP, DBP, CRP, plasma glucose, TC, and HbA1C, suggesting healthy diet is associated with decreased cardiometabolic risk (Kant & Graubard, 2005). Paterson et al. (2018) examined the association between dietary patterns and kidney function. Kidney function was assessed by the estimated glomerular filtration rate (eGFR), calculated based on creatinine and cystatin C. They found that participants with the least adherence to a healthy dietary pattern (greater intake of vegetables, whole grains, fruits, fish, and dairy) had a lower mean eGFR than the most adherent, suggesting greater risk for kidney impairment (Paterson et al., 2018). Millar et al. (2021) examined the association between diet quality with biomarkers of inflammation, including CRP and interleukin (IL)-6, among middle-to-older aged adults and found that higher diet quality, as determined by the HEI-2015 score, was associated with reduced inflammation risk.
While individual biomarkers have been useful for understanding a specific physiological status or system functioning (e.g., cardiovascular, metabolic), they have limited capacity to assess and predict overall health. A cumulative, multi-system viewpoint may help overcome this limitation. Due to the multiple pathways to comorbidity and mortality, a global index of physiological functioning or cumulative biological risk has been shown to be a better predictor of health outcomes associated with aging than individual markers (Crimmins et al., 2021; Juster et al., 2010; Levine & Crimmins, 2014; Seeman et al., 1997, 2001). An increasing number of studies are using summary measures of biological dysregulation across multiple physiological regulatory systems (e.g., cardiovascular system, metabolic processes, organ functioning, and inflammation) to assess current health status (Crimmins et al., 2007; García & Ailshire, 2019; Seeman et al., 2008), although not as yet in research on diet and nutrition.
This study investigates an association between diet and health using comprehensive measures of biological risk. The research question that will be examined is: whether and to what extent diet is associated with biological risk. We will investigate the relationship between biological risk and overall diet quality, assessed using the HEI-2015. The HEI-2015 is a summary measure of overall diet quality that incorporates nutrient needs and dietary guidelines for Americans (Kennedy et al., 1995). We will also examine the association of 13 individual dietary components of the HEI-2015 with biological dysregulation. Findings of this study will deepen our understanding of the relationship between diet and health among older adults and inform the development of public health and nutrition interventions that can reduce adverse health impacts of poor diet.
Methods
Data and Sample
We used data from the Health and Retirement Study (HRS). The HRS is a longitudinal panel study that surveys a nationally representative sample of approximately 20,000 Americans over the age of 50 and their spouses at 2 year intervals. The HRS has been collecting a rich array of data on sociodemographic characteristics and health biennially since 1992, with new cohorts added every 6 years.
For this analysis, data were derived from the HRS 2016 Venous Blood Study (VBS) and the HRS 2013 Health Care and Nutrition Study (HCNS). In 2016, the HRS collected venous blood from panel respondents for the first time in order to provide a fuller picture of the health of a representative sample of older adults. All panel respondents who completed an HRS interview during the 2016 wave were asked to consent to a venous blood draw with the exception of proxy respondents and nursing home residents. Trained phlebotomists conducted home visits and collected venous blood from VBS participants. A fifty-dollar incentive payment was sent by check to the participants (Crimmins et al., 2017). The 2013 HCNS is a sub-study of the HRS that asked about health care access, food purchases, and food and nutrition consumption. The HCNS was collected from a random subsample of the HRS respondents and their spouse/partners (Health and Retirement Study, 2018). A total of 4081 respondents participated in both the 2016 VBS and the 2013 HCNS. We then omitted 347 individuals who had missing information on the following variables: biomarkers (n = 335), physical activity (n = 8), and race/ethnicity (n = 4). After excluding individuals with missing data, the final analytical sample includes 3734 respondents.
Comparing the 2016 HRS respondents eligible for the VBS collection who were subsequently excluded from our analysis to the analytic sample of 3734 respondents, we find those included in the analytic sample were more likely to be younger (OR = 0.99, SE = .00, p < .05), male (OR = −.22, SE = .07, p < .001), more physically active (OR = .28, SE = .08, p < .01), and less likely to be non-Hispanic black (OR = −.48, SE = .09, p < .001) than respondents who were excluded from the analytic sample [see Supplementary Material Table B]. Respondents who had missing information on key variables or covariates were excluded using a listwise deletion.
Measures
Biological risk
We created risk scores for cardiometabolic functioning (range 0–7), kidney functioning (range 0–3), inflammation (range 0–7), and cumulative biological risk (range 0–17) by summing the number of biological risk factors that met clinical or research defined high-risk criteria for each biomarker in 2016. Based on previous studies (Jensen et al., 2014; Mitchell et al., 2019; Sossa et al., 2013; Upadhyay, 2015), cardiometabolic functioning included seven indicators: SBP, DBP, pulse rate, TC, HDL cholesterol, fasting glucose, and BMI. Guidelines for high-risk were ≥140 mmHg or <90 mmHg for SBP, ≥90 mmHg or <60 mmHg for DBP, ≥90 beats/minute for pulse rate, ≥240 mg/dL for TC, <40 mg/dL for HDL cholesterol, ≥126 mg/dL for fasting glucose, and ≥30 kg/m2 for BMI. Kidney functioning included three indicators, creatinine, Cystatin C, and blood urea nitrogen (BUN), which provide reliable risk prediction for the progression of kidney disease (Fassett et al., 2011; Lopez-Giacoman & Madero, 2015; Spanaus et al., 2010). Guidelines for high-risk were ≥1.2 mg/dl for creatinine, >1.55 mg/L for Cystatin C, and >24 mg/dL for BUN. Inflammation included seven indicators: CRP, IL-6, IL-10, IL-1 receptor antagonist (RA), soluble tumor necrosis factor (sTNFR-1), transforming growth factor beta 1 (TGF-β1), and albumin. C-reactive protein, and cytokines (IL-6, IL-10, IL-1RA, sTNFR-1, and TGF-β1) are established inflammatory biomarkers in chronic diseases (Brenner et al., 2014; Fassett et al., 2011; Zakynthinos & Pappa, 2009). Albumin is also a well-known indicator of inflammation and aging (Don & Kaysen, 2004; Soeters et al., 2019). High-risk was defined as >3.0 mg/L for CRP, top quartile for cytokines, and <3.5 g/dL for albumin. A summary measure, cumulative biological risk, indicates the number of elevated risk factors present across the three systems.
Diet quality
Diet quality was assessed using the HEI-2015. Data on food and nutrition consumption were derived from the 2013 HCNS. The HEI-2015 contains 13 components—total fruits, whole fruits, total vegetables, greens and beans, whole grains, dairy, total proteins, seafood and plant proteins, fatty acids, refined grains, sodium, added sugars, and saturated fats—that sum to a total maximum score of 100 points. The 13 components of the HEI-2015 are of two types, adequacy components and moderation components. Respondents get a high HEI-2015 score when they consume greater amounts of food and nutrients in the adequacy components (i.e., total fruits, whole fruits, total vegetables, greens and beans, whole grains, dairy, total protein foods, seafood and plant proteins, and fatty acids) and smaller amounts of food and nutrients in moderation components (i.e., refined grains, sodium, added sugars, and saturated fats). Healthy Eating Index scores below 51 indicate a poor quality diet, scores between 51 and 80 reflect a diet that needs improvement, and scores above 81 are considered a good quality diet (Kennedy et al., 1995).
Covariates
We controlled for demographic, socioeconomic, and behavioral factors in 2016. Demographic factors included age (Mitnitski et al., 2015), measured as a continuous variable, and sex, a dichotomous variable (male [reference]; female)(Lau et al., 2019; Lew et al., 2017). We examined two aspects of socioeconomic status: race/ethnicity (categorical: non-Hispanic white/other [reference], non-Hispanic black, or Hispanic)(García & Ailshire, 2019; Guidi et al., 2021), education (categorical: less than a high school education [reference], high school education, or more than a high school education)(Guidi et al., 2021; Seeman et al., 2004, 2008) and poverty status (dichotomous: having household income below the poverty threshold [reference] or having household income above the poverty threshold)(Guidi et al., 2021; Seeman et al., 2008). To better account for sources of differences in biological risk by diet, we also controlled for health behaviors and availability of health care. Health behaviors were assessed using two indicators: smoking (categorical: never smoked [reference]; former smokers; current smokers)(Haswell et al., 2014) and physical activity (dichotomous: physically inactive [reference] or involved in vigorous [e.g., running or jogging, swimming, cycling, aerobics or gym workout, tennis, or digging with a spade or shovel] or moderate activity [e.g., gardening, cleaning the car, walking at a moderate pace, dancing, floor or stretching exercises] at least once a month)(Ballard-Barbash et al., 2012). We controlled for health care availability based on respondent reports of whether they have either public or private health insurance (dichotomous: have no health insurance [reference] or have health insurance)(Glantz et al., 2020; Marino et al., 2020), which we used as a proxy for access to health care (Hoffman & Paradise, 2008; National Center for Health Statistics, 2017).
Statistical Analysis
We first presented demographic, socioeconomic, behavioral, and biomarker characteristics by diet quality (i.e., good quality diet, diet that needs improvement, poor quality diet). We compared differences by diet quality using chi-square and ANOVA tests. We then tested whether poor diet (i.e., lower scores on 13 individual dietary components of the HEI-2015 and poor/suboptimal diet quality) is associated with greater biological risk. We conducted goodness-of-fit tests for the Poisson model and the results indicated that the model did not fit the data well because of overdispersion. To handle this overdispersion, we estimated negative binomial regression models. In Model 1, we controlled for age and sex because biological risk varies across these population groups (Sebastiani et al., 2016). Model two additionally controlled for socioeconomic status to examine how differences in biological risk due to diet would change with this addition as low socioeconomic status (SES) was associated with increased biological risk in previous studies (Crimmins et al., 2007; García & Ailshire, 2019; Seeman et al., 2008). In Model 3, we added controls for health behaviors (i.e., smoking and physical activity) and access to health care to determine whether dietary differences were independent of these factors based on previous studies (Bhatt & Bathija, 2018; Linneberg et al., 2015; Myers, 2003; Myers et al., 2019). Sample VBS weights provided by the HRS were applied in all analyses to account for the complex survey design and non-response (Ofstedal et al., 2011). Analyses were conducted using Stata 15.
Results
Descriptive Statistics
Demographic, socioeconomic, and health behavior characteristics by diet quality Presented as weighted percentages (N = 3734).
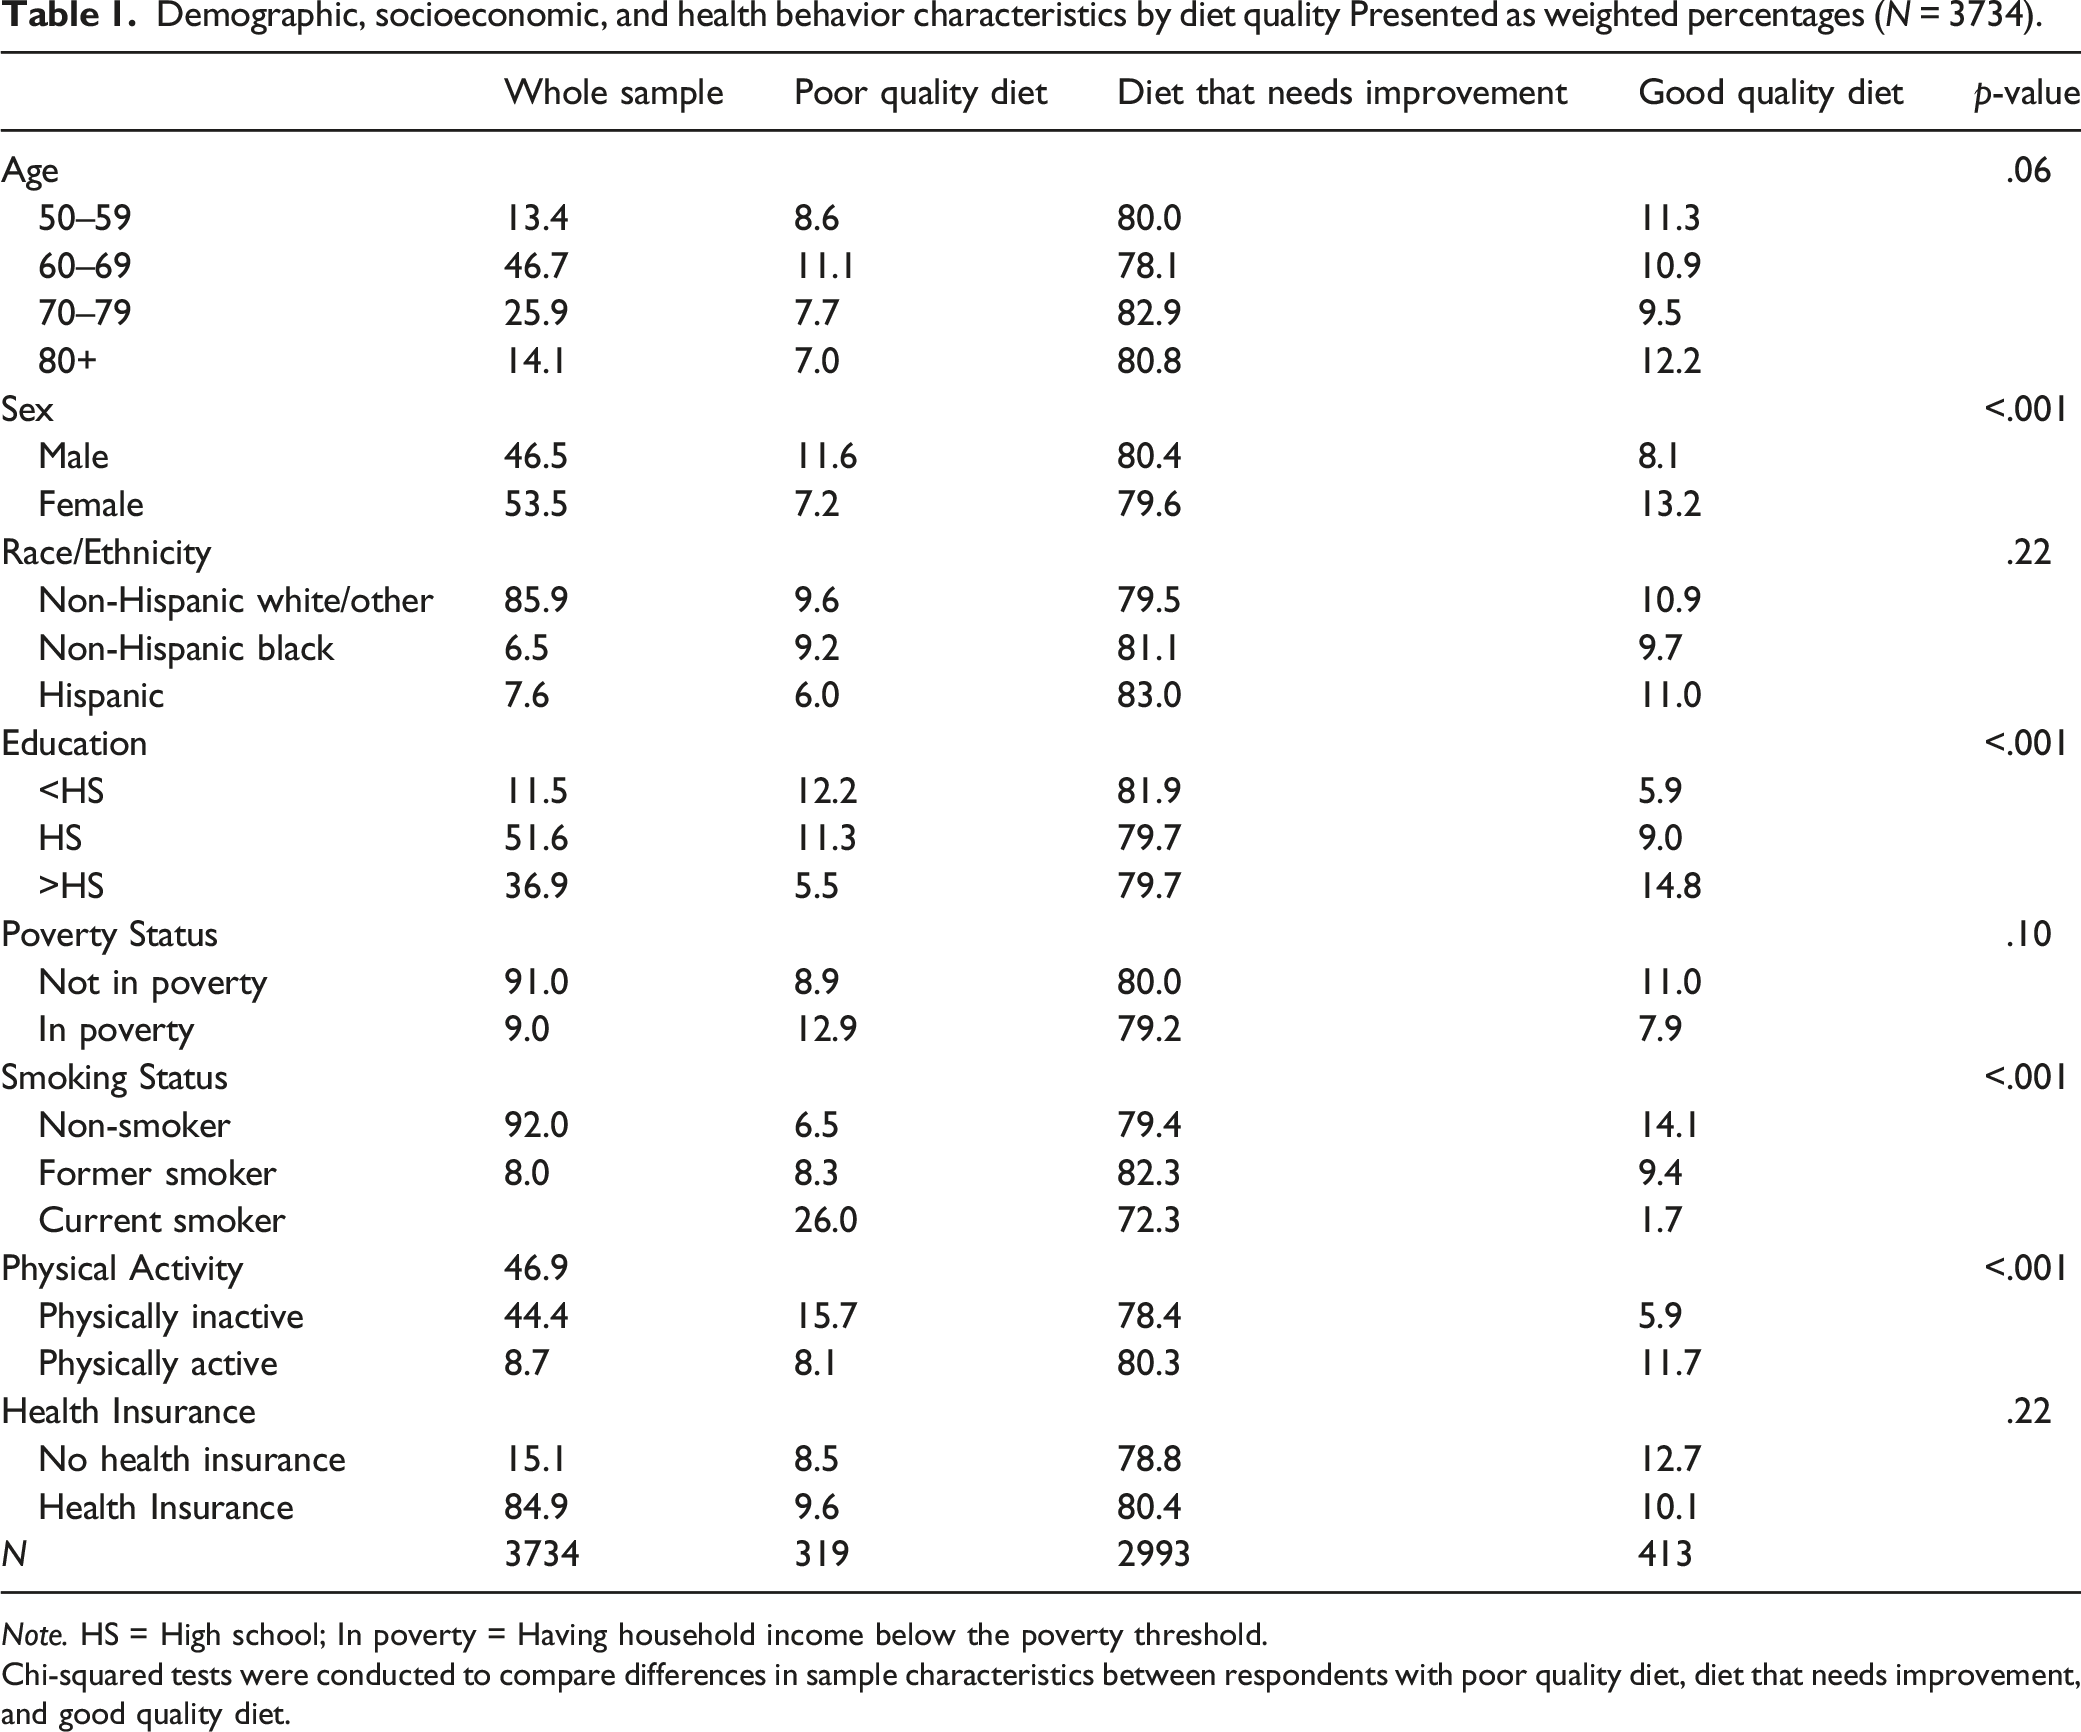
Note. HS = High school; In poverty = Having household income below the poverty threshold.
Chi-squared tests were conducted to compare differences in sample characteristics between respondents with poor quality diet, diet that needs improvement, and good quality diet.
High-Risk Categorization of Biomarkers
Percent with high-risk levels of individual biomarkers and average biological risk summary score by diet quality (N = 3734).
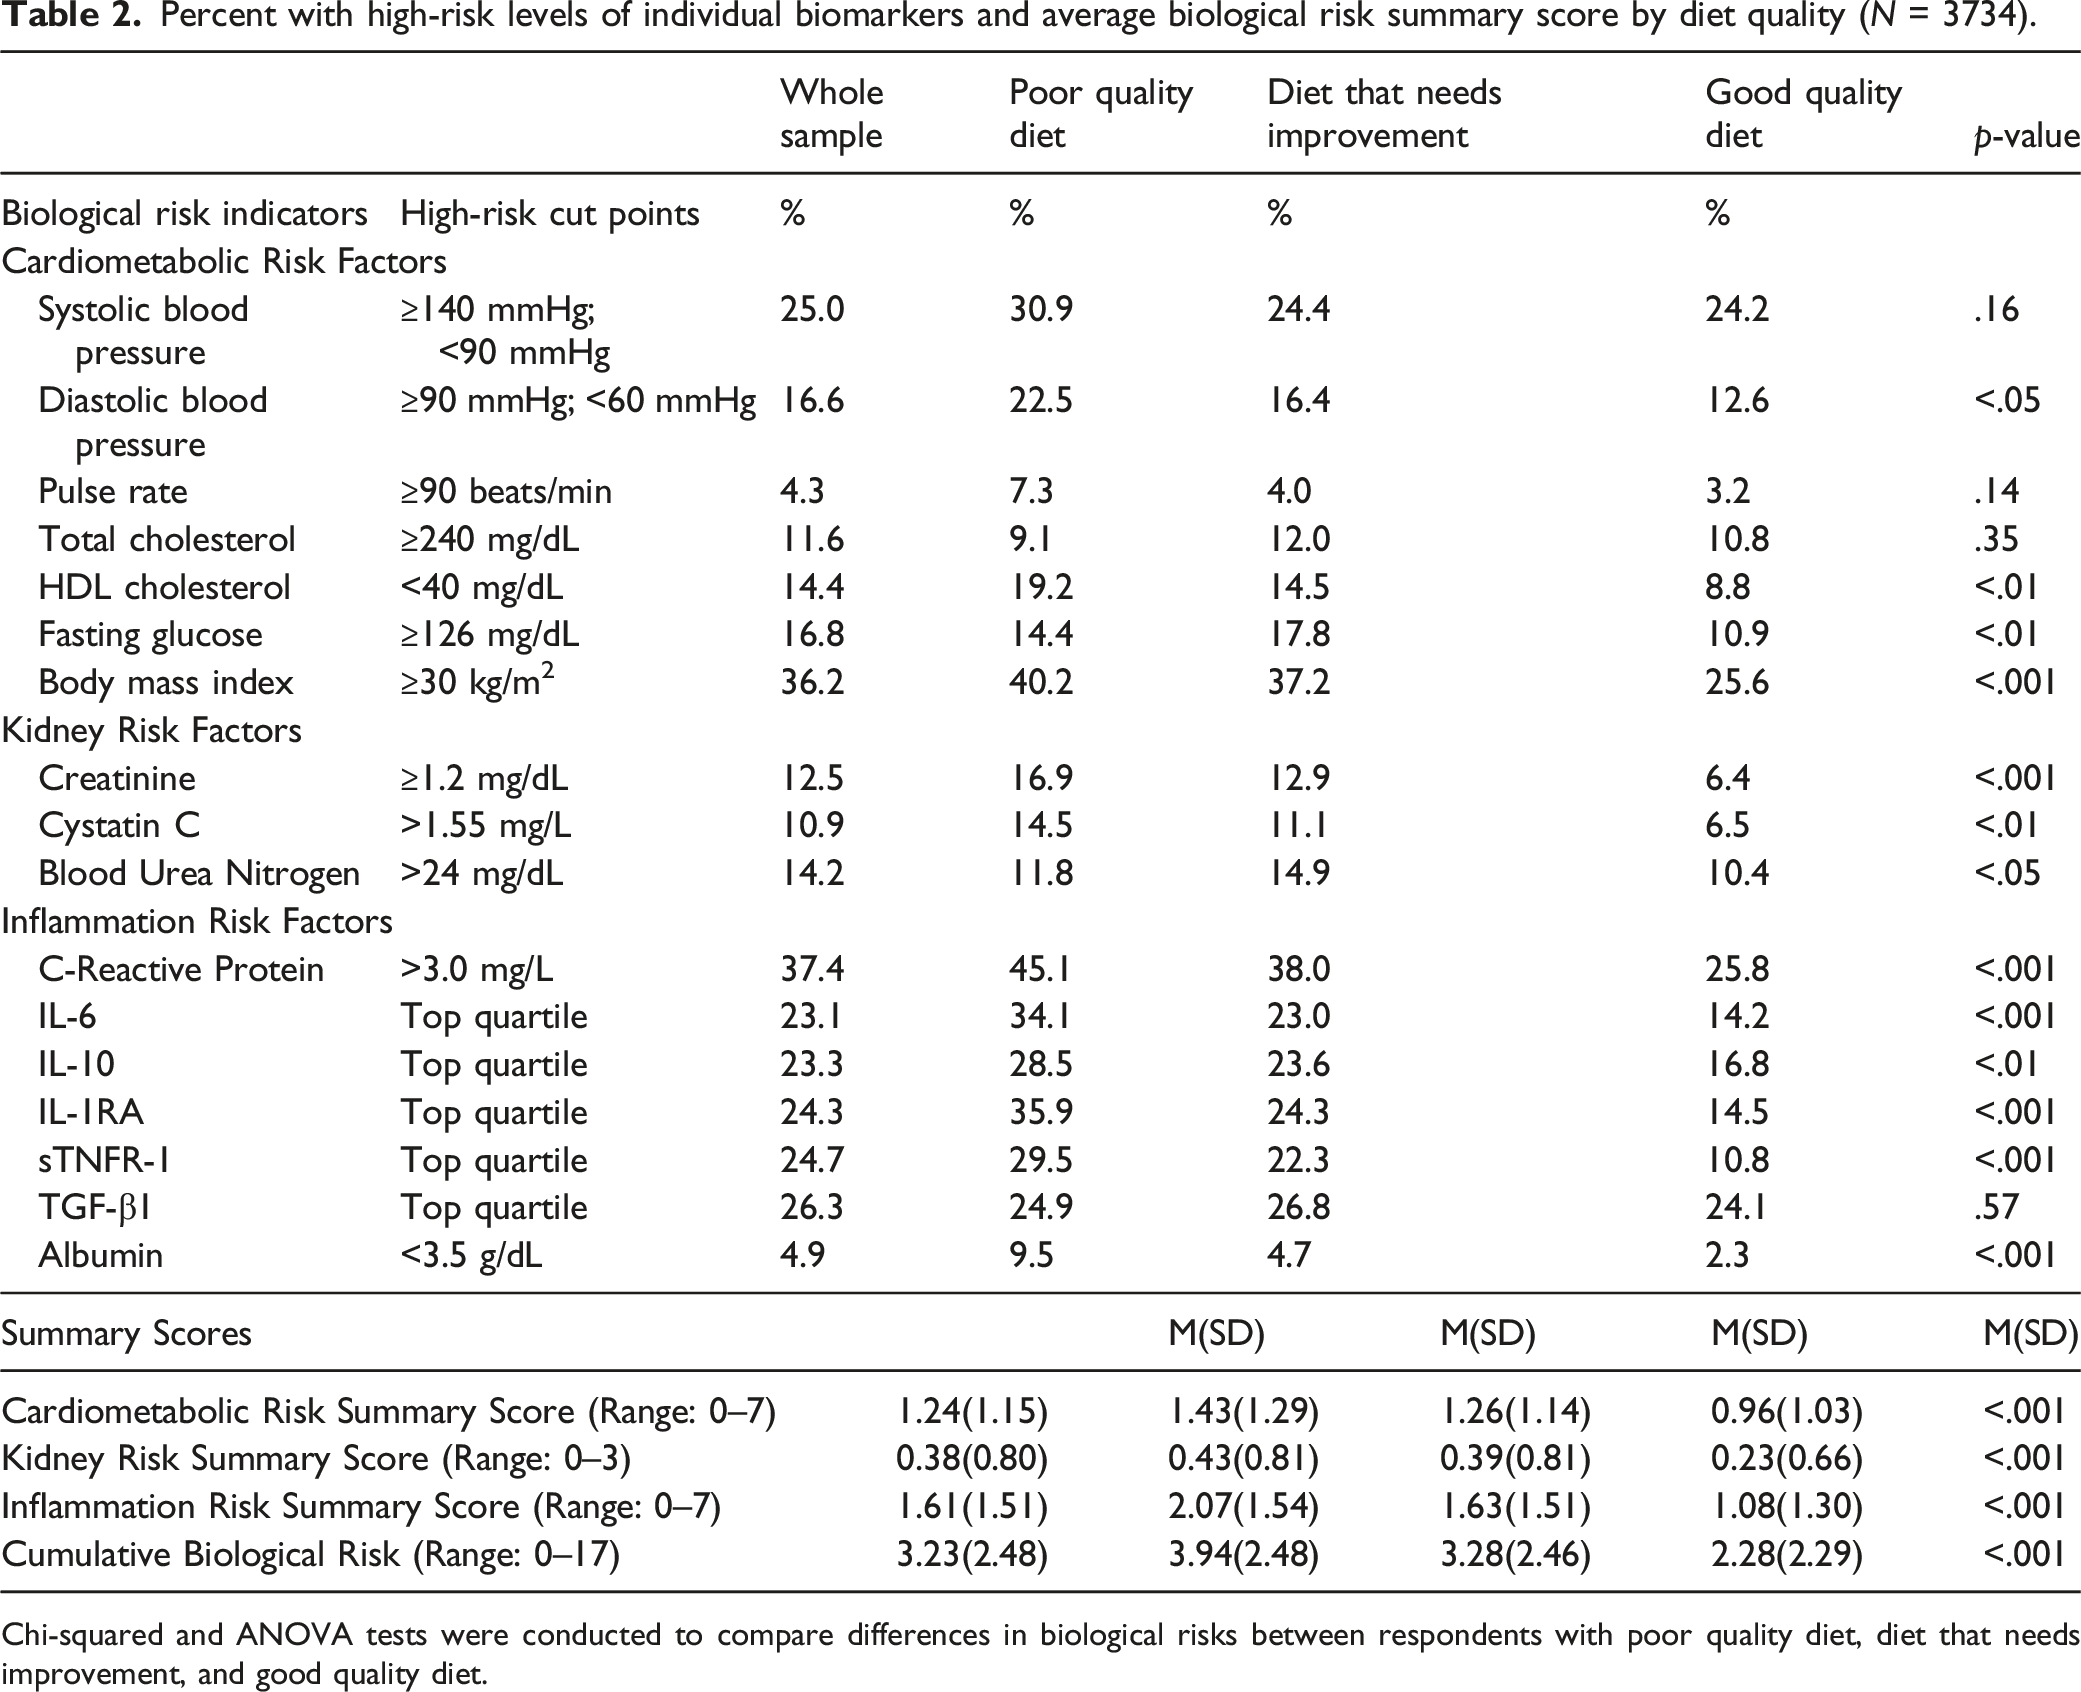
Chi-squared and ANOVA tests were conducted to compare differences in biological risks between respondents with poor quality diet, diet that needs improvement, and good quality diet.
Individual Dietary Components and Cumulative Biological Risk
Negative binomial regression of biological risk count on dietary components (N = 3734).
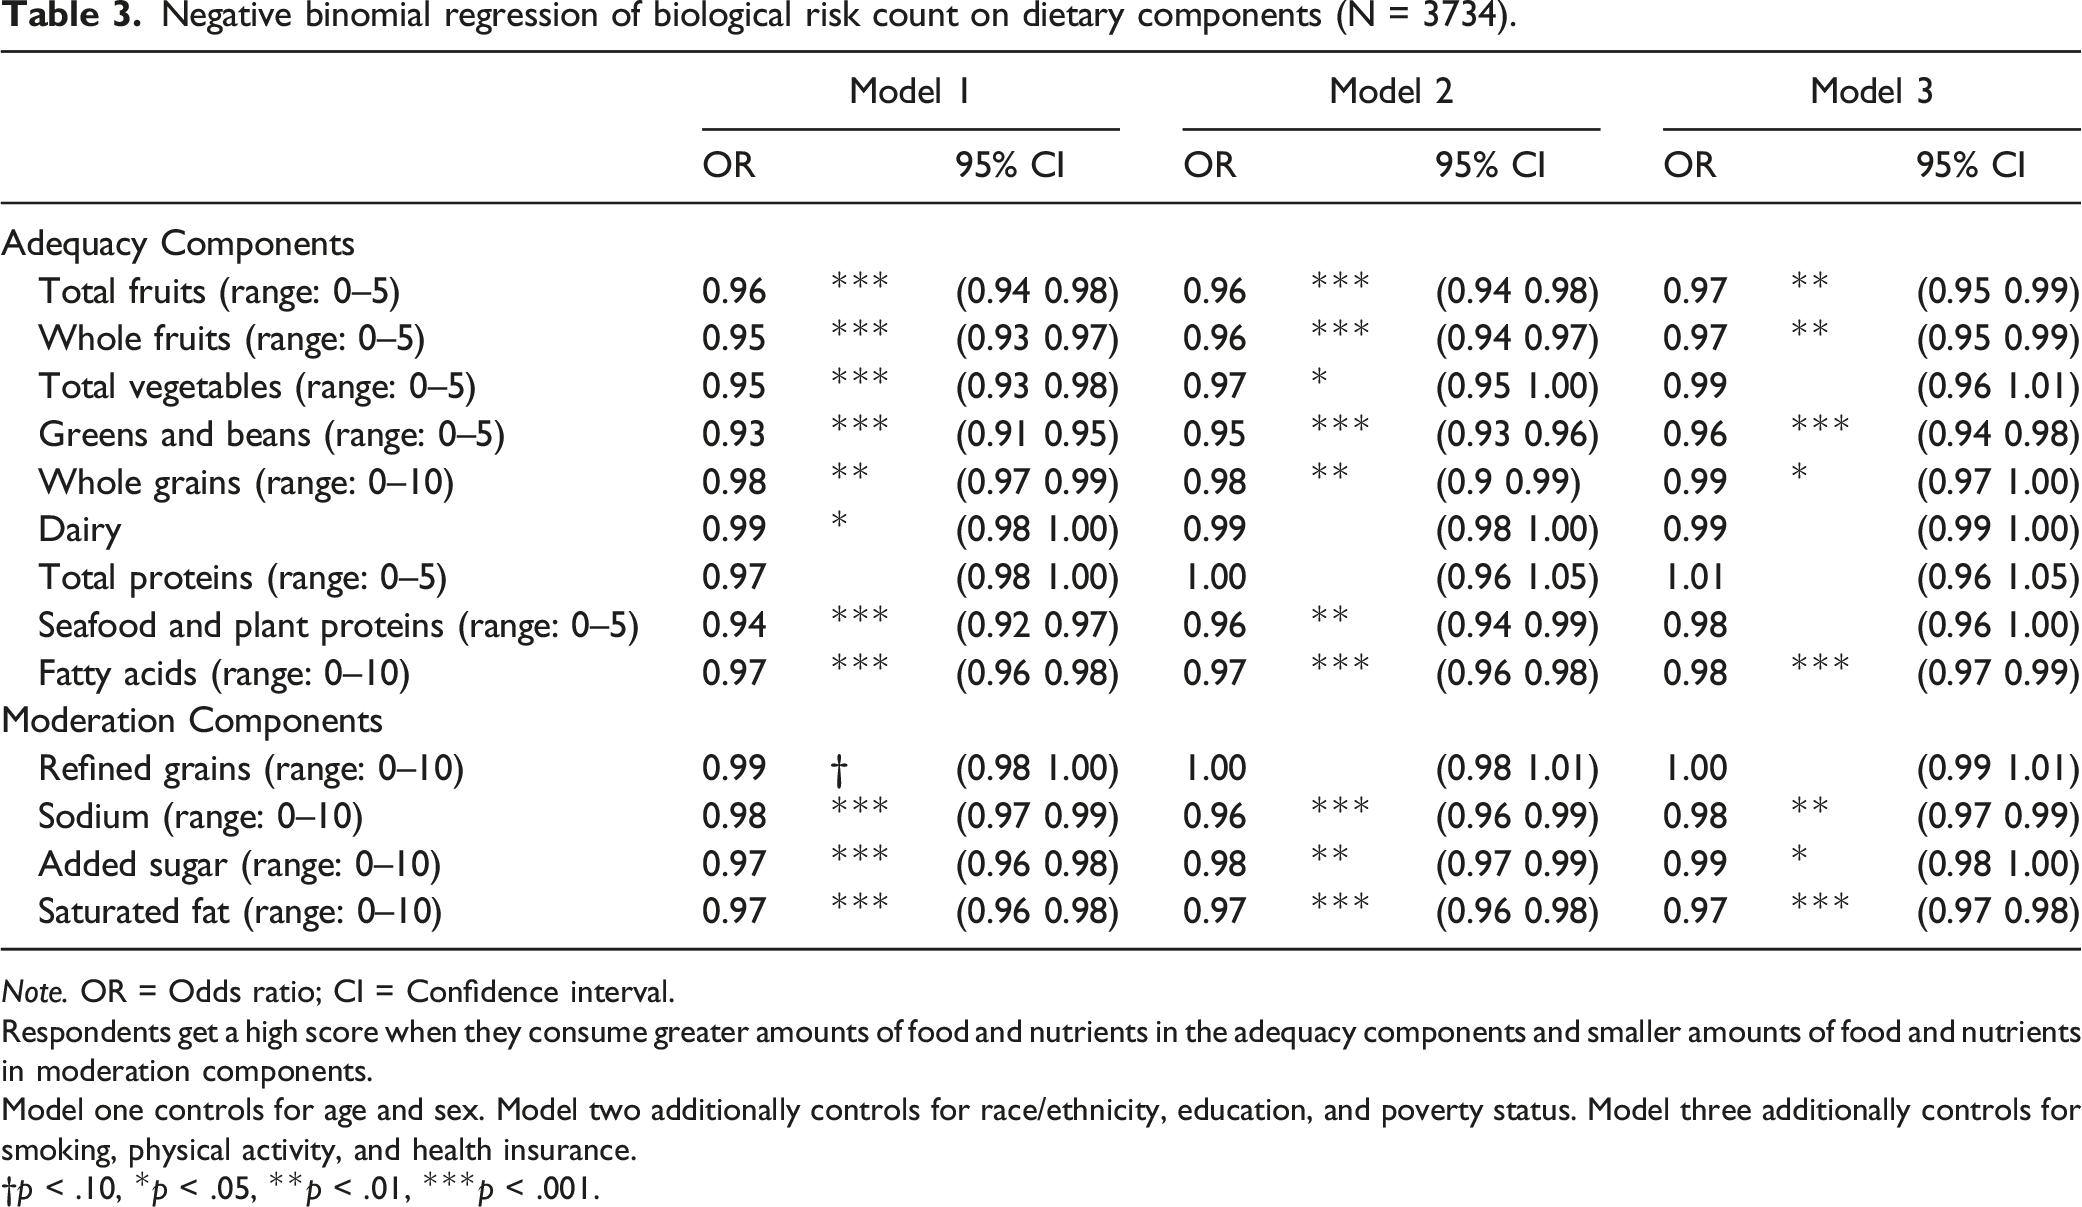
Note. OR = Odds ratio; CI = Confidence interval.
Respondents get a high score when they consume greater amounts of food and nutrients in the adequacy components and smaller amounts of food and nutrients in moderation components.
Model one controls for age and sex. Model two additionally controls for race/ethnicity, education, and poverty status. Model three additionally controls for smoking, physical activity, and health insurance.
†p < .10, *p < .05, **p < .01, ***p < .001.
Diet Quality and Cumulative Biological Risk
Negative binomial regression of biological risk count on diet quality (N = 3734).
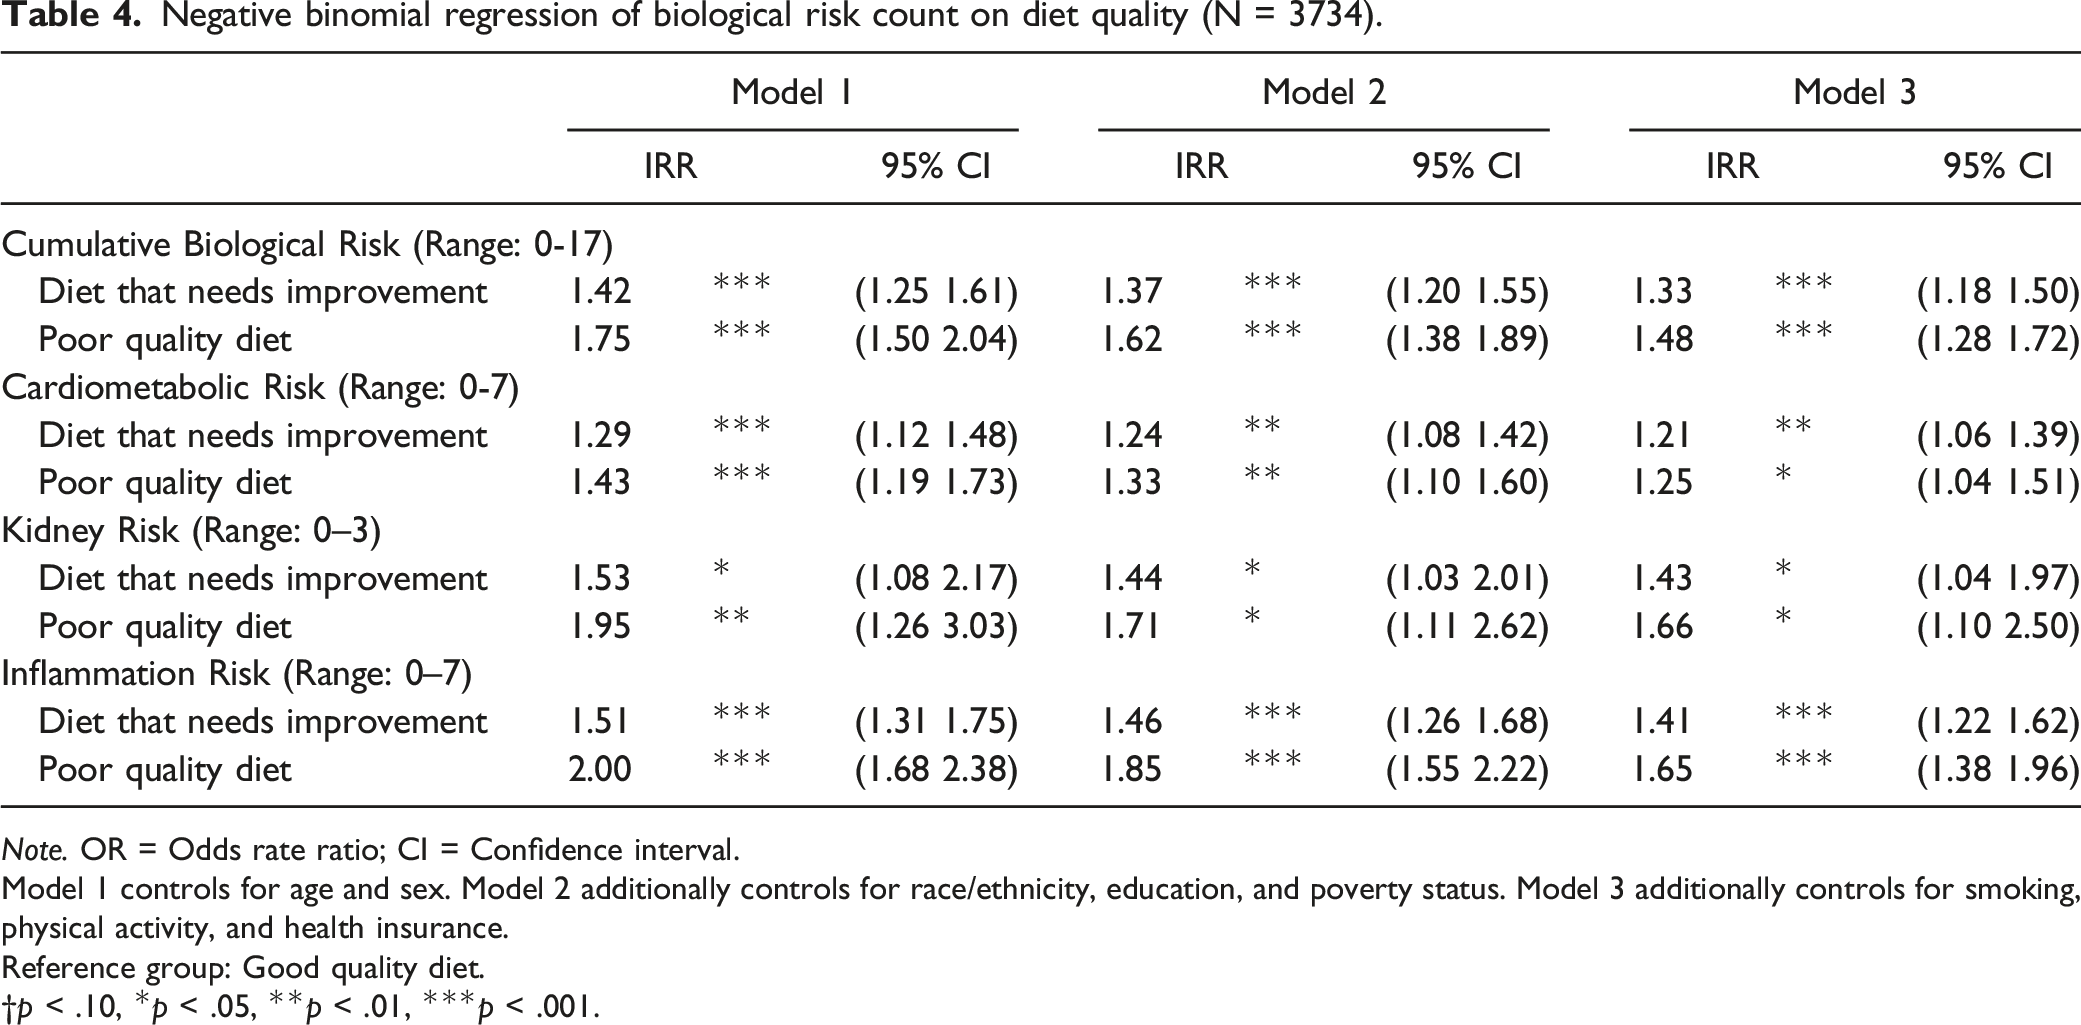
Note. OR = Odds rate ratio; CI = Confidence interval.
Model 1 controls for age and sex. Model 2 additionally controls for race/ethnicity, education, and poverty status. Model 3 additionally controls for smoking, physical activity, and health insurance.
Reference group: Good quality diet.
†p < .10, *p < .05, **p < .01, ***p < .001.
Diet Quality and Cardiometabolic Risk
In Model 1, there were significant differences in cardiometabolic risk between respondents with poor/suboptimal quality diet and those with good quality diet (see Table 4). When we included SES (Model 2), health behaviors, and access to health care (Model 3), differences in cardiometabolic risk by diet quality remained significant, such that respondents with poor quality diet and diet that needs improvement had more cardiometabolic risk than those with good quality diet.
Diet Quality and Kidney Risk
Examining kidney risk by diet quality shows that respondents with poor quality diet and diet that needs improvement had increased kidney risk compared to those with good quality diet, controlling for age and sex (Model 1) (see Table 4). Respondents with poor quality diet and diet that needs improvement continued to exhibit greater kidney risk than those with good quality diet when we included SES (Model 2) and health behaviors and access to health care (Model 3) in the model.
Diet Quality and Inflammation Risk
In Model 1, results indicate that respondents with poor diet and diet that needs improvement had increased inflammation risk compared to those with good quality diet (see Table 4). Controlling for SES (Model 2), health behaviors, and access to health care (Model 3) reduced inflammation risk for respondents with poor quality diet and diet that needs improvement, though the association between diet quality and inflammation risk remained significant.
Sensitivity Analysis
We conducted additional analyses using revised biological risk scores (i.e., cumulative, cardiometabolic, and inflammation risk), created without biomarkers that did not differ between the three diet groups (SBP, pulse rate, TC, and TGF-β1; all indicators of kidney function differ by diet quality; see Table 2). Overall, similar patterns were observed; respondents with poor quality diet and diet that needs improvement had increased cumulative, cardiometabolic, and inflammation risk than those with good quality diet [see Supplementary Material Sensitivity Analysis].
We also examined whether controlling for other potential confounders (i.e., marital status, medication use) changed the results. The pattern of results was robust to other potential confounders in the association between dietary intake and biological risk.
Discussion
A main challenge in diet and nutrition studies is the valid and reliable assessment of biological effects of diet/foods and their impact on health (Picó et al., 2019). Since biomarkers are sensitive to current health status and provide indicators of health even before the initiation of a disease state or a loss of physiological function (Crimmins et al., 2008; Picó et al., 2019), an increasing number of diet and nutrition studies are using biomarkers to assess the role of nutrition as risk factors for poor health. However, most previous studies focused on individual biomarkers or biomarkers characterizing one physiological system, such as the metabolic system, which does not take account of the multiple pathways to comorbidity and mortality. Also, comparing differences in individual biomarkers often underestimates small changes despite the fact that “small increases in multiple risk factors can lead to a substantial increase in overall risk, even if no single factor exceeds its clinically accepted threshold” (Crimmins & Seeman, 2004). Therefore, this study examined the relationship between individual dietary components, overall diet quality, and biological dysregulation using comprehensive measures of risk for diseases, mortality, and other poor health outcomes (Beckie, 2012; Guidi et al., 2021; Juster et al., 2010; Seeman et al., 2001, 2008). The use of summary scores, or multi-system approach, that incorporate biological risk factors across multiple regulatory systems has helped us to better understand the effect of diet and individual dietary components on health and highlighted the importance of diet in health and aging. In our study, poor/suboptimal quality diet is associated with increased biological risk across a range of biological systems representing cardiometabolic functioning, kidney functioning, and inflammation, which indicates increased risk of diseases, impairment, and mortality or accelerated aging (Beckie, 2012; Crimmins et al., 2008; Guidi et al., 2021; Juster et al., 2010; Seeman et al., 2001, 2004). This finding is in line with previous studies that have reported that good quality diet is associated with lower disease and mortality risk (George et al., 2014; Harmon et al., 2015; Schwingshackl & Hoffmann, 2015). Previous studies have also reported that healthy diet was inversely associated with biomarkers of cardiometabolic risk, including SBP, DBP, TC, HDL cholesterol, glucose, and BMI, and inflammation risk, including CRP and IL-6 (Akbaraly et al., 2015; Chrysohoou et al., 2004; Corley et al., 2015; Hart et al., 2021; Kant & Graubard, 2005).
Respondents with poor quality diet had a higher level of biological risk compared to those with good quality diet. Our findings of higher biological risk for older adults with poor quality diet are consistent with other studies that found an association between diet and health. Even after controlling for SES, health behaviors, and access to health care, respondents with poor quality diet and diet that needs improvement still exhibited a greater biological risk than those with good quality diet, affirming diet as an important risk factor for health.
However, differences in biological risk were substantially reduced after controlling for SES, health behaviors, and access to health care. This finding suggests that these factors played a role in the relationship between diet and biological risk. Previous studies have reported the importance of non-smoking or quitting smoking and physical activity in preventing cardiometabolic diseases (CMD) (Carnethon, 2009; Freisling et al., 2020; Korhonen et al., 2011; Myers et al., 2019; Sossa et al., 2013). Access to health care also has been identified as a protective factor for the development of CMD because it provides preventive services (e.g., screenings and check-ups) and disease treatment and management programs (e.g., medication) (Brooks et al., 2010; Glantz et al., 2020). Therefore, promoting health behaviors, including smoking cessation and physical activity, and increased access to health care may reduce biological risk among older adults with poor quality diet.
Among 13 individual dietary components of the HEI-2015, most dietary components were associated with cumulative biological risk. High scores on fruits, greens and beans, whole grains, fatty acids, sodium, added sugar, and saturated fat, which indicate a high intake of fruits, greens and beans, whole grains, and fatty acids and a low consumption of sodium, added sugar, and saturated fat, were significantly associated with a lower biological risk even after controlling for SES, health behaviors, and access to health care. Our finding is consistent with previous studies that found an association between these dietary components and morbidity and mortality from major chronic diseases. For example, GBD 2017 Diet Collaborators reported that low intake of whole grains and fruits and high intake of sodium were the leading dietary risk factors for deaths and disability-adjusted life-years in many countries, including the United States (Afshin et al., 2019). Previous studies also have reported that adults with low intake of fruits, vegetables, whole grains, fatty acid, and high intake of sodium and added sugar are more likely to develop chronic diseases, including heart disease, stroke, and type 2 diabetes (Afshin et al., 2019; Aune et al., 2016; Fung et al., 2001; Micha et al., 2017; Wang et al., 2016; Yu et al., 2016). These dietary components (e.g., fruits, leafy green vegetables, whole grains, and seafood) were also associated with lower levels of CRP and IL-6 (Nanri et al., 2008; Nettleton et al., 2006; Smidowicz & Regula, 2015). This finding suggests that intake of these dietary components may reduce the risk for poor health and diseases. Therefore, the inclusion of these dietary components as well as potential synergistic, additive, and antagonistic interactions among them should be considered when developing dietary guidelines or interventions.
Limitation
Although the present study’s multi-system viewpoint allowed a better understanding of the relationship between diet and health, it is not without limitations. First, we linked sociodemographic and health information of 2016 with dietary intake and nutrition information collected in 2013 because the HRS collected venous blood samples for the first time in 2016 and dietary intake and nutrition information was collected only once in 2013. Although dietary pattern usually does not change much within a short period of time (Chapman & Ogden, 2009; Shepherd, 2002), there is a potential discrepancy in dietary intake due to the three-year difference. Second, dietary intake was assessed based on the average intake of food and nutrients during the past 12 months, reported by study participants. This may have introduced recall bias and/or response bias into this study and the results may not reflect actual dietary intake. Third, poor dietary intake may follow declines in health, but because we did not have longitudinal data on dietary intake and biological risk we could not assess the directionality of the relationship. Future studies are needed that use longitudinal data to explore the causal relationship between diet quality and biological risk. Lastly, the HEI-2015 is based on the Dietary Guidelines for Americans (U.S. Department of Health and Human Services and U.S. Department of Agriculture, 2015), which use different measurement units from the HRS HCNS. To minimize potential bias, we converted the measurement units based on the guidelines and compared the results with the National Health and Nutrition Examination Survey (NHANES), which has been collecting information on diet and nutritional status through 24-hour recall method using the same measurement unit with the Dietary Guidelines. Among the 12 food groups and nutrients, the mean intake of five—fruits, vegetables, whole grains, total protein, and saturated fat—did not differ significantly between the HRS respondents and the 2011–2014 NHANES respondents. The HRS respondents seem to have a slightly healthier diet; they consumed more greens and beans, dairy, seafood, and plant protein, and a smaller amount of fatty acids, refined grains, and sodium than the NHANES respondents. The HRS and HNAES used the same measurements units for dairy, fatty acids, sodium, added sugar, and saturated fat. Differences in dietary intake may be because of data collection methods not because of conversion.
Conclusion
Our study establishes clearly that poor diet is associated with multiple physiological regulatory systems as well as risk for poor health outcomes in a nationally representative sample of older Americans. Although there was an improvement in diet during the past decades, diet quality in the United States remains poor (Wang et al., 2015). By improving diet quality, disease burden and mortality due to poor diet would be reduced.
Supplemental Material
sj-pdf-1-jah-10.1177_08982643211046818 – Supplemental Material for Diet Quality and Biological Risk in a National Sample of Older Americans
Supplemental Material, sj-pdf-1-jah-10.1177_08982643211046818 for Diet Quality and Biological Risk in a National Sample of Older Americans by Yeon Jin Choi, Jennifer A. Ailshire, Jung Ki Kim and Eileen M. Crimmins in Journal of Aging and Health
Footnotes
Declaration of Conflicting Interests
The author(s) declared no potential conflicts of interest with respect to the research, authorship, and/or publication of this article.
Funding
The authors disclosed receipt of the following financial support for the research, authorship, and/or publication of this article: This work was supported by the National Institute on Aging of the National Institutes of Health (T32-AG000037; P30 AG017265).

Supplemental Material
Supplemental material for this article is available online.
References
Supplementary Material
Please find the following supplemental material available below.
For Open Access articles published under a Creative Commons License, all supplemental material carries the same license as the article it is associated with.
For non-Open Access articles published, all supplemental material carries a non-exclusive license, and permission requests for re-use of supplemental material or any part of supplemental material shall be sent directly to the copyright owner as specified in the copyright notice associated with the article.
