



Abstract
Introduction
Regular physical activity (PA) confers a range of health benefits for older adults, including reduced risk of developing heart disease, stroke, Type 2 diabetes, and some cancers (Nelson et al., 2007). Despite the well-documented health benefits of regular PA in older adults (Bauman, Merom, Bull, Buchner, & Fiatarone Singh, 2016; Riebe et al., 2009; Vogel et al., 2009), the prevalence of regular participation in PA is low among them. For instance, in Japan, less than half of older adults aged 65 years and older (46% of men and 39% of women) met the Japanese guidelines, which recommend engaging in exercise (including walking) for at least 30 min two or more times per week (Ministry of Health Labour and Welfare of Japan, 2017). Similarly, a low proportion of older adults meet the PA recommendations (at least 150 min/week of moderate-intensity activity) in the United States (Keadle, McKinnon, Graubard, & Troiano, 2016). Therefore, increasing PA among older adults is a public health priority.
Walking is a convenient, safe, and the most common form of PA among older adults (Australian Bureau of Statistics, 2016; Stathokostas, Theou, Little, Vandervoort, & Raina, 2013). Various walking promotion initiatives for older adults, focusing on individual-level factors such as education, motivation, and goal setting, have been implemented (Harkins, Kullgren, Bellamy, Karlawish, & Glanz, 2017; Notthoff & Carstensen, 2014). Such promotion programs are generally known to be effective during the program period, but less successful in sustaining long-term behavioral changes (Marcus et al., 2000). They also tend to work only for a relatively small number of program participants who are interested in being active. An alternative approach is needed to assist the broader community to engage in walking on a long-term basis.
To promote long-term maintenance of walking more effectively, it is necessary to target multilevel factors influencing walking, including social, environmental, and policy factors. This approach, which is based on the ecological model of health behavior, is increasingly used as a framework to guide PA interventions (Sallis & Owen, 2015). Including environmental components in interventions can be promising as making a local neighborhood easier to walk may help many residents in the area to be active on a long-term basis. Some interventions involving environmental improvements were found effective in increasing residents’ walking (Baker, Francis, Soares, Weightman, & Foster, 2015). For instance, a community-wide intervention targeting African American communities, consisting of enhancing walking trails (removing structural barriers and addressing aesthetic concerns), resulted in increased attendance of trail walking (Wilson et al., 2015). Another intervention conducted in China, where building parks and walking trails was part of the intervention, produced a significant increase in PA (Lv et al., 2014). These studies suggest that improving pedestrian environments may be an effective strategy to encourage walking at the community level.
However, the ability to modify pedestrian environments is limited by the local government’s policies and budget. In this context, attempts to influence residents’ perceptions of local environments may provide some leverage. It is possible that residents are not aware of opportunities for walking in their neighborhood. Research has consistently shown that residents’ perceptions of their neighborhood often do not match objectively assessed environmental characteristics (Cerin et al., 2018; Koohsari et al., 2015), suggesting that they have limited or biased knowledge about their surroundings. In light of the relevance of environmental factors such as pedestrian infrastructure, safety, and aesthetics to older adults’ walking (Barnett, Barnett, Nathan, Van Cauwenberg, & Cerin, 2017), providing older adults with information about locations suitable for walking may encourage their walking. Studies suggest the potential utility of walking maps in improving participants’ intention to walk and awareness of facilities available (McNeill & Emmons, 2012; Nykiforuk, Nieuwendyk, Mitha, & Hosler, 2012).
One of the social strategies to promote walking is to organize walking events, where a group of peers meet and interact while engaging in recreational walking. Walking in a group can help people maintain their engagement in walking partly through social support they receive (Raine, Roberts, Callaghan, Sydenham, & Bannigan, 2016). A meta-analysis of 19 intervention studies on group walking has found that walking group interventions are efficacious at increasing PA levels (Kassavou, Turner, & French, 2013). It is a popular way of encouraging inactive adults to become active. Various charity organizations, such as American Volkssport Association, Walking for Health (United Kingdom), and National Heart Foundation (Australia), organize or support walking clubs.
Combining walking maps with walking groups may achieve synergetic effects in promoting walking in older adults. To date, one study has examined the joint impact of walking maps and walking events on older adults. Rosenberg et al. (2012) compared two walking interventions: standard (typical walking intervention involving goal setting, self-monitoring) and enhanced (additional components of walking maps and group walking). They found that both groups increased step counts, but these increases did not differ significantly (Rosenberg et al., 2012). Further research with a control group is needed to accurately assess the effect of the joint provision of walking maps and events in older adults’ walking.
This study evaluated (a) the effect of a community-wide walking intervention for Japanese older adults using walking maps and group events on walking frequency and duration and (b) the effects of the intervention on metrics of environmental perceptions, in comparison with a control site where no special PA promotion was conducted. We hypothesized that the participants at the intervention site would increase their walking frequency and duration, and improve their environmental perceptions in relation to walking, relative to those in the control site.
Method
Study Design and Settings
A nonrandomized quasi-panel study was conducted in 2016 to 2018, targeting older adults (aged 65-84 years) living in Oiso, Kanagawa Prefecture. The quasi-panel design randomly samples individuals from the population multiple times and examines the aggregated measures of each sample (de Vaus, 2014). Oiso is a regional city about 70 km west of Tokyo (population: 31,417 as of January 2016). Within the city of Oiso, the Kokufu-Shinshuku area was chosen as the intervention site, whereas the Koma/Higashi-machi area was the control site. The primary consideration for the site selection was geographical separation of two sites to avoid contamination of the intervention. The chosen sites are at either end of Oiso, with the straight distance between them about 6 km and each site having its own commercial/service area. The Oiso health promotion unit also assisted the researchers with identifying localities where a higher compliance could be expected based on their past experiences of health promotion activities. Population density was 30.4 persons/ha in Kokufu-Shinshuku and 44.4 persons/ha in Koma/Higashi-machi.
Study Protocol
Details of the trial protocol based on the Transparent Reporting of Evaluation with Nonrandomized Designs statements can be found elsewhere (Okamoto et al., 2016). All residents aged 65 to 84 years living in the intervention (N = 855) and control sites (N = 1,092) received a postal invitation to take part in the study in February 2016. Those who agreed to participate received a survey questionnaire. The baseline survey was completed in March 2016 by 333 participants in the intervention site (response rate [RR] = 39%) and by 452 participants in the control site (RR = 41%). The same data collection process was repeated in February 2018. All residents aged 65 to 84 years living in the intervention (N = 849) and control sites (N = 1,120) were invited again. The follow-up survey was completed in March 2018 by 293 participants in the intervention site (RR = 35%) and by 506 participants in the control site (RR = 45%). Ethical approval was obtained from the Tokai University Ethics Committee (No. 15122, 17110). Informed consent was obtained from all participants who agreed to participate in the surveys.
Intervention
The intervention consisted of delivering walking maps and organizing walking events. During the 21-month period (from May 2016 to January 2018), all households in the intervention site (about 1,200 households) received a walking map every month (21 maps in total). Walking maps were distributed using an information circulation system commonly used to share information within a local community in Japan. Monthly walking events were organized to follow the routes of the corresponding monthly map. Each walking map specified the meeting place and time of the walking event. No special PA promotion was implemented in the control site during the study period, except for the routine health promotion activities (e.g., focusing on nutrition, food safety, smoking cessation) by the local health promotion unit. Figure 1 shows the timeline of the study.

Timeline of the study.
Walking map
Each walking map was developed in collaboration with the researchers of this study and community leaders of Kokufu-Shinshuku. The researchers assessed potential walking routes based on the ease of walking (e.g., sidewalk continuity and condition, barriers, step/slope), safety (e.g., separation from traffic), amenity (e.g., benches), and aesthetics (e.g., views, vandalism). The proposed walking routes were checked by the community leaders for their suitability for walking by older adults. Most of the 21 walking maps had a loop walking route, with the route length ranging from 0.8 to 2.4 km (average = 1.3 km). Most walking routes intersected or ran along a park to introduce places to visit for walking or for recreational activity. Each walking map was printed on an A4 size paper using a large font size and high-contrast color scheme. Additional information such as photographs, benefits of being physically active, and comments on features of the route were included to make the map more appealing (see Supplementary Figure 1).
Walking event
We held a monthly walking event in which the group walked the route depicted in the map (with an extended route in some months). Details of the event were announced when the walking map was distributed. The event was led by the research staff of this study, volunteer university students, and some community leaders. Event participants were given a cap prepared for the event to create a sense of belonging and encourage continued participation. Some activities (light exercise, games) were held in a park along the walking route to facilitate social interaction. The mean number of event participants was 27 (range = 21-38).
Measures
Walking
Walking frequency and duration were the main outcomes of this study. They were self-reported using the Japanese version of the International Physical Activity Questionnaire (IPAQ) Short Form, which measures PA with acceptable reliability and validity (Murase, Katsumura, Ueda, Inoue, & Shimomitsu, 2002). The question on walking frequency asked, “During the last 7 days, on how many days did you walk for at least 10 minutes at a time?” The question on walking duration asked, “How much time did you usually spend walking on one of those days?” Walking frequency and duration were expressed as times/week and min/day, respectively.
Perceived local environmental attributes
Perceived local environmental attributes were the secondary outcome of this study. We postulated that environmental perceptions may improve after the intervention of walking maps and events. They were assessed using the International Physical Activity Questionnaire–Environmental Module (IPAQ-E), which is known to have acceptable reliability and validity (Inoue et al., 2009). We used eight items (three core items, three recommended items, and two optional items) that are potentially relevant to the intervention (Supplementary Table 1). For each item, participants were asked to indicate their level of agreement, with the response options ranging from 1 (“strongly disagree”) to 4 (“strongly agree”). These items were used to measure four different aspects of neighborhood environments: pedestrian infrastructure (three items), safety (three items), aesthetics (one item), and awareness of others being active (one item). These dimensions were chosen, as they were known to be associated with older adults’ walking in the literature (Barnett et al., 2017; Corseuil Giehl, Hallal, Brownson, & d’Orsi, 2017; Sugiyama, Cerin, Mridha, Koohsari, & Owen, 2018). The average score on the relevant items was used to quantify each multi-item measures, whereas the raw score was used for single-item measures.
Reach of intervention
We asked participants whether they were aware of the walking maps and walking events at follow-up at both sites. The response options for the awareness of walking maps (“Do you know that a walking map was distributed every month at Kokufu-Shinshuku?”) were “Yes” or “No.” The response options for walking events (“Do you know of or have you participated in a walking event organized every month at Kokufu-Shinshuku?”) were “Yes and participated (at least once),” “Yes but not participated,” and “No.”
Covariates
Participants reported age, gender, weight and height (from which body mass index [BMI] was calculated), education level (<12 years, ≥12 years), living arrangement (living alone, living with other(s)), work status (working, not working), and self-rated health (four response options collapsed into not good, good). We also asked whether they required assistance for daily living activities to exclude participants with disabilities.
Statistical Analyses
To evaluate the effectiveness of the intervention, the changes in the outcomes from baseline to follow-up were compared between the intervention and control sites, following previous studies with the same panel design (Saito et al., 2018; Snyder & Anderson, 2005). Walking frequency (count outcome) was analyzed using generalized linear models (GLMs) with a log link function and negative binomial distribution. Because walking duration had a positively skewed distribution, it was analyzed using GLMs with a log link function and gamma distribution. Perceived local environmental attributes were mostly normally distributed. They were analyzed using GLMs with an identity link function and normal distribution.
To examine whether the magnitude of change differed between the intervention and control sites, we used the interaction term between the sites and the time of measurement (baseline or follow-up) as a predictor. The coefficient for the interaction term indicated to what extent the intervention site “improved” from baseline to follow-up in comparison with the control site (Snyder & Anderson, 2005). We conducted analyses stratified by gender as the intervention may work differently between men and women. We also examined the extent to which significant intervention effects on perceived local environmental attributes (if any) explained (i.e., mediated) intervention effects on walking outcomes. This was done using the joint significance test of mediation (Cerin et al., 2018); hereby, a perceived environmental attribute would be considered a mediator of the intervention effect on walking if (a) a significant site by time interaction effect is observed on a specific perceived environmental attribute and (b) a significant perceived environmental attribute by time interaction effect is observed on the walking outcome. All models were adjusted for age, gender, BMI, education level, living arrangement, work status, and self-rated health.
For the follow-up sample, we also compared walking frequency and duration between those who knew of the walking maps and those who did not, and between those who participated in the walking event (at least once) and those who did not. These analyses included participants of the intervention and control sites. Analyses were conducted using SPSS version 24 (IBM, Armonk, NY). Statistical significance was set at p < .05.
Results
Table 1 shows the baseline and follow-up characteristics of participants in the intervention and control sites. After excluding participants who required assistance for daily living activities (baseline: n = 49; follow-up: n = 41) and those who had missing data in the outcomes and demographic variables (baseline: n = 86; follow-up: n = 69), the number of participants retained for analysis was 273 at baseline and 241 at follow-up in the intervention site, and 377 at baseline and 448 at follow-up in the control site. No significant differences in the sociodemographic characteristics were found between the intervention and control sites at both time points, with the exception of educational attainment, which was lower among participants in the intervention site relative to the control site. Supplementary Table 2 shows the demographic characteristics of those who were retained and removed from analyses. The two groups differed only in age: Those excluded were older than those retained both at baseline and follow-up.
Sample Characteristics at the Intervention and Control Sites at Baseline and Follow-Up.
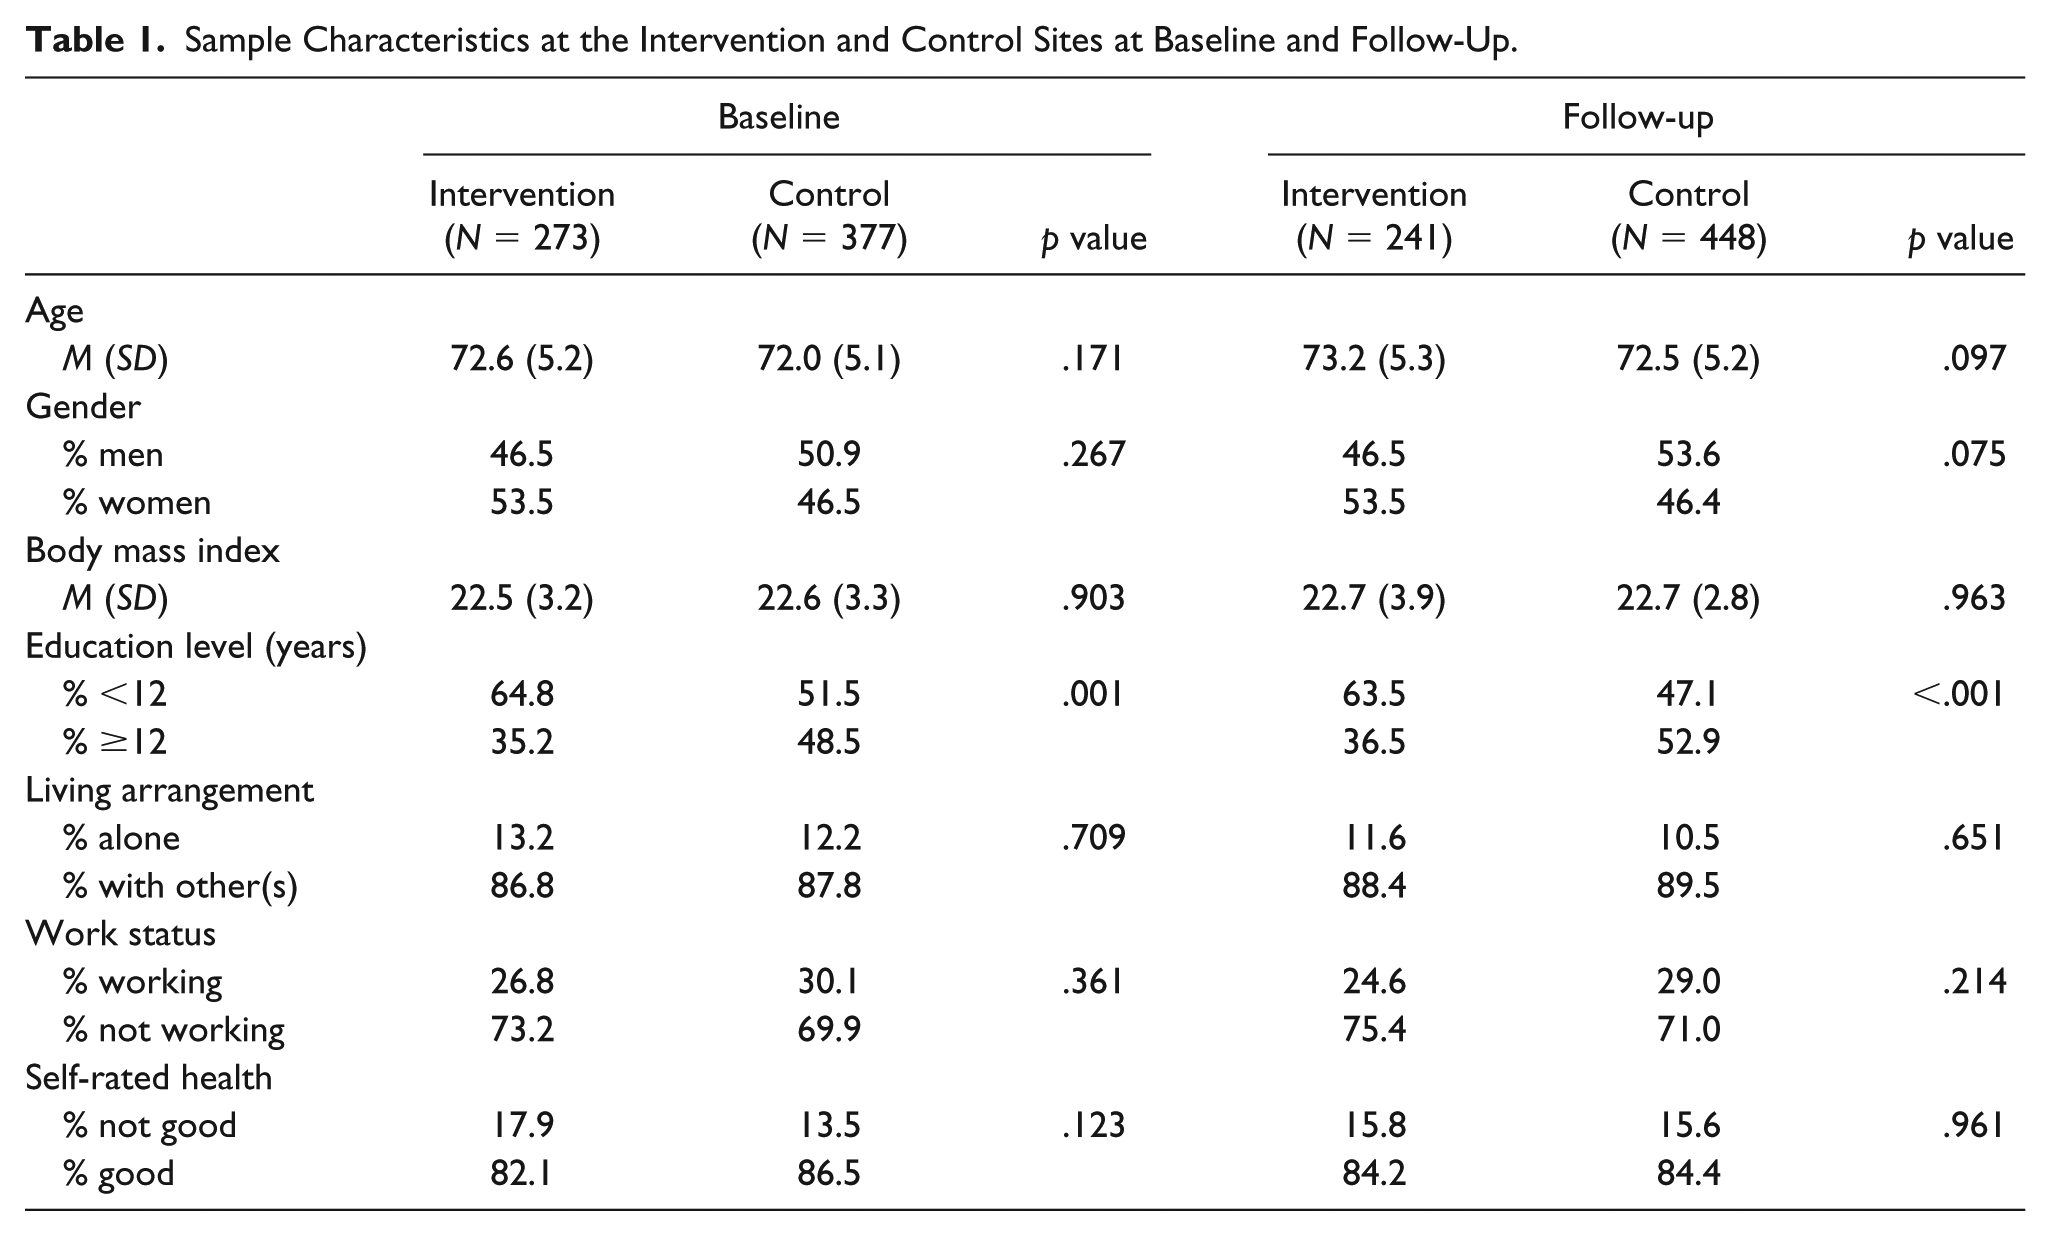
With regard to the reach of the intervention, 87% of participants in the intervention site at follow-up reported that they knew of the walking maps (11% did not know, 2% missing). In the control site, 3% of participants knew about the walking maps (94% did not know, 3% missing). For walking events, 15% of participants in the intervention site took part at least once and 70% of them knew of the events (12% did not know, 3% missing). In the control site, 0.2% of participants took part at least once and 5% of them knew about the walking events (90% did not know, 5% missing). These results suggest that the intervention was mostly contained in the intervention site.
Table 2 shows each outcome measure and its change from baseline to follow-up by site. None of the changes were statistically significant. However, walking frequency and duration decreased slightly from baseline to follow-up in the intervention site. Walking frequency remained the same, but duration increased slightly in the control site. Environmental perceptions changed little, but the awareness of others being active increased slightly in the intervention site.
Outcome Measures and Their Changes From Baseline to Follow-Up for the Intervention and Control Sites.
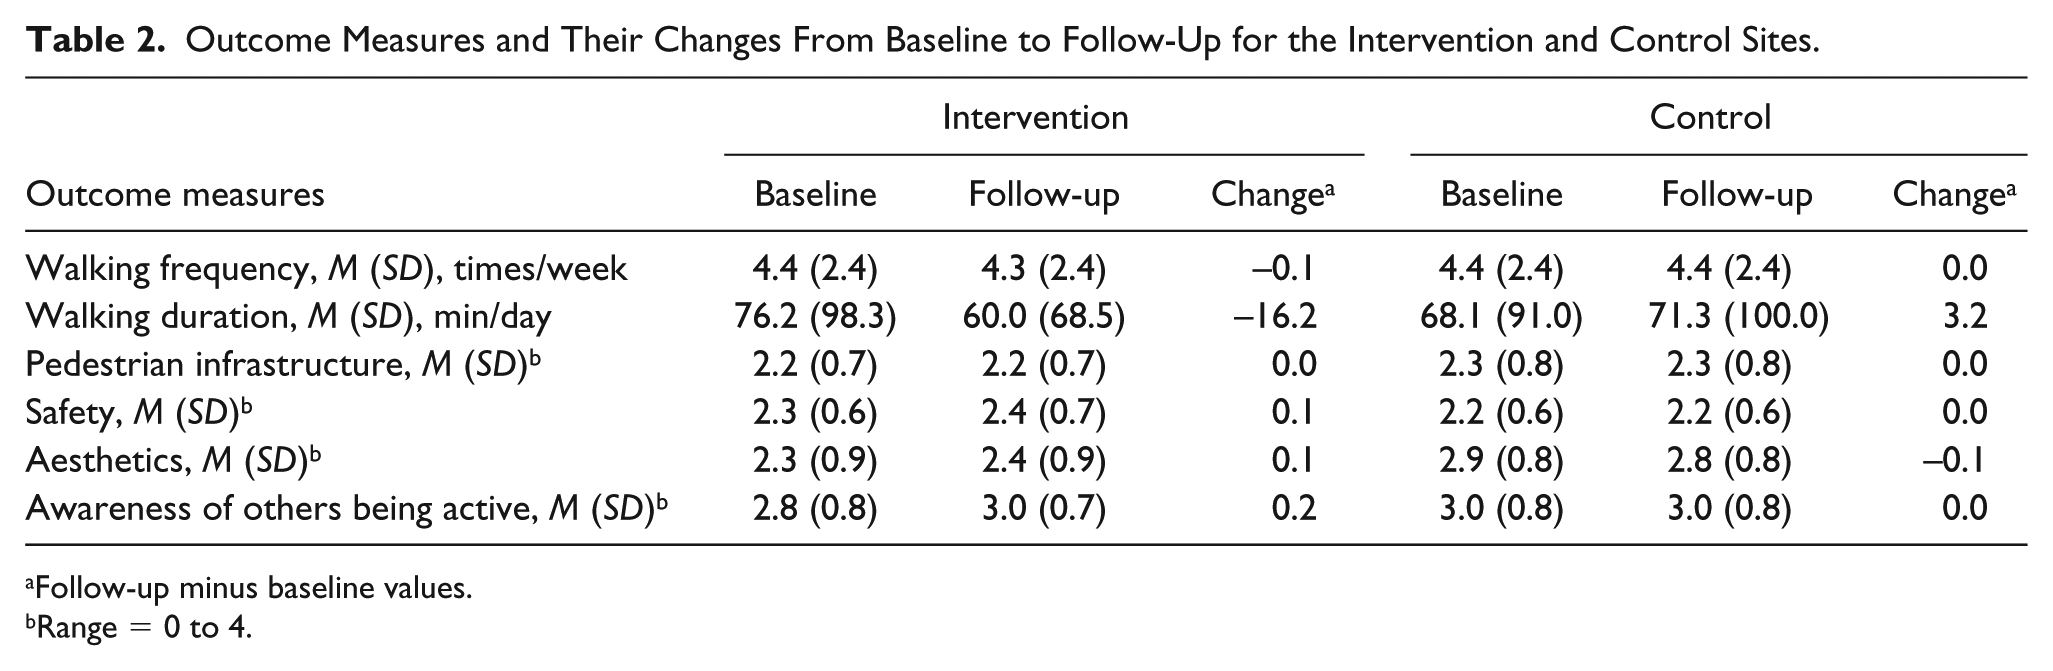
Follow-up minus baseline values.
Range = 0 to 4.
Table 3 shows the regression coefficients of the interaction terms between the sites and the time of measurement, which can be interpreted as the adjusted differences in the change (from baseline to follow-up) between the intervention and control sites. Positive regression coefficients denote that the intervention site had a greater increase (or a smaller decrease) in the outcome of interest than did the control site. The change in walking frequency and duration was not significantly different between the intervention and control sites. Similarly, there was no significant difference in the changes in the perceptions of pedestrian infrastructure and safety. There was a tendency toward a greater increase in perceived aesthetics from baseline to follow-up at the intervention site, relative to the control site. A positive significant regression coefficient was found for the awareness of others being active, indicating that participants at the intervention site increased their awareness of physically active people from baseline to follow-up, compared with those in the control site. The results of gender-specific analyses are shown in Supplementary Table 3. We found that none of the regression coefficients were significant, except for a marginally significant increase in the awareness of other’s PA only among men. However, the results did not show large discrepancies from those in Table 3, suggesting that the intervention may have worked largely in a similar manner for men and women.
Differences in Outcome Changes From Baseline to Follow-Up Between the Intervention and Control Sites.
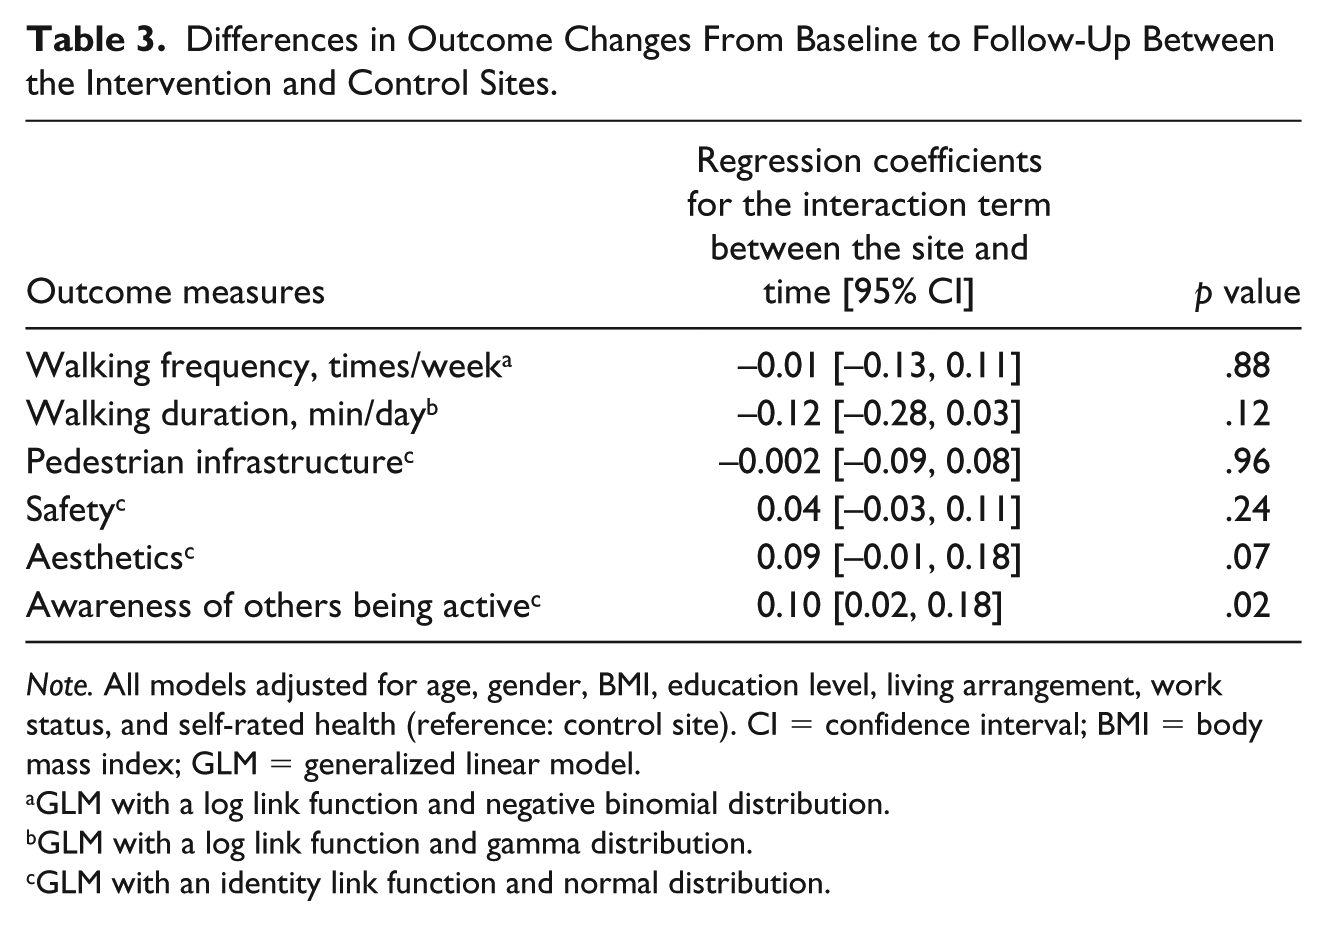
Note. All models adjusted for age, gender, BMI, education level, living arrangement, work status, and self-rated health (reference: control site). CI = confidence interval; BMI = body mass index; GLM = generalized linear model.
GLM with a log link function and negative binomial distribution.
GLM with a log link function and gamma distribution.
GLM with an identity link function and normal distribution.
Given that our findings indicated that the PA intervention tended to influence perceived aesthetics and the awareness of others being physically active, we examined whether these two perceived environmental attributes were potential mediators of the effects of the PA intervention on walking outcomes. As noted in previous studies (Cerin et al., 2018; Cerin & Mackinnon, 2009), it is legitimate to estimate mediation effects even in the absence of significant intervention effects on the outcome if the intervention shows a significant effect on the mediator. Our data did not support the mediating role of these two perceived environmental attributes because their changes across time were not significantly associated with the walking outcomes (Supplementary Table 4).
Table 4 shows walking frequency and duration for the follow-up sample (including both the intervention and control sites), categorized by the awareness of the walking maps or participation in the walking events. Those who knew of the walking maps were not different in their walking frequency or duration from those who did not know of them. Participation in the walking event or not was also unrelated to walking duration. However, those who participated in at least one walking event walked more often than those who did not participate in the walking events at all.
Walking Frequency and Duration by Knowledge of the Walking Maps and Participation in the Walking Events at Follow-Up.

Note. Independent samples test.
Discussion
The current study evaluated the effect of a community-wide walking intervention targeting Japanese older adults using walking maps and group events on their walking frequency, duration, and environmental perceptions. Although participants in the intervention site at follow-up were well aware of the walking maps and walking events (more than 85% of them reported that they knew of them), we did not find a significant improvement in walking frequency and duration in the intervention site, relative to the control site. Similar nonsignificant changes in PA including walking have been observed in other community-wide PA intervention studies using a panel design (Phillips et al., 2014; Saito et al., 2018). A literature review also reported inconsistent findings with regard to the effectiveness of community-wide PA interventions (Baker et al., 2015), highlighting the difficulties in demonstrating effects on PA at the community level.
A potential reason for not finding significant increases in walking frequency and duration, despite the intervention material being well known to participants, is that the walking maps and events may have attracted those who were already active. We found that, at follow-up, those who participated in the walking events walked more frequently than those who did not participate (Table 4). However, this increase in walking frequency among a small subgroup of participants was not enough to generate a significant increase in walking frequency at the population level. It is possible that the intervention was not effective for nonactive older adults to initiate walking. A previous study with a cohort design using similar intervention strategies (walking maps and group walking) reported a significant increase in step counts (Rosenberg et al., 2012). It can be argued that those who took part in such a study are to some extent interested in PA or motivated to initiate PA. In contrast, this panel design study simply asked participants to respond to a survey. Thus, participants in this study might have included those with little interest in PA. Although inactive people can gain significant health benefits with small increases in activity levels (Dunn, 2009), it is often difficult to reach them in intervention studies due to their lack of interest or motivation in engaging in PA. Additional intervention components may be needed to attract inactive older adults to take up PA such as walking. Additional intervention components, for example, introducing incentives such as pedometers, organizing “open streets” or ciclovia-type events, and appointing “walking champions” who encourage more people in the community to walk, may be needed to attract inactive older adults to take up PA such as walking. Another explanation could be that our walking measure was not sensitive and suitable for the target behavior—walking for recreation. The walking questions employed (IPAQ Short Form) are generic and do not separate walking for exercise/recreation during leisure time from utilitarian walking as a form of travel or to do errands. It is possible that an increase in the frequency or duration of leisure-time walking had a compensation effect on utilitarian walking, leading to an overall lack of change. Having an additional item specific to leisure-time walking could have answered this issue (Merom et al., 2007).
It was found that more people in the intervention site became aware of others being active from baseline to follow-up. It is unknown whether participants in the intervention site actually saw a group of walkers in the walking events. However, it is possible that the monthly walking maps delivered in the intervention site (recognized by 87% of the participants at follow-up) with additional information about the benefits of PA may have made them more aware of, or curious about, whether other people were engaging in PA. According to the social cognitive theory (Bandura, 1977), individuals who become more aware of the presence of physically active people display a higher level of readiness to initiate PA, compared with those lacking interest in others’ PA behavior. However, this increase in the awareness did not translate into a significant increase in walking frequency and duration. The intervention period (21 months) may not have been long enough for such an early stage of readiness to move to the stage of action. There is a successful community-wide PA promotion in Japan, which involved a 5-year intervention (Kamada et al., 2018). Sustained promotion efforts overtime (and long-term observation) may be needed to achieve a shift in the stages of change in PA.
The current study also found a marginally significant increase in perceived aesthetics from baseline to follow-up in the intervention site. The walking maps provided information about locations suitable for walking, with photos and residents’ comments on various locations. Such information may have reminded participants of places that they are not aware of or have them reassess their local area, which may have resulted in a marginal improvement in the aesthetics score. Aesthetics of the local area is known to be associated with older adults’ walking (Barnett et al., 2017). Walking maps highlighting the aesthetic aspects of local areas may be worth testing in future studies.
We did not find improvements in the perceptions of pedestrian infrastructure, and safety. Pedestrian infrastructure (mainly sidewalks) is an environmental attribute associated with recreational walking (Cerin, Sit, Barnett, Cheung, & Chan, 2013). However, the walking maps did not focus on this feature, mainly because sidewalks were a common attribute of the selected walking routes (we chose routes that were easy for older adults to walk). Perceived safety also did not change after the intervention. Similar to sidewalks, safety from crime and traffic safety were not discussed extensively in the walking maps, because we avoided routes that may be unsafe for older adults to walk.
This study has several strengths. First, this was a community-wide study using a quasi-panel design, where participants were recruited from all eligible residents at baseline and follow-up. This study design provided walking data at the community level consistently at baseline and follow-up. As discussed above, this approach is less likely to deter people who are not interested in PA from participating relative to typical intervention studies where participants are required to commit themselves to a certain PA program. Second, we distributed walking maps and held walking events every month during the 21-month study period. More than 85% of the participants in the intervention site knew about these intervention components. Study limitations include the use of self-reported walking measures, which may be subject to recall error and desirability bias. Furthermore, the use of the IPAQ may involve cognitive challenges for some older adults (Heesch, van Uffelen, Hill, & Brown, 2010). Future studies need to employ questionnaires developed for older adults with a capacity to assess specific walking behaviors (Merom et al., 2014). Another limitation is that the study was conducted in a regional city with a small population. An intervention using walking maps and events in an urban area may produce different effects.
Conclusion
This study found that the intervention for Japanese older adults using walking maps and group walking events did not generate an increase in walking frequency and duration at the community level during the study period. However, a significant improvement in the awareness of others being active was observed in the intervention site, suggesting that the walking maps and events may have made older residents more conscious of other people’s behavior, which could be a positive step in the stages of change toward engagement in PA. Increased awareness about other people’s activity at the intervention site may be a promising sign, but different strategies may be necessary to get the attention of those who are inactive and not interested in being active to move them to the next level in their readiness to initiate PA.
Supplemental Material
Supplemental_material – Supplemental Material for A Community-Wide Walking Promotion Using Maps and Events for Japanese Older Adults
Supplemental Material, Supplemental_material for A Community-Wide Walking Promotion Using Maps and Events for Japanese Older Adults by Akio Kubota, Munehiro Matsushita, Takashi Arao, Dafna Merom, Ester Cerin and Takemi Sugiyama in Journal of Aging and Health
Footnotes
Acknowledgements
The authors would like to thank the staff of the Health Promotion Unit of Oiso for their cooperation.
Declaration of Conflicting Interests
The authors declared no potential conflicts of interest with respect to the research, authorship, and/or publication of this article.
Funding
The authors disclosed receipt of the following financial support for the research, authorship, and/or publication of this article: This study was funded by the Japan Society for the Promotion of Science (Grants-in-Aid for Scientific Research (C), #JP15K01663). The manuscript was written when AK was visiting Australian Catholic University, using the financial support from Tokai University. EC is supported by an Australian Research Council Future Fellowship (FT3 140100085).
Supplemental Material
Supplemental material for this article is available online.

References
Supplementary Material
Please find the following supplemental material available below.
For Open Access articles published under a Creative Commons License, all supplemental material carries the same license as the article it is associated with.
For non-Open Access articles published, all supplemental material carries a non-exclusive license, and permission requests for re-use of supplemental material or any part of supplemental material shall be sent directly to the copyright owner as specified in the copyright notice associated with the article.
