
Abstract
The importance of tax-exempt borrowing as a capital source to the nonprofit sector has significantly grown over time. Outstanding tax-exempt bonds issued by nonprofits have risen from an inflation-adjusted US$106.3 billion in 1993 to US$388.5 billion in 2010 representing an 8% compound annual growth rate over the period. The increased importance of tax-exempt borrowing relative to other borrowing for nonprofits has gone unnoticed. Here, we ask what factors are associated with this trend. We find wide variation in the increasing use of tax-exempt bond usage between nonprofit sectors. Although nonprofit borrowers other than hospitals have increasingly entered the tax-exempt capital market over the past decade, they still tend to be large organizations with lower risk of bankruptcy or default. Our empirical findings continue to raise the questions that others have raised: How do we make smaller, capital-starved nonprofits better able to take advantage of the tax-exempt market in a responsible manner?
Introduction
Nonprofit organizations may use tax-exempt borrowing as one source of capital. The importance of such borrowing to the sector has significantly grown over time. In fact, outstanding tax-exempt bonds issued by nonprofits have risen from an inflation-adjusted US$106.3 billion in 1993 to US$388.5 billion in 2010 representing an 8% compound annual growth rate over the period. 1 An estimate of the annual federal tax expenditure (lost tax revenues) for tax-exempt bonds used only by private nonprofit educational organizations and hospitals exceeds US$5.8 billion in 2013 (Office of Management and Budget, 2013). Despite the importance of tax-exempt bonds to the financing needs and capital structure of nonprofit organizations, we know surprisingly little about which nonprofits increasingly depend on the tax-exempt capital market and what services these nonprofits provide. Furthermore, the increased importance of tax-exempt borrowing relative to other borrowing over the past decade has gone relatively unnoticed. Here, we ask what factors are associated with the growing importance of tax-exempt bonds for nonprofit organizations relative to other forms of borrowing.
The limited empirical treatments of nonprofit tax-exempt borrowing have generally focused on hospitals (Gentry, 2002; Hassan, Wedig, & Morrisey, 2000; Wedig, Hassan, & Morrisey, 1996)—which are not representative of the entire sector due to the size, sophistication, and commercial nature of operations. Other nonprofit organizations are generally overlooked by the literature, and the size and trends of nonprofit activity in the tax-exempt, or municipal, bond market are essentially unknown. The size of the tax-exempt bond market and the “municipal bond” label overshadow the range of activity and diversity of issuers in the market. Between 1997 and 2010, the estimated number of nonprofit organizations using tax-exempt bonds increased approximately 105%, from just over 3,300 to more than 6,800 organizations. 2 Furthermore, the dependence on tax-exempt bonds relative to other borrowing increased nearly 25% during this time period, suggesting that tax-exempt bonds are an increasingly important part of nonprofit borrowing behavior and capital structure.
As the federal government manages significant resource constraints, tax exemptions for the nonprofit sector as a whole are likely to face increased scrutiny. In fact, plans to eliminate or modify tax exemption for municipal bonds have become commonplace in efforts to reduce persistent federal budget deficits. The bipartisan Simpson–Bowles Commission advocated eliminating tax exemption for all newly issued municipal bonds—including those by nonprofit organizations; President Obama’s 2014 budget proposal capped the value of tax-exempt interest to increase revenues to the Treasury; the 2011 Wyden-Coats Bill sought to replace tax exemption with a flat tax credit to reduce the tax expenditure; and the Congressional Progressive Caucus’s “People’s Budget” proposed replacing tax exemption with refundable credits, again with the goal of increasing revenues to the federal government. Our study, therefore, analyzes which nonprofits would be most affected by changes in the tax code contemplated by federal policymakers.
Implicit throughout the literature examining the public–nonprofit relationship is the notion that government support to nonprofits primarily comes in the form of current financial resources made available for current charitable services (through, for example, fee-for-service arrangements or government contracts). Yet, many nonprofits require significant capital assets to provide such services to the public: Hospitals require buildings and equipment, universities require classrooms and dormitories, and community development corporations require property and buildings. Access to the tax-exempt bond market is a less visible source of government support for nonprofits and one area of research that is relatively unexplored.
In this foundational article, we first situate the importance of tax-exempt bonds to nonprofits’ capital investment and then outline the costs and benefits of tax-exempt bonds. We also briefly outline the major tax policy issues that shape the use of tax-exempt bonds by nonprofits. We then build off the current literature on nonprofit borrowing to identify relevant factors associated with the growth in tax-exempt bond usage and its importance as a primary borrowing source for the entire nonprofit sector. We use panel data to control for unobserved factors that might bias results.
We find wide variation in the increasing use of tax-exempt bonds between nonprofit sectors. For example, hospitals—the primary issuer of tax-exempt bonds in the nonprofit sector—have barely increased the importance of tax-exempt bonds relative to other debt; higher education—and also arts, other education, human services, and “other” nonprofits—has greatly increased usage of tax-exempt borrowing. Although these nontraditional nonprofit borrowers have increasingly entered the tax-exempt capital market over the past decade, they still tend to be large nonprofits with lower risk of bankruptcy or default. Our empirical analyses confirm that there is a statistically significant relationship between large capital-intensive nonprofits and the importance of tax-exempt bond usage relative to other borrowing forms. Furthermore, nonprofits more reliant upon contributions than earned income use less tax-exempt bonds compared with other forms of borrowing.
Background
Nonprofit Demands for Capital
Just like other corporations, nonprofits must develop and implement a strategy for acquiring assets to support operations. These include liquid assets such as cash that can be used to pay for the day-to-day operations of the organization, and also capital assets such as property and buildings that provide the necessary space and equipment of the organization. These fixed assets are combined with labor in the production process.
The nature of certain nonprofit sectors makes the need and ability to secure capital especially critical. Grønbjerg and Nagle (1994) draw attention to the capital needs of human service organizations in particular: While some nonprofits do not require specialized space for their activities, many do. For example, those that provide day care, residential facilities, soup kitchens, homeless shelters, or rehabilitation services for the disabled need facilities that meet particular design specifications. (p. 119)
Winnick (1992) notes that limited capital leads many nonprofits to provide fewer services at lower quality than is optimal from society’s perspective. Smith (2006) highlights a “lack of financing for capital costs within government contracts” (p. 232), which leaves nonprofits dependent on other resources for capital needs.
The Increasing Importance of Tax-Exempt Bonds to the Nonprofit Sector
Tuckman (1993) divides the available options for nonprofits to finance capital investment into three categories: “internal funding, funding from nonlending institutions (individuals, other nonprofits, governments, foundations, and corporations), and funding from capital markets” (p. 207). Because nonprofits cannot raise funds through the equity markets, debt is an even more prominent option (Hansmann, 1981; Yetman, 2007). Here, we focus on funding from capital markets—that is, borrowing.
The reporting categories on the Internal Revenue Service (IRS) Form 990 allow for visibility into different sources of borrowing by nonprofit organizations, including mortgages, notes payable, and tax-exempt bonds. 3 In 2010, tax-exempt borrowing comprised 45% of all financial liabilities outstanding in the sector, and is almost twice as large as mortgages and notes (24%), and approximately 50% larger than the remaining “Other” financial liabilities. 4
As evidenced in Figure 1, nonprofit borrowing overall increased significantly during the 1998-2010 period. 5 In inflation-adjusted 2010 dollars, total financial liabilities increased from US$434 billion in 1998 to more than US$873 billion in 2010, a real increase of more than 100%. This growth in liabilities mirrored growth in nonprofit ownership of property, plant, equipment, and other fixed assets most likely financed by debt; such assets grew more than 72% in this time period in real inflation-adjusted dollars. 6 Of the major financing sources, tax-exempt bonds grew 120% in real terms during this period; as a point of comparison, mortgages and notes grew by only 33%.
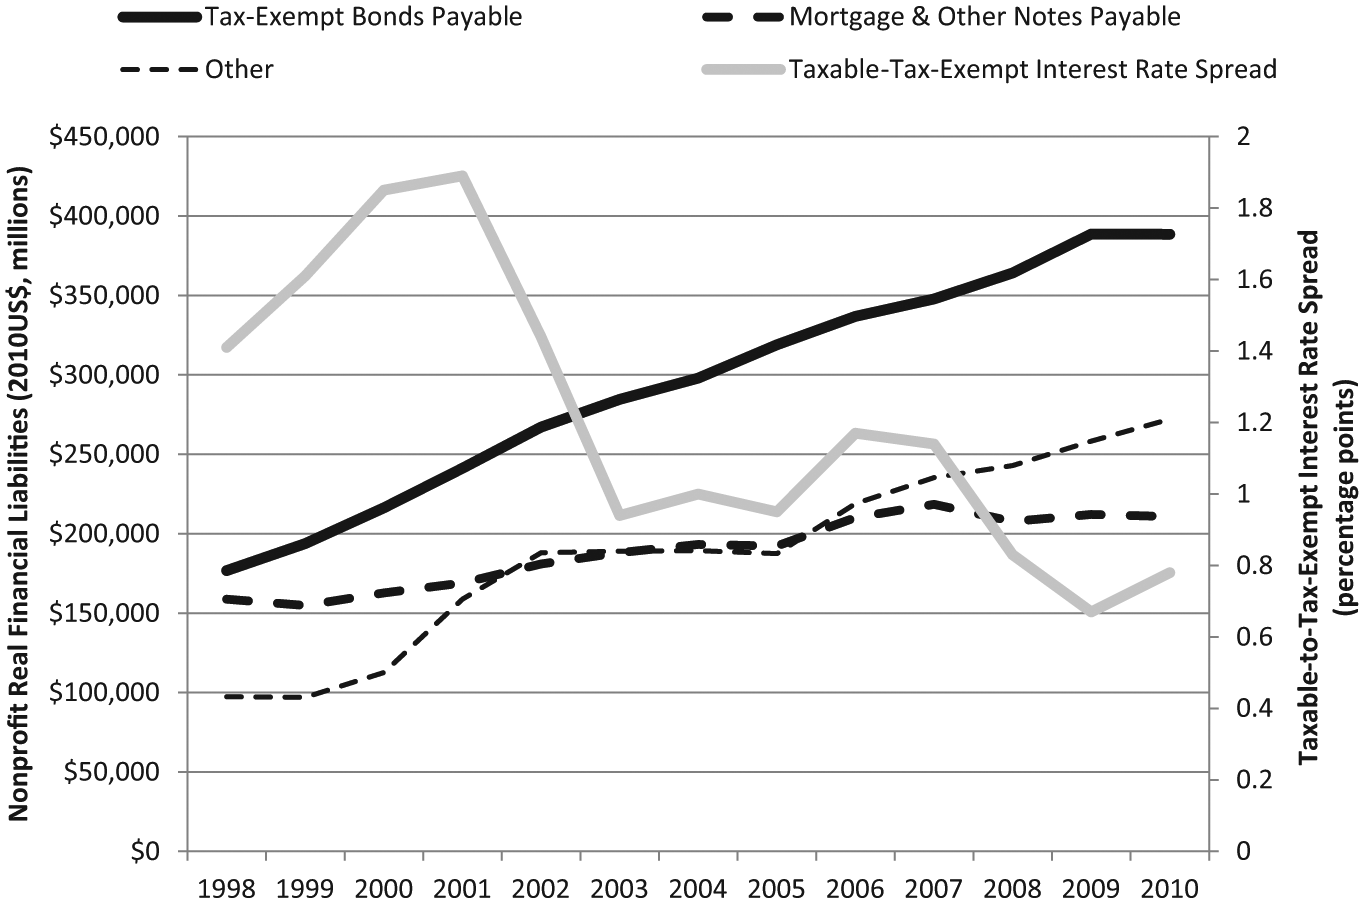
Inflation-adjusted nonprofit financial liabilities, 1998-2010.
By way of comparison, borrowing by state and local governments grew only 47% in inflation-adjusted per capita terms during this same time period, whereas per capita nonprofit tax-exempt borrowing grew more than twice as quickly. Furthermore, the ratio of outstanding per capita nonprofit tax-exempt debt to state and local public debt increased from 8% to nearly 14% on average, with significant differences across the states. All in all, these data indicate that the sector has increased borrowing over the 1998-2010 time period and altered its sources of financing over time to include more tax-exempt borrowing, and nonprofits represent a nontrivial portion of the overall municipal bond market.
Different nonprofit service types also use tax-exempt bonds to varying degrees. Table 1 shows inflation-adjusted tax-exempt borrowing by major nonprofit service area in 1997, 2010, and the change between these two points in time. 7 Hospital borrowing is a significant portion of all nonprofit tax-exempt bonds—at 62% of the total in 1997; however, this percentage fell to 54% by 2010. Human services and higher education nonprofits show significant growth in the proportion of all nonprofit tax-exempt borrowing—although most other service areas also show growth as suggested by Smith (2006).
Nonprofit Tax-Exempt Debt Outstanding by Primary Service Area, 1997 and 2010 (Inflation-Adjusted, 2010 US$).
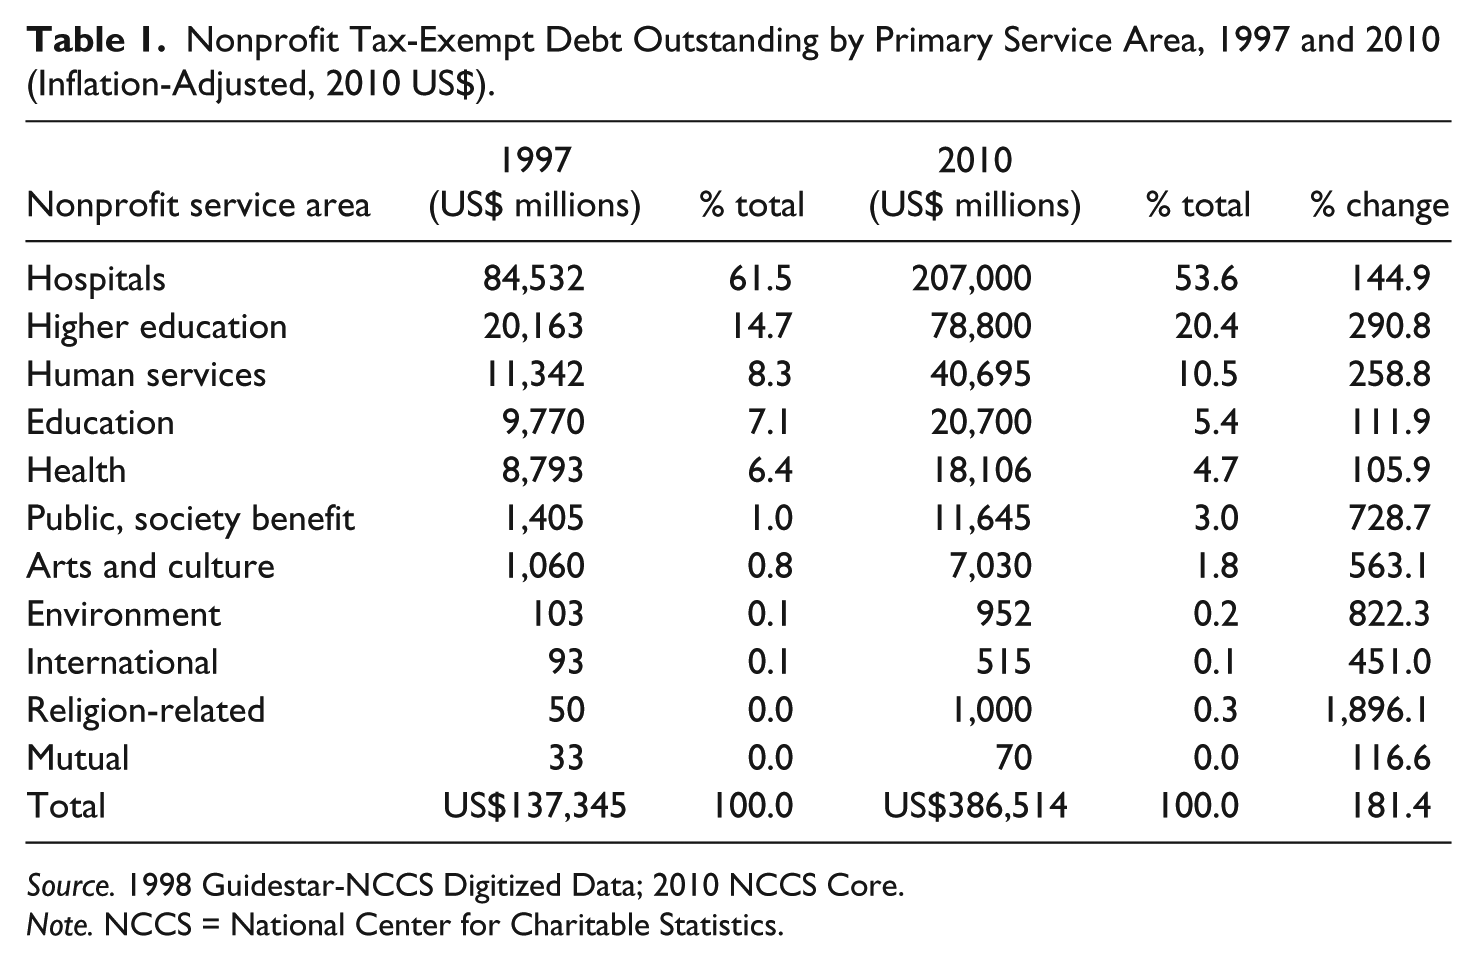
Source. 1998 Guidestar-NCCS Digitized Data; 2010 NCCS Core.
Note. NCCS = National Center for Charitable Statistics.
Benefits and Costs of Tax-Exempt Bonds for Nonprofit Organizations
Most discussions about why a nonprofit might choose to issue tax-exempt bonds rather than taxable debt focus on the relative cost advantage. An investor in tax-exempt bonds is not taxed on the interest payments received from the issuer—hence the reference to “tax-exempt” bonds. In return for preferential tax treatment, investors are willing to accept lower pretax returns relative to a taxable debt instrument, which lowers the cost of capital to the nonprofit borrower. The foregone tax collections from tax-exempt bonds represent the income taxes that would have been paid by investors had the interest payments been taxable. Although the impact on federal tax revenues is most prominent, the majority of state income tax systems also exempt within-state municipal bond interest (Lovely & Wasylenko, 1992).
We use an example to illustrate the savings to a nonprofit borrower relative to taxable bonds. In January 2010, Harvard University issued US$480 million in tax-exempt serial bonds 8 through the Massachusetts Health and Educational Facilities Authority (2010). Of the total bond issue, US$108.67 million matures in 2034 with a yield of 4.02%. For this maturity, the interest costs to Harvard are approximately US$4.37 million dollars annually between the issuance in 2010 and 2034. If the debt were taxable, Harvard would incur estimated annual interest costs of US$5.72 million. 9 From Harvard’s perspective, this is an annual interest cost savings of US$1.35 million, which over the life of the bond sums to nearly US$34 million in reduced interest payments in current dollars.
The spread between tax-exempt and taxable interest rates, holding credit quality constant, dictates the available savings to nonprofit borrowers. Although differences in tax-exempt and taxable interest rates have narrowed in recent years, over the past two decades, this spread has averaged 1.24%—ranging from 0.35% in 2011 to 1.89% in 2001 (Council of Economic Advisors, 2013: Table B-73). In 2011, for example, it was “estimated that interest rates for borrowers would increase by 50 to 150 basis points, or 0.5% to 1.5%, for bond transactions of varying levels of credit quality if the [tax] exemption is eliminated” (Council of Development Finance Agencies, 2011, p. 8; also see Hume, 2011). Returning to Figure 1, we plot the average spread between taxable and tax-exempt interest rates. The growing importance of tax-exempt borrowing does not appear dependent on this spread. As the spread has narrowed in recent years, many nonprofits have increasingly used taxable debt (see, for example, Rivard, 2014). If this spread remains low, the benefits of tax-exempt bonds may no longer outweigh the costs for many organizations, fundamentally reducing the demand for tax-exempt bonds by nonprofits.
Aside from the benefit of lower tax-exempt interest rates for nonprofits, the act of accessing the national credit market may also result in more competitive fees and the ability to borrow larger amounts (Tuckman, 1993). Akin to a homeowner refinancing a mortgage, the use of bonds also typically provides issuers the opportunity to “call” (or redeem) the debt if interest rates decline (Tuckman, 1993).
Unlike for-profit corporations, a nonprofit organization is generally unable to reduce its aftertax borrowing costs by deducting interest expenses from its corporate income tax base. Rather, the interest rate on debt for nonprofits is the aftertax cost of borrowing. The deductibility of interest payments by for-profit corporations calls into question whether tax-exempt bonds used by nonprofit organizations actually provide a lower relative aftertax cost of capital (Reinhardt, 2000), and whether tax-exempt borrowing is accurately viewed as a public subsidy to nonprofit organizations.
Disadvantages of tax-exempt bonds include the steep fixed costs and reduced repayment flexibility compared with borrowing from a local or regional bank (Tuckman, 1993). In addition, nonprofits must identify and compensate a conduit issuer, usually a state authority or local government, to assist in accessing the tax-exempt capital market. Furthermore, the conduit generally requires that the nonprofit issuer pay a fee to the conduit as long as the bond remains outstanding, a cost that does not exist when using taxable financing. The concern over high issuance costs in tax-exempt debt financing translates to a general rule of thumb presented in the literature that borrowing needs should exceed “several million dollars” for tax-exempt bonds to be cost-effective (Seidman, 2005). Robbins and Simonsen (2013) demonstrate the scale economies of municipal bond transaction costs, finding that “a 1 percent increase in bond amount leads to about a 0.65 percent increase in transaction costs” (p. 17).
Postissuance disclosure and compliance for tax-exempt bonds include monitoring how proceeds are used, whether arbitrage income is earned from these proceeds (borrowing funds in the low-interest rate tax-exempt market and investing the funds in the higher-rate taxable bond or stock market), monitoring how properties financed with tax-exempt bonds are used, ongoing disclosure with the Municipal Securities Rulemaking Board (MSRB), and preparing annual Schedule K disclosures for the IRS. The IRS also routinely audits nonprofit borrowers using tax-exempt bonds to ensure the uses of proceeds comply with federal laws and regulations (e.g., see Jagoda, 2014). As a result, issuers incur increased compliance costs that erode the interest cost savings of tax-exempt bonds and highlight the relative advantages of taxable debt—flexibility in use and life of the bond as well as lower compliance and administrative burdens.
Tax Policy and Tax-Exempt Bonds
Tax expenditures for subnational government borrowers that use tax-exempt bonds did not result from a carefully designed tax policy or, for that matter, any effort by Congress to provide subsidies to states and localities providing public services. The exemption provision was initially based on a set of Supreme Court precedents from the 1800s establishing the doctrine of “reciprocal immunity.” This doctrine limited interference of the states and federal government in each other’s affairs. The subsequent creation of the income tax and the Sixteenth Amendment to the Constitution in 1913 created uncertainty as to whether the federal government could tax interest from municipal debt (Advisory Commission on Intergovernmental Relations, 1984). This uncertainty persisted until the Supreme Court’s South Carolina v. Baker ruling in 1988 that the federal government has the constitutional right to tax state and local debt interest (Bland & Chen, 1990).
Conversely, the continued tax exemption for qualified nonprofit bonds resulted from a conscious policy decision embedded in the Tax Reform Act of 1986 (TRA-86), which differentiated between private activity bonds (PABs) and what was labeled qualified “501(c)(3) bonds,” named after the tax code section of the beneficiary organizations. The adoption of TRA-86 imposed annual caps at the state level on PABs to limit their cost to the federal government. 10 Nonprofit organizations did not face the same new aggregate restrictions as PABs, but each nonprofit, unless a hospital, was limited to US$150 million in outstanding tax-exempt bonds. This restriction was later removed through the Taxpayer Relief Act of 1997 if the bond is used primarily for new capital projects.
Theoretical Development
Nonprofit Borrowing and Tax-Exempt Bonds
Explanations of why certain nonprofits might use tax exempt versus taxable borrowing are relatively limited. Here, we develop the existing literature on nonprofit borrowing in general to analyze why tax-exempt bonds have grown in importance relative to other forms of borrowing.
Tax-exempt bonds may only finance projects directly attributable to nonprofits’ charitable purposes. As a result, an organization with unrelated business activity would be more likely to use taxable debt because it has no such restrictions and the interest costs would reduce its unrelated business income tax (Denison, 2009). Hence, nonprofits with larger amounts of unrelated business income (UBI) are likely to rely upon other forms of debt for capital needs.
Furthermore, debt locks in expenses and cash flow for many years into the future. If revenues are lower than expected, the existence of debt makes expense reduction more difficult and may lead to operating deficits. Tuckman (1993) notes that it “is extremely rare that a nonprofit with donations as a primary revenue source succeeds in floating a bond issue” (p. 224) because of greater expected revenue volatility compared with commercial nonprofits. Hence, more donative nonprofits are expected to rely upon tax-exempt borrowing less than more commercial nonprofits.
Financial distress costs are also associated with issuing debt. 11 Bacon (1992) notes that nonprofits with more fixed assets compared with intangible assets are less risky to lenders (and hence have lower borrowing costs) because lenders can more readily and easily assume control of these fixed assets in the event of a default. As a result, lenders are more willing to extend them credit. Nonprofits with more fixed assets are more likely to finance capital needs with lower cost tax-exempt bonds.
Yetman (2007) notes that nonprofit financing preferences are rationally based on the relative cost of each alternative. As such, tax-exempt borrowing should be preferred before annual profits because the opportunity cost of tax-exempt bonds is lower than these retained earnings (which could be invested at a greater expected return compared with the cost of tax-exempt bonds). Nonprofits with greater surpluses are expected to rely more upon tax-exempt borrowing as a result.
More sophisticated and professional executives are also more likely to enter the tax-exempt debt market, as articulated for borrowing in general by Yan, Denison, and Butler (2009). Such individuals are more likely to appreciate the benefits of issuing tax-exempt bonds.
Older, more established nonprofits are expected to have the reputation and be stable enough to enter the tax-exempt bond market. Hence, we expect older nonprofits to have more tax-exempt bonds outstanding relative to other borrowing. Furthermore, because they can more easily benefit from the scale economies associated with the costs of issuing tax-exempt bonds, larger nonprofits are expected to rely upon tax-exempt bonds more compared with other borrowing.
Finally, we expect that more financially stable nonprofits rely upon tax-exempt borrowing compared with other borrowing because these organizations are better able to finance the large fixed costs of issuance and the ongoing disclosure requirements. The existing literature has identified revenue diversity (Carroll & Stater, 2009) as being correlated with more financial stability. In addition, endowments provide nonprofits with income that is not dependent on providing services and may stabilize nonprofit operations.
We advance the understanding of tax-exempt bond usage by nonprofits by asking a heretofore unexplored question: What factors are associated with the growing importance of tax-exempt bonds for nonprofit organizations relative to other forms of borrowing? Whereas the existing literature analyzes whether a nonprofit has debt outstanding or the amount of debt outstanding (whether tax exempt, taxable, or combined), we focus instead on what factors are related to the amount of tax-exempt bonds in nonprofits’ debt portfolios relative to other liabilities. Importantly, our research question ties the theoretical and empirical models to the strategic capital budgeting and financing decisions facing nonprofit managers and looks both across all nonprofit sectors and over time to extend the existing literature. While Denison (2009) analyzes levels of tax-exempt bonds outstanding using cross-sectional data and Yan et al. (2009) examine financial borrowing for arts nonprofits, we use panel data to ask why the importance of tax-exempt borrowing has grown relative to other borrowing between 2001 and 2009 across the entire nonprofit sector.
Empirical Analysis
This section describes the data, how we define variables for analysis, and the methodologies used.
Data
Data come from the National Center for Charitable Statistics (NCCS)—Statistics of Income (SOI) database covering the years 2001 through 2009, and fiscal years are standardized as suggested by Feng, Ling, Neely, and Roberts (2014). The Form 990 data are the only financial information nonprofits are required to make available to the public. This database is limited to 501(c)(3) nonprofits and includes the Form 990 data for all large organizations (defined as having US$10 million in assets or more) plus a sampling of smaller organizations. The SOI data are considered the most reliable source of 990 data because the IRS verifies much of the data (Feng et al., 2014). All financial variables are inflation adjusted to 2009 dollars using the Consumer Price Index.
The sample contains 151,831 observations for 24,595 nonprofit organizations; 2,941 observations were dropped because they were nonprofits located outside the 50 U.S. states or Washington, D.C., or because the reported state was erroneous. Organizations that reported obvious data errors were also dropped from the analysis. These included reporting negative expenses, negative revenues (except for investment income or net special events), negative assets, negative liabilities, and no administrative expenses reported, among others. The sample after data cleaning contained 131,447 observations for 23,210 nonprofit organizations.
Model
We estimate a model using ordinary least squares regression that takes the following general form:

Organization-level and year fixed effects are included to control for time-invariant factors such as nonprofit mission area as well as time-specific factors, such as broad economic conditions, that are consistent across organizations and have the potential to influence the amount of tax-exempt debt outstanding by an organization. A Hausman test supports the use of fixed effects. We use cluster-robust standard errors at the organization level to allow for individual nonprofit organization variables to be correlated over time, but be independent between nonprofits.
Defining the dependent variable
The dependent variable is a ratio, presented in percentage points, that measures the relative importance of tax-exempt borrowing to total financial borrowing. The numerator is the end-of-year balance in tax-exempt borrowing for nonprofit i (Line 64a(B) of the Form 990 balance sheet). We first estimate Model 1 using total financial liabilities (such as mortgage and other debt) in the denominator. However, Bowman (2002) notes that nonprofits may acquire capital with short-term debt (such as trade credit) so that capital financing may not be limited to the typical financial debt of for-profit firms. Also, Yan et al. (2009) note that certain nonprofits may not enter the capital markets, so we also estimate Model 1 using a broader definition of borrowing, defined as total liabilities. This alternate specification reduces concerns about selection bias because nonprofits that have not entered capital markets carry other liabilities. Higher values in both dependent variables represent a greater dependence on tax-exempt bonds.
Defining independent variables
We measure unrelated business activity as the ratio of UBI to total revenues. UBI comes from Line 104B of Part VII of the Form 990 (pre-2008) and from Line 2g Column C of Part VIII of the Form 990 (2008 and later). Total revenues are manual summations of all reported revenue lines.
Dependence on contributions is measured using the ratio of contribution revenues to total revenues. Contributions are defined using total contributions (including special events) as reported on the Form 990 Statement of Revenues.
We measure capital intensity using the ratio of fixed assets to total assets. Fixed assets are defined using land, building, and equipment balances reported on the Form 990 balance sheet.
Annual surpluses are defined as the annual change in net assets (total revenues less total expenses) scaled by total revenues. Total revenues and expenses are manual summations of all reported revenue and expense lines on the Form 990.
Executive compensation is measured using the ratio of managerial total compensation from the Form 990 Functional Expense statement (a summation of Lines 25(C) through 28(C)) to total expenses.
Age is calculated as the years since the nonprofit received its tax-exempt status, as well as a quadratic because the relationship may not be strictly linear. We control for organization size using the natural log of total assets.
Financial stability measures include a Revenue Diversification Index that is calculated as in Yan et al. (2009), in which greater values imply greater revenue diversity. Because the Form 990 does not report endowments, we use the technique described in Bowman, Tuckman, and Young (2012) to determine an organization’s presumptive endowment: If a nonprofit’s financial investments are equal to or greater than annual expenses, we determine it to be presumptively endowed—and use these investments as the estimated endowment measure. We scale this value using total assets.
Variables are winsorized at the 1% level to reduce the potential influence of extreme outliers in the data. Table 2 summarizes the basic descriptive statistics for the variables used in the empirical analysis. The average nonprofit in the sample has 36% of all financial borrowing from tax-exempt debt and 9% of all liabilities (including trade credit).
Summary Statistics of Variables.
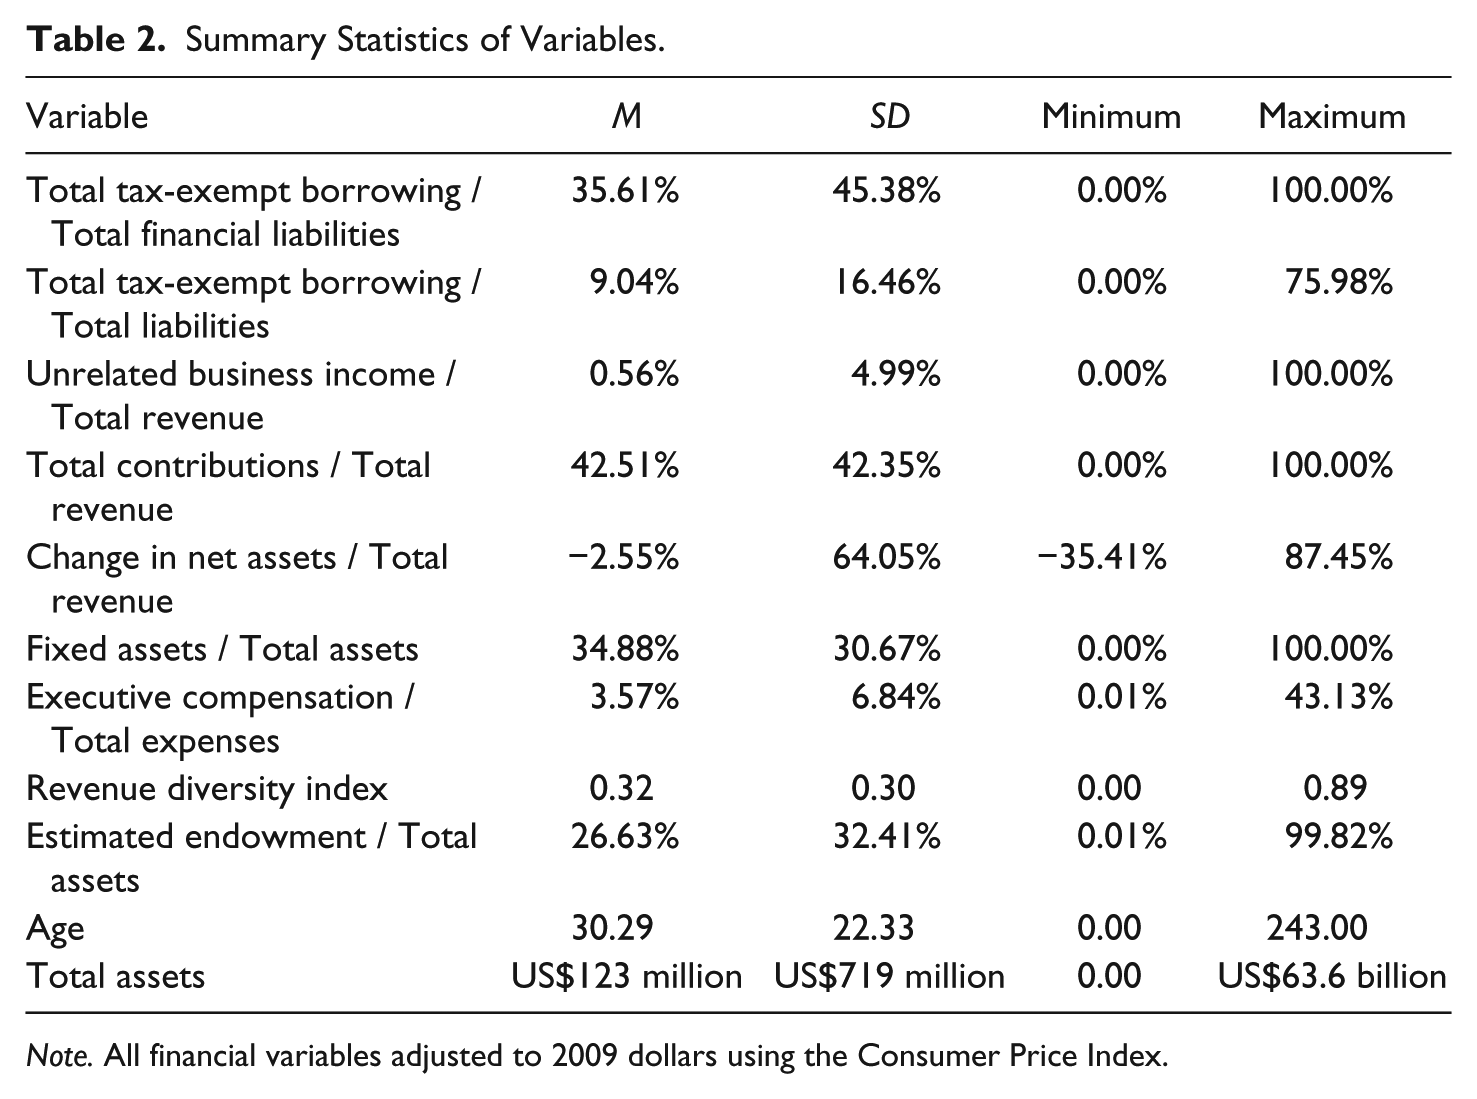
Note. All financial variables adjusted to 2009 dollars using the Consumer Price Index.
Table 3 presents the ratio, in percentage points, of tax-exempt borrowing to total financial borrowing by nonprofit sector over time. Hospitals, the focus of extant research on nonprofit tax-exempt borrowing, saw tax-exempt bonds as a ratio of total borrowing increase only 8% versus 25% for the sample as a whole. However, Arts nonprofits saw the ratio increase nearly 66% (from 17% to 28% of borrowing). Higher education nonprofits now use the most tax-exempt bonds in their debt portfolios—at nearly 70% in 2009, up 31% (from 53% of borrowing) since 2001. Table 3 clearly demonstrates the growing importance of tax-exempt borrowing across sectors not traditionally perceived as users of such debt. Table 3 also reports the amount of tax-exempt bonds outstanding in each year by each nonprofit industry, as well as the number of nonprofits reporting tax-exempt bonds outstanding. Tax-exempt bonds in our sample have increased nearly 83% between 2001 and 2009, whereas the number of organizations reporting tax-exempt bond balances has increased more than 31%. Both data points reflect the growing importance of tax-exempt bonds to the sector.
Tax-Exempt Borrowing by Nonprofit Sectors, 2001-2009.
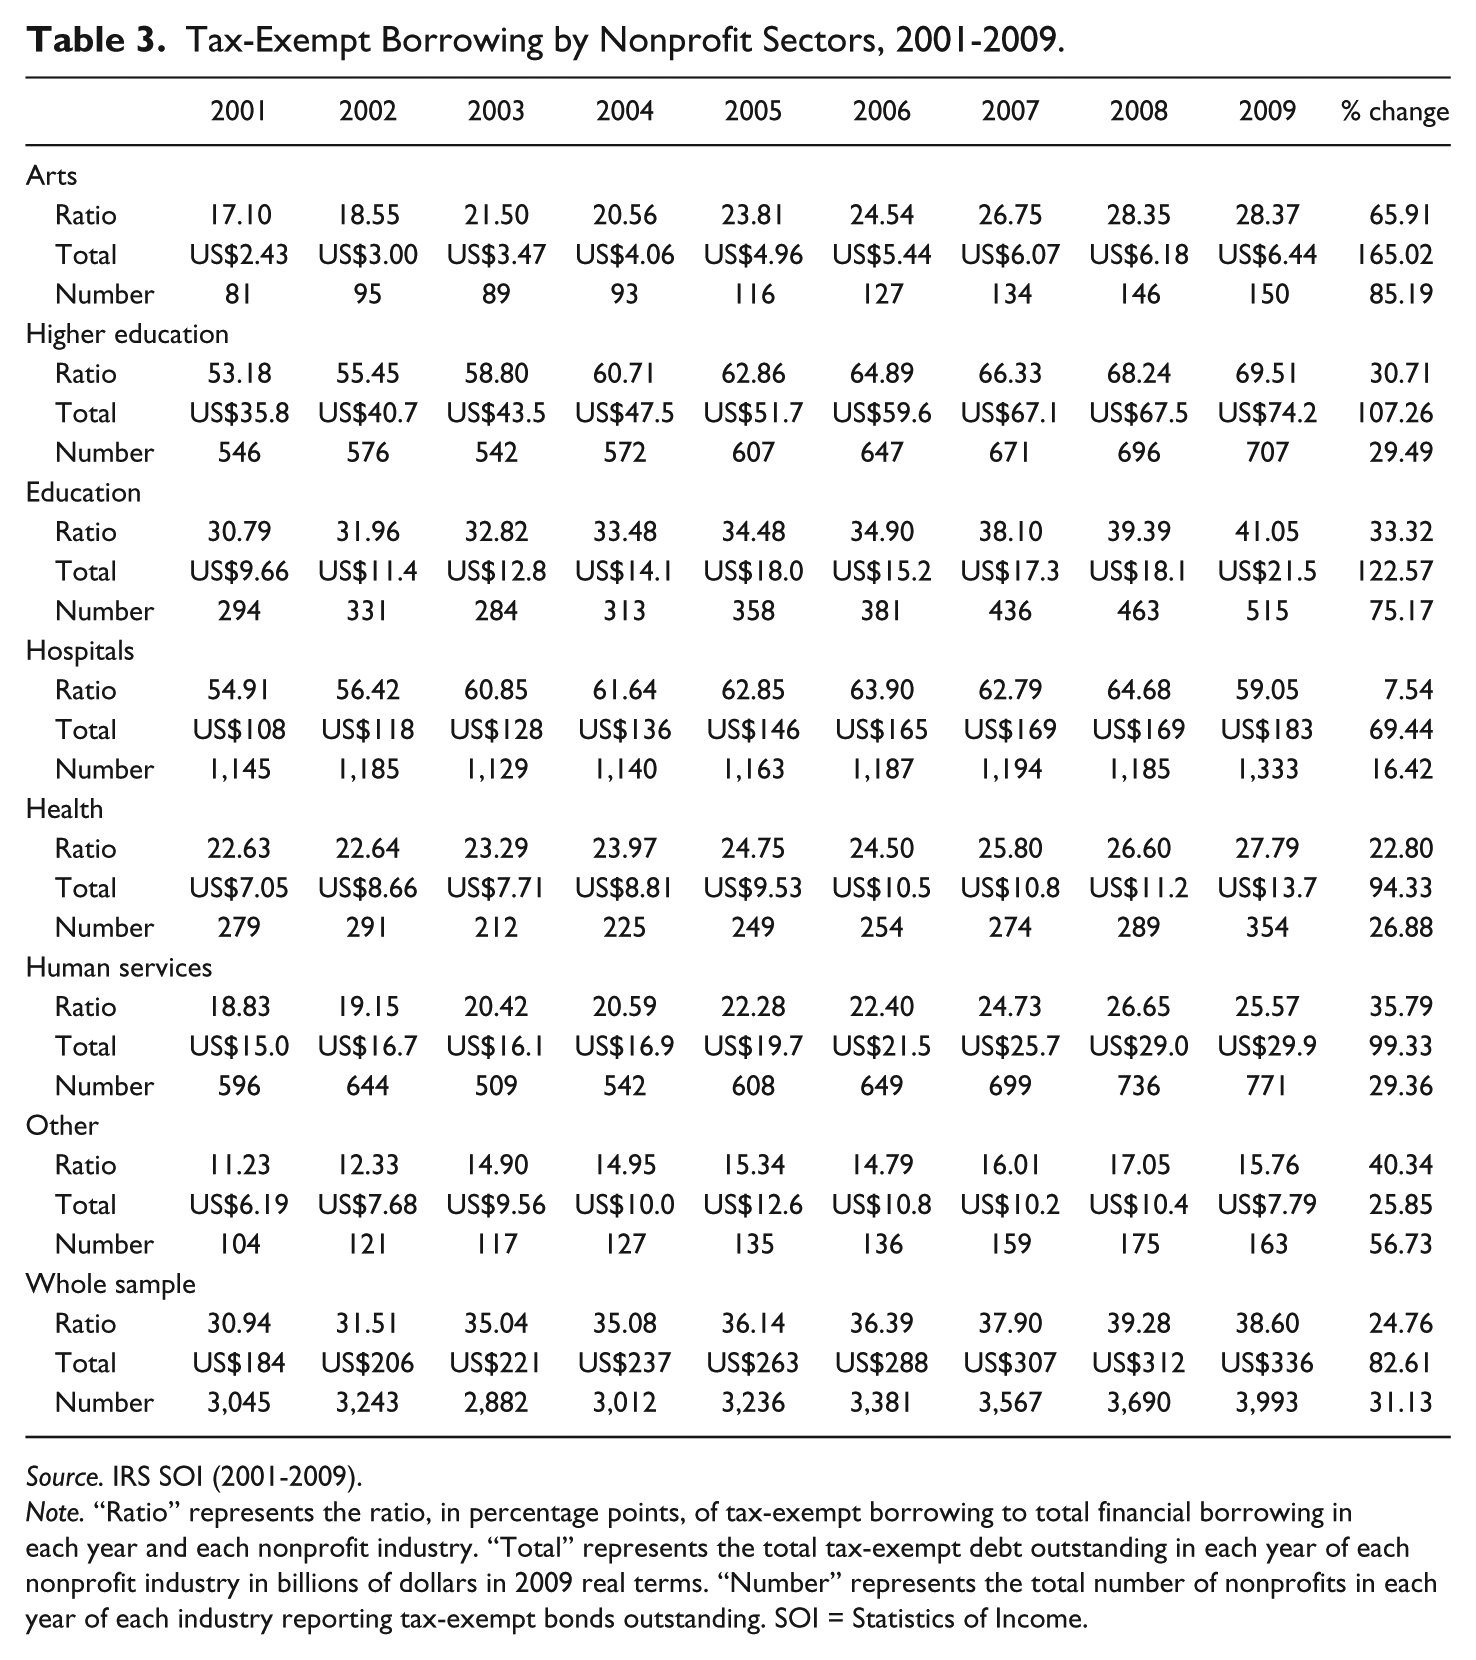
Source. IRS SOI (2001-2009).
Note. “Ratio” represents the ratio, in percentage points, of tax-exempt borrowing to total financial borrowing in each year and each nonprofit industry. “Total” represents the total tax-exempt debt outstanding in each year of each nonprofit industry in billions of dollars in 2009 real terms. “Number” represents the total number of nonprofits in each year of each industry reporting tax-exempt bonds outstanding. SOI = Statistics of Income.
Empirical Results
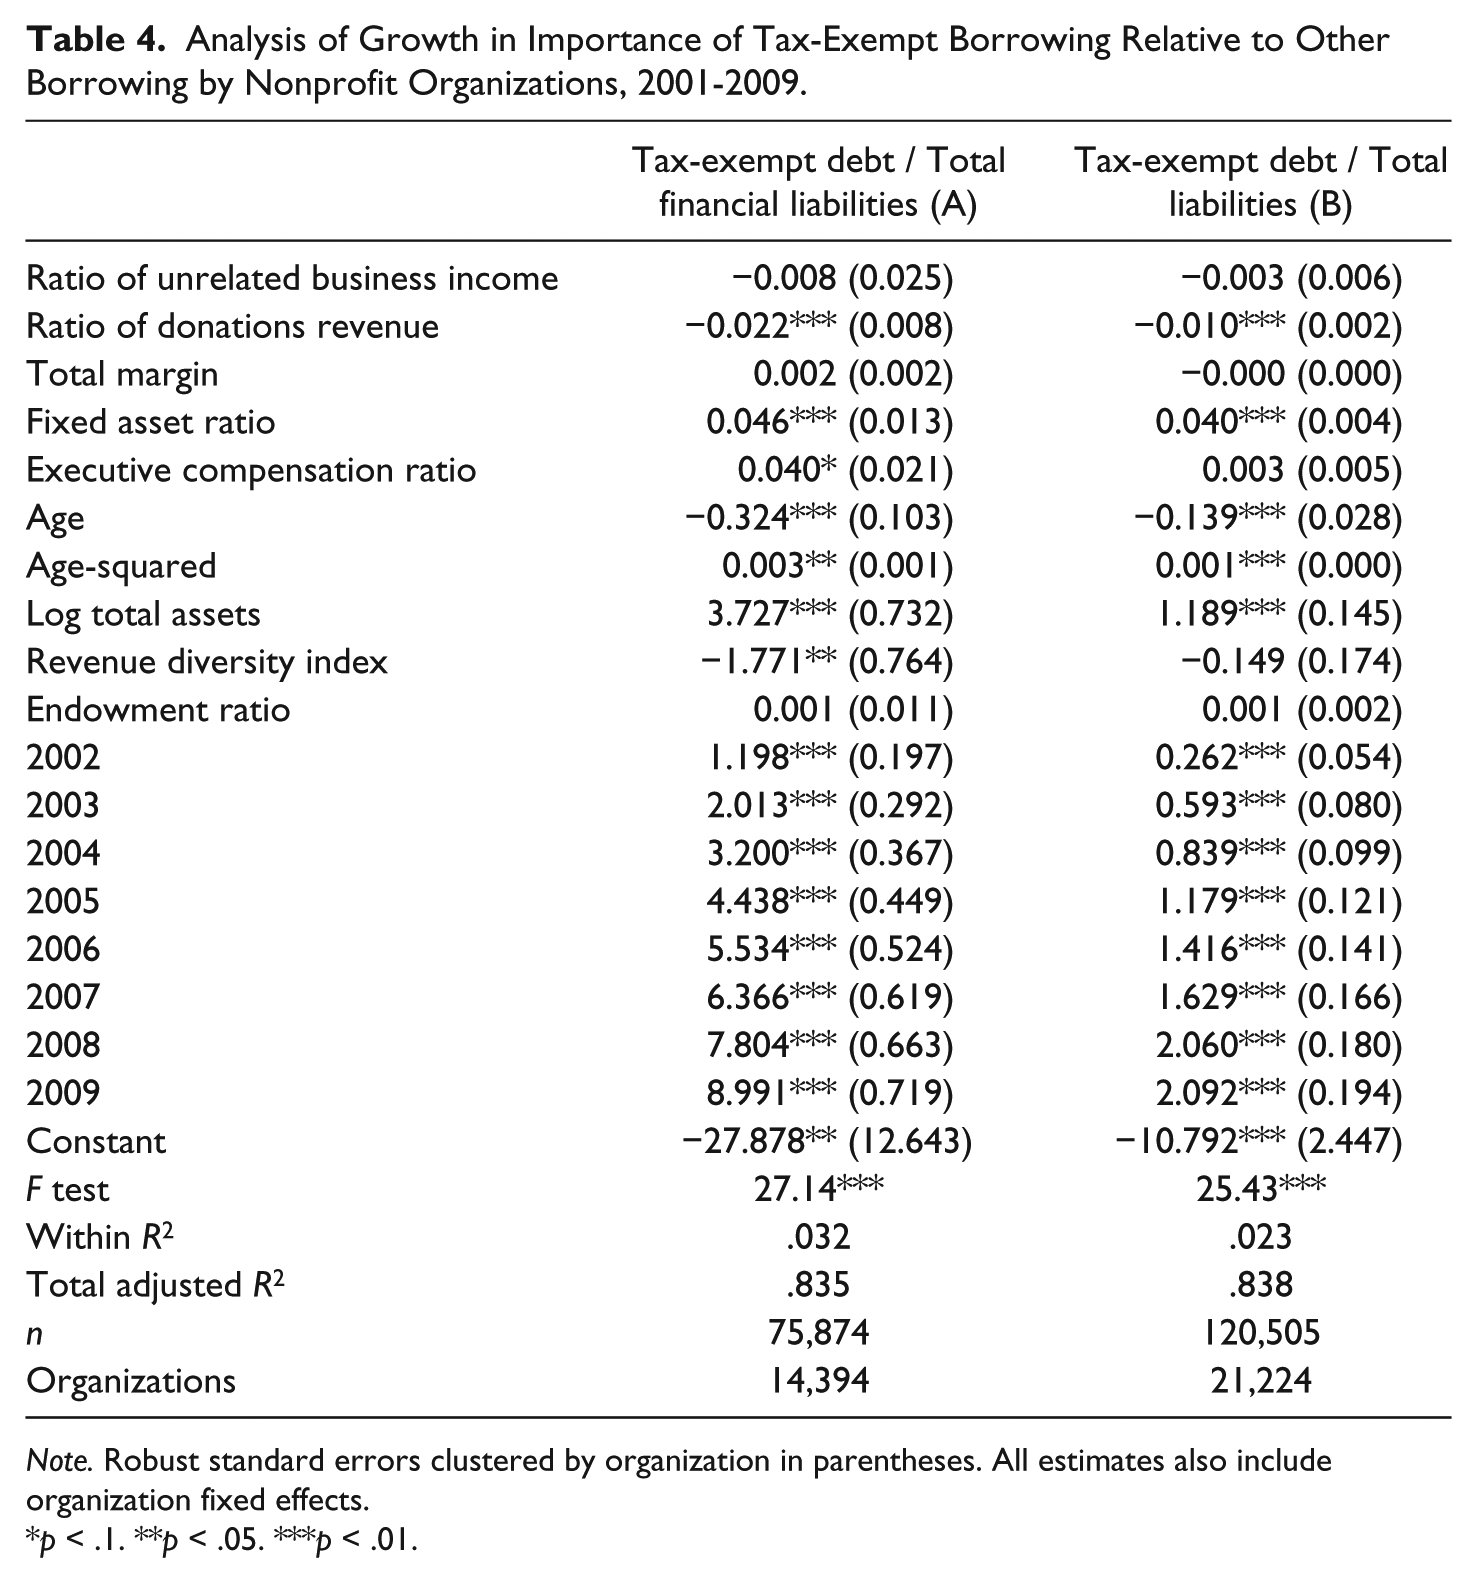
The results of the primary regression estimation are presented in Column A of Table 4. Importantly, the statistically significant and positive year fixed effects demonstrate the persistent growth in dependence on tax-exempt borrowing by the nonprofit sector as a whole, and the fact that the federal policy has become more salient over the period. The year fixed effects in Table 4 show that, all else constant, the share of tax-exempt borrowing increased 9 percentage points (on average) over the sample period.
Analysis of Growth in Importance of Tax-Exempt Borrowing Relative to Other Borrowing by Nonprofit Organizations, 2001-2009.
Note. Robust standard errors clustered by organization in parentheses. All estimates also include organization fixed effects.
p < .1. **p < .05. ***p < .01.
The results indicate that UBI is unrelated to the magnitude of tax-exempt borrowing by an organization. The coefficient is negative as expected but not statistically significant, which may result from the mean UBI measure being so small. Furthermore, the results show that the more donative an organization is, the less reliant it is on tax-exempt bonds than other forms of borrowing. The results suggest that a one standard deviation increase in the donation revenue ratio is associated with a 2.6% decrease in the dependency on tax-exempt bonds relative to other borrowing, based on the mean dependent variable.
Capital intensity is also related to increasing use of tax-exempt bonds, as predicted, reflecting lower potential bankruptcy and default costs as suggested by Bacon (1992), along with greater need for low-cost capital. Total margin is unrelated to tax-exempt borrowing; however, managerial compensation is marginally and positively related to the intensity of tax-exempt bond usage. Age and the quadratic term indicate a convex relationship—that increasing age increases the proportion of debt that is tax exempt. This might reflect steadier financial operations or increasing sophistication compared with younger nonprofits, both of which support access to the tax-exempt bond market. Hence, as a nonprofit moves through growth stages and its capital needs increase, its use of tax-exempt bonds may change as well.
Unsurprisingly, organization size is positive and statistically significant supporting the literature’s traditional assertion that tax-exempt bonds are primarily utilized by large nonprofits. The results suggest that a 10% increase in total assets increases the ratio of tax-exempt borrowing 0.37 percentage points or just over 1% based on the mean. Finally, the results for financial stability do not conform to expectations. The results suggest that revenue concentration is associated with increased tax-exempt bond use, and endowments are unrelated to tax-exempt borrowing. Chikoto and Neely (2014) find that revenue concentration is associated with revenue growth and strengthening financial capacity, and perhaps leads to a greater use in tax-exempt bonds as a result.
Overall, these results presented in Tables 3 and 4 describe several meaningful relationships between nonprofit characteristics and the increasing importance of tax-exempt bonds. First, Table 3 shows that mission matters. The field of service is an important factor in understanding the growth in tax-exempt bond usage relative to other borrowing by nonprofits. Previous work suggested this, but did not illustrate the changing nature of subsector reliance on tax-exempt bonds over time. Second, capital intensity is a significant predictor of tax-exempt bond importance. In other words, there is a significant relationship between nonprofits with lower bankruptcy and default costs and the use of less costly tax-exempt bonds. Third, even when controlling for sector and capital intensity, nonprofit size still matters despite the increased usage of tax-exempt bonds by nontraditional borrowers over time. The benefits of tax-exempt bonds seemingly accrue to the largest organizations, and limited access for smaller organizations due to issuance costs is a salient policy concern. Fourth, nonprofits more reliant on contributions use less tax-exempt bonds compared with other borrowing forms. Finally, despite federal concerns that endowed nonprofits would use tax-exempt bonds to gain arbitrage benefits (Zimmerman, 2004), endowment size relative to total assets is not related to the importance of tax-exempt bonds usage relative to other borrowing for all nonprofits.
Additional Analyses
We also estimate Model 1 using tax-exempt bonds to total liabilities, a broader operationalization of borrowing, as the dependent variable. This measure allows us to include in our analysis not just nonprofits that have chosen to issue financial debt (as in the original analysis), but all nonprofits in our sample. The sample in Column B, therefore, represents all nonprofits in our SOI data. We present the results in Column B of Table 4 to show the consistency of our findings with this altered definition. Specifically, the direction and statistical significance are comparable with the prior analysis, but the magnitude of relationships tends to be weaker using the broader total liabilities as the denominator. As mentioned, these results help mitigate concerns that selection bias is affecting the results in Column A.
Because our dependent variable in both specifications is a fraction censored between 0 and 1, we confirm our overall results estimating Model 1 using a fractional logit model with binomial distribution and a logit link (Papke & Wooldridge, 2008). The results presented in both columns of Table 4 are robust to alternate estimations.
Due to the persistence of an organization’s capital structure, we also estimate Model 1 using a change dependent variable, which analyzes the rate of change in tax-exempt borrowing importance. The results are consistent with those presented in Table 4 with two exceptions—age is not significant (perhaps because a single year’s change in tax-exempt bond dependence is statistically unimportant), and the revenue–diversity relationship is inconsistent across specifications.
The results in Column A of Table 4 present average relationships holding nonprofit sector constant. The varied activities of nonprofits mean that much of the nonprofit financial management research is sector-specific. We also estimate Model 1 for each sector to decompose the previously reported average effects and verify that the results are not driven by a small number of dominant sectors. Alternately, sector-specific results may provide important insight into differences in the influential factors affecting the use of tax-exempt bonds.
The sector-specific results are generally consistent with the overall analysis, although there are three noteworthy exceptions. First, the total margin coefficient is statistically significant and negative (coefficient = −0.019) for the Arts sector, suggesting that these nonprofits prefer internal financial resources for capital expansion—consistent with the pecking order theory of capital structure. Second, although the directions of the age and age-squared coefficients are consistent across the sectors, the previously reported statistical significance is driven by the Arts, Human Services, and Other sectors. This is unsurprising because these are three of the sectors with the lowest dependency on tax-exempt bonds, where access to the market is limited except for the most established and stable organizations. Finally, endowment is statistically significant and positive (coefficient = 0.085) for Hospitals, suggesting that increased endowments are associated with increased usage of tax-exempt bonds. These results are generally consistent with those found in Gentry (2002) and support sector-specific arbitrage concerns. Overall, the sector analyses find interesting, but limited, differences related to the increasing use of tax-exempt bonds.
Conclusion
This article draws attention to nonprofit tax-exempt bonds representing not only a significant and growing share of the sector’s borrowing but also a meaningful share of the municipal debt market as a whole. As a policy instrument, the subsidy from tax-exempt bonds is blunt, but fairly protected within the tax code from political whims. Current beneficiaries are primarily large, financially stable nonprofits. From a capacity perspective, our empirical findings continue to raise the questions that others began to discuss in the 1990s: How do we make smaller, capital-starved nonprofits better able to take advantage of the tax-exempt market in a responsible manner?
Broader access to tax-exempt bonds will depend not only on the unpredictable credit spreads of the market (between taxable and tax-exempt debt) but also on programs to address the high fixed costs of issuance and creative credit enhancement options for less established nonprofit organizations. Recent programs to encourage pooling of bond issuances—in which several smaller nonprofits issue a tax-exempt bond together to achieve the scale economies necessary to maximize benefits—represent one specific and infrequent approach that deserves further research. A further empirical question remains: Did borrowing increase significantly during the 2001-2009 time period because donors—with increased information about organizational finances—preferred current consumption to capital investments? If so, nonprofits may have substituted this traditional equity source of capital with increased borrowing.
This article also provides a comprehensive overview of the entire nonprofit sector’s dependence on tax-exempt bonds and provides researchers and practitioners with its historical, regulatory, and policy background. Future research will benefit from determining whether the variation in nonprofit tax-exempt bond activity across states results purely from the demand side (existing nonprofits’ capital needs) or from the supply side (the presence of conduit issuers that promote their services and provide easy access to tax-exempt capital).
Assuming an average interest rate spread between taxable and tax-exempt debt of 1.24%, a back-of-the-envelope estimate of the interest cost savings in 2012 by nonprofits is nearly US$5 billion annually based on the US$388.5 billion of outstanding nonprofit tax-exempt debt. The savings figure is small relative to nonprofit annual spending, but the impact on operations likely differs drastically across specific organizations and sectors. To put the savings into perspective and illustrate the potential operational impact, the estimated US$5 billion in savings is nearly equivalent to all of the funds raised in 2012 by the United Way and its thousands of local organizations across the world (United Way Worldwide, 2013).
Large recurring federal budget deficits have led policymakers to reexamine the tax exemption of municipal and nonprofit debt interest, especially for nonprofit borrowers. Our discussion begins to answer who would be hurt and how badly if 501(c)(3) bonds are included in such tax reform efforts. Higher capital costs in health care, higher education, and social service provision (especially in contract costs) would marginally influence highly visible services through health insurance premiums, tuition bills, student loans, and state and local tax burdens, respectively.
Footnotes
Acknowledgements
We are grateful for the thorough reviews from two anonymous reviewers whose comments greatly improved this article.
Declaration of Conflicting Interests
The author(s) declared no potential conflicts of interest with respect to the research, authorship, and/or publication of this article.
Funding
The author(s) received no financial support for the research, authorship, and/or publication of this article.