
Abstract
This study investigates the wind effect on hexa-sectored scallop domes using Computational Fluid Dynamics (CFD) and wind tunnel tests. Similar to the shape of a seashell, the scallop dome is one of the most common domes used to cover large spans. The scallop dome has an additional curvature equal to its sectors compared to a base dome (spherical). Hence, it has better structural efficiency compared to a spherical dome under the same condition. The curvatures on the scallop dome create alternate “ridges” and “grooves” on it. According to the computations of the article, the grooves created on this dome in the sector, as well as their position angle to the wind direction significantly affect pressure coefficient value. Due to these differences, wind pressure on scallop domes significantly differs from wind pressure on spherical domes. The results indicate that the ridges cause negative wind pressure coefficients whose magnitude reaches a maximum of −2.0 for an angle of alignment of 30°. The analyses have been conducted through Ansys-Fluent. This study presents the equation of wind pressure coefficient in the most critical of dome groove positions. The arch created between the grooves of a scallop dome is another effective parameter on maximum negative pressure. In the case study scallop dome, if the wind effect angle is considered α = 15, the maximum deformation in the structure will be created, which is 20% higher than that of α = 0.
Introduction
Dome structures are often used to cover different kinds of roofs, especially arenas and amphitheaters. Scallop domes are among the most common dome types. Scallop domes have long been constructed worldwide using building materials, such as brick and stone. A scallop dome differs from a similar spherical dome in that it has one additional arch in each sector. Scallop domes will be transformed into spherical domes when the number of sectors reaches infinity.
The number of the scallop dome’s “ridges” and “grooves” will be commensurate with its sectors. Many mathematical equations govern the transition from a ridge to a groove in the scallop dome. Nooshin et al. 1 presented detailed information regarding scallop domes and different ways of creating various geometries of these domes using Formian. Moreover, regulations of Iranian space structures have some examples of this dome.
Despite their building materials, modern scallop domes are extremely light compared to the covered spans. Due to this relative lightness, wind significantly affects them, especially if the wind is accompanied by snow accumulation (asymmetric). The exact level of wind pressure on any structure must be obtained according to its shape and surrounding conditions. Wind pressure coefficients for common domes, such as spherical domes, are given in different regulations, although the equations governing the wind pressure coefficients for these domes are not provided. However, loading regulations do not provide any guidance regarding wind loading on scallop domes. This study is conducted due to the lack of adequate information in this regard. This research obtains wind pressure coefficient values through CFD-based numerical analysis and wind tunnel testing. Carrying out tests on physical models in the wind tunnel is one method to study the wind effect on special structures; however, these tests have some constraints. Due to the remarkable advances in the CFD method and its relative cost-effectiveness, numerical modeling for wind has captured interest. This section reviews the studies conducted on wind effects on structures with a dome or barrel vault shapes and similar structures. Blocken 2 provided a summary of over 50 years of Wind Engineering. Cheng and Fu 3 studied wind effect on spherical domes using the wind tunnel test. They investigated the wind pressure coefficient variation on a dome in terms of wind velocity variation they indicated that wind velocity variation does not significantly affect the wind effect on spherical domes. Rizzo 4 obtained wind pressure coefficients on parabolic roofs and presented these results in the form of isobar charts. Qu et al. 5 obtained wind pressure coefficient on barrel vault roofs according to Reynolds number variations. Vizotto and Ferreira 6 obtained wind pressure coefficients on hexagonal shells. Kateris et al. 7 studied the wind effect on barrel vault roofs using two-dimensional modeling. Zhao et al. 8 determined wind pressure coefficients on cooling towers and investigated the proximity effect of these structures. Shokrzadeh and Sohrabi 9 obtained wind pressure coefficients on cylindrical tanks and assessed the wind-induced buckling load of these structures. Sadeghi et al. 10 obtained wind effect on scallop domes with curve shape code 1 (mentioned above), indicating that it has the maximum effect with the ridge vertical to the wind. Sadeghi et al. 11 also studied the flexibility coefficient effect on shape coefficient (Cp) by simulating semi-spherical domes, and compared the results with wind tunnel test results. Recently, Cao and Tamura 12 conducted an LES study on a wall-mounted hemisphere floating in a boundary layer flow with Re = 7, which included critical and supercritical flows. Qiu et al. 5 conducted a comprehensive study on cylindrical roofs with different dimensions and reported wind effect coefficients on these structures. Liu et al. 13 studied the wind load effect on a structure with a large span and employed wind tunnel test results and field measuring. Using wind tunnel tests, Kim et al. 14 obtained wind pressure coefficients on single-span greenhouses. Hu et al. 15 investigated the uplift effect due to the wind load effect on the storage tank and studied the buckling effect on tank shells. Chen et al. 16 studied external and internal pressure effects on domes with large spans and low thickness, and investigated these structures’ proximity effect. Kim et al. 17 obtained maximum wind pressure coefficients on dome roofs for roof cover design. Enajar et al. 18 proposed a suitable computational method for non-linear analysis of roofs to determine roof connection force against wind load. Yahyai et al. 19 studied the wind effect on Milad tower using numerical modeling. Rajabi et al. 20 Presented wind pressure coefficients on a building with a Y-shaped plan using wind tunnel testing and numerical modeling.
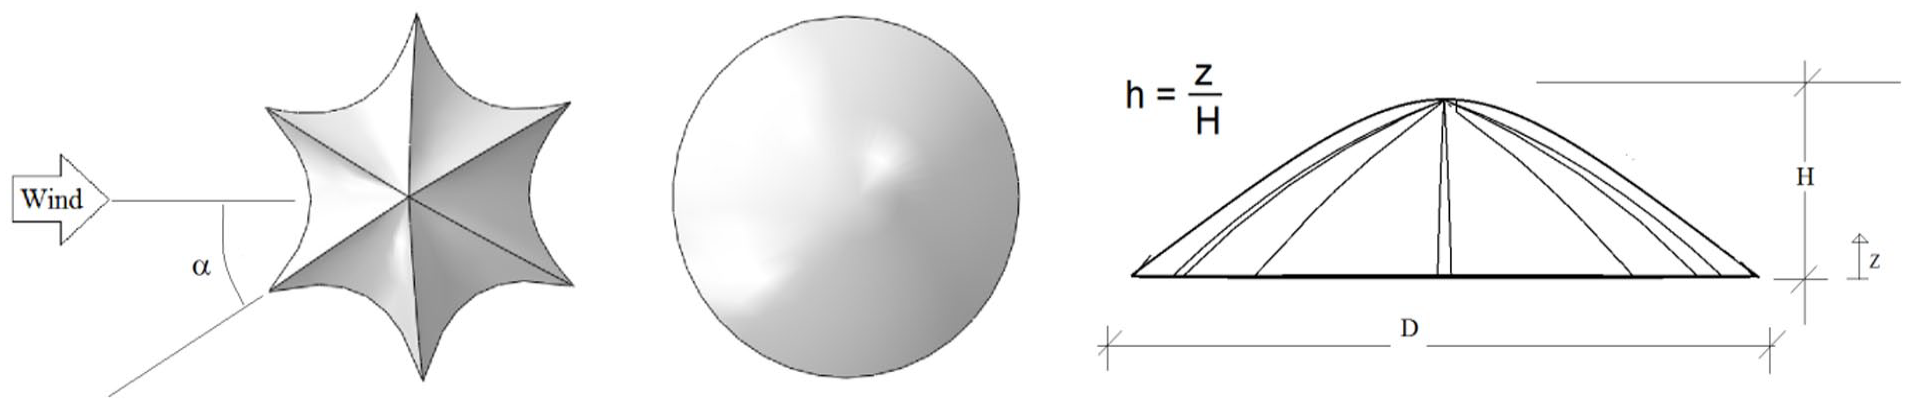
Figure 1 indicates details and definitions of scallop dome obtained from the article. 1 The right side of this figure demonstrates Formian and the code creating the scallop dome in the software. Due to the resemblance of this dome hollyhocks, the Journal of Iranian Workspace Structure has appointed the Persian name of this flower to the dome.
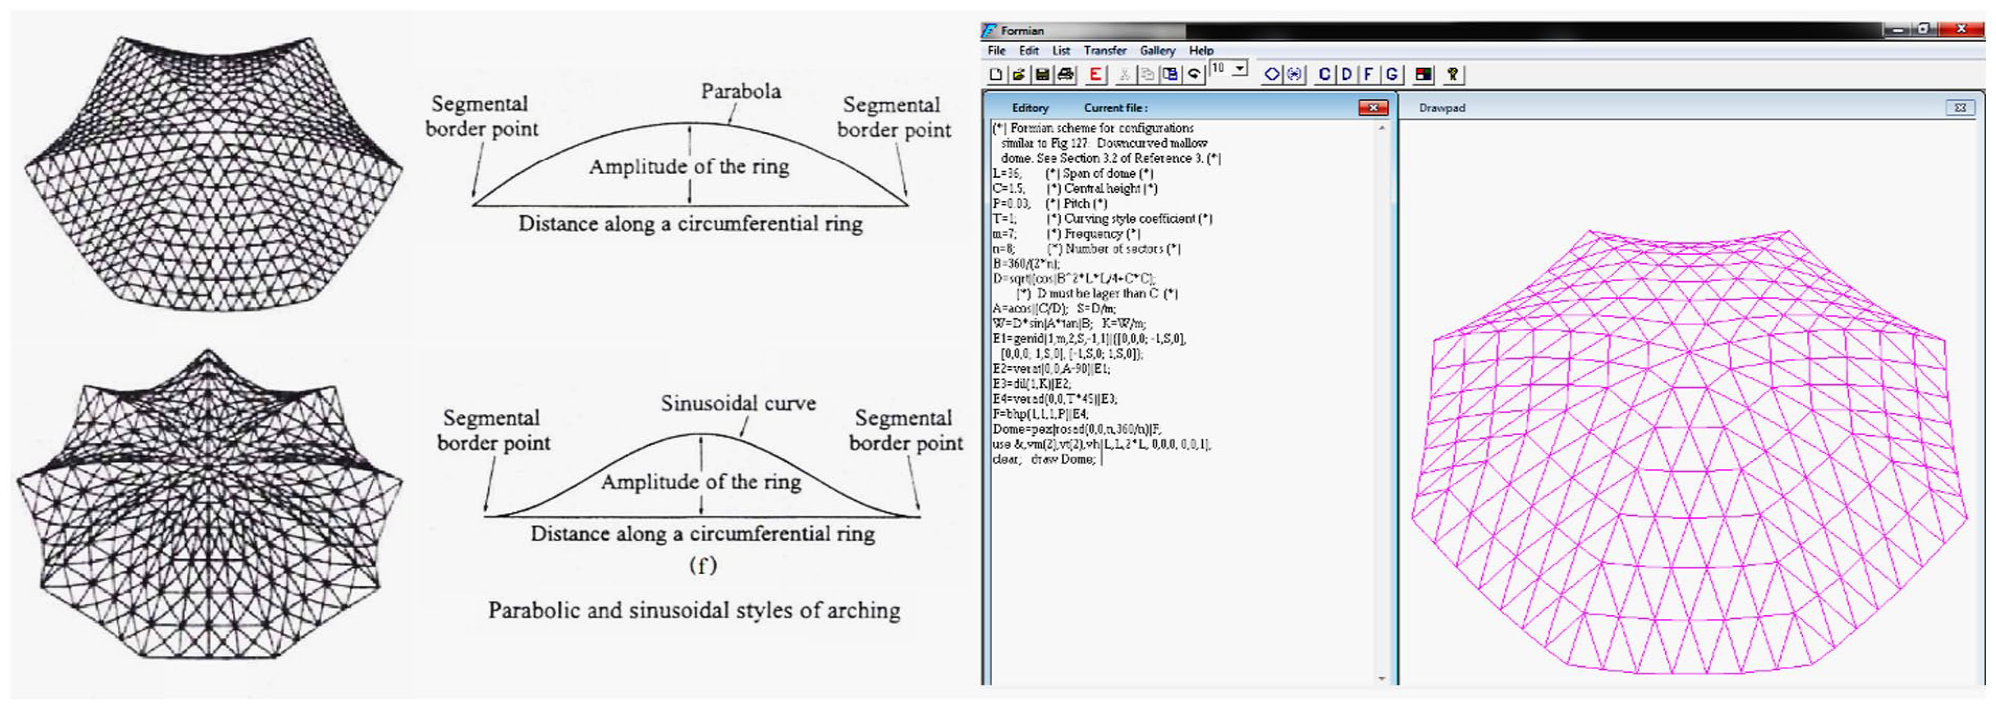
Specifications of scallop dome and Formian software.
Figure 2 illustrates the case study structure model in the wind tunnel test built by cutting a piece of wood.
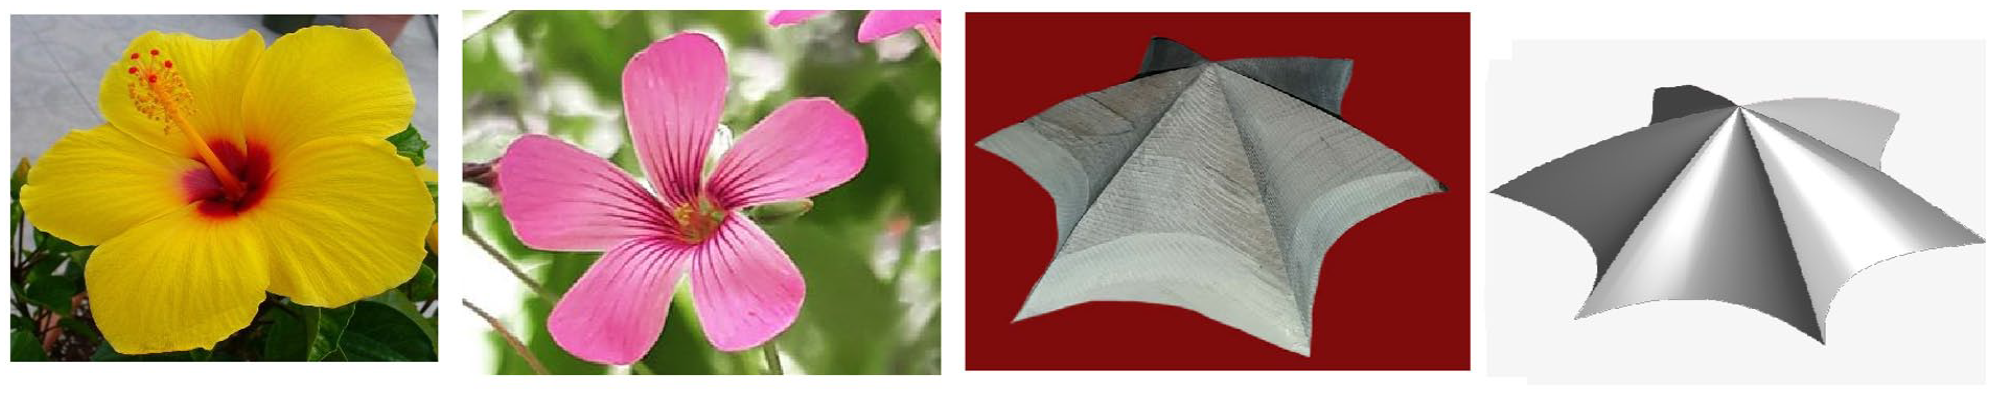
Hollyhocks and the dome resembling this flower.
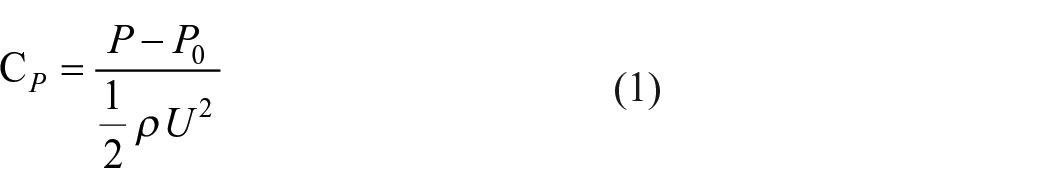
In equation (1),
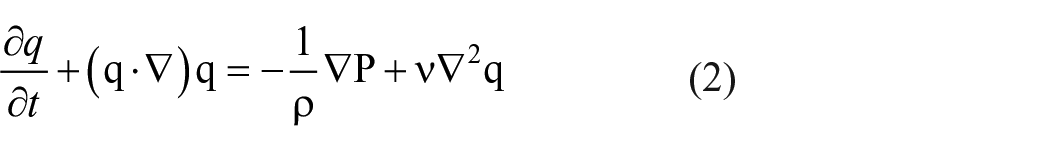
where q, denotes the velocity vector, P, the pressure, and the constants ρ and ν are the density and kinematic viscosity, respectively.
Experimental conditions
In Figure 3, the details of the wind tunnel testing have been provided. In order to calculate the effect of wind load on the scallop domes and find the maximum effect of wind on this type of dome, 24 holes were created on the two sections of the dome. In that case, the pressure measurement pipes were connected to the sensors through these holes. In order to find the changes in the tunnel pressure coefficients at each time of the test, this dome is rotated by 7.5° based on the inflow wind direction. The experiment is repeated at each stage; generally, this experiment has been carried out 27 times. The inflow wind velocity in the tunnel has been considered 20 m/s.
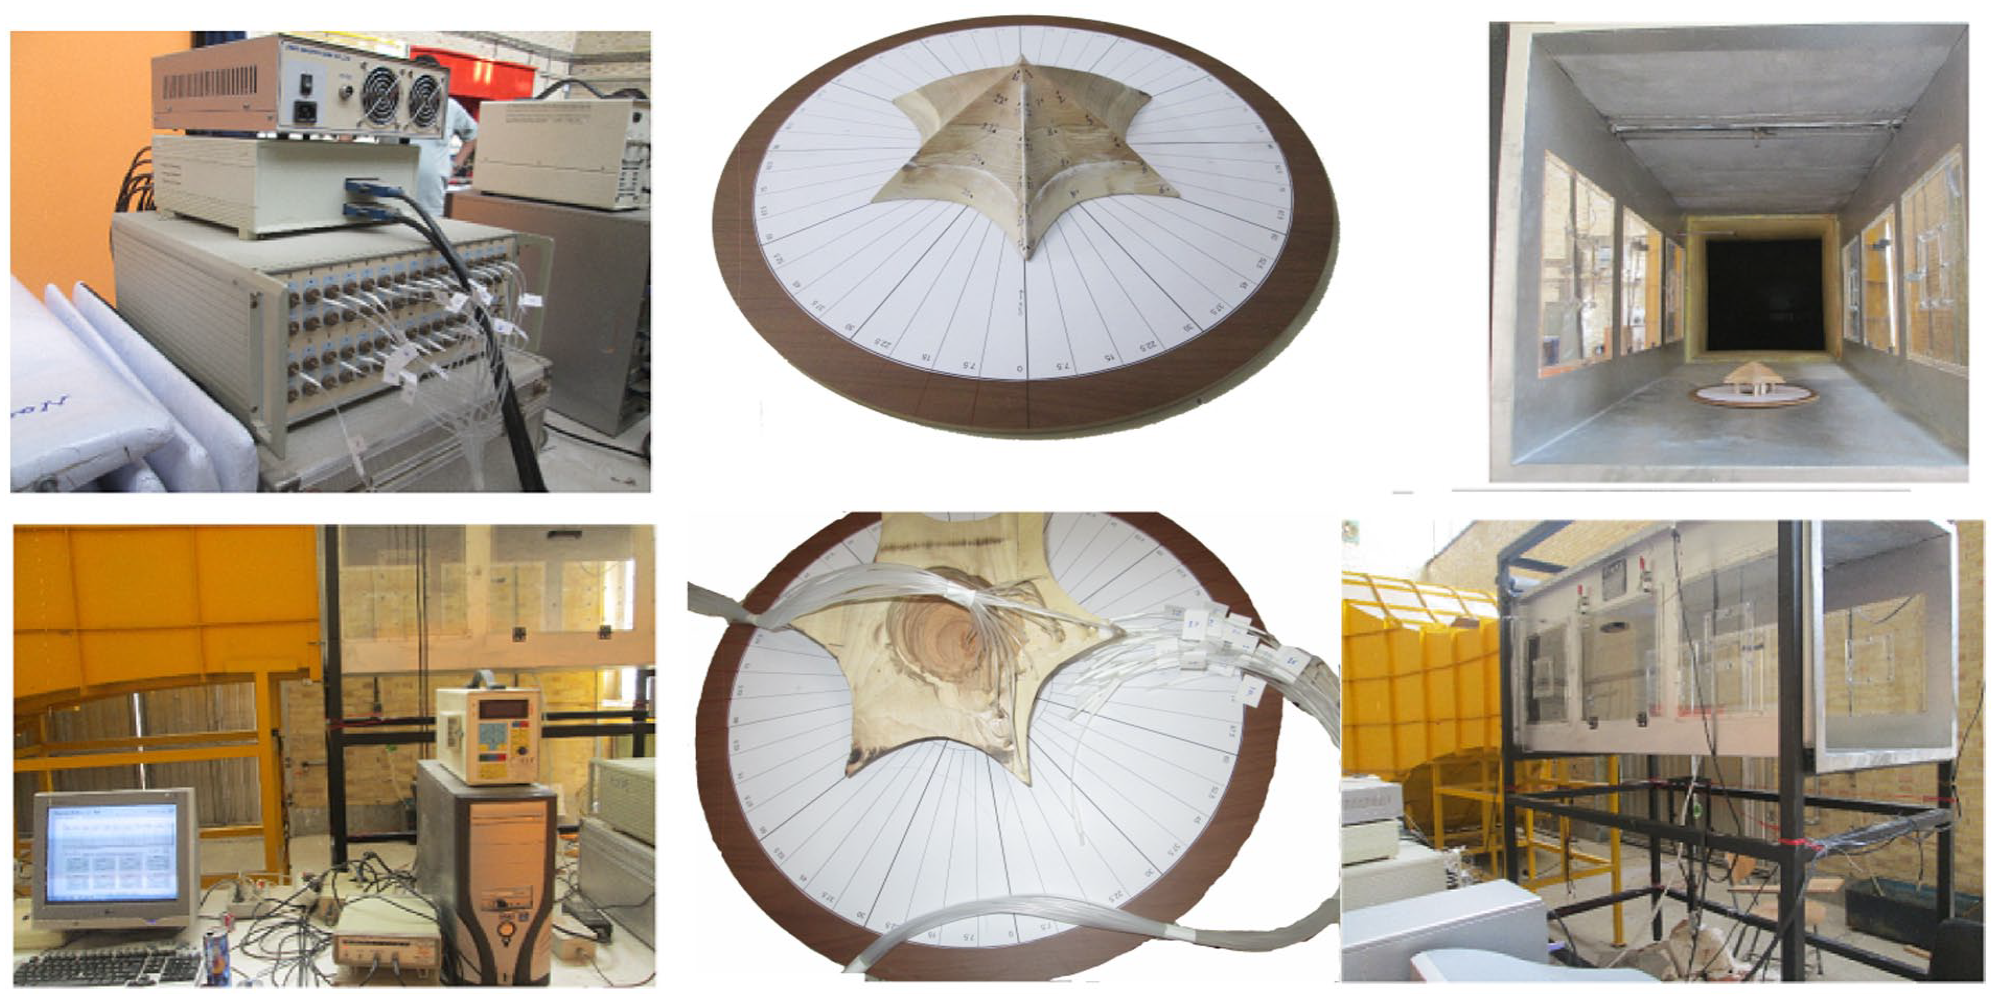
The details of the wind tunnel testing.
According to Figure 4, the changes made in the wind pressure coefficients of each sensor are demonstrated by changing the placement angle of the structure based on the wind direction. Concerning the measurements on the experimental samples, we can obtain the pressure coefficient values on the scallop dome. In order to complete the work, find proper results, and provide the controlling parameters in the wind pressure coefficients, CFD-based modeling has been done on such domes. The difference between scallops with spherical domes is in the existence of bumps in Figure 5, The spherical dome encompassing the scallop dome has been drawn. The wind pressure coefficients have been drawn on the spherical and scallop domes using numerical modeling, and the wind pressure coefficients of both domes have been compared in Figure 8
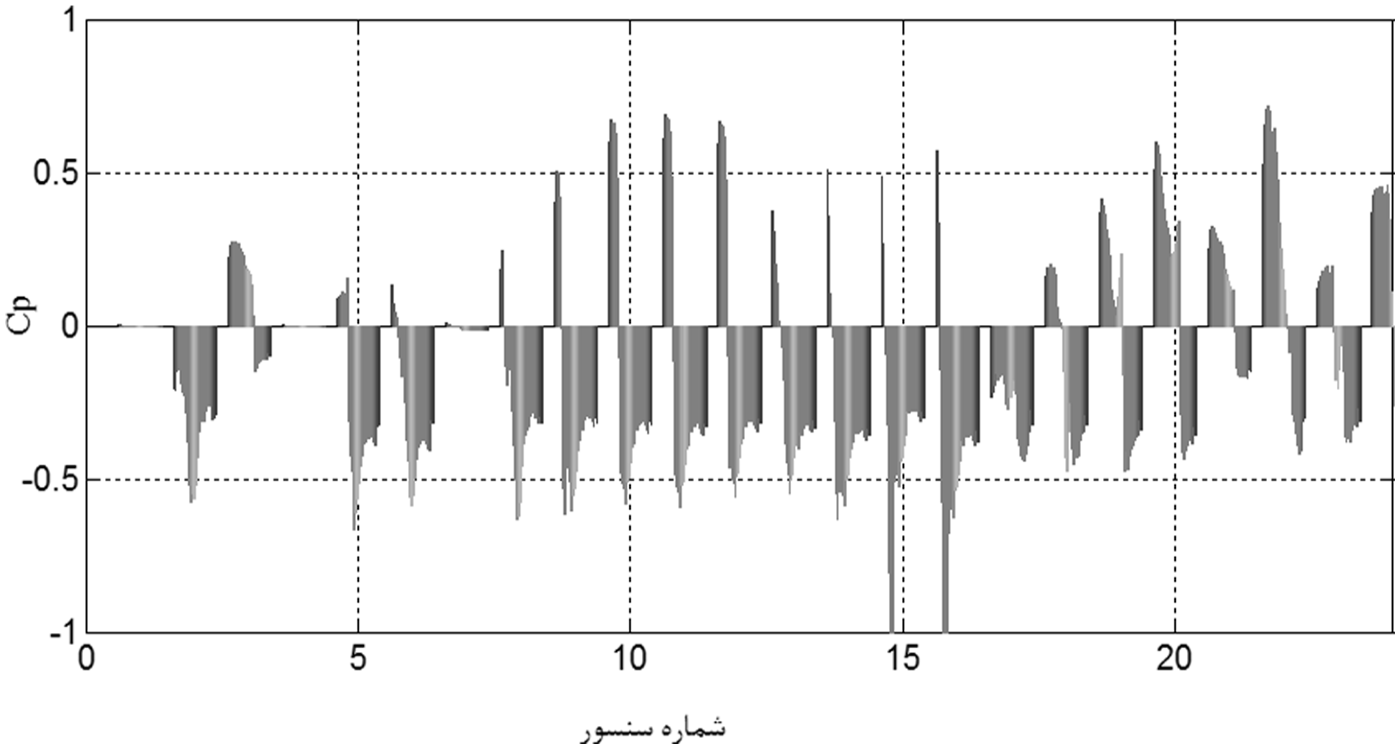
The wind pressure coefficients change on each sensor with the angle change.
Scallop and the equivalent spherical dome.
As shown in Figure 5, the difference between the spherical and scallop domes in geometrical terms is in the existence of grooves that cause the changes in the diagram of wind pressure coefficients.
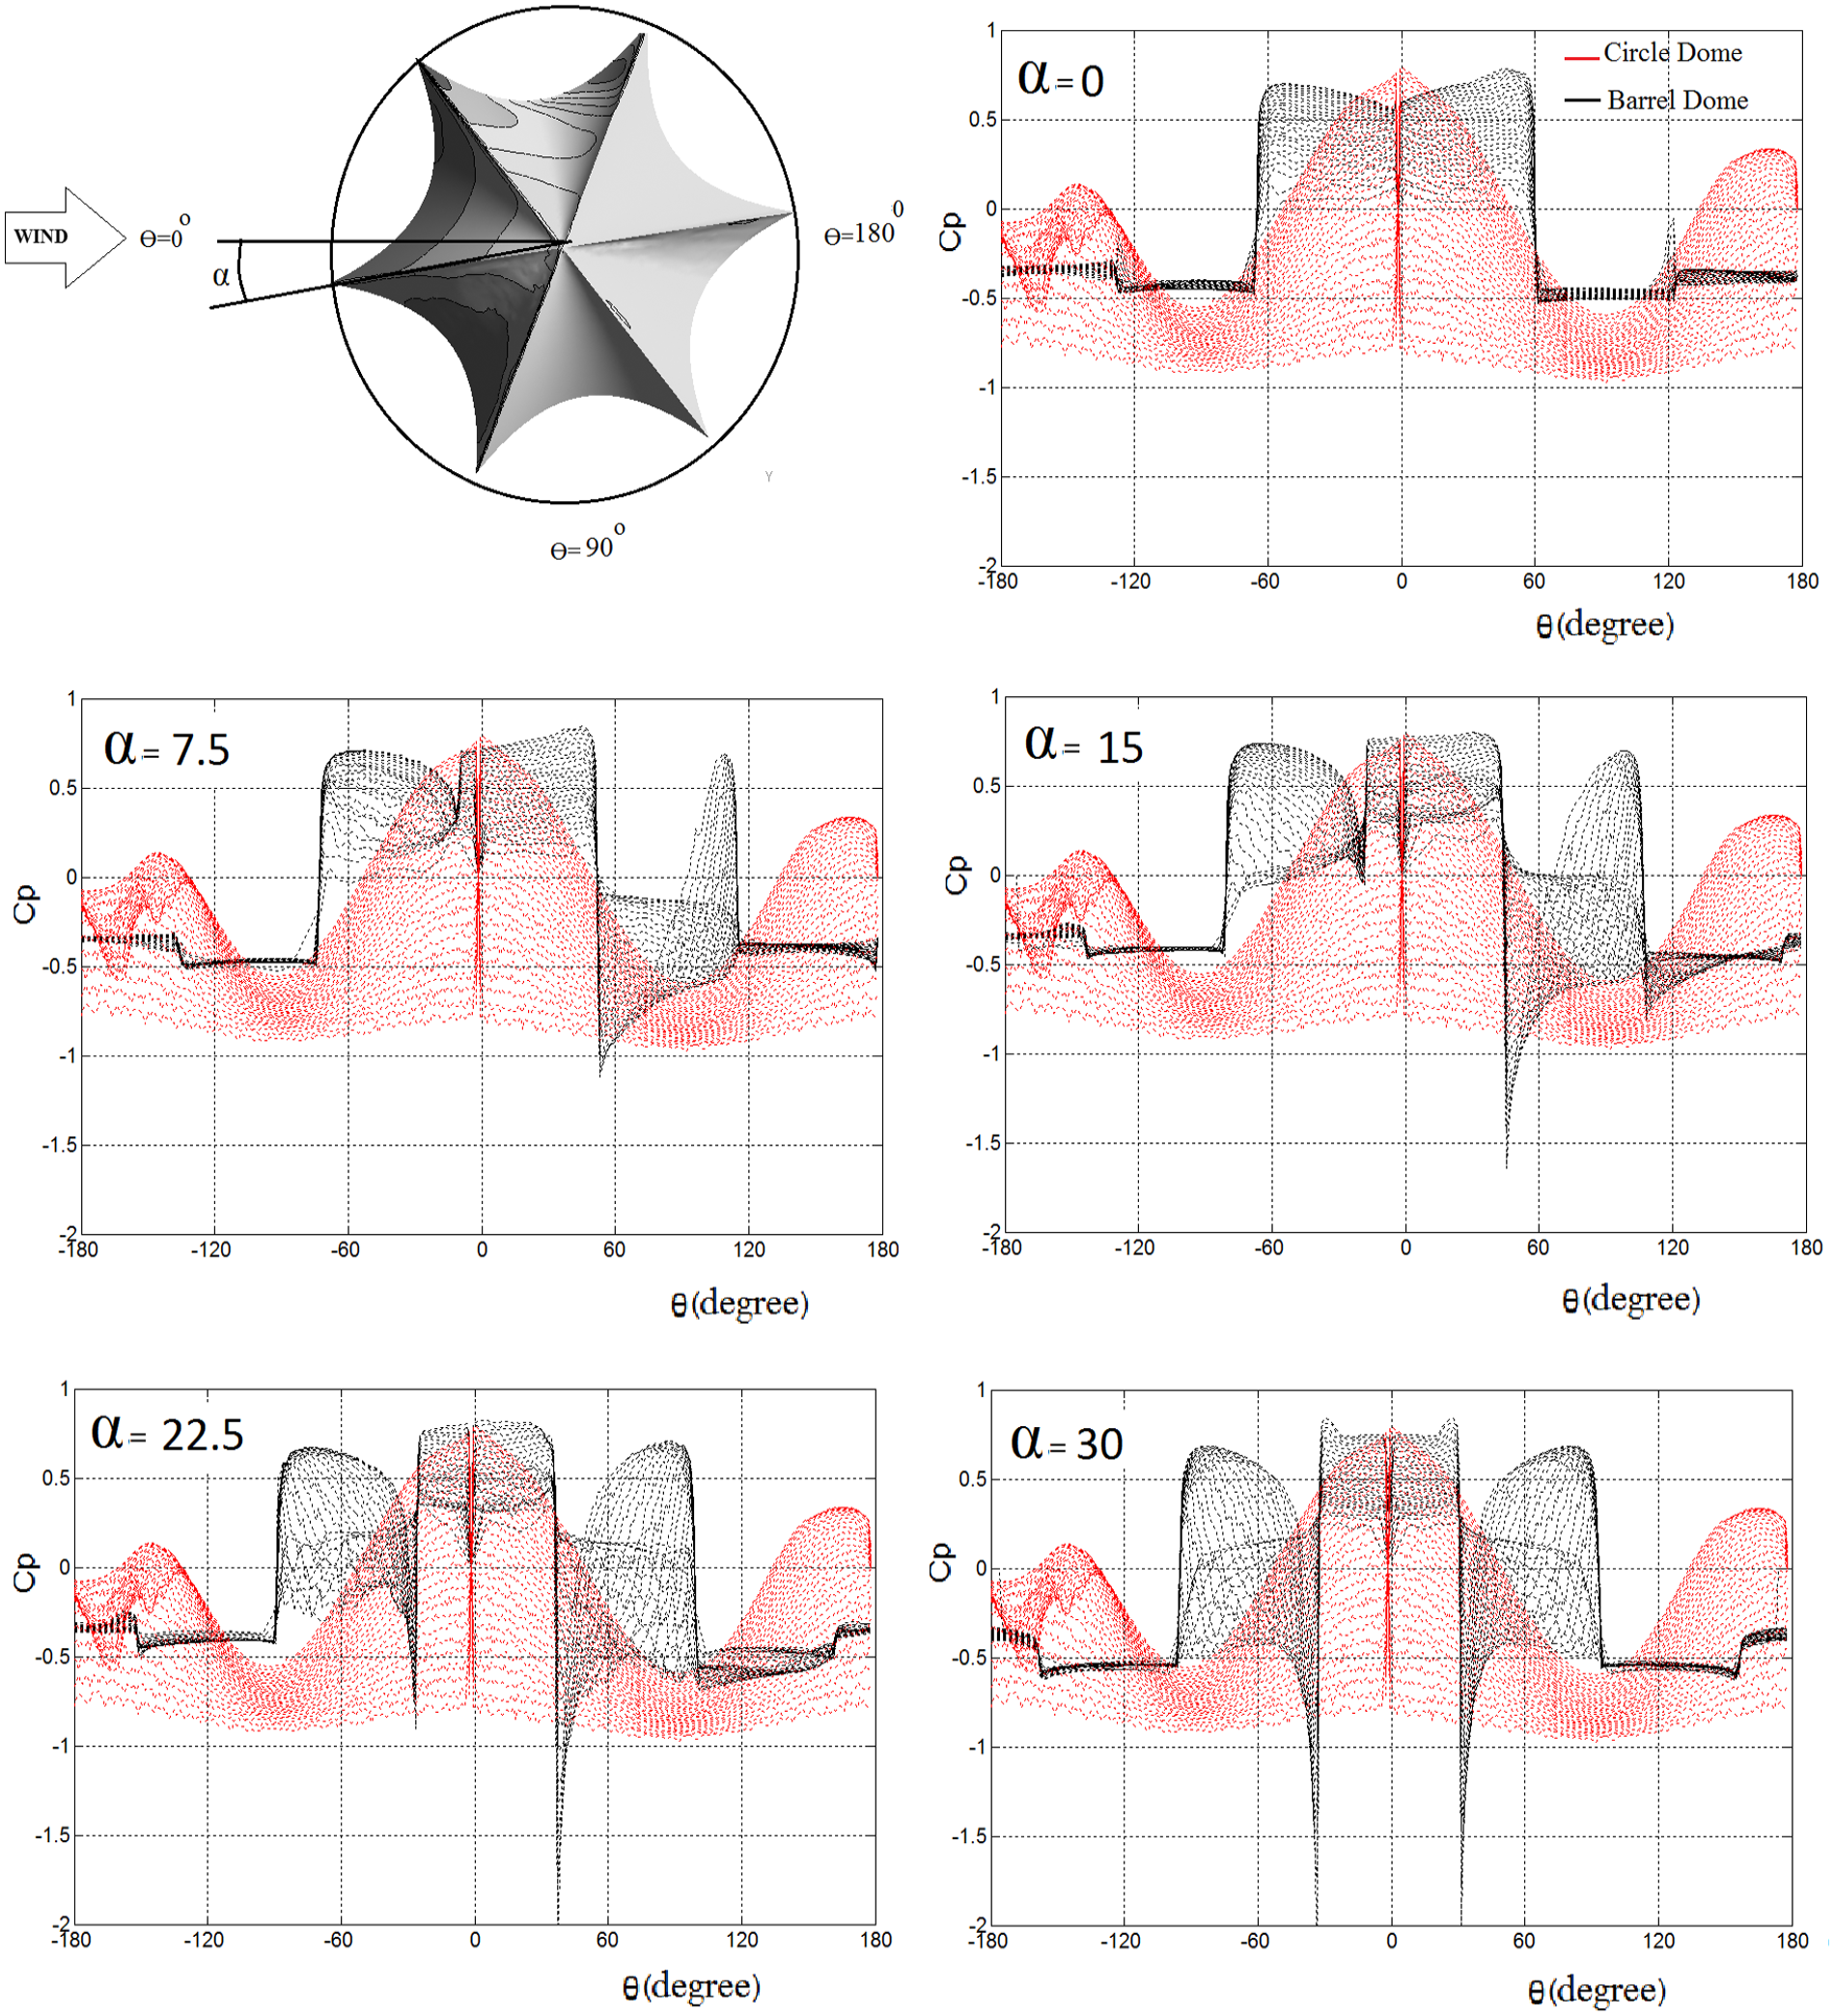
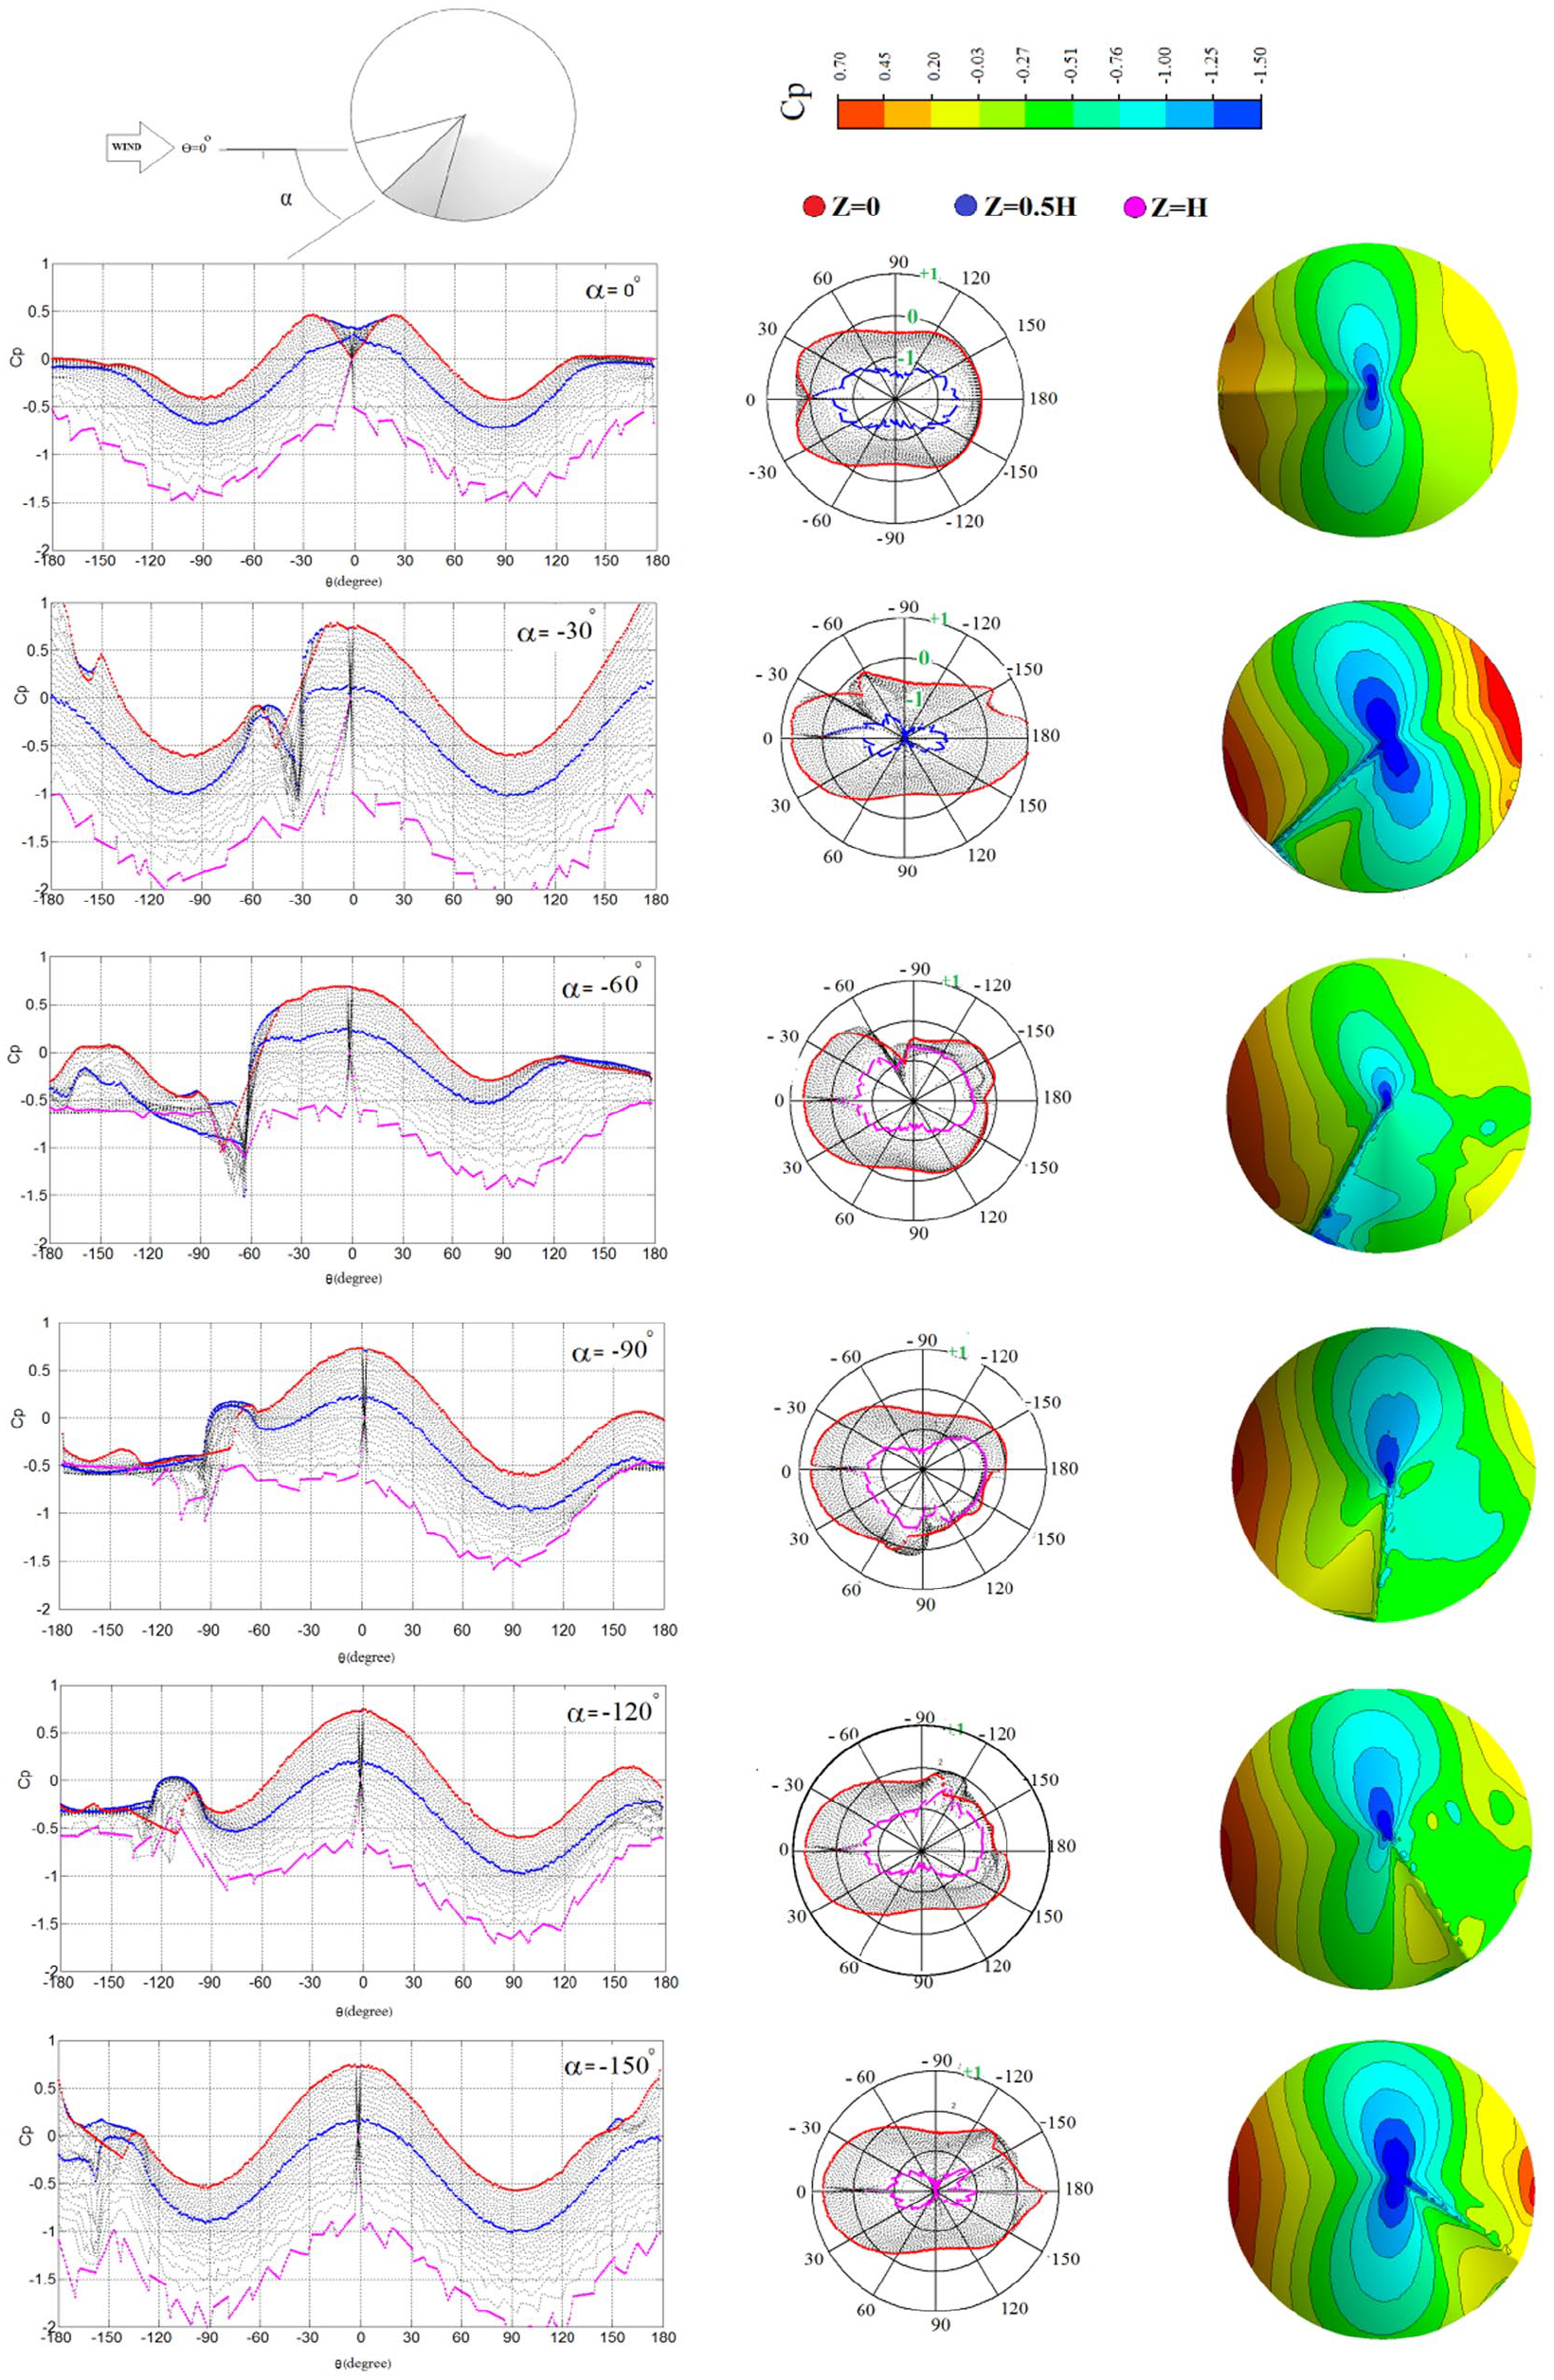
According to Figure 6, a hexagonal scallop dome has been studied. Also, the wind pressure coefficient changes have been drawn concerning its position compared to the wind direction. In this figure, the wind pressure coefficients have been drawn in the Cartesian and Polar coordinates. Besides, the wind pressure coefficients contour has been illustrated in the figure. Given that the dome is formed by six sections, the angle of each section is 60°. In the case of α = 0, the maximum value of negative pressure (suction) is equal to −0.5, and it is constant from 60° and so on. Due to the symmetrical shape of the dome compared to the loading, the pressure coefficient are symmetrical in this case. In the case of α = 7.5°, the maximum negative pressure (suction) equals -−1.15 at 52.5°. In the case of α = 15, the maximum negative pressure (suction) equals −1.65 at 45°. In the position that the structure is placed at α = 22.5° (compared to the wind direction), the negative pressure value equals −2 at 37.5°. Ultimately, in the case of α = 30, the maximum negative pressure at 30° is −2. In this figure, symmetry is observed in the Cp curve and contour. According to this figure, it can be concluded that the leap in the negative values that are created due to the scallop domes occurs at 30° as the basis that is equal to 1/2 of the dome section. The red, blue, and pink lines show the values of the pressure coefficients at the lowest, middle, and highest altitudes, respectively.
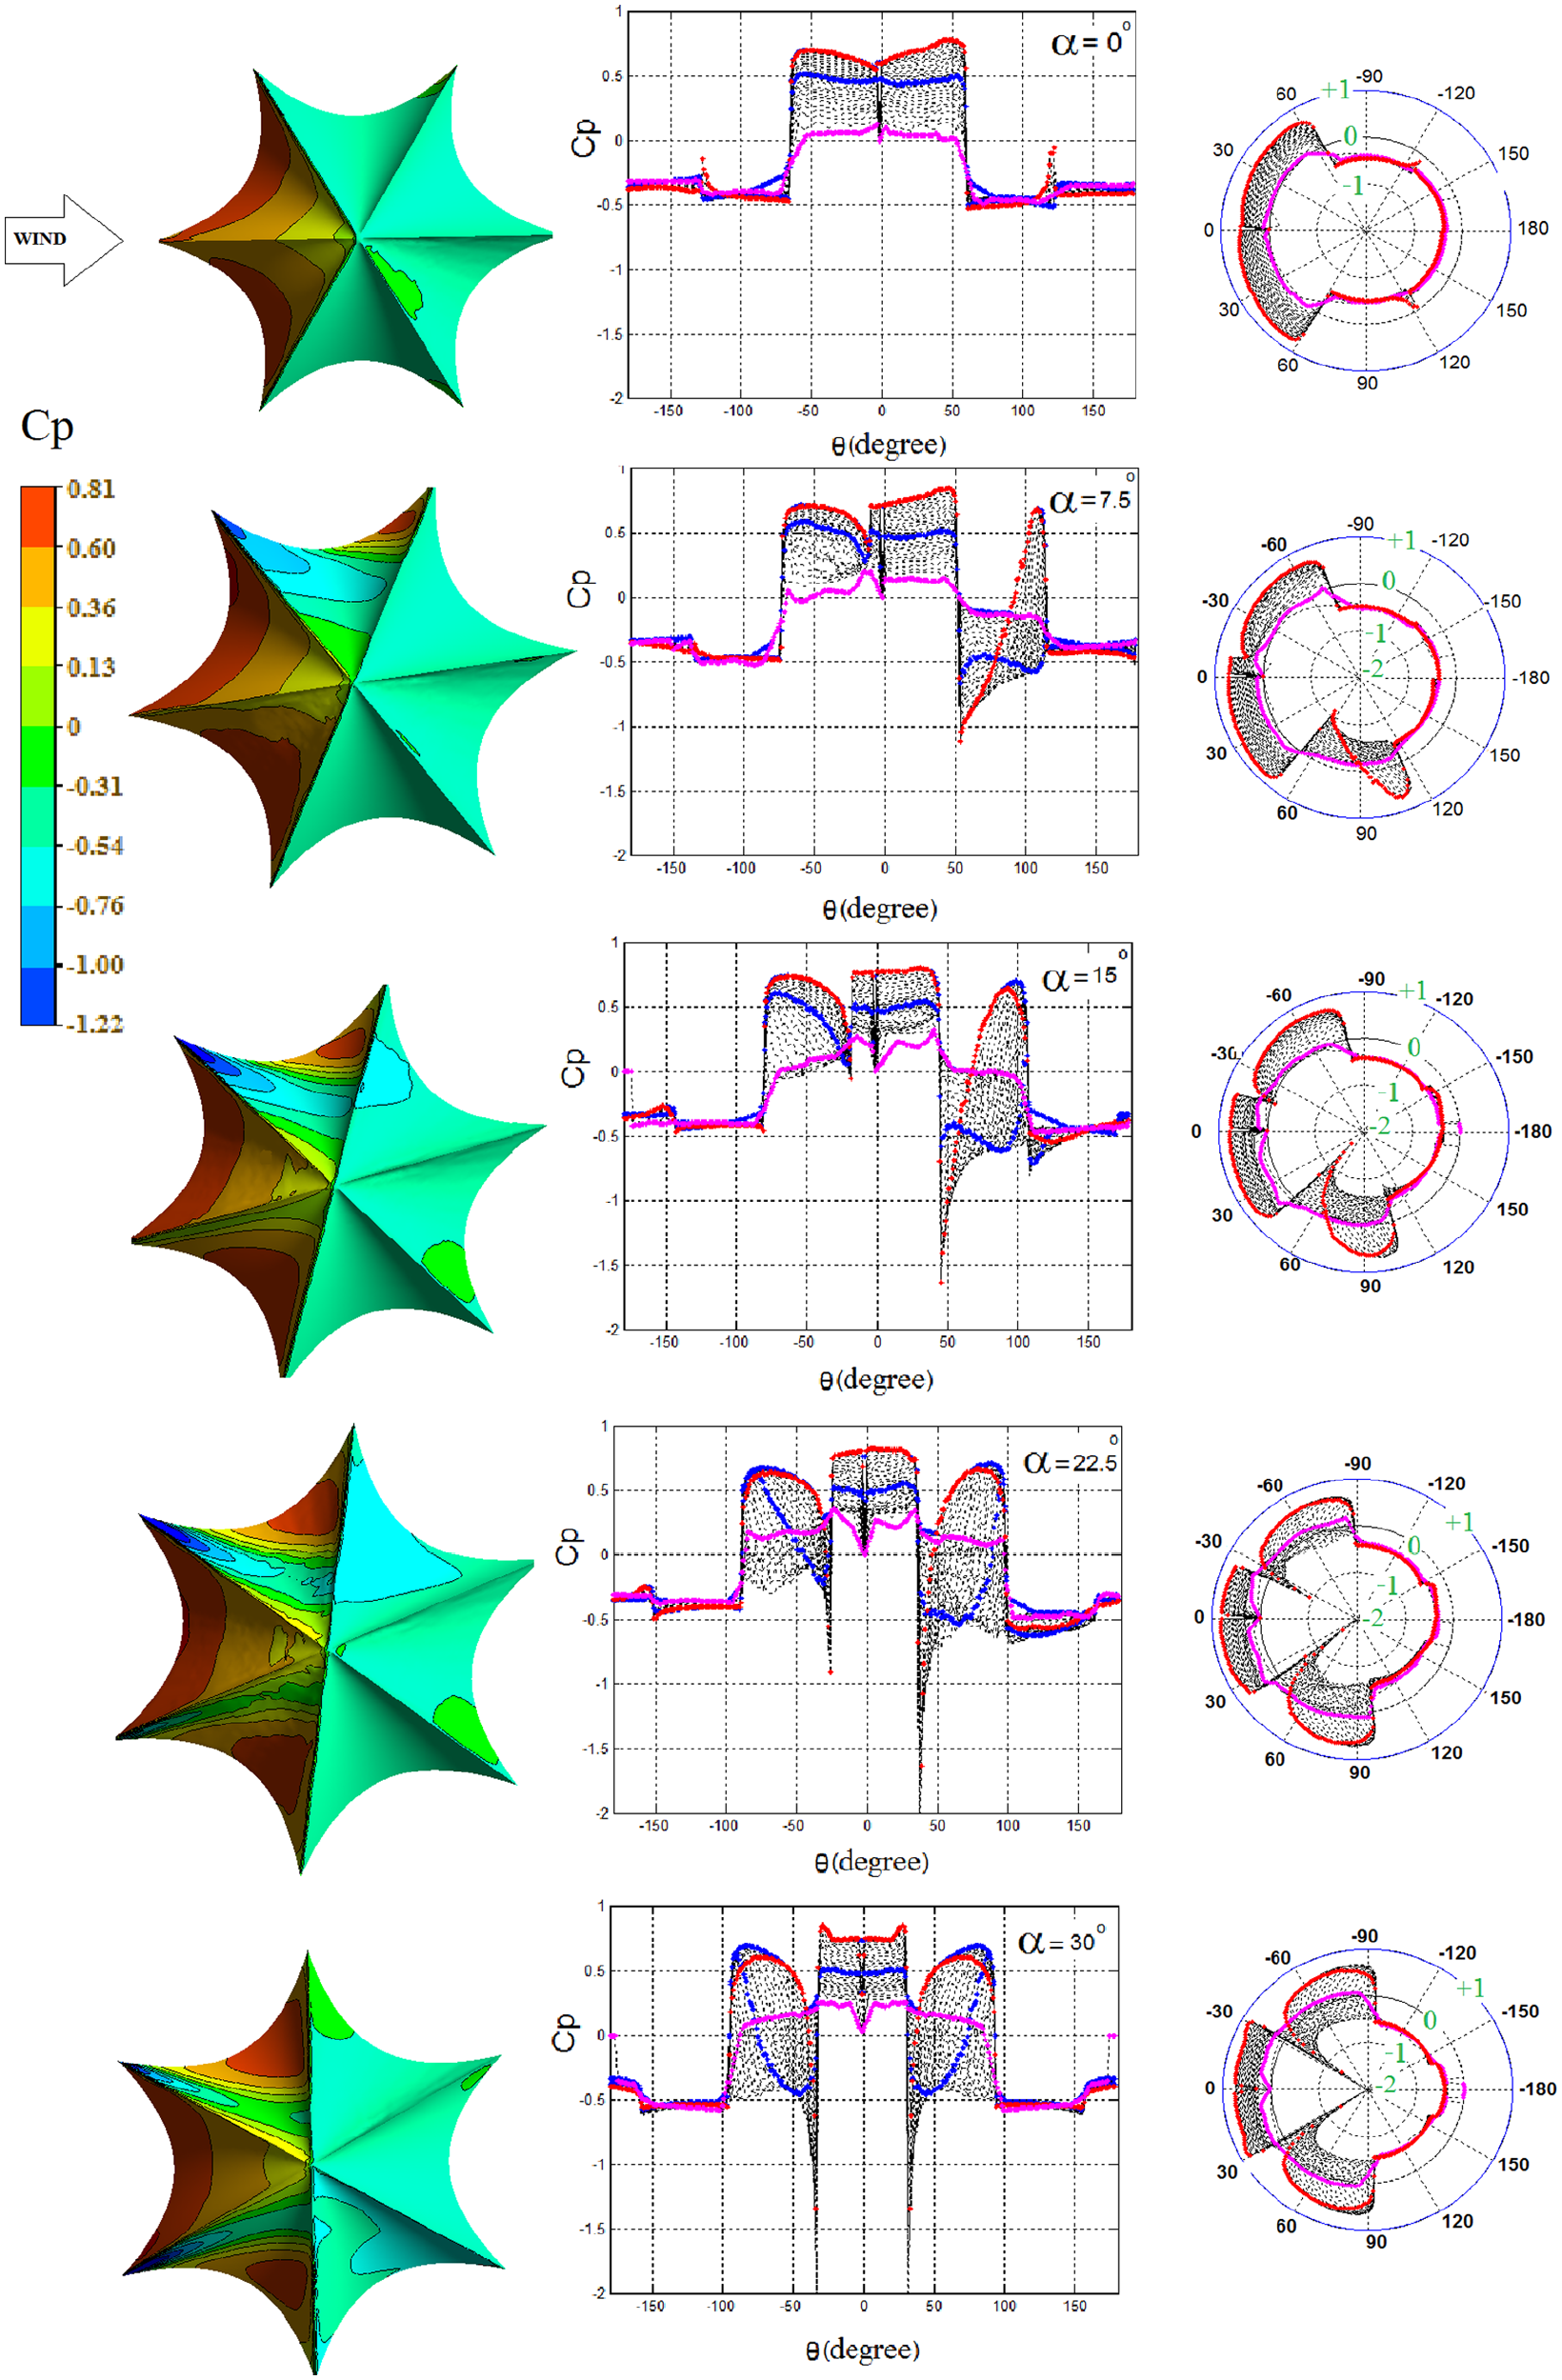
The created wind pressure coefficients on the hexagonal scallop dome concerning the wind angle change with the structure.
Figure 7, demonstrates the velocity vectors in the proximity of the dome. In the parts where these lines get closer to each other, it shows an increase in the velocity. Additionally, vortex flows are observed in the proximity of the structure.
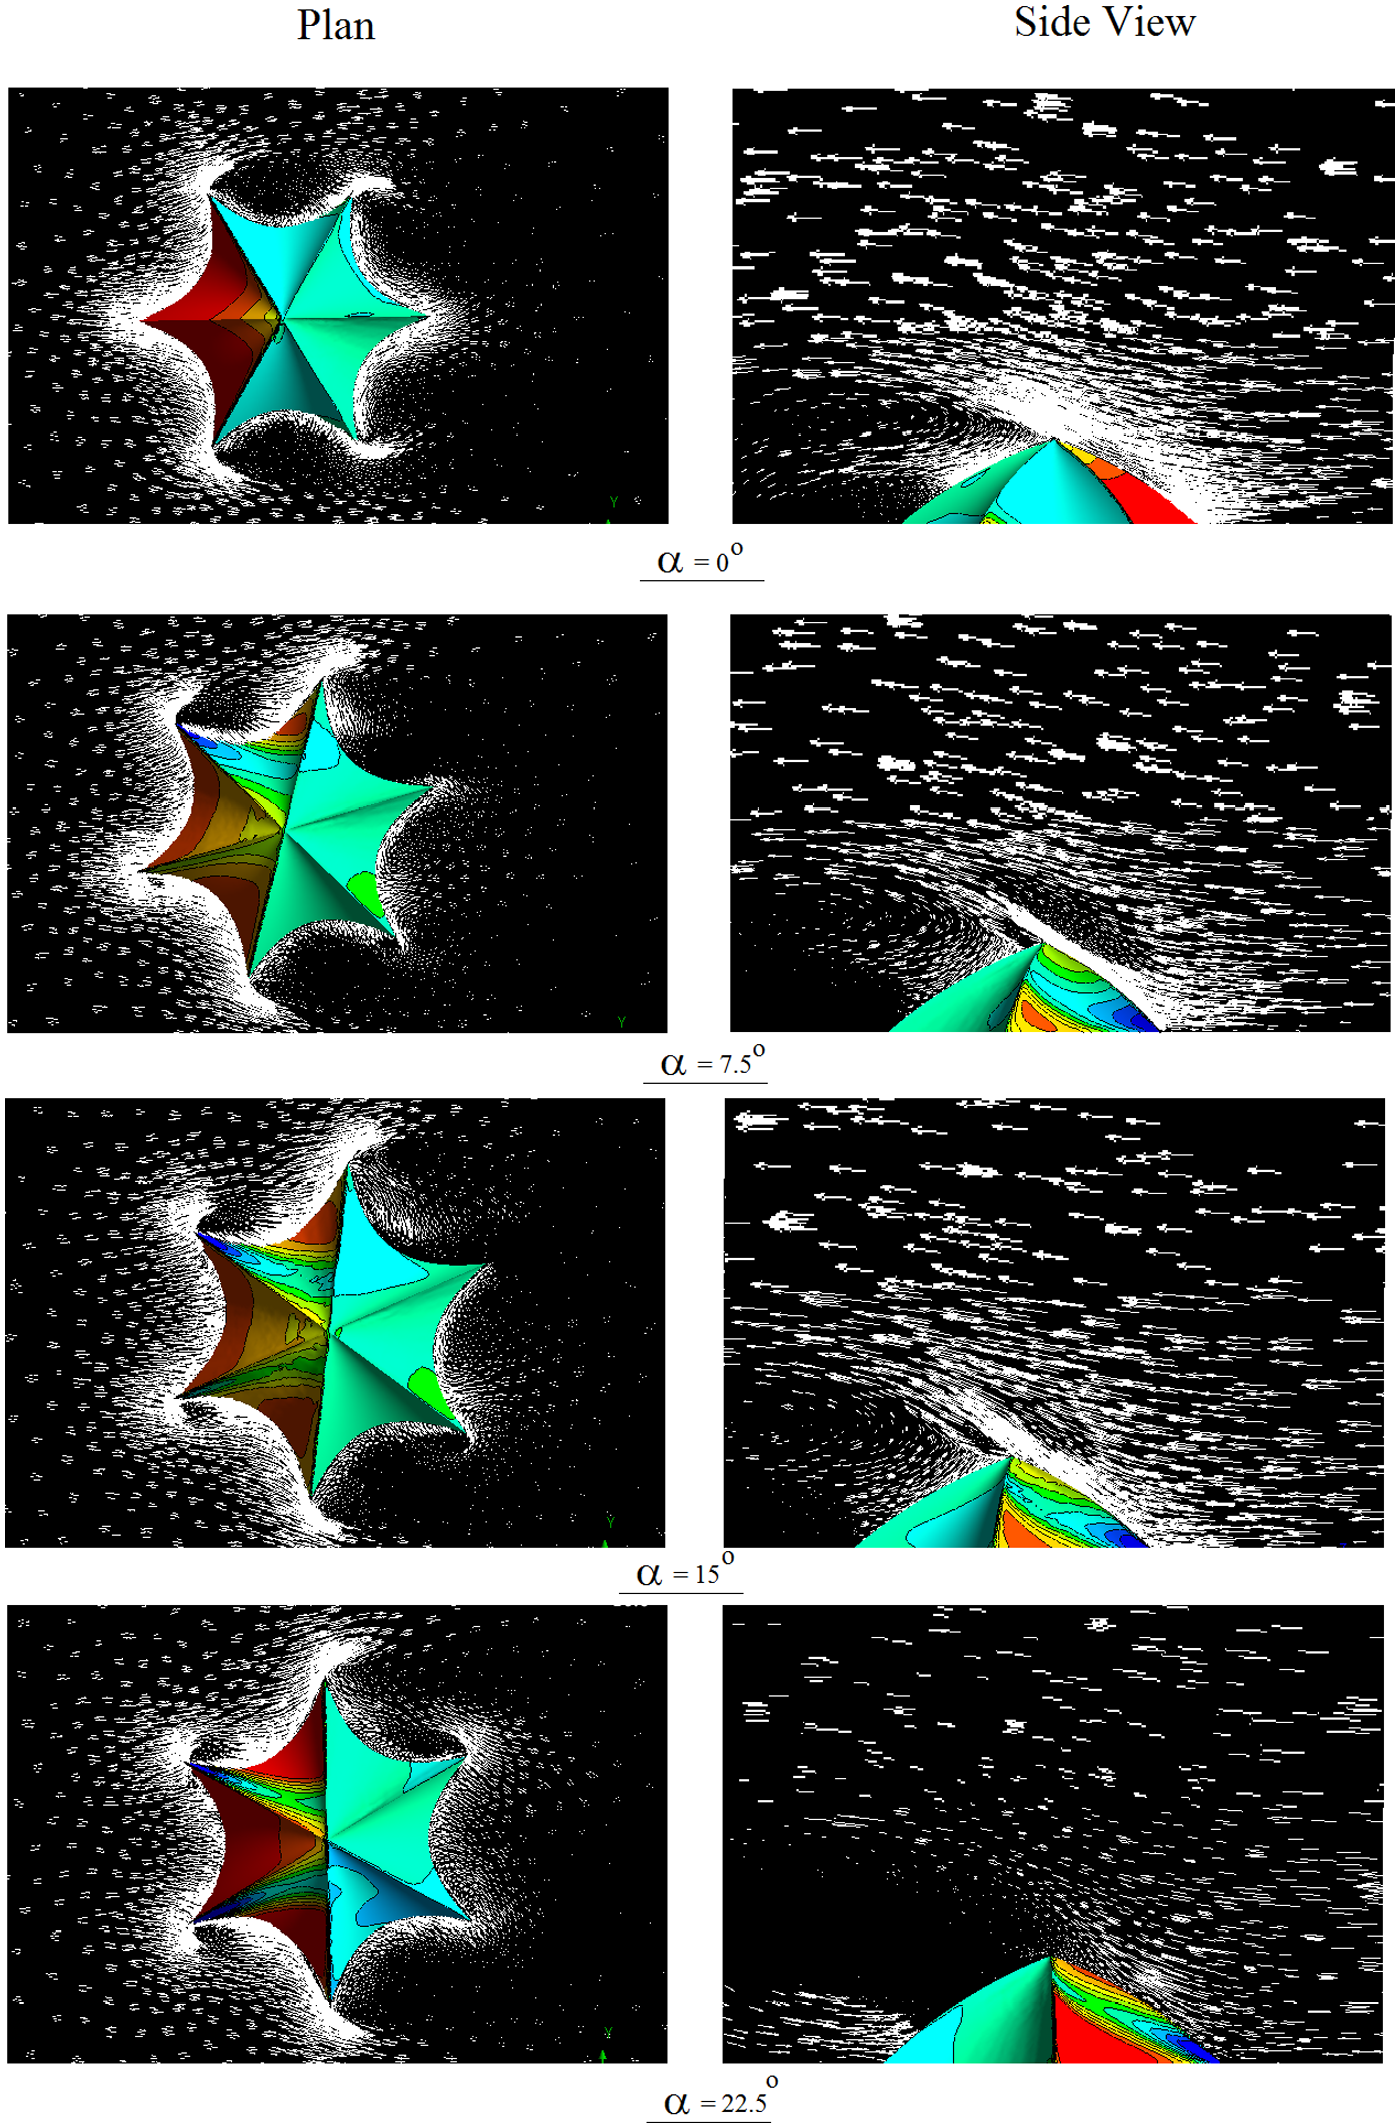
The velocity vector changes on the hexagonal scallop dome with respect to the wind angle change with the structure.
Figure 8, draws a comparison between the scallop and the spherical dome. With respect to the symmetry of the spherical dome in the entire states of α, the wind pressure coefficients are equal in different states of the wind direction. However, the wind pressure coefficient changes in the scallop dome concerning the position of the dome grooves compared to the wind angle.
The comparison of the wind pressure coefficients created on the hexagonal scallop dome and the equivalent hemisphere concerning the wind angle change.
In Figure 9, the difference between the wind pressure coefficient resulting from the wind tunnel testing and the values obtained from the numerical modeling is observed; the reported values from the wind tunnel testing have been drawn at four heights h = 0.9, 0.7, 0.4, and 0.1. The wind tunnel testing results show that the structure has been drawn at α = 0 state; the leap values are observed at an angle of ɵ = 120° with a height of h = 0.1. To find the most critical position of the ridge with respect to the wind direction, the spherical dome has been drawn in Figure 10 with a groove equivalent to the scallop dome. In this dome, the ridge has been placed at α = 120°, α = 90°, α = 60°, α = 30°, α = 150°.
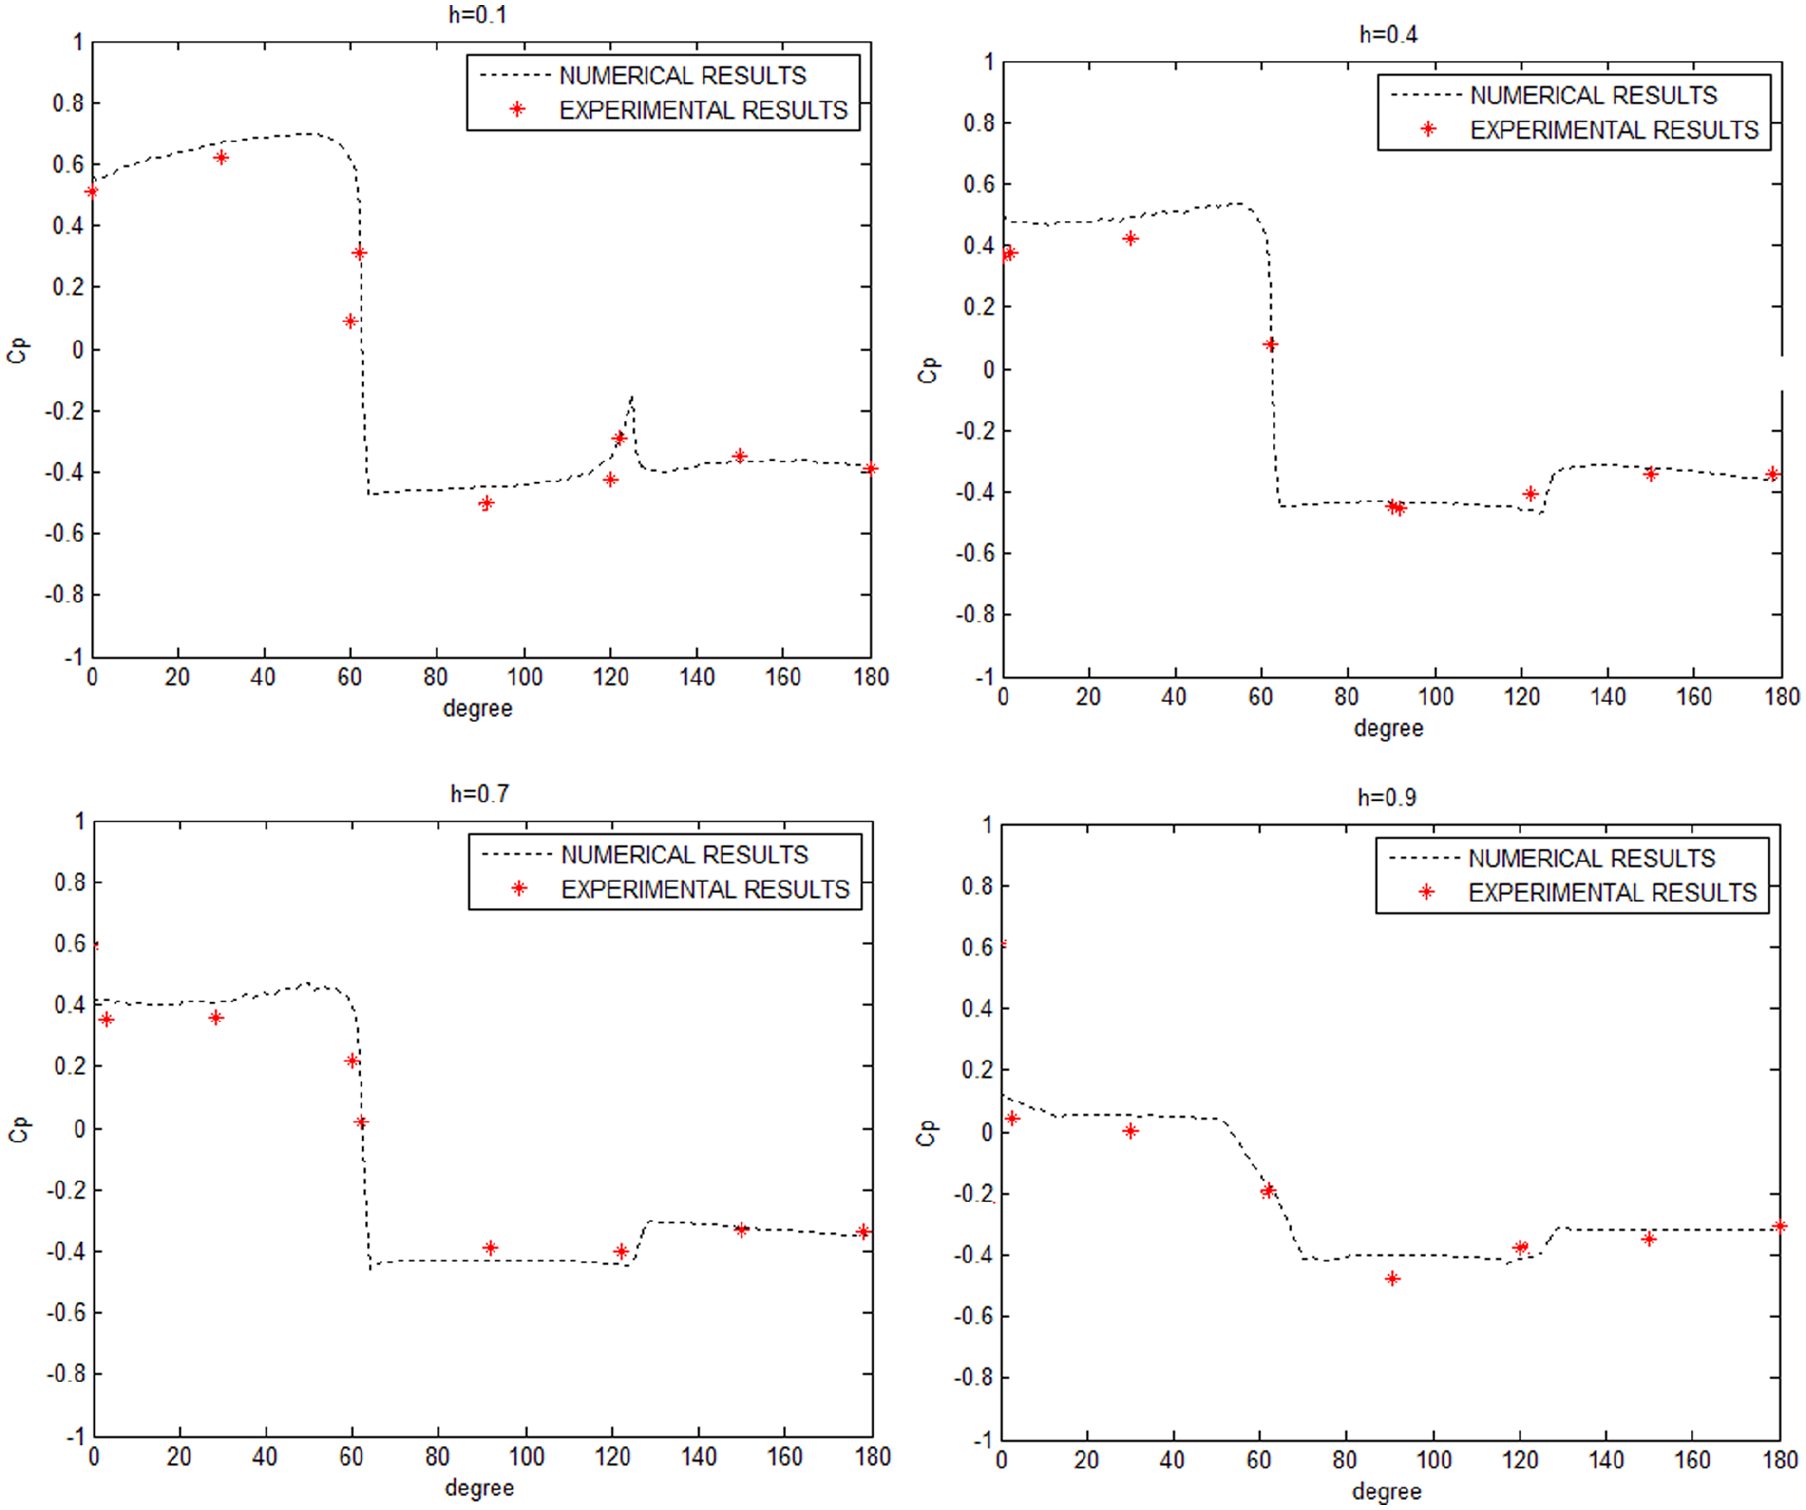
The comparison of the wind pressure coefficients created on the hexagonal scallop dome using the numerical and experimental methods.
The wind pressure coefficients on the spherical dome with a single ridge.
According to Figure 11, the structure shape change compared to the wind direction change is observed. Parameter D demonstrates the maximum structure shape change in different wind direction states compared to the ɵ = 0 state. In this figure, the maximum shape change in α = 7.5 state is more than α = 0 by 8%. Also, in the other states, α = 15°, α = 22.5°, α = 30°, and α = 37.5°, the maximum displacement is equal and compared to α = 0, it is greater by 20%.
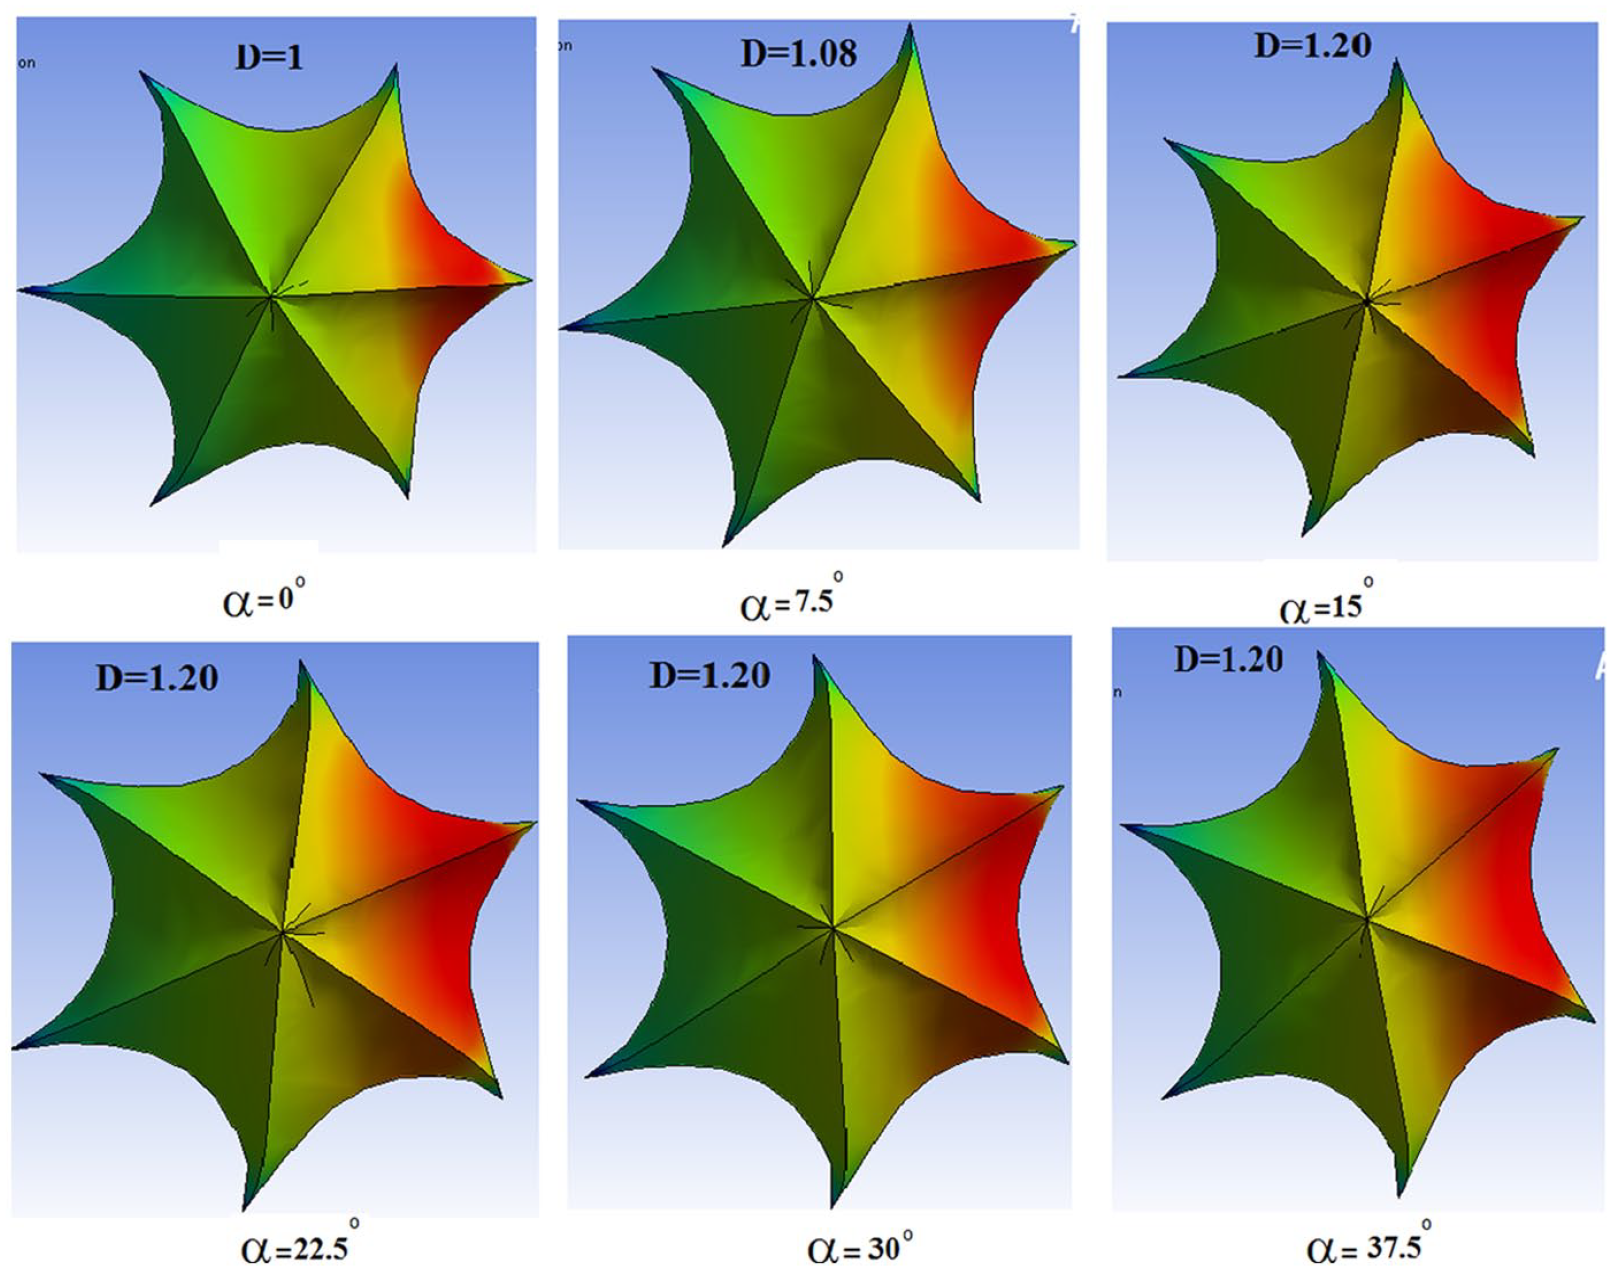
The dome shape changes following applying wind compared to the ɵ = 0 state.
Figure 12 demonstrates the effect of arc in the change of wind pressure coefficients. Parameter h demonstrates the level of arc depth. In the state of h = 0, the arc curvature is zero, and it is linear between the two sections. In h = +5, the arc is between two positive and convex sections. In h values, negative indicates that the arc between two sections is convex. In the h = +5 state, the sections are eliminated, and as a result, the leaps are not observed in the Cp curve in the position of the sections. In h = 0, there is a leap at a 90° angle where there is a groove, and it reaches a maximum value of −2. In h = −2.5, a leap is observed in Cp values at 90°: where the maximum value is −0.8. In h = −5, a leap is observed at 30° and 90°, and in h = −10, a leap is observed in the negative pressure coefficients in the section position at 30°, which equals −1.2. In the h = −15 state, the negative pressure coefficient reaches −1.8 at 30°.
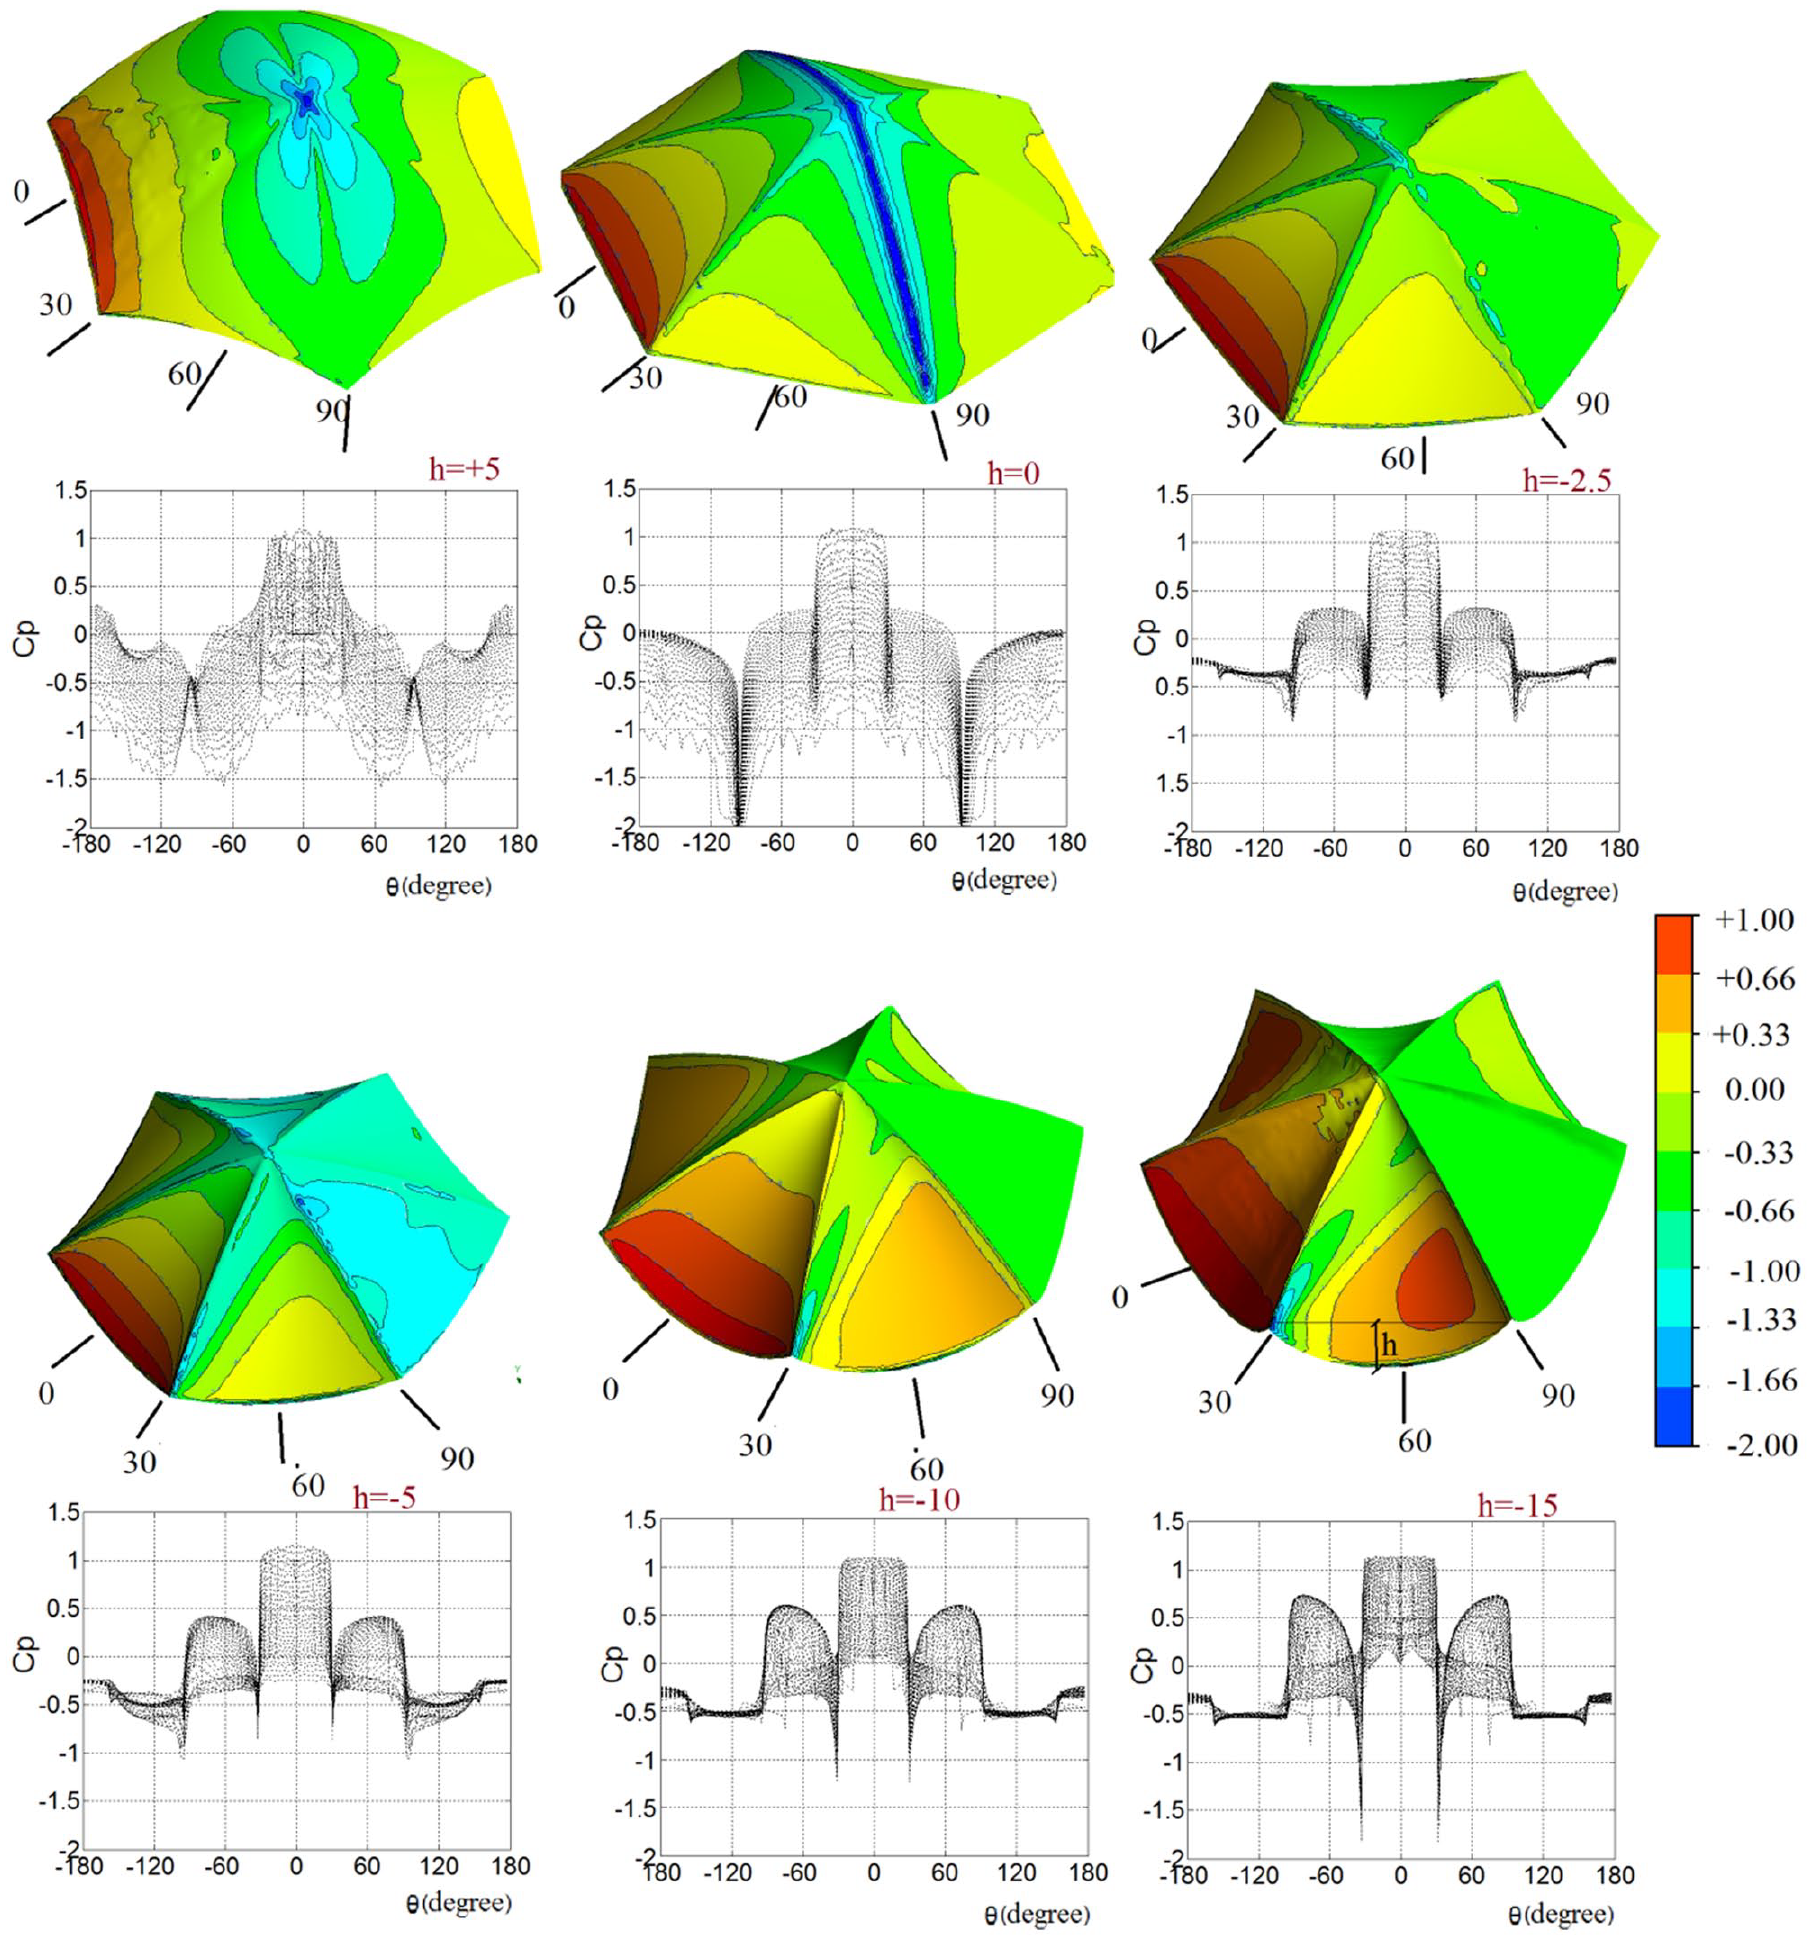
The wind pressure coefficients on the scallop dome with different ridge depth ratio.
The equation on the wind pressure coefficients in the sector
In order to find the equation to the most critical state of wind pressure coefficients value in region ɵ = 15° to ɵ = 45°, this change is because if the number of sections changes, the *ɵ limit remains unchanged. By using the demonstrated equation in Figure 13, the pressure coefficient values could be obtained in different height balances.
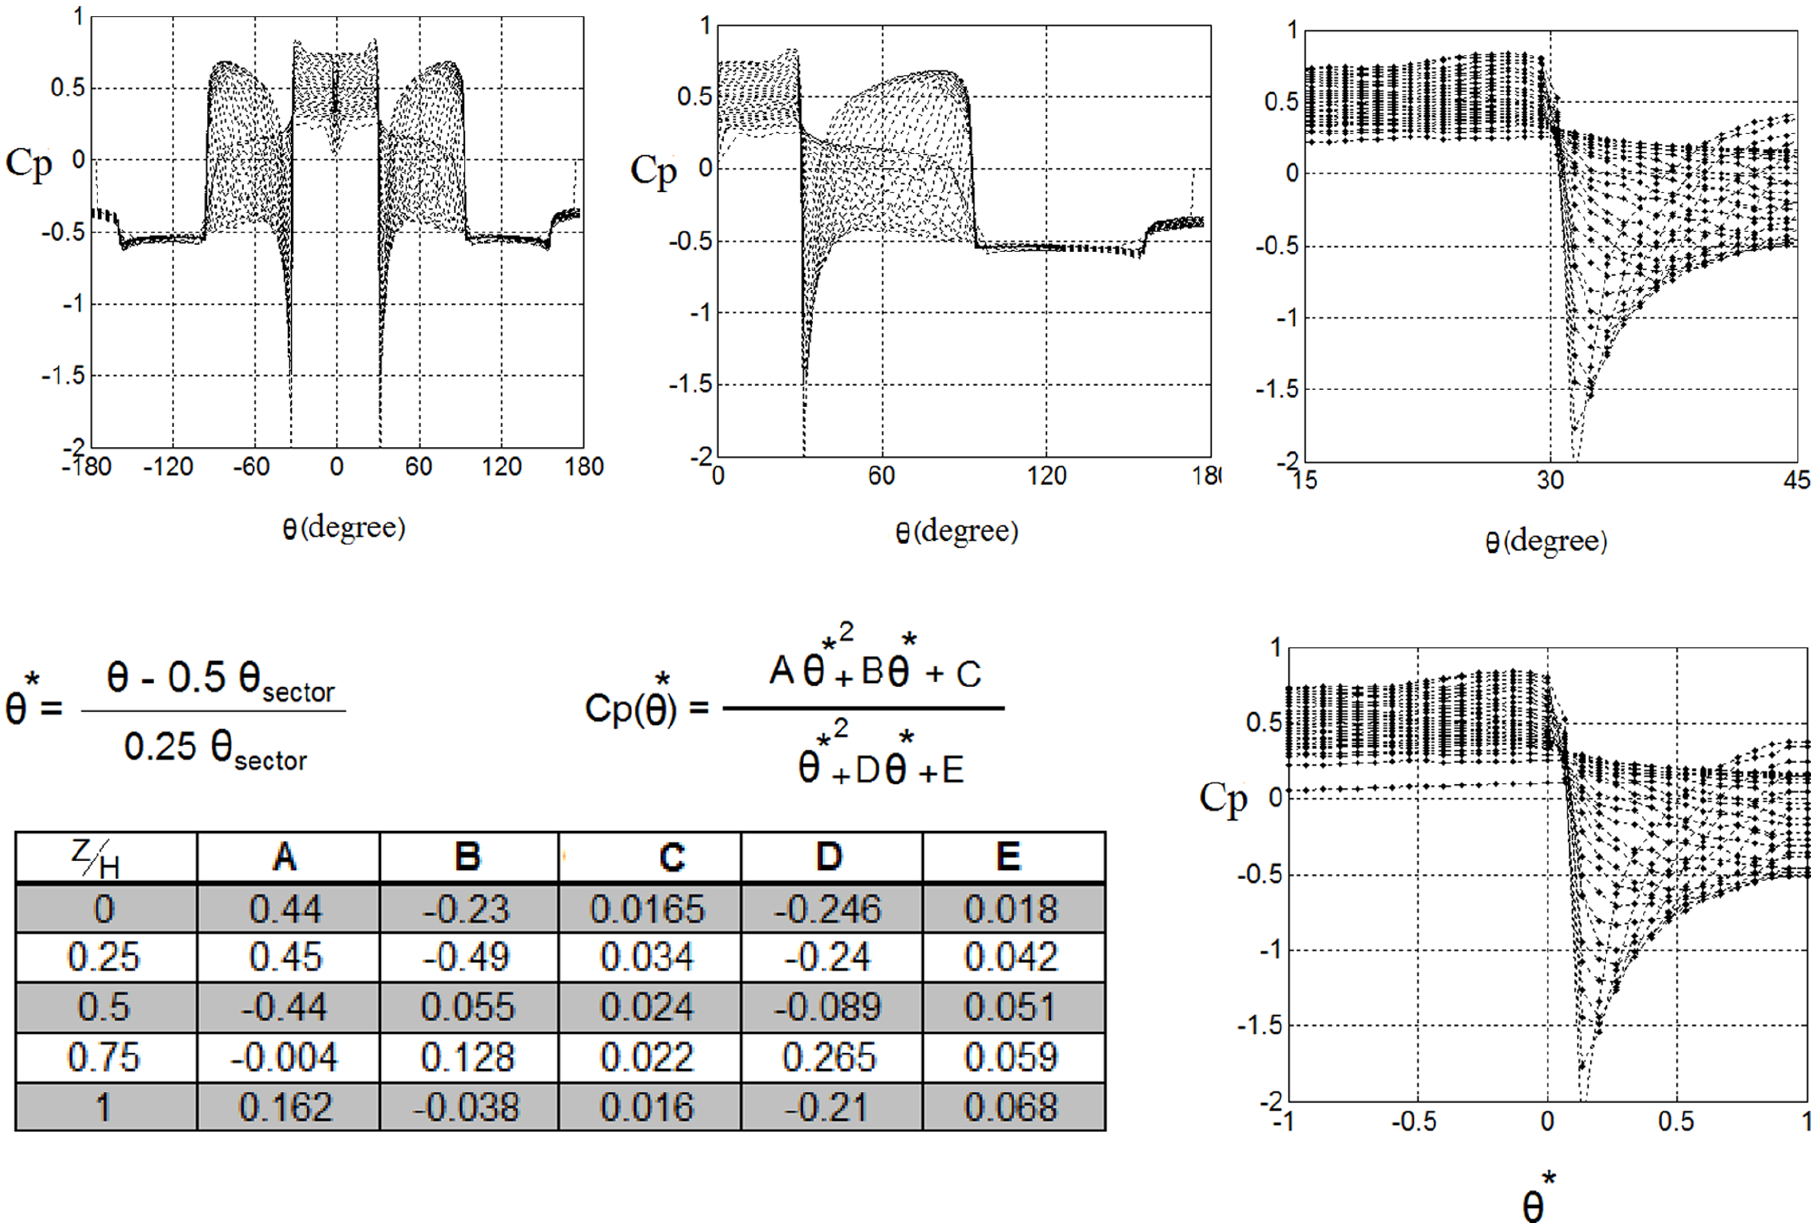
The wind pressure coefficients created on the hexagonal scallop dome with respect to the wind angle change with the structure.
Concluding remarks
Based on the achieved results the following remarks may be stated:
In a hexagonal scallop dome where the angle of each section is 60°, the maximum negative pressure is −2, and it is observed in the state that the grooves section is at 30°.
Comparing the pressure coefficients in the case study scallop dome with the equivalent spherical dome indicates the significant difference in the wind pressure distribution in the two types of domes: the maximum negative pressure in the scallop dome is −2 while it is −1 in the spherical dome. As a result, we cannot use the wind pressure coefficients pertinent to the spherical domes for the design of this type of structure, and we must use the pressure coefficients relevant to the scallop dome.
In the study scallop dome, if the wind direction is considered α = 15°, the maximum shape change is created in the structure, where this value is more by 20% compared to the state α = 0.
The arc depth between the groove, demonstrated with parameter h in Figure 12, is another contributing parameter in the wind pressure coefficient that can cause significant changes in the negative pressure values.
Footnotes
Declaration of conflicting interests
The author(s) declared no potential conflicts of interest with respect to the research, authorship, and/or publication of this article.
Funding
The author(s) received no financial support for the research, authorship, and/or publication of this article.