
Abstract
Even experts routinely miss infrequent targets, such as weapons in baggage scans or tumors in mammograms, because the visual system is not equipped to notice the unusual. To date, limited progress has been made toward improving human factors that mediate such critical diagnostic tasks. Here, we present a novel framework for pairing individuals’ estimates to increase target detection. Using a wisdom-of-crowds approach that capitalizes on the visual system’s ability to efficiently combine information, we demonstrated how averaging two noninteracting individuals’ continuous estimates of whether a briefly presented image contained a prespecified target can significantly boost detection across a range of tasks. Furthermore, we showed how pairing individuals’ estimates to maximize decorrelated patterns of performance in one task can optimize performance on a separate task. These results make significant advances toward combating severe deficits in target detection using straightforward applications for maximizing performance within limited pools of observers.
Despite spectacular developments in image processing and automated search algorithms (Liu et al., 2017), humans still perform the majority of critical visual search tasks such as breast cancer and airport baggage screenings. In stark contrast to a growing class of computer vision algorithms that input the entire image in parallel (Itti & Koch, 2001; Serre, Oliva, & Poggio, 2007), the human visual system is capable of processing only a few objects in detail at any given moment (Luck & Vogel, 1997). To circumvent these capacity restrictions, the visual system acts like a statistician, averaging out redundant and specific information, filling in details on the basis of spatiotemporal context, and leaving us with a representation of abstract, statistical regularities to efficiently represent the maximum amount of information (Attneave, 1954; Baddeley, 1997; Barlow, 1961; Kersten, 1987; Olshausen & Field, 1996; Simoncelli & Olshausen, 2001). However, relying heavily on current and prior context means that we are designed not to notice targets that are out of the ordinary (Simons & Chabris, 1999). For example, even experts are prone to missing infrequent targets, such as weapons in baggage scans or tumors in routine mammograms (Wolfe, Horowitz, & Kenner, 2005).
For more than a decade since Wolfe and colleagues’ (2005) initial discovery that we miss approximately 30% of rare targets, researchers have struggled to develop new methods to improve the detection of unusual and important targets (Van Wert, Horowitz, & Wolfe, 2009; Wolfe, Brunelli, Rubinstein, & Horowitz, 2013; Wolfe et al., 2005; Wolfe et al., 2007). Such attempts have mainly been aimed at increasing individual observers’ vigilance, for example, by interspersing bursts of frequent targets into otherwise rare-target searches (Wolfe et al., 2013; Wolfe et al., 2007). Instead of trying to augment the performance of a system equipped to function optimally within its biological and computational constraints, our approach is grounded in observations abstracted from the visual system’s inherent structure and function.
Although it may seem that a system with restricted capacity for detail is destined for failure in complex search tasks, these apparent weaknesses can be translated into strengths if we approach this problem from the understanding that the visual system capitalizes on regularities by sampling the most unique, decorrelated aspects of visual input. For example, individual neurons coding for the most discrepant information in an image (Barlow, 1961) mimic the wisdom-of-crowds approach of asking multiple individuals for different ground-truth guesstimates (Galton, 1907; Hogarth, 1978). Both cases take advantage of regression toward the mean: The more independent the samples, the more information that is accrued from averaging, and therefore the greater the reduction in error. Along these lines, studies of the “crowd within” have focused on similar methods for averaging guesses from a single individual to improve performance on a range of cognitive and perceptual tasks (Corbett, Fischer, & Whitney, 2011; Herzog & Hertwig, 2009; Vul & Pashler, 2008). All of these findings point to the intriguing and potentially life-saving possibility of even greater benefits of independence from combining two estimates from different observers. Thus, we developed and tested the novel framework illustrated in Figure 1 for pairing individuals’ continuous estimates of target presence to increase detection performance across a range of tasks.
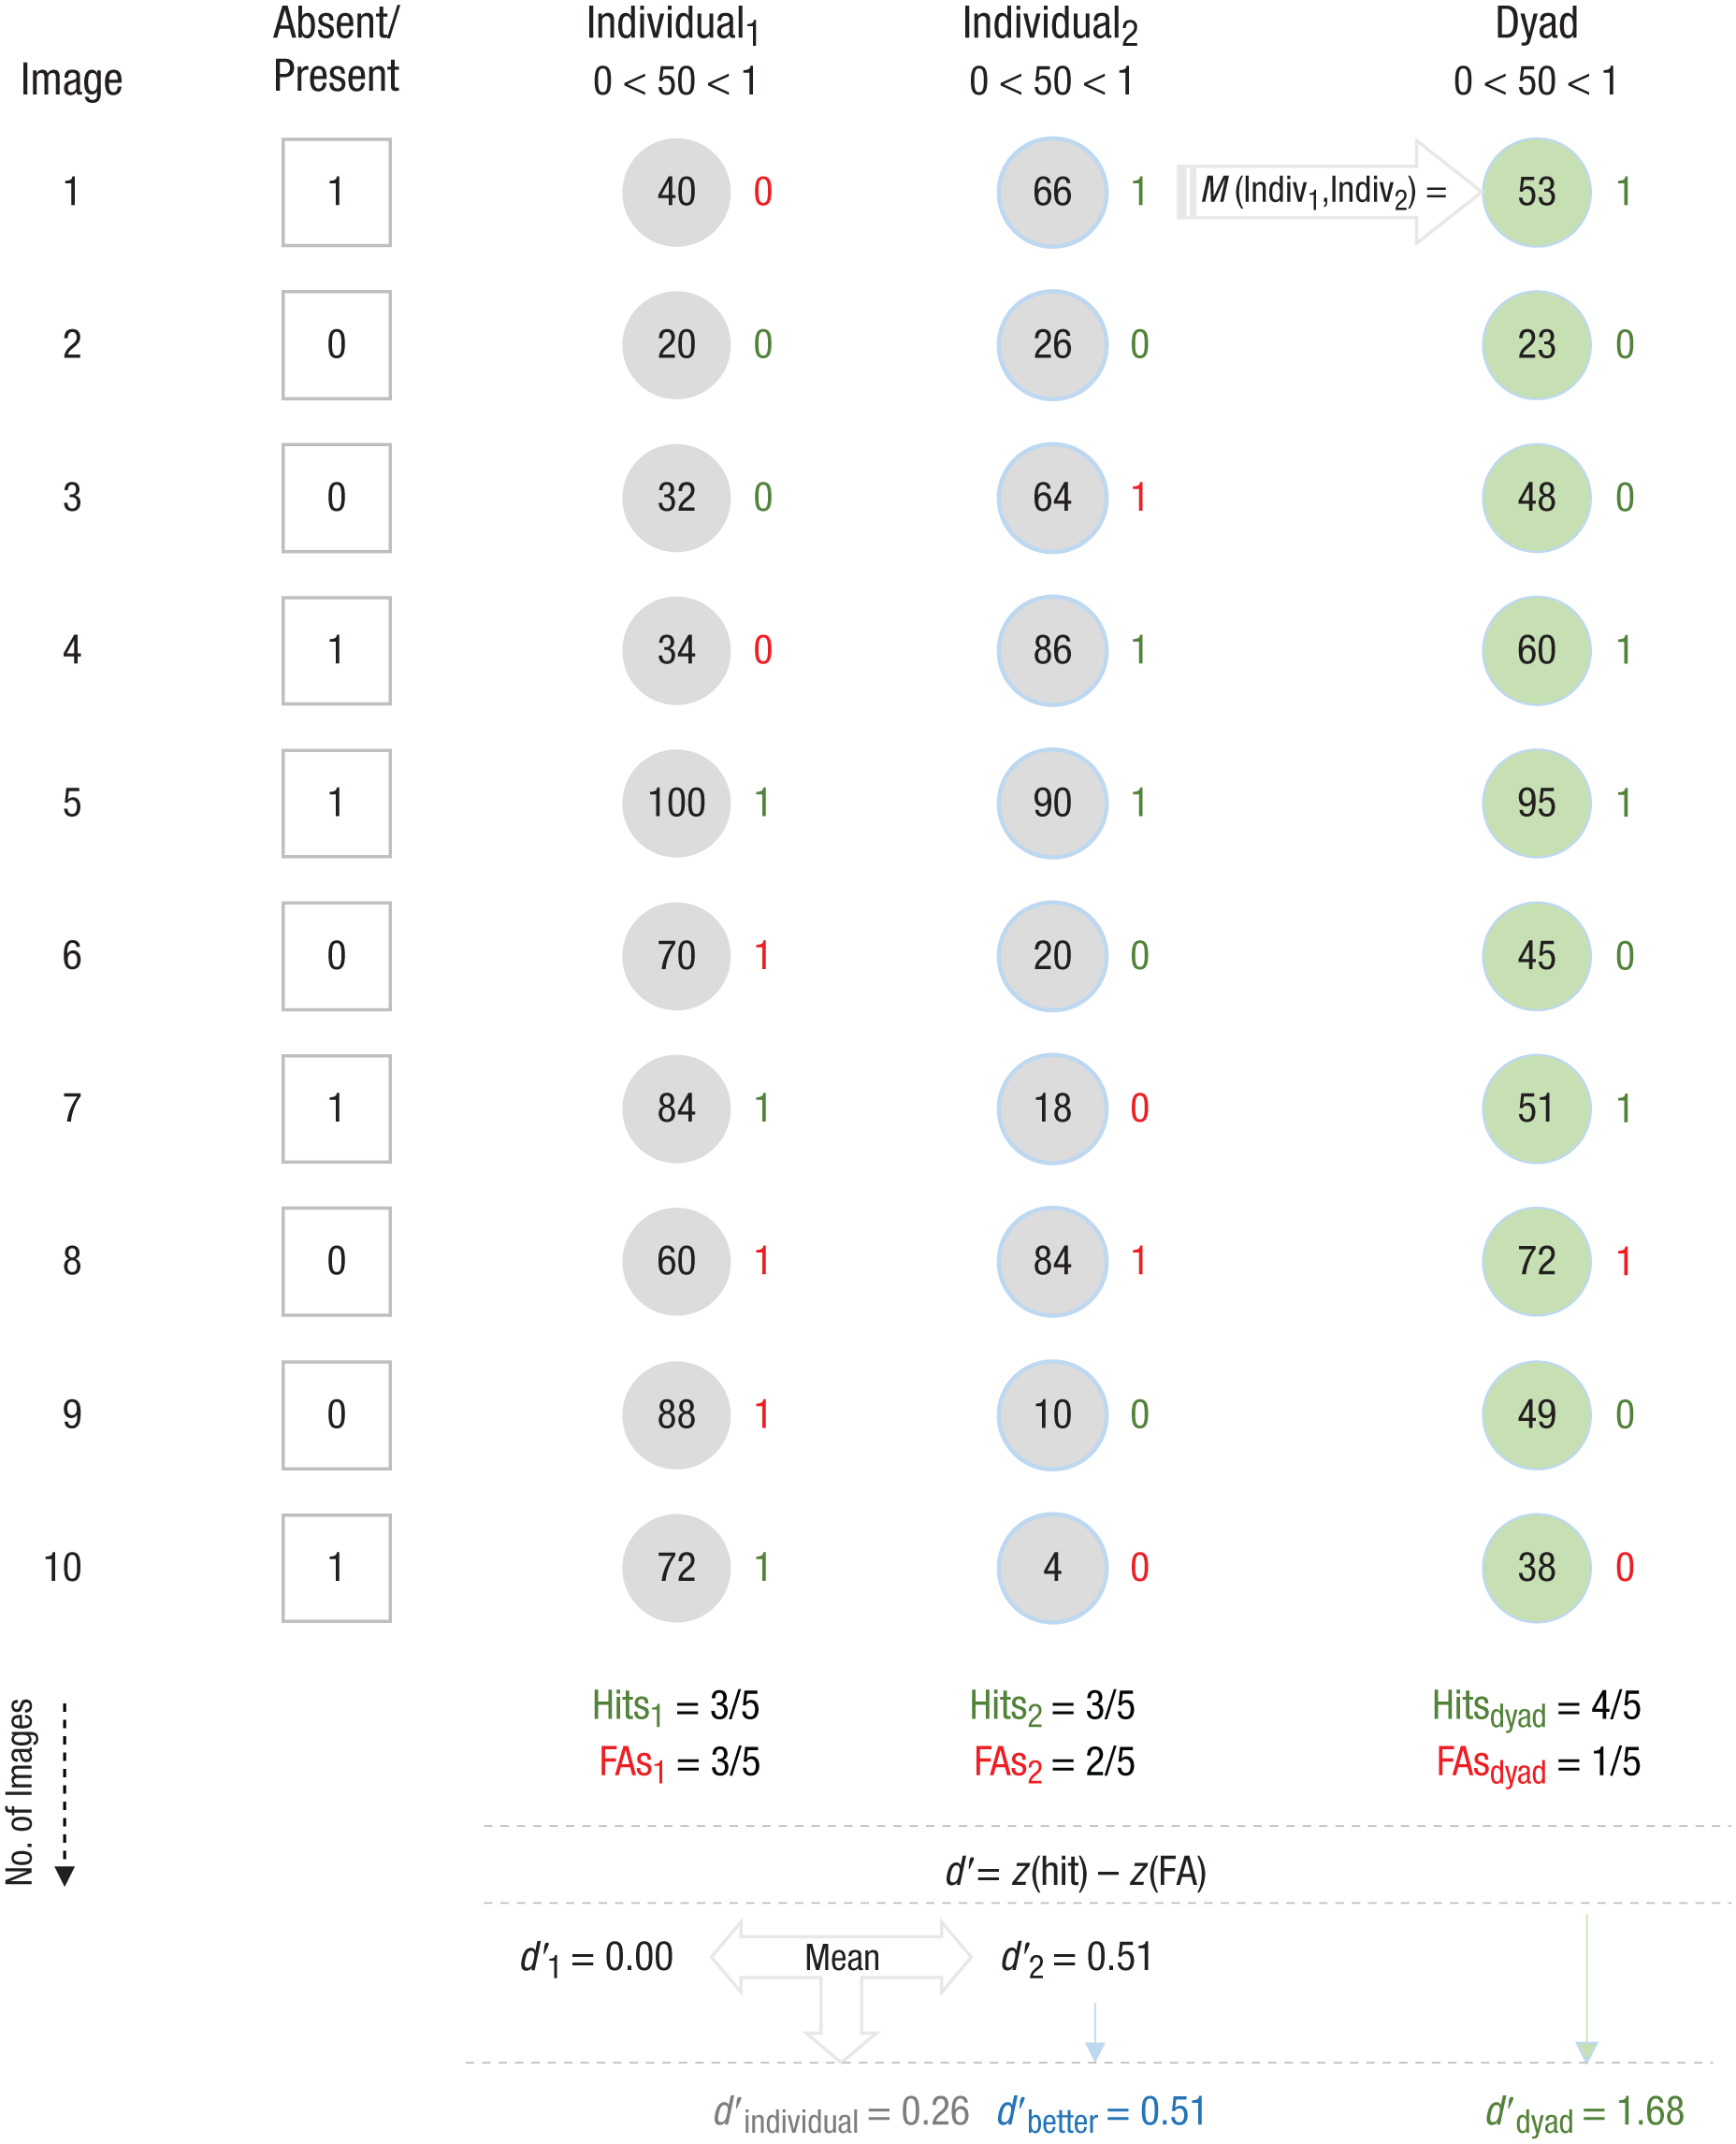
Framework for improving performance by averaging individuals’ estimates. For each image, individuals provided a continuous estimate (from 0, no, to 100, yes) about whether a prespecified target was present. Individuals performed the task independently. Each row represents hypothetical responses to a single image. The first column corresponds to the specific image number, and the number inside the square in the second column indicates whether a target was present (1) or absent (0) in that image. Numbers inside gray circles in the third and fourth columns represent the corresponding continuous responses of the 2 participants in the hypothetical dyad, and red and green 0s and 1s to the right of these estimates represent how that continuous response translates into a binary response. Responses less than 50 are scored 0 (absent), and responses greater than 50 are scored 1 (present). Green numbers indicate correct responses, and red numbers indicate incorrect responses; green 1s correspond to hits, and red 1s correspond to false alarms (FAs). Numbers inside green circles in the final column represent the dyad’s average estimate (i.e., the average of the two dyad members’ continuous responses), and the red and green 0s and 1s to the right of these estimates represent the dyad’s corresponding binary response. Each individual’s d′ (d′1 and d′2) was calculated by subtracting the normalized FA rates (FAs1 and FAs2) from the respective normalized hit rates (hits1 and hits2), and the dyad’s d′ (d′dyad) was calculated by subtracting the dyad’s normalized FA rate (FAsdyad) from the dyad’s normalized hit rate (hitsdyad). The mean d′ for the dyad (d′individual) was then calculated. In this example, Individual2 had a higher d′ than Individual1 and the former’s score was therefore used as the d′ of the better participant in the dyad (d′better). Overall, averaging individuals’ estimates resulted in lower error rates (hits and FAs) and therefore a higher rate of target detection (d′) than the average of the individuals’ detection rates or the detection rate of the better individual in the dyad.
Using this framework, we conducted two experiments to test the predictions that (a) pairing individuals’ estimates will result in better performance compared with the performance of either individual (Experiments 1 and 2) and (b) pairing estimates from individuals with the most decorrelated performance on one task will result in the greatest improvements on a separate task (Experiment 2).
In a first experiment, we investigated how averaging independent estimates from two different individuals might improve target detection. We presented naive participants with unilateral mammography X-rays verified as either having an abnormality (a tumor) or consisting of normal, healthy tissue. Participants’ task was to rate the extent to which they thought a tumor was present on a pseudocontinuous scale ranging from 0 (no) to 100 (yes), excluding 50. Participants completed two “mammos” conditions in which either 5% or 50% of the total number of trials contained tumor-present images (for more details, see the Method section and Fig. 2a). Given the noted benefits of combining independent information (Barlow, 1961; Corbett et al., 2011; Galton, 1907; Herzog & Hertwig, 2009; Hogarth, 1978; Vul & Pashler, 2008), we predicted that the average of 2 participants’ estimates would result in higher d′ values (a signal detection measure that accounts for both types of possible miss and false alarm errors) than either of their individual estimates.

Example trial sequence (a) and all stimuli used in the experiments (b). On each trial, participants saw a search display for 500 ms, followed by a response slider to indicate the extent to which they thought the preceding image should be called back for containing a prespecified target. Feedback about the points earned on the trial and the total points accumulated over the entire duration of the experimental block was displayed after a response was made. In the mammos conditions (Experiment 1), participants were shown a unilateral mammogram, and their task was to decide whether a tumor was present. They completed two conditions, presented in a block design, in which either 5% or 50% of the trials contained tumor-present images. In the tools conditions (Experiment 2), participants were shown a display of nine objects, and their task was to decide whether a tool target was present. They completed two conditions (in a block design) with a tool target present on either 5% or 50% of trials. In the local-Gabors condition (Experiment 2), participants were shown an image of nine Gabors, and their task was to decide whether to call back the image for containing a target Gabor that was larger or smaller than all the other Gabors. In the global-Gabors condition (Experiment 2), participants were shown two successive displays of nine Gabors, separated by a 1,000-ms blank screen, and their task was to decide whether to call back the sequence if there was a difference in global mean size of the targets between the first and second images. In the both-Gabors conditions, 50% of trials contained a target. The objects used in the tools tasks are shown in (b). Following Wolfe, Horowitz, and Kenner (2005), we used gray-scale objects (Brodeur, Dionne-Dostie, Montreuil, & Lepage, 2010; Konkle, Brady, Alvarez, & Oliva, 2010) from five different stimulus categories (including tools) to create the stimulus displays in the tools task. Each category consisted of 12 exemplars.
Method
Participants
There were 25 participants in Experiment 1 and 23 participants in Experiment 2. All participants were students at Bilkent University, participated in only one of the experiments, had normal or corrected-to-normal vision, and volunteered to take part in the experiment for either course credit or money. In each experiment, the participant with the highest points won an additional 50 Turkish lira (see the Points and Feedback section). Seven participants were dismissed from each experiment for failing to pass a preestablished performance threshold during practice blocks (see the Points and Feedback section). Only the data from the remaining 18 participants in Experiment 1 (11 women, 7 men; age: M = 20.56 years, range = 19–25) and 16 participants in Experiment 2 (14 women, 2 men; age: M = 21.25 years, range = 18–25) were included in subsequent analyses. We had to restrict our sample size to 16 participants in Experiment 2 because this was the maximum number of individuals for which we could generate all possible paired combinations given computational limitations (see the Decorrelated Dyads section). All procedures and protocols were in accordance with the guidelines of Bilkent University’s ethical review board.
Task and trial sequence
Participants were instructed to act like radiologists (Experiment 1) or airport baggage screeners (Experiment 2) and estimate whether they detected the presence of a target item from a prespecified category (e.g., a tumor, a tool) in a briefly presented image. On each trial in Experiment 1, participants were shown a unilateral mammogram for 500 ms. On each trial in Experiment 2, participants were shown an image of nine objects for 500 ms. In both experiments, the target screen was followed by a response slider ranging from 0 to 100 (adapted from Evans, Georgian-Smith, Tambouret, Birdwell, & Wolfe, 2013; Evans, Haygood, Cooper, Culpan, & Wolfe, 2016). Participants adjusted the slider with a mouse to indicate how strongly they did or did not want to call back the image on the basis of whether they detected a target (see Fig. 2a). To implement a modified version of a two-alternative forced-choice task, we restricted the slider responses so that participants could choose any value from 0 to 100 except 50. After they finished adjusting the slider, participants were told their points for the given trial and their total points for the block, which remained on screen until they pressed the space bar to continue to the next trial.
Stimuli and procedure
All participants performed the tasks individually and independently in a dimly lit room. Participants had no knowledge that their performance would be paired with that of another individual off-line after the experiment, nor did they receive any feedback that had any relationship to the performance of any other participant. An HP PC was used to present stimuli at a viewing distance of 57 cm on a 21.3-in. NEC LCD monitor with a 60-Hz refresh rate and a resolution of 1,600 × 1,200 pixels. MATLAB (Version 2016a; The MathWorks, Natick, MA) and the Psychophysics Toolbox (Version 3; Brainard, 1997; Pelli, 1997) controlled the presentation and timing of stimuli, as well as the collection of data. For details of the training and practice blocks associated with each experiment, see the Supplemental Material available online.
Experiment 1
In Experiment 1, each participant completed two experimental conditions (5% and 50% target prevalence) in a single, 1-hr experimental session. The two conditions were run in separate blocks, and the order of blocks was counterbalanced across participants. In each condition, participants were shown a unilateral mammogram centered in the middle of a black screen. Mammograms were acquired from the University of South Florida Digital Database for Screening Mammography (Heath et al., 1998; Heath, Bowyer, Kopans, Moore, & Kegelmeyer, 2001) and presented in native pixel resolution (subtending approximately 10° × 18° of visual angle). There were 400 unique images in each condition. In the 5% condition, a tumor was present in 20 of the 400 images. In the 50% condition, a tumor was present in 200 of the 400 images. All participants saw the same set of 400 images in the 5% condition and another set of 400 images in the 50% condition. The order of the images in each set was randomized, and each participant saw each image only once throughout the experiment. For a detailed description of the mammogram stimuli and the corresponding supplemental image database, see the Supplemental Material.
Participants completed two stages of training before beginning the experimental blocks. First, they were shown 50 of the target-present mammograms and 50 of the target-absent (healthy) mammograms, in random order. Participants were not required to make a response but only to study the images so that they became familiar with typical target-present and target-absent images. Each image remained on the screen until the participant pressed the space bar. If the image contained a target, the original mammogram was re-presented with an overlay showing the region identified as abnormal circled in red. The 100 trials in the second training stage were identical to trials in the main 50% experimental condition, except that (a) the training images were presented simultaneously with the response slider and remained on screen until the participant responded, and (b) if the image contained a target, the image was re-presented with the corresponding overlay of the abnormality. None of the images used in the training and practice blocks was used in the experimental blocks.
Experiment 2
In Experiment 2, each participant completed four experimental conditions (local Gabors, global Gabors, 5% tools, and 50% tools; see Fig. 2) in a single experimental session lasting approximately 2 hr. The two Gabors conditions and the two tools conditions were run in immediate succession, but the order of these two types of conditions and the order of the individual conditions within each type were counterbalanced across participants. In each condition, participants saw nine stimuli arranged equidistantly in a 3 × 3 grid subtending approximately 16° × 16° of visual angle and centered in the middle of a gray screen.
Local Gabors
In the local-Gabors condition, participants were shown a total of 288 images, with a target defined as a Gabor that was smaller or larger than the other eight Gabors present in 50% of the images. For each image, the size, spatial frequency, contrast, and orientation of the nine individual Gabors were pseudorandomly assigned from two possible sets of nine values per dimension (chosen on the basis of the results of previous pilot studies). The small-size set ranged in diameter from 1.9° to 2.1° in 0.02° steps, and the large-size set ranged from 3.4° to 3.6°, also in 0.02° steps. The low-spatial-frequency set ranged from 1.2 cycles per degree (cpd) to 2 cpd in 0.1-cpd steps, and the high-spatial-frequency set ranged from 6 cpd to 6.8 cpd in 0.1-cpd steps. The low-contrast set ranged from 73% to 81% contrast relative to the gray background, and the high-contrast set ranged from 83% to 91% contrast. The left-tilted-orientation set ranged from −49° to −41° of tilt from vertical, and the right-tilted-orientation set ranged from 41° to 49° of tilt from vertical.
One hundred forty-four target-absent images were generated by factorially combining the two sizes, two spatial frequencies, two contrasts, and nine locations, with two repetitions of each of the combinations. The set of leftward or rightward orientations was randomly selected for the nine Gabors in each image. For each target-absent image, a corresponding target-present image was constructed from an identical set of parameters, except that the Gabor representing the mean size of the set in the target-absent condition was replaced by a Gabor representing the mean size of the opposite set in the target-present condition. With the exception of the target size and location in target-present images, the individual values in each dimension were randomly assigned to the nine possible locations in each image.
Global Gabors
In the global-Gabors condition, participants were shown a total of 256 pairs of successive images of nine Gabors each. The target was present in 50% of the pairs and was defined as a difference between the mean size of the items in the first image of nine Gabors and the mean size of the nine Gabors in the second image. There were nine possible sets of nine individual Gabor sizes, constructed by multiplying a base set ranging from 1.3° to 1.7° in steps of 0.05° by a constant value from 0 to 8. In target-present pairs, the sizes of the Gabors in the first or second image (determined randomly for the pair) were taken from Sets 1, 2, 3, 4, 6, 7, 8, or 9. The sizes of the Gabors in the other image were taken from Set 5, for a total of eight possible mean size differences between the two images in each pair. In 50% of target-absent pairs, the sizes of both images were taken from the same set (repeated pairs; 1, 2, 3, 4, 6, 7, 8, or 9). In the other half of target-absent pairs, the sizes of Gabors in both images were taken from Set 5 (Set 5 pairs). This manipulation guarded against the tendency to call back the pair of images on a given trial as having a target difference present if either of the images in the pair contained the Set 5 sizes. The same spatial frequencies, contrasts, and orientations were used as in the local-Gabors condition.
The entire set of 256 image pairs was constructed from two repetitions of the full factorization of the eight possible mean size differences, two target-present versus target-absent conditions, two spatial frequencies, two contrasts, and two absent-pair types (repeated pairs, Set 5 pairs). Each target-present image had a corresponding target-absent image with all of the same parameters, except that both target-absent images contained the same nine sizes (either repeated pairs or Set 5 pairs). As in the local-Gabors condition, the set of leftward or rightward orientations for the nine Gabors was randomly selected for each pair of the 128 target-present images, and the same orientation set was used for the corresponding target-absent pair of images. In all images in all sequential pairs, the individual values in each dimension were randomly assigned to the nine possible locations.
5% tools
In the 5%-tools condition, there was a total of 360 images, each comprising nine objects. A single tool target was present in 5% of the images, and the other eight items were drawn from the four other categories (clothing, fruit, toiletries, and toys; see Fig. 2b). There were 12 objects per category (including tools), for a total of 60 possible items. The images for individual items were taken from open-source databases published in previous work (Brodeur, Dionne-Dostie, Montreuil, & Lepage, 2010; Konkle, Brady, Alvarez, & Oliva, 2010). Each item subtended 2.5° × 2.5° (the average size of the individual Gabors). Individual items were presented at 60% transparency, each item in each image was tilted a random ±15° from vertical in 1° steps, and a pink-noise mask was added to the entire image to better equate the task to a real-world baggage-screening task (Wolfe et al., 2005). There were 18 target-present images (2 per location) and 342 target-absent images. For each target-present image, there were 19 corresponding target-absent images, each containing the same nine nontool objects drawn randomly from the four nontool categories. Although the same nine items were used in the target-absent images, the individual items were placed randomly in the nine locations in each image. In the corresponding target-present image, a tool was randomly selected to replace the nontool item in the target location, with the locations of the eight other nontool items randomly determined.
50% tools
In the 50%-tools condition, a tool target was present in half of the 360 total images. All parameters were identical to those used in the 5%-tools condition, except that there were 180 target-present images (20 per location) and 180 target-absent images. Target-absent images contained nine randomly selected items from the four nontool categories, and the corresponding target-present image contained a tool randomly selected to replace one of the nontool items and presented in the target location.
Points and feedback
On each trial, participants earned points for a correct response or lost points for an incorrect response (procedure adapted from Wolfe et al., 2005). In all 50% conditions, participants could earn a maximum of 40 points when there was a target present and they correctly called back the image (i.e., adjusted the slider to a value above 50%; hit) and 2.5 points when there was no target present and they correctly did not call back the image (correct rejection). They could lose a maximum of 40 points if there was a target and they did not call back the image (miss) and 75 points if there was no target and they incorrectly called back the image (false alarm). In the 5% conditions, participants could earn a maximum of 400 points for a hit and a maximum of 2.5 points for a correct rejection. They could lose a maximum of 400 points for a miss and a maximum of 75 points for a false alarm. We calculated the specific number of points earned or lost on each trial as a function of the extremeness of the given response using the following formula:
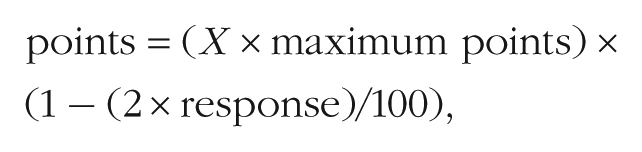
where X was equal to −1 for signal-present trials and 1 for signal-absent trials, maximum points was the maximum number of points that could be earned or lost, and response was the participant’s estimate between 0 and 100.
In replicating the rare-target deficit originally reported by Wolfe and colleagues (2005; Wolfe et al., 2007), it was necessary to implement a points system that prevented participants from simply responding 0 on each trial in the 5%-prevalence condition (which would result in 95% accuracy) or simply hovering in the middle of the response range without actually performing the detection task. The points system allowed us to better equate participants’ response criteria (tendency to say “yes” or “no” more frequently) across the two types of conditions (Healy & Kubovy, 1981; Wolfe & Van Wert, 2010), such that there was a greater penalty for a bias to respond “yes” in the 50%-present conditions when targets were frequent but a greater penalty for a bias to respond “no” in the 5%-present conditions when targets were rare. Participants were informed of the specific points for each type of response at the start of each block and were required to have a positive score (points > 0) at the end of every block.
Results
Dyads versus individuals
To gauge whether pairing individuals’ estimates yielded improved detection performance, we first paired the 18 (Experiment 1) and 16 (Experiment 2) participants in n – 1 unique arrangements of pairings. Each arrangement included all 18 or 16 participants, respectively. Only the pairings of the participants into nine (Experiment 1) and eight (Experiment 2) dyads were different over arrangements, with each possible dyad being present only once in the resultant 17 (Experiment 1) and 15 (Experiment 2) arrangements. For example, the dyad formed by Participants 1 and 2 appeared in only 1 of the 17 possible arrangements of nine dyads in Experiment 1. In other words, all participants were included in each arrangement of pairings, but each dyad was unique across all pairings, so the combination of the two individuals forming a dyad was never repeated (for an illustration of this procedure, see Table S1 in the Supplemental Material). Because we planned the statistical comparisons illustrated in Figure 3 (see also Table S2 in the Supplemental Material) among three groups, we conducted our analysis using only these unique arrangements of pairings based on multiple combinations of the individual participants.

Dyad versus individual results for Experiment 1 (mammos; N = 9 dyads) and Experiment 2 (Gabors and tools; N = 8 dyads). Average detection performance (d′; a), the average proportion of misses (b), and the average proportion of false alarms (c) are shown separately for each condition, separately for dyads (green), the better-performing member of each dyad (blue), and individual observers (gray). For the mammos and tools conditions, the color saturation of the data bars is lighter for the 5% conditions and darker for the 50% conditions. Both the local and global conditions for Gabors are striped, with the local conditions having finer stripes than the global conditions. Asterisks indicate significant differences (α = .0125, Bonferroni-corrected for four multiple comparisons). Error bars represent 95% within-subjects confidence intervals for the two-way interaction depicted in each graph (Loftus & Masson, 1994).
As illustrated in Figure 3a, averaging individual estimates from 2 participants improved signal detection (d′) over estimates obtained from the corresponding individuals in both the 5%-mammos condition (12.89% average improvement) and the 50%-mammos condition (10.81% average improvement). In both conditions, pairing estimates also improved performance relative to the performance of the better individual in each dyad. We conducted a follow-up analysis to explicate how pairing estimates affected both types of miss and false alarm errors. Although pairing always decreased both misses and false alarms compared with estimates made by the corresponding individuals, there was a noteworthy trade-off between misses and false alarms in the 5%-mammos condition, suggesting that estimates made by the better of the 2 participants in each dyad were less prone to misses, whereas dyad estimates were less likely to result in false alarms (see Figs. 3b and 3c). In all reported analyses, paired comparisons refer to two-tailed t tests that were Bonferroni corrected for multiple comparisons. Table S2 presents the full results of all planned comparisons.
Decorrelated dyads
After confirming the significant benefits of pairing individuals’ independent estimates of the likelihood of tumor presence in mammography images, we sought to generalize this benefit using other types of visual search tasks in Experiment 2. Specifically, we first replicated the results of Experiment 1 using a tool-detection task in Experiment 2 that is typically used with naive participants as a proxy for weapons detection in baggage scans (Fleck & Mitroff, 2007; Wolfe et al., 2005; see Fig. 2). Given that previous findings suggest greater benefits of averaging as estimates become more independent (Corbett et al., 2011; Herzog & Hertwig, 2009; Hogarth, 1978; Vul & Pashler, 2008), we further extended our investigation to examine whether pairing estimates from participants with the most independent, decorrelated patterns of performance in separate Gabors tasks could maximize performance in the main tools search tasks. Given previous findings that suggest that detection might be based in part on a global “gist” signal (Drew, Evans, Võ, Jacobson, & Wolfe, 2013; Evans et al., 2013; Evans et al., 2016; Rensink, 2004), we used local and global versions of the Gabors task (see Fig. 2). This resulted in four main conditions: local 5%, global 5%, local 50%, and global 50%. We expected the improvement in d′ from averaging dyads’ performance in the tools tasks to increase with their decreasingly correlated performance in the Gabors tasks.
Following the procedure used in real-world situations such as airport baggage screenings, in which a pair of security officers typically work at one of several stations, we sought to optimize overall group performance in the tools tasks by pairing individuals into eight dyads. This procedure was intended to maximally decorrelate performance on the Gabors task across the entire group of 16 individuals. Importantly, we compared dyad performance only as a function of correlation on the Gabors tasks and did not restrict this analysis to only one unique occurrence of a particular dyad, unlike our procedure in the analysis used in both Experiments 1 and 2 to compare the performance of dyads and individuals (see Fig. 3 and Table S2). Instead, we began by constructing all possible pairings of the 16 individuals using a custom-written recursive MATLAB function, such that one set of the eight dyads was distinct relative to any other combination. (The only consideration was the uniqueness of the dyads within a combination relative to the dyads in all previous combinations. Dyads could repeat over different combinations of pairings but not within the same combination.) This resulted in
Next, separately for the local- and global-Gabors conditions, we calculated the average correlation between dyads’ responses for the individual images (the 288 images in the local-Gabors condition and the 256 images in the global-Gabors condition) for each set of 2,027,025 combinations. More specifically, the average correlation in responses for each set of eight dyads was found by summing the eight correlations between each of the individuals in a pair and then dividing by the total number of dyads. After the average correlation was found for each set of combinations, the combinations were sorted from most decorrelated to most correlated. We then used these combinations on each of the local- and global-Gabors conditions to compute dyad performance for each of the 2,027,025 combinations in the 5%- and 50%-tools conditions, resulting in four main conditions (local 5%, global 5%, local 50%, and global 50%). Finally, we averaged the data from the 2,027,025 combinations over 9,009 bins of 225 pairings each to facilitate graphical and statistical comparisons.
Although participants’ responses were not speeded, their average response times for both rare (5% tools: M = 2,020 ms, SD = 1,332 ms) and frequent (50% tools: M = 1,902 ms, SD = 1,076 ms) target detection were similar to those previously reported by Wolfe and colleagues (2005).
After first replicating the improved rates of target detection for dyad versus individual estimates observed in the mammogram task in Experiment 1 for both Gabors and tools conditions in Experiment 2 (16.06%–22.14% average improvement from averaging; see Fig. 3 and Table S2), we tested the prediction that pairing estimates from participants such that their overall performance was maximally decorrelated in the Gabors tasks would result in the greatest improvements from averaging in the tools tasks. We observed a strong negative correlation (r = −.972), in support of this hypothesis; specifically, d′ values on the 5%-tools task increased as the average correlation over a given set of pairings in the global-Gabors task decreased (global 5%). On the contrary, there was no evidence of a relationship between d′ on the 5%-tools task and the average correlation over a set of pairings in the local-Gabors task (local 5%; r = .196). Improved performance in the 50%-tools task was also well predicted by participants’ decorrelated performance in the global- (global 50%; r = −.937) and local- (local 50%; r = −.972) Gabors tasks.
Taken together, the patterns of results in Figure 4a suggest that pairing estimates from individuals with decorrelated performance on a simple global detection task can maximize performance in a separate, more complex, rare-target detection task, whereas pairing estimates from individuals with the most decorrelated patterns of performance regardless of the local or global scale of the simple task may optimize the detection of frequently occurring targets in a more complex task.
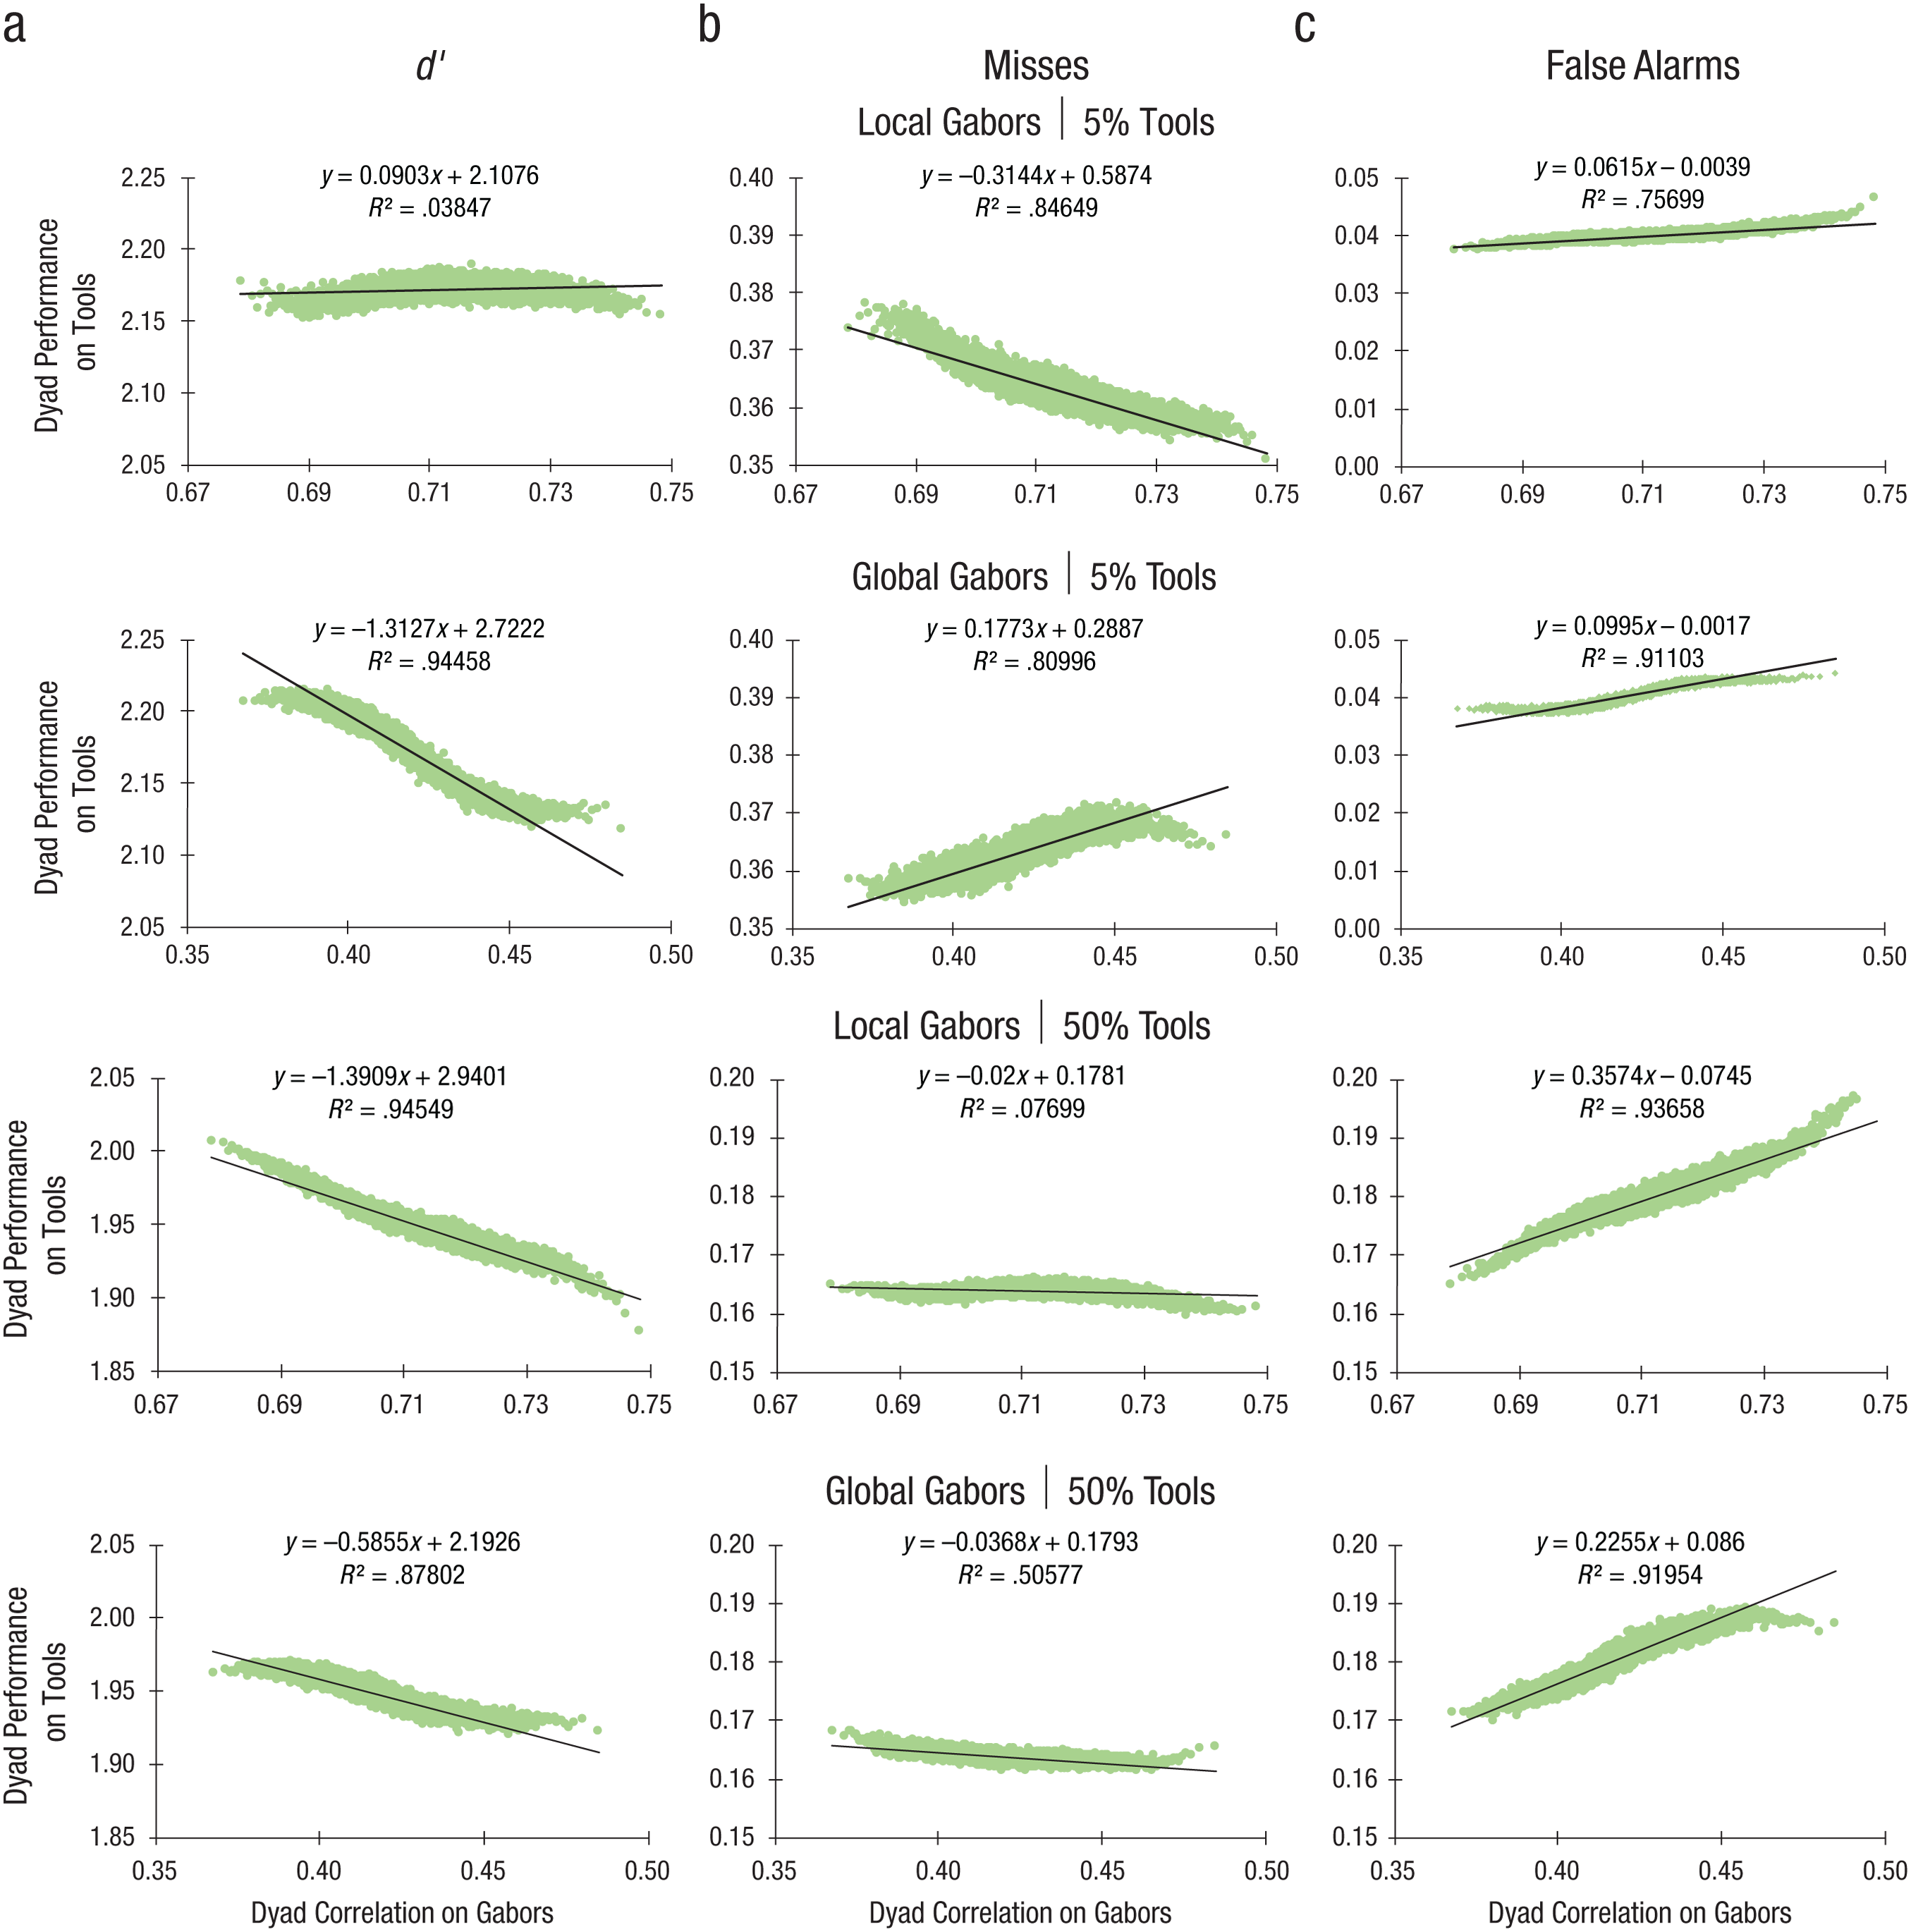
Decorrelated dyads results. Scatterplots (with best-fitting regression lines) showing dyads’ detection performance (d′; a), the proportion of misses (b), and the proportion of false alarms (c) in the tools tasks as a function of dyads’ correlated performance on the Gabors tasks. Results are shown in separate rows for each of the four combinations of 5% tools, 50% tools, local Gabors, and global Gabors conditions of Experiment 2. All plots depict the results of simple regression analyses with all F(1, 9008)s > 360 and all ps < .001.
These conclusions are further supported by the different patterns of improvement in miss and false alarm rates in the two tools tasks that resulted from pairing the most decorrelated participants in the two Gabors tasks. In the 5%-tools condition, where dyads showed the lowest miss and false alarm rates (see Figs. 3b and 3c), the more decorrelated the dyads’ performance in the global-Gabors condition, the lower their miss and false alarm rates (see Figs. 4b and 4c). In the 50%-tools condition, dyads showed the lowest miss rates (see Fig. 3b) but higher false alarm rates than the better of the two individuals in each dyad (see Fig. 3c). Also in the 50% condition, the more decorrelated the dyads performed in the global- and especially the local-Gabors conditions, the greater the improvement in false alarm rates (see Fig. 4c), with little change in the miss rates (see Fig. 4b). The greatest improvements from averaging decorrelated dyads were observed where improvements were most needed. Further evidence of the benefits of capitalizing on the more fine-grained information available in participants’ continuous estimates is illustrated by the inferior results from the same analyses using participants’ dichotomized estimates in the Gabors tasks instead of their continuous responses (see Fig. S1 in the Supplemental Material).
Discussion
The current framework represents a significant advancement toward improving human factors that mediate target detection. Building on parallels between the visual system’s ability to capitalize on the variance inherent in the surrounding environment (e.g., Barlow, 1961) and findings that the wisdom of crowds (e.g., Galton, 1907) can be approximated by aggregating the most conflicting estimates from the same individual (e.g., Corbett et al., 2011; Herzog & Hertwig, 2009; Vul & Pashler, 2008), the present study demonstrated that averaging estimates from individuals with the most decorrelated patterns of performance can improve detection across a range of visual tasks.
Several critical differences set the current framework apart from methods used in previous work (Van Wert et al., 2009; Wolfe et al., 2013; Wolfe et al., 2005; Wolfe et al., 2007). First, given evidence that participants can rapidly detect but not localize changes (Rensink, 2004) and that experts can detect but not localize the presence of abnormalities in mammography images within a fraction of a second (Drew et al., 2013; Evans et al., 2013; Evans et al., 2016), we used brief 500-ms stimulus presentations in an attempt to engage the nonselective visual pathway thought to be responsible for the rapid extraction of global, statistical information (Drew et al., 2013; Evans et al., 2013; Evans et al., 2016; Rensink, 2004; Wolfe, Võ, Evans, & Greene, 2011).
Second, instead of having participants provide a binary present/absent judgment or a binary judgment followed by a confidence rating, we required them to make a continuous response by adjusting a slider to indicate the extent to which they thought an image should be called back for further inspection because it contained a target. This allowed us to average individuals’ estimates for each of the unique images, instead of limiting us to multiplying their average error rates to obtain a measure of paired performance (Wolfe et al., 2007) or calculating a separate measure of metacognitive confidence from binary responses and confidence ratings (e.g., Maniscalco & Lau, 2012).
Third, the current framework does not require people to interact to reach a joint decision. Human interaction decreases the independence of individuals’ judgments and results in joint performance that is suboptimal (e.g., Bang et al., 2017), as it can be no greater than improvements obtained from relying on the answers of the more confident (Bahrami et al., 2010) or accurate (e.g., Erev, Gopher, Itkin, & Greenshpan, 1995) member of each dyad. Instead, participants performed all tasks individually without interacting or without any knowledge that their responses would be combined with those of other participants.
Finally, we used performance on a basic visual task (Gabors) to pair individuals’ estimates on a separate, more complex detection task (tools). Averaging estimates from individuals with the most decorrelated patterns of performance in either the local- or global-Gabors task led to the greatest improvements in detecting frequent tools targets. In contrast, averaging estimates from individuals with the most decorrelated performance on only the global-Gabors task led to improvements in detecting rare tools targets. Whereas previous attempts to improve rare-target detection have interspersed bursts of frequent targets into searches for infrequent targets (Wolfe et al., 2013; Wolfe et al., 2007), the present results suggest that the optimal solution is to pair estimates from participants using different cognitive strategies.
The most straightforward applications of our results are to begin employing continuous bounded response scales in safety-critical signal detection tasks and averaging individuals’ estimates. For example, in line with a recent report by Mayo Clinic researchers underscoring the importance of second opinions in increasing the accuracy of medical diagnoses (Van Such, Lohr, Beckman, & Naessens, 2017), different radiologists can quickly scan through mammograms, and continuous estimates from the individuals with the most decorrelated patterns can be combined off-line. Importantly, our framework can be applied without requiring any communication between individuals and without requiring the delay between estimates that is necessary to obtain similar benefits from aggregating repeated estimates from the same individual (Corbett et al., 2011; Herzog & Hertwig, 2009; Vul & Pashler, 2008). Therefore, estimates made by an expert at one location (e.g., a transportation security officer at an airport checkpoint) could be paired in real time with estimates made by a second person viewing the same images at an off-site location. In the future, it may even be possible to simulate a decorrelated pattern of performance that can be averaged online with an existing individual’s performance, which could be particularly cost effective and useful when personnel or data are sparse. Although we note several possible applications in human and computer vision, the potential application domain extends broadly across a diverse range of fields from navigation to engineering to economic forecasting.
In conclusion, we have demonstrated a simple yet effective method for capitalizing on the diversity afforded by averaging continuous estimates of target presence from different individuals to boost target detection. Not only does this method yield benefits from combining independent samples in a range of different visual tasks, but our results strongly suggest that detection in complex tasks can be optimized by pairing estimates from individuals with the most diverse patterns of performance on a secondary basic detection task.
Supplemental Material
CorbettOpenPracticesDisclosure – Supplemental material for “It’s Not a Tumor”: A Framework for Capitalizing on Individual Diversity to Boost Target Detection
Supplemental material, CorbettOpenPracticesDisclosure for “It’s Not a Tumor”: A Framework for Capitalizing on Individual Diversity to Boost Target Detection by Jennifer E. Corbett and Jaap Munneke in Psychological Science
Supplemental Material
CorbettSupplementalMaterial – Supplemental material for “It’s Not a Tumor”: A Framework for Capitalizing on Individual Diversity to Boost Target Detection
Supplemental material, CorbettSupplementalMaterial for “It’s Not a Tumor”: A Framework for Capitalizing on Individual Diversity to Boost Target Detection by Jennifer E. Corbett and Jaap Munneke in Psychological Science
Footnotes
Acknowledgements
We thank Bahar Aykut, Miray Kapan, Elif Beyza Koş, Sümeyra Özçalık, and the members of the Visual Perception and Attention Lab for their help with data collection. We also thank Aaron Clarke for supplying the code for preprocessing the mammography images and for his help rating the initial set of mammogram stimuli. We also give many thanks to Chris Oriet for helpful comments on earlier versions of this work.
Action Editor
Philippe G. Schyns served as action editor for this article.
Author Contributions
Both authors designed and implemented the study, analyzed the data, and wrote the manuscript.
Declaration of Conflicting Interests
The author(s) declared that there were no conflicts of interest with respect to the authorship or the publication of this article.
Open Practices
All data have been made publicly available via the Open Science Framework and can be accessed at osf.io/uqg5m/#)). Materials for this study have not been made publicly available, and the design and analysis plans were not preregistered. The complete Open Practices Disclosure for this article can be found at https://journals-sagepub-com.web.bisu.edu.cn/doi/suppl/10.1177/0956797618784887. This article has received the badge for Open Data. More information about the Open Practices badges can be found at ![]() .
.
References
Supplementary Material
Please find the following supplemental material available below.
For Open Access articles published under a Creative Commons License, all supplemental material carries the same license as the article it is associated with.
For non-Open Access articles published, all supplemental material carries a non-exclusive license, and permission requests for re-use of supplemental material or any part of supplemental material shall be sent directly to the copyright owner as specified in the copyright notice associated with the article.