
Abstract
Given the costs of political violence, scholars have long sought to identify its causes. We examined individual differences related to participation in political violence, emphasizing the central role of political orientations. We hypothesized that individuals with dominance-driven autocratic political orientations are prone to political violence. Multilevel analysis of survey data from 34 African countries (N = 51,587) indicated that autocracy-oriented individuals, compared with democracy-oriented individuals, are considerably more likely to participate in political violence. As a predictor of violence (indexed with attitudinal, intentional, and behavioral measures), autocratic orientation outperformed other variables highlighted in existing research, including socioeconomic status and group-based injustice. Additional analyses of original data from South Africa (N = 2,170), Denmark (N = 1,012), and the United States (N = 1,539) indicated that the link between autocratic orientations and political violence reflects individual differences in the use of dominance to achieve status and that the findings generalize to societies extensively socialized to democratic values.
Keywords
Coalitional aggression for a political cause, or political violence, 1 is a chief contributor to human mortality and suffering around the world. Understanding the causes of political violence is thus “a major project in the social sciences” (Hsiang, Burke, & Miguel, 2013, introduction). The study of political violence has been dominated by political science (Fearon & Laitin, 2003) and economics (Collier & Hoeffler, 2004) and has emphasized macro-level predictors, such as political-regime type or economic development (Dixon, 2009). Here, we present a micro-level, psychological account focused on individual differences associated with participation in political violence.
Despite the importance of understanding political violence, its psychological predictors have not yet received adequate attention. Although a large psychological literature exists on nonviolent collective actions, such as protests (van Zomeren, Postmes, & Spears, 2008), only a handful of studies have analyzed “nonnormative” (violent) collective actions (Becker & Tausch, 2015). A related literature on radicalization is more voluminous (Gøtzsche-Astrup, 2018). Yet radicalization is not synonymous with political violence. One may be radicalized (e.g., join a radicalized group) and yet refrain from using violence, and one may use political violence without being radicalized (e.g., fight in a civil war).
The few existing psychological studies on political violence (and most research on nonviolent collective actions) have centered on Western, educated, industrialized, rich, and democratic (WEIRD) populations. It is unclear whether their findings generalize to non-WEIRD countries (Becker & Tausch, 2015, pp. 76–77), where most political violence occurs. The lack of data from violence-ridden populations also implies that existing psychological research on political violence has largely focused on attitudes toward or intentions to engage in violence rather than on the key variable of interest: participation.
Finally, existing studies have underexplored the role of individual differences in political orientations. Political violence, by definition, involves incompatibilities over political issues, typically a country’s system of governance, the distribution of political power, or a state’s territorial integrity (Gleditsch, Wallensteen, Eriksson, Sollenberg, & Strand, 2002). It would seem natural that people’s orientations toward these issues play a central role in their motivations to participate in violence (e.g., consider the Arab Spring and its aftermath, in which political-regime type and power hierarchies were at the core of the conflicts; e.g., Bellin, 2012). We propose that identifying commonalities in such political orientations is a fruitful starting point for a cross-culturally robust account of the psychology of political violence.
Political scientists have typically focused on left- and right-wing preferences. Such orientations, however, seem particular to developed democracies (Malka, Lelkes, & Soto, 2019). We therefore focus on a more foundational difference in political orientations as identified by Popper (1945/2012) and Russell (1945/2013) in their histories of political thought: preferences for autocratic versus democratic forms of governance. Autocratic governance is characterized by political hierarchy, in which decision-making power is concentrated in the hands of a nonelected (or fraudulently elected) elite, who maintain power via intimidation and force. Democratic governance, by contrast, is characterized by equality in opportunities to compete for political power, and decision-making power is distributed among political actors on the basis of their popular vote rather than force. Hence, political orientations toward autocracy reflect preferences for unequal and hierarchically structured relations among political actors (political parties, political leaders, etc.) that are maintained by force.
We argue that individual differences in preferences for autocracy reflect—in the domain of national politics—a set of motivations (a) that exist in several other domains including the interpersonal and intergroup and (b) that, in these domains, strongly relate to precursors of political violence.
Autocratic Orientation as Dominance in the Domain of National Politics
We suggest that individual differences in support for autocracy—at the psychological level—reflect individual differences in orientations toward the use of dominance as a status-attainment strategy. Understood as relative access to contested resources within a group, status plays a key role in the lives of social organisms, including nonhuman animals and virtually all human societies (Cheng, Tracy, Foulsham, Kingstone, & Henrich, 2013). Differences in status or social hierarchies are considered (near) universal, with higher status predicting a range of important outcomes, including increased biological fitness and greater overall well-being (Cheng et al., 2013). Recent psychological research has distinguished between two overarching strategies for pursuing status (Maner, 2017). The first, prestige based, seeks freely conferred status in return for competence. The second, force based, is referred to as dominance: “the induction of fear, through intimidation and coercion, to attain social rank” (Cheng et al., 2013, p. 105). Dominance reflects not only force-based pursuit of status but also support for inequality and hierarchy in social relations (Kunst, Fischer, Sidanius, & Thomsen, 2017).
Individual differences in status-seeking strategies and support for hierarchies exist beyond the interpersonal domain. In the intergroup domain, some individuals have a higher, and others a lower, desire for “unequal and dominant/subordinate relations among salient social groups” (Pratto, Sidanius, & Levin, 2006, p. 282), as reflected in the conceptualization and measurement of social dominance orientation (SDO). Here, we suggest that a political orientation toward autocracy is, in essence, the national-level instantiation of these same psychological motivations.
Autocratic Orientation and Political Violence: Hypotheses
Dominance predicts a range of outcomes that we see as antecedents of political violence. In the interpersonal domain, individuals who score high on dominance are more likely to use interpersonal aggression (e.g., Johnson, Burk, & Kirkpatrick, 2007). In the intergroup domain—and of particular relevance for political violence—SDO predicts racism, punitiveness, dehumanization, and ethnic persecution (Kunst et al., 2017). On the basis of this, and turning to the domain of national politics, we hypothesized that autocratic political orientations positively relate to participation in political violence (Hypothesis 1) and that autocratic political orientations mediate the association between dominance and participation in political violence (Hypothesis 2).
Overall Analysis Strategy
Studies 1 and 2 tested, respectively, Hypothesis 1 and Hypothesis 2 using non-WEIRD samples. Studies 3 and 4 assessed generalizability to WEIRD settings. Two qualifications are due. First, we used slightly different operationalizations in some of the studies. With Study 1, we aimed to maximize external validity within a non-WEIRD setting by using a large multinational data set. This study relied on secondary data; hence, we could not use existing measures of key psychological constructs. With Study 2 (in addition to testing Hypothesis 2), we aimed to replicate the findings of Study 1 using standard psychological scales. The shift in Study 3 to a WEIRD setting prompted us to make several changes to the research design. Finally, with Study 4, a direct replication of Study 2, we assessed whether differences between Studies 2 and 3 reflected the design differences or differences between WEIRD and non-WEIRD settings.
Second, we relied on nonexperimental survey data. Hence, we cannot rule out the possibility of omitted variables confounding the relationships of interest. Hence, the results below should be interpreted as associations (although, in some parts, following conventions, we use causal terms, e.g., “random effects” in multilevel analyses). Likewise, the mediation analyses in Studies 2 through 4 are mute on causal order: Dominance can be a predictor of both autocratic orientations and (via autocratic orientations) political violence, but dominance may also be a mediator through which autocratic orientations influence violence. Theoretically, we see the former scenario as being more likely, with individual differences in dominance determining both political orientations and propensity to political violence.
Study 1: Are Autocratic Political Orientations Associated With Political Violence?
Method
Data
Political-science research on political violence has typically focused on states or groups as units of analysis. The dearth of individual-level studies within this literature has largely been due to the lack of micro-level data from violence-affected states. Here, we used a recently established data set, which—uniquely—contains items on individual participation in political violence: the Afrobarometer (2015) data set.
The Afrobarometer (2015) data set contains representative cross-sections of all citizens of voting age from 34 African countries (N = 51,587) on topics related to governance, markets, and civil society. Depending on demographic heterogeneity, each country sample spans approximately 1,200 or 2,400 individuals, resulting in a margin of sampling error of ±2.8% and ±2.0%, respectively (at a 95% confidence level). The surveys used clustered, stratified, multistage probability sampling, in which random selection with probability proportionate to population size was applied at every stage.
The coverage of this data set is extraordinary. In addition to enhanced external validity, such coverage confers several methodological advantages. First, it allowed us to analyze a large number of participants in political violence—who typically compose only a tiny fraction of a country’s population (see Fig. 1)—selected via probability sampling. Second, it allowed us to account for country-specific factors that potentially confound or moderate the associations between our key variables.
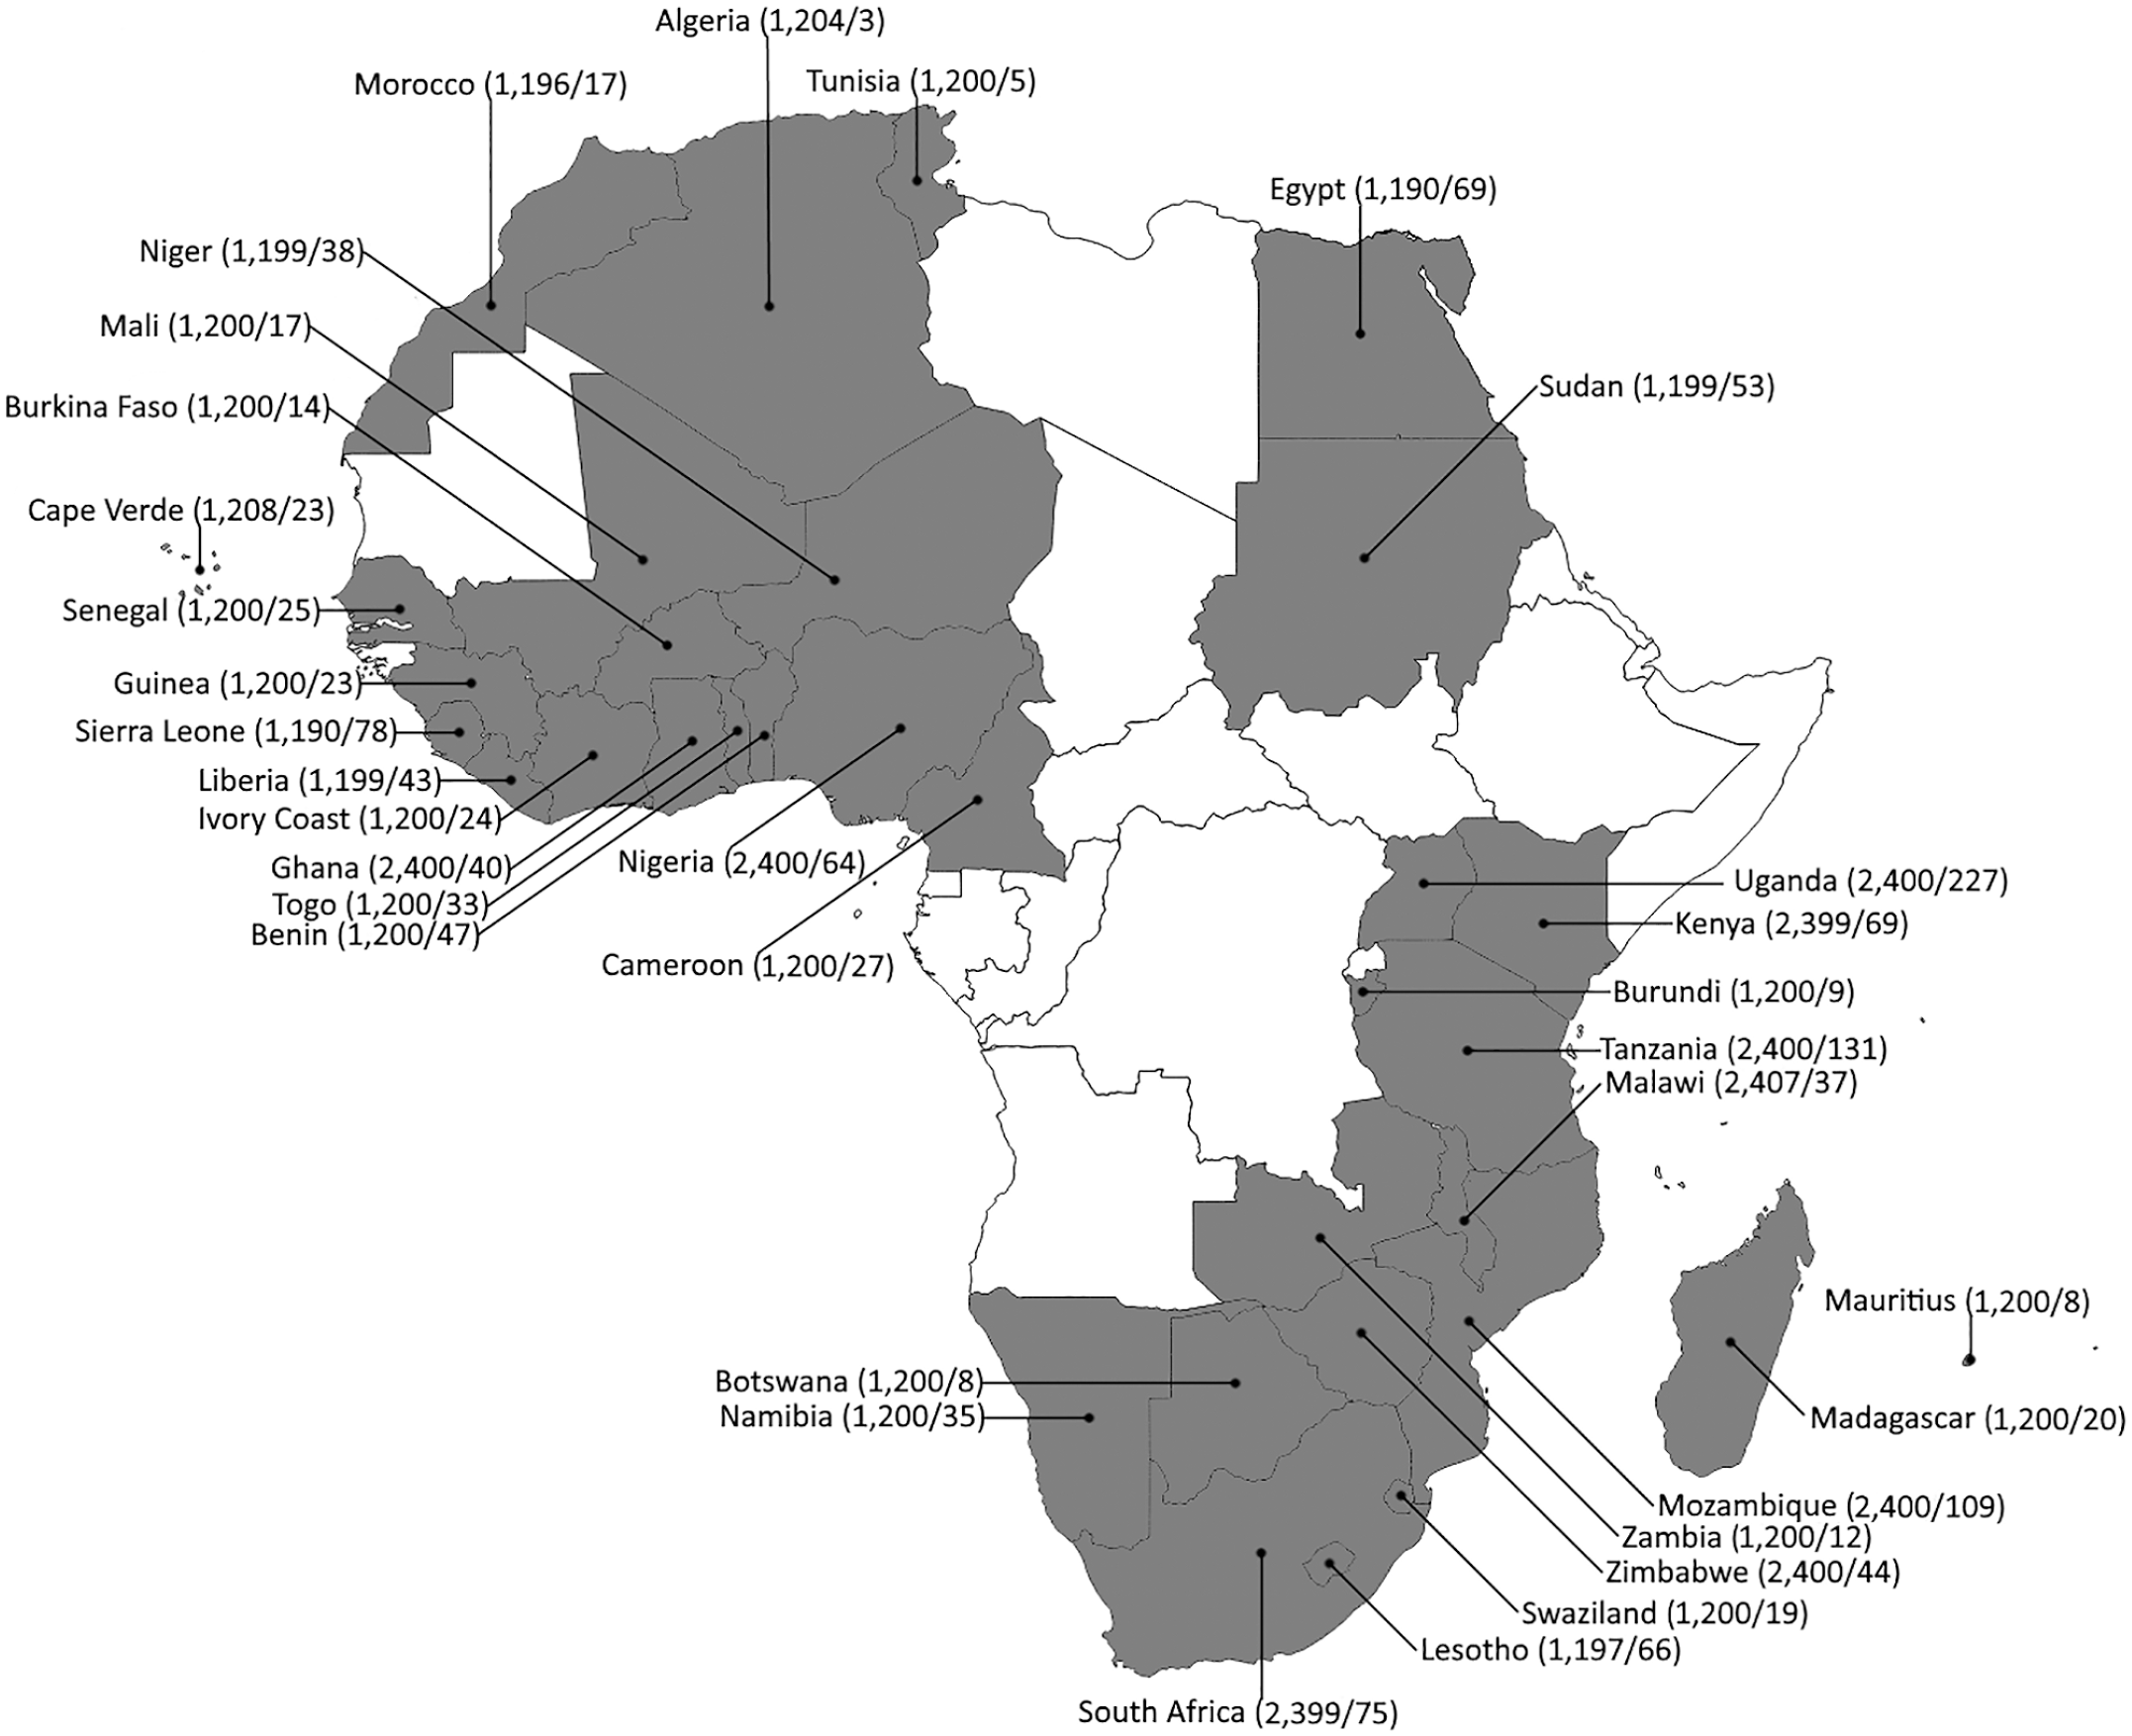
African countries included in Study 1. Numbers in parentheses indicate sample sizes (to the left of the slashes) and counts of interviewees who reported participation in political violence (to the right of the slashes).
Outcomes
Participation in political violence was measured with self-reported use of violence for a political cause. Although self-reported, the measure explicitly focuses on actual behavior as opposed to intentions or attitudes toward violence: Here is a list of actions that people sometimes take as citizens. For each of these, please tell me whether you, personally, have done any of these things during the past year. If not, would you do this if you had the chance: Used force or violence for a political cause?
The answer options were No, would never do this; No, but would do if had the chance; Yes, once or twice; Yes, several times; Yes, often; and Don’t know. This item followed four other items on political activism (“Attended a community meeting,” “Got together with others to raise an issue,” “Refused to pay a tax or fee to government,” and “Attended a demonstration or a protest march”), suggesting that the question about violence refers to participation in a protestlike, violent antigovernment action.
Violence for a political cause is a broader construct that likely subsumes various specific types of violence. We assume that variables that increase people’s general motivations to use violence for a political cause, ceteris paribus, also increase people’s willingness to engage in more specific types of violence, including low-intensity violence during protests and high-intensity violence during civil conflicts (e.g., Gleditsch et al., 2002).
We were primarily interested in whether people participated in violence, not how frequently they did so. Therefore, in the main analysis, we recoded this variable as binary, aggregating the first two responses into “no” (0) and the last three into “yes” (1). This distinction follows macro-level research considering the onset of violence and the intensity of violence as distinct phenomena caused by different factors (Dixon, 2009). Analysis of the original, ordinal scale (coded 0–4; reported in Table S6 in the Supplemental Material available online) generated the same substantive conclusions.
To support the validity of this measure, we implemented a range of tests (specified below) and introduced an alternative measure, willingness to participate in political violence, which reflected a subset of the data used for the primary measure (No, would never do this = 0, No, but would do if had the chance = 1). Although this measure does not indicate actual conflict behavior, it reflects behavioral intentions to partake in political violence. Arguably, individuals who report a willingness to participate in violence if they have a chance will more likely take part in such violence when the chance arises, ceteris paribus. Studies show that expressed intentions to engage in political violence predict actual participation (Gómez et al., 2017; see also Moskalenko & McCauley, 2009). Behavioral intentions are distinct from mere attitudes, such as support for violence. Attitudes can be idealistic, whereas intentions consider practical limitations and opportunities (Ajzen & Fishbein, 1977).
This measure also confers several methodological advantages. First, given that willingness to partake in violence does not constitute actual violence, this measure may suffer less from underreporting. Second, it allows for assessing willingness to engage in violence independently of opportunities for violence. Individuals who reported not having participated in political violence might have taken part in such violence if they had the opportunity to do so (and such opportunities may be lacking for various reasons that are beyond our study’s scope).
Finally, we also analyzed support for violence using the following question: “Which of the following statements is closest to your view? 1: The use of violence is never justified in [country name] politics today. 2: In [country name], it is sometimes necessary to use violence in support of a just cause.” The answer options were Agree very strongly with statement 1, Agree with statement 1, Agree with statement 2, and Agree very strongly with statement 2. We coded the first two replies as 0 and the last two as 1 (hence, 1 indicated support for political violence).
Predictors
The political-science literature does not contain a standard indicator of individual preference for autocratic versus democratic forms of governance (for a discussion, see Norris, 1999). In the psychological literature, several measures of related constructs exist, such as SDO (Ho et al., 2015) and right-wing authoritarianism (RWA; Duckitt, Bizumic, Krauss, & Heled, 2010). However, these measures were not included in the Afrobarometer questionnaire (we were not involved in the Afrobarometer project), and they do not directly tap preference for autocratic versus democratic forms of governance at the national level.
The Afrobarometer questionnaire contains more than 100 questions, with a wide range of items on political views. This allowed us to construct a measure of autocratic political orientations—the Autocratic Orientation Scale (AOS)—with satisfactory content validity and internal consistency. Initially, we identified 10 items that reflect preferences for an autocratic or a democratic form of governance (Questions 18–21, Questions 31A–31C, and Questions 33–35; for the full formulations, see Section S1 in the Supplemental Material). Subsequently, we performed an exploratory factor analysis and derived a three-item scale (AOS3), which served as our primary predictor (for details on the factor analysis, see Section S2 in the Supplemental Material). The selected items indicate approval on a 5-point scale (strongly disapprove = 0, strongly approve = 4) of the following statements: “Only one political party is allowed to stand for election and hold office,” “The army comes in to govern the country,” and “Elections and parliament are abolished so that the president can decide everything.” We computed each interviewee’s autocratic orientation as the mean score over the three items (higher values indicate a more autocratic orientation). Estimated across all countries, Cronbach’s alpha for the three-item scale amounted to .63. Although this is below the conventional .7 threshold, this reflects a low number of items rather than problems of multidimensionality (for elaboration, see Sections S2 and S4 in the Supplemental Material). We also replicated our analyses using an alternative scale of autocratic orientations, reflecting responses to the other seven questions (AOS7), and generated substantively the same results (see Table S7 in the Supplemental Material). 2
To control for potential confounders and compare the predictive power of autocratic orientations, we analyzed a number of other individual-level variables. We focused on three categories of predictors. The first category was basic demographic correlates of interpersonal aggression and risk taking—sex and age (Daly & Wilson, 1988)—and education (no formal schooling = 0, postgraduate = 9).
The second category included variables related to socioeconomic status (SES) highlighted in macro-level research. Gross domestic product (GDP) per capita is among the most robust country-level predictors of large-scale political violence. Collier and Hoeffler (2004) claimed that this reflects lower opportunity costs for rebel recruitment: Low-SES individuals (in countries with low GDP per capita) have less to lose and more to gain from participating in rebel organizations (which offer economic rewards). In the main analysis, we used subjective economic status as a proxy for SES (“Let’s discuss economic conditions. In general, how would you describe your own present living conditions?”; very bad = 0, very good = 4). In additional analyses reported in the Supplemental Material, we used an alternative, employment status: “Do you have a job that pays a cash income?” Response options—No (not looking); No (looking); Yes, part time; and Yes, full time—were recoded into a binary variable: unemployed = 0, employed = 1.
The third category included variables highlighted in existing psychological studies on nonnormative collective action and radicalization. Becker and Tausch (2015) suggested perceived injustice, contempt toward state authorities, and group or political efficacy (to influence political decisions) as predictors of nonnormative collective action. We used subjective ethnic discrimination as a proxy for perceived injustice (“How often is [interviewee’s ethnic group] treated unfairly by the government?”; never = 0, always = 3). As an alternative measure, we analyzed subjective economic inequality (“Let’s discuss economic conditions. In general, how do you rate your living conditions compared to those of other [name of nationals]?”; much worse = 0, much better = 4). Political efficacy was measured with feeling heard by members of parliament (“How much of the time do you think [members of parliament] try their best to listen to what people like you have to say?”; never = 0, always = 3). We also used an alternative, analogous measure referring to local government councilors (instead of members of parliament). The Afrobarometer questionnaire lacks explicit questions about contempt toward state authorities. However, voting refusal is a plausible proxy of this construct. Tausch et al. (2011) reported a negative correlation between voting intention (expressed likelihood of voting in forthcoming elections) and an explicit measure of contempt toward state authorities. We coded voting in the most recent national elections as follows: “You decided not to vote” = 1, all other replies = 0. People may not vote for a number of other reasons; hence, this measure potentially captures several other constructs. Note, however, that the interviewees could choose from a number of other reply options: “You were too young to vote,” “You were not registered to vote,” “You voted in the elections,” “You could not find the polling station,” “You were prevented from voting,” “You did not have time to vote,” “You did not vote because you could not find your name in the voters’ register,” and “Did not vote for some other reason.” Hence, our measure indicates a deliberate refusal to vote, which likely reflects disaffection with state authorities. Tausch et al. (2011) also reported a negative correlation between voting intention and perceived political efficacy, suggesting that this variable potentially accounts for both contempt and efficacy. Given this, we did not regress voting refusal and political efficacy simultaneously; we included the former in the main models and the latter in additional analyses.
Finally, both studies on nonnormative action and studies on radicalization emphasize social identification, particularly with disadvantaged groups (e.g., Becker & Tausch, 2015; Gøtzsche-Astrup, 2018). Hence, we added a measure of identification with an ethnic group versus national identification (“Let us suppose that you had to choose between being a [e.g., Kenyan] and being a [e.g., Luo]. Which of the following best expresses your feelings: I feel only Kenyan, I feel more Kenyan than Luo, I feel equally Kenyan and Luo, I feel more Luo than Kenyan, and I feel only Luo”; coded 0–4); we also analyzed a multiplicative interaction between this variable and ethnic discrimination. In the robustness analyses presented below, we tested a number of other predictors.
We also analyzed a number of country-level variables shown to predict political violence in the macro-level literature (Dixon, 2009). We included national-level democracy, measured by scores on Polity2 (Marshall, Gurr, & Jaggers, 2018), a widely used composite index accounting for executive recruitment, executive constraints, and competitiveness of national elections. We also added national-level support for autocracy, measured by country-mean autocratic orientation (AOS3), and political instability, measured by the proportion of interviewees indicating “political instability/ethnic tensions” among the three “most important problems facing [country name].” Further, we included violent crime, measured by intentional homicide rate per 100,000 (The World Bank, 2019), and violent protests, measured by the count of “social-conflict” events coded in the Social Conflict Analysis Database (Salehyan et al., 2012; the events were counted in the year before the Afrobarometer surveys, and the variable was adjusted to population size; rate per 1,000,000). We also added national economic status, measured with GDP per capita (constant 2010 U.S. dollars; The World Bank, 2019); conflict history, measured with years since the last “internal armed conflict” coded in the Uppsala Conflict Data Program/Peace Research Institute Oslo Armed Conflict Dataset (Gleditsch et al., 2002); and population size (The World Bank, 2019). See Table S1 and Figures S1 to S3 in the Supplemental Material for summary and descriptive statistics and Table S2 in the Supplemental Material for bivariate correlations for all variables.
Modeling
Given the hierarchical structure of our data—with individuals (Level 1 units) nested within countries (Level 2 units)—and binary outcomes, we used hierarchical generalized linear models with the logit link function. To identify the most appropriate multilevel specification, we followed the “bottom-up” strategy recommended by Hox, Moerbeek, and van de Schoot (2018, pp. 42–46). For details on this analysis strategy and other modeling choices, see Section S3 in the Supplemental Material. Below, we report results of our main models with Level 1 and Level 2 variables and random intercepts and randomly varying slopes for autocratic orientations and other Level 1 predictors. In the Supplemental Material, we present a range of alternative specifications, which produced substantively the same conclusions.
To aid interpretation of regression coefficients, we normalized all variables to range from 0 to 1. Normalizing variables to the same narrow range also improves convergence in maximum likelihood estimation that uses numerical integration. 3 The main analyses were performed using melogit in parallel-processing Stata/MP (Version 15) on an eight-core computer; the analyses reported in the Supplemental Material were performed using Stata’s mixed, meologit, and clogit functions.
Results
Does an autocratic political orientation predict participation in political violence?
Only a small fraction (2.86%) of the interviewees reported participation in violence. The figures were highest in Uganda (9.46%) and Sierra Leone (6.56%) and lowest in Botswana (0.67%) and Tunisia (0.42%). For other countries, see Table S3 in the Supplemental Material. Overall, 49,168 interviewees indicated not having participated in political violence, and 1,473 indicated having done so.
Importantly, participation in political violence significantly varied with autocratic orientations, as measured by the AOS3. As shown in Table 1, the AOS3 was positively and significantly associated with participation in political violence. This association remained significant when analyses controlled for the individual- and country-level variables introduced above (Models 1 and 2). The table reports results in log odds (or logit), which represent the natural log of the change in odds of participation in political violence associated with a 1-unit increase in a predictor.
Autocratic Orientation as Predictor of Political Violence: A Multilevel Analysis (Study 1)
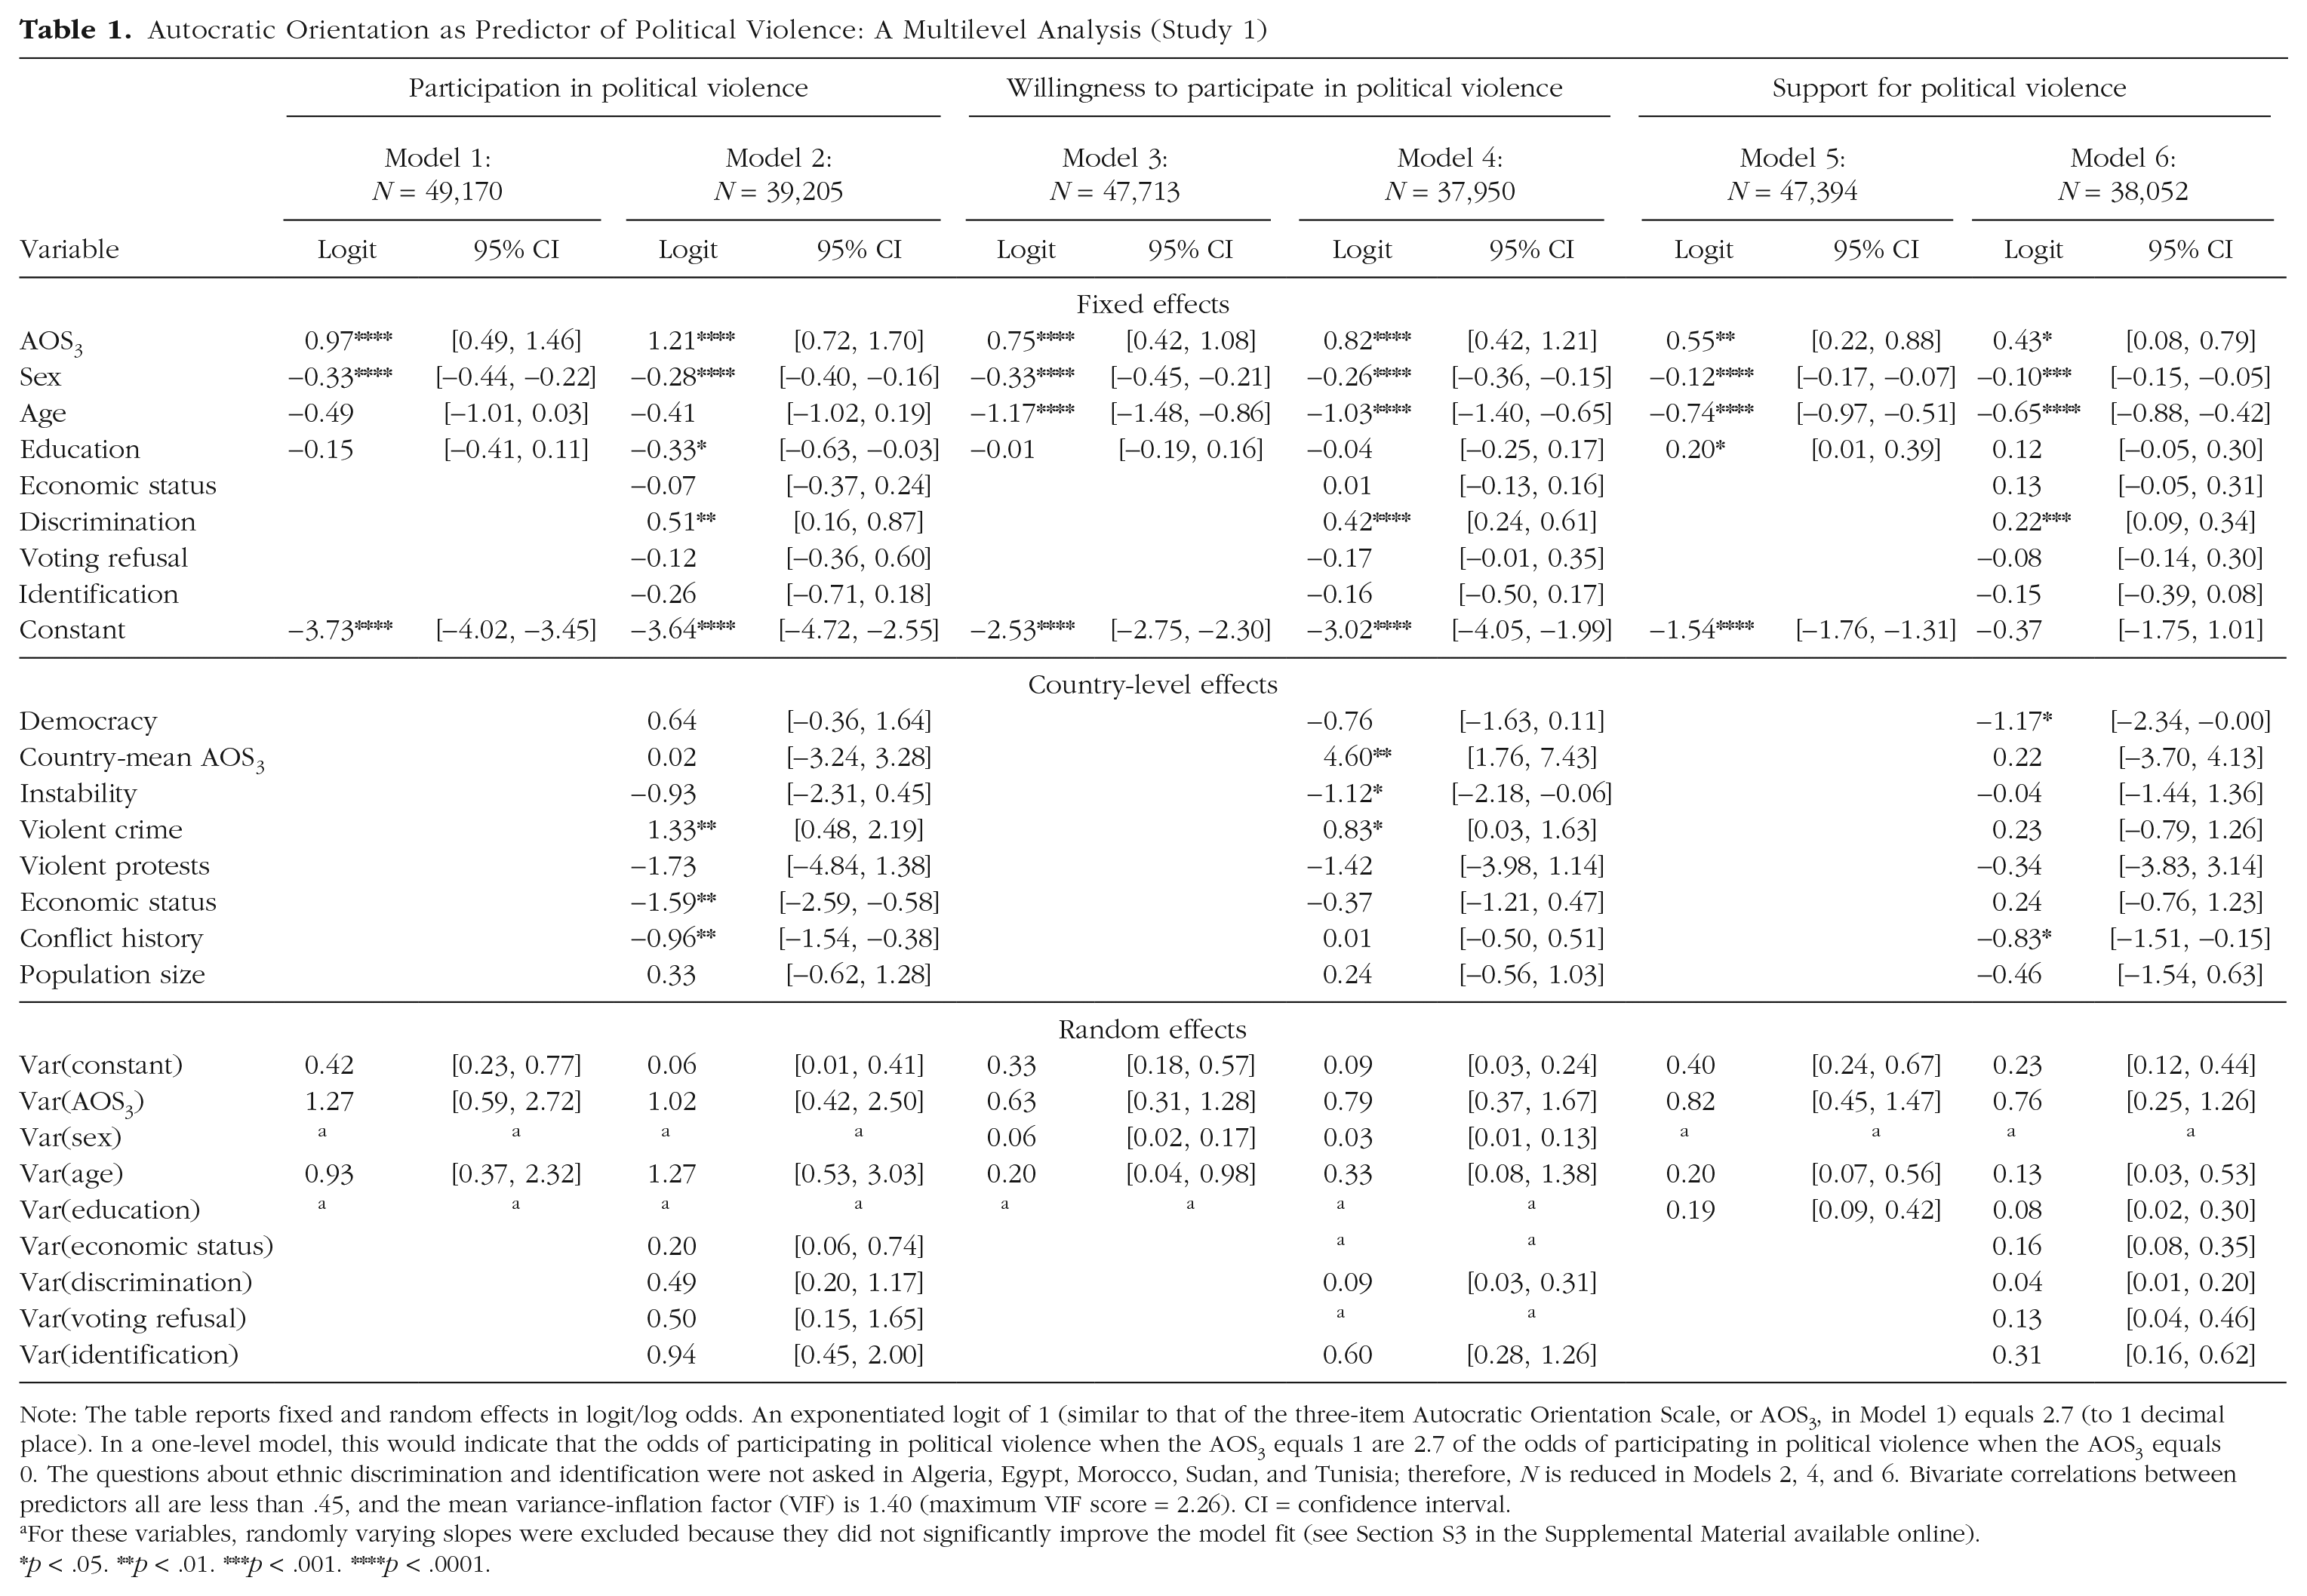
Note: The table reports fixed and random effects in logit/log odds. An exponentiated logit of 1 (similar to that of the three-item Autocratic Orientation Scale, or AOS3, in Model 1) equals 2.7 (to 1 decimal place). In a one-level model, this would indicate that the odds of participating in political violence when the AOS3 equals 1 are 2.7 of the odds of participating in political violence when the AOS3 equals 0. The questions about ethnic discrimination and identification were not asked in Algeria, Egypt, Morocco, Sudan, and Tunisia; therefore, N is reduced in Models 2, 4, and 6. Bivariate correlations between predictors all are less than .45, and the mean variance-inflation factor (VIF) is 1.40 (maximum VIF score = 2.26). CI = confidence interval.
For these variables, randomly varying slopes were excluded because they did not significantly improve the model fit (see Section S3 in the Supplemental Material available online).
Using Stata’s margins postestimation command, we estimated probabilities of participation in political violence following Model 2. The predictive power of autocratic orientations is of substantive significance. Autocracy-oriented individuals (AOS3 = 1) are considerably more likely than democracy-oriented individuals (AOS3 = 0) to report participation in political violence (average predicted probabilities = 9.88% and 2.48%, respectively).
Do these results generalize across measures of political violence?
The analyses demonstrated that political orientation was also positively associated with willingness to partake in political violence (Models 3 and 4) and general support for political violence (Models 5 and 6). Autocrats (AOS3 = 1) were considerably more likely than democrats (AOS3 = 0) to report willingness to participate in political violence (average predicted probabilities = 15.17% and 6.18%, respectively) and support for political violence (27.81% and 18.64%, respectively).
How does the predictive power of autocratic orientations compare with those of other predictors of political violence?
As shown in Table 1, several other variables were significantly associated with political violence. Below, we report average predicted probabilities for the minimum and maximum scores of each significant predictor and (for analyses not reported in Table 1) log-odds estimates with 95% confidence intervals (CIs) from the fixed part of the hierarchical models. Men were more likely than women to report participation in political violence (3.88% vs. 2.99%, respectively; based on Model 2). Men were also more likely than women to report willingness to participate (8.40% vs. 6.76%, respectively; Model 4) and support for political violence (21.00% vs. 19.52%, respectively; Model 6). Note that these analyses included a number of posttreatment variables that are likely to be influenced by sex (which, in turn, affect political violence). Age was not significantly associated with participation in political violence; however, it was negatively and significantly associated with willingness to participate in (Models 3 and 4) and support for (Models 5 and 6) violence.
Subjective economic status was not significantly associated with the three outcomes (see Table 1). The same was true for employment (see Table S5 in the Supplemental Material). In contrast, high-education individuals were significantly less likely than low-education individuals to report participation in political violence (2.81% vs. 3.81%, respectively; based on Model 2). The association between education and willingness to participate in political violence was not significant (Models 3 and 4), and the association with support for political violence was significant only in the reduced specification (Model 5).
Turning to the predictors highlighted in psychological research, we found that a proxy of perceived group-based injustice—ethnic discrimination—was positively and significantly associated with participation in political violence (Model 2). Individuals who perceive their ethnic group as “always treated unfairly,” compared with those who perceive their ethnic group as “never treated unfairly,” were more likely to report participation in political violence (5.60% vs. 2.96%, respectively; based on Model 2). The former were also more likely than the latter to report willingness to participate in (10.27% vs. 6.92%, respectively) and support for (22.97% vs. 19.55%, respectively) political violence. Subjective economic inequality was significantly associated with participation in political violence (logit = −0.32, 95% CI = [−0.62, −0.01]) but not with the other two outcomes (see Table S5). Ethnic identification was not significantly associated with the three outcomes (see Table 1), whereas the multiplicative term of discrimination and identification negatively (logit = −0.51, 95% CI = [−0.93, −0.09]) predicted willingness to participate in violence but not the other two outcomes (see Table S5).
Voting refusal, a proxy of contempt toward state authorities, was not significantly associated with the three outcomes (see Table 1). Being heard by members of parliament, a proxy of political efficacy, significantly predicted participation in (logit = 0.64, 95% CI = [0.22, 1.05]) and willingness to participate in (logit = 0.29, 95% CI = [0.14, 0.44]) political violence (see Table S5). Note that our main model included injustice, contempt, and efficacy as predictors, whereas Tausch et al. (2011) considered injustice and efficacy as predictors and contempt as a mediator. However, excluding voting refusal from Models 2, 4, and 6 did not notably change the coefficients associated with injustice and efficacy.
Importantly, none of the coefficients reported in the models of participation (Models 1 and 2) were larger than that of the AOS3. The coefficient of the second-best predictor of participation in political violence, being heard by members of parliament, was nearly twice as small as that of the AOS3. With respect to effect sizes, the AOS3 was also the second-best predictor of willingness to participate in political violence (Model 4) and support for political violence (Model 6), second only to age.
If the data are skewed and the AOS3 is positively skewed (see Fig. S2 in the Supplemental Material), the change in probabilities due to a minimum-to-maximum change in a predictor may poorly represent the predictor’s influence on the outcome along the range of typical values. Therefore, we also examined changes in predicted probabilities due to a 1-standard-deviation increase from the mean. The probabilities of participation in violence due to a 1-standard-deviation increase in the AOS3 changed from 3.27% to 4.43%. For comparison, analogous probabilities changed from 3.31% to 4.00% for ethnic discrimination and from 3.42% to 4.18% for being heard by members of parliament.
Do country-level characteristics moderate the association between autocratic orientations and political violence?
We focused on individual-level, psychological processes; however, we also explored country-level variables, finding several notable patterns. Economic status, violent crime, and conflict history predicted participation in political violence (Model 2). However, only one country-level variable, conflict history, significantly (positively) predicted between-country variation in the association between autocratic orientations (AOS3) and political violence. Given the exploratory nature of this analysis, the results need further replication. If valid, they suggest that the difference in engagement in political violence between autocratic and democratic individuals is more pronounced in peaceful settings, presumably because existing (or recent) armed conflicts push nonautocrats to join in violence even against their preferences. In a further attempt to explain the between-country variation in the AOS3 coefficient, we ran one-level models (analogous to Model 1) for each country separately. Subsequently, we plotted the AOS3 coefficient by country (see Fig. 2). Inspecting Figure 2, we have not identified any additional substantive patterns that could potentially account for the unaccounted between-country variation in the AOS3 coefficient. However, Figure 2 shows that most of the negative or nonsignificant coefficients come from countries with a very small number of interviewees reporting participation in political violence (reported in parentheses next to country names).
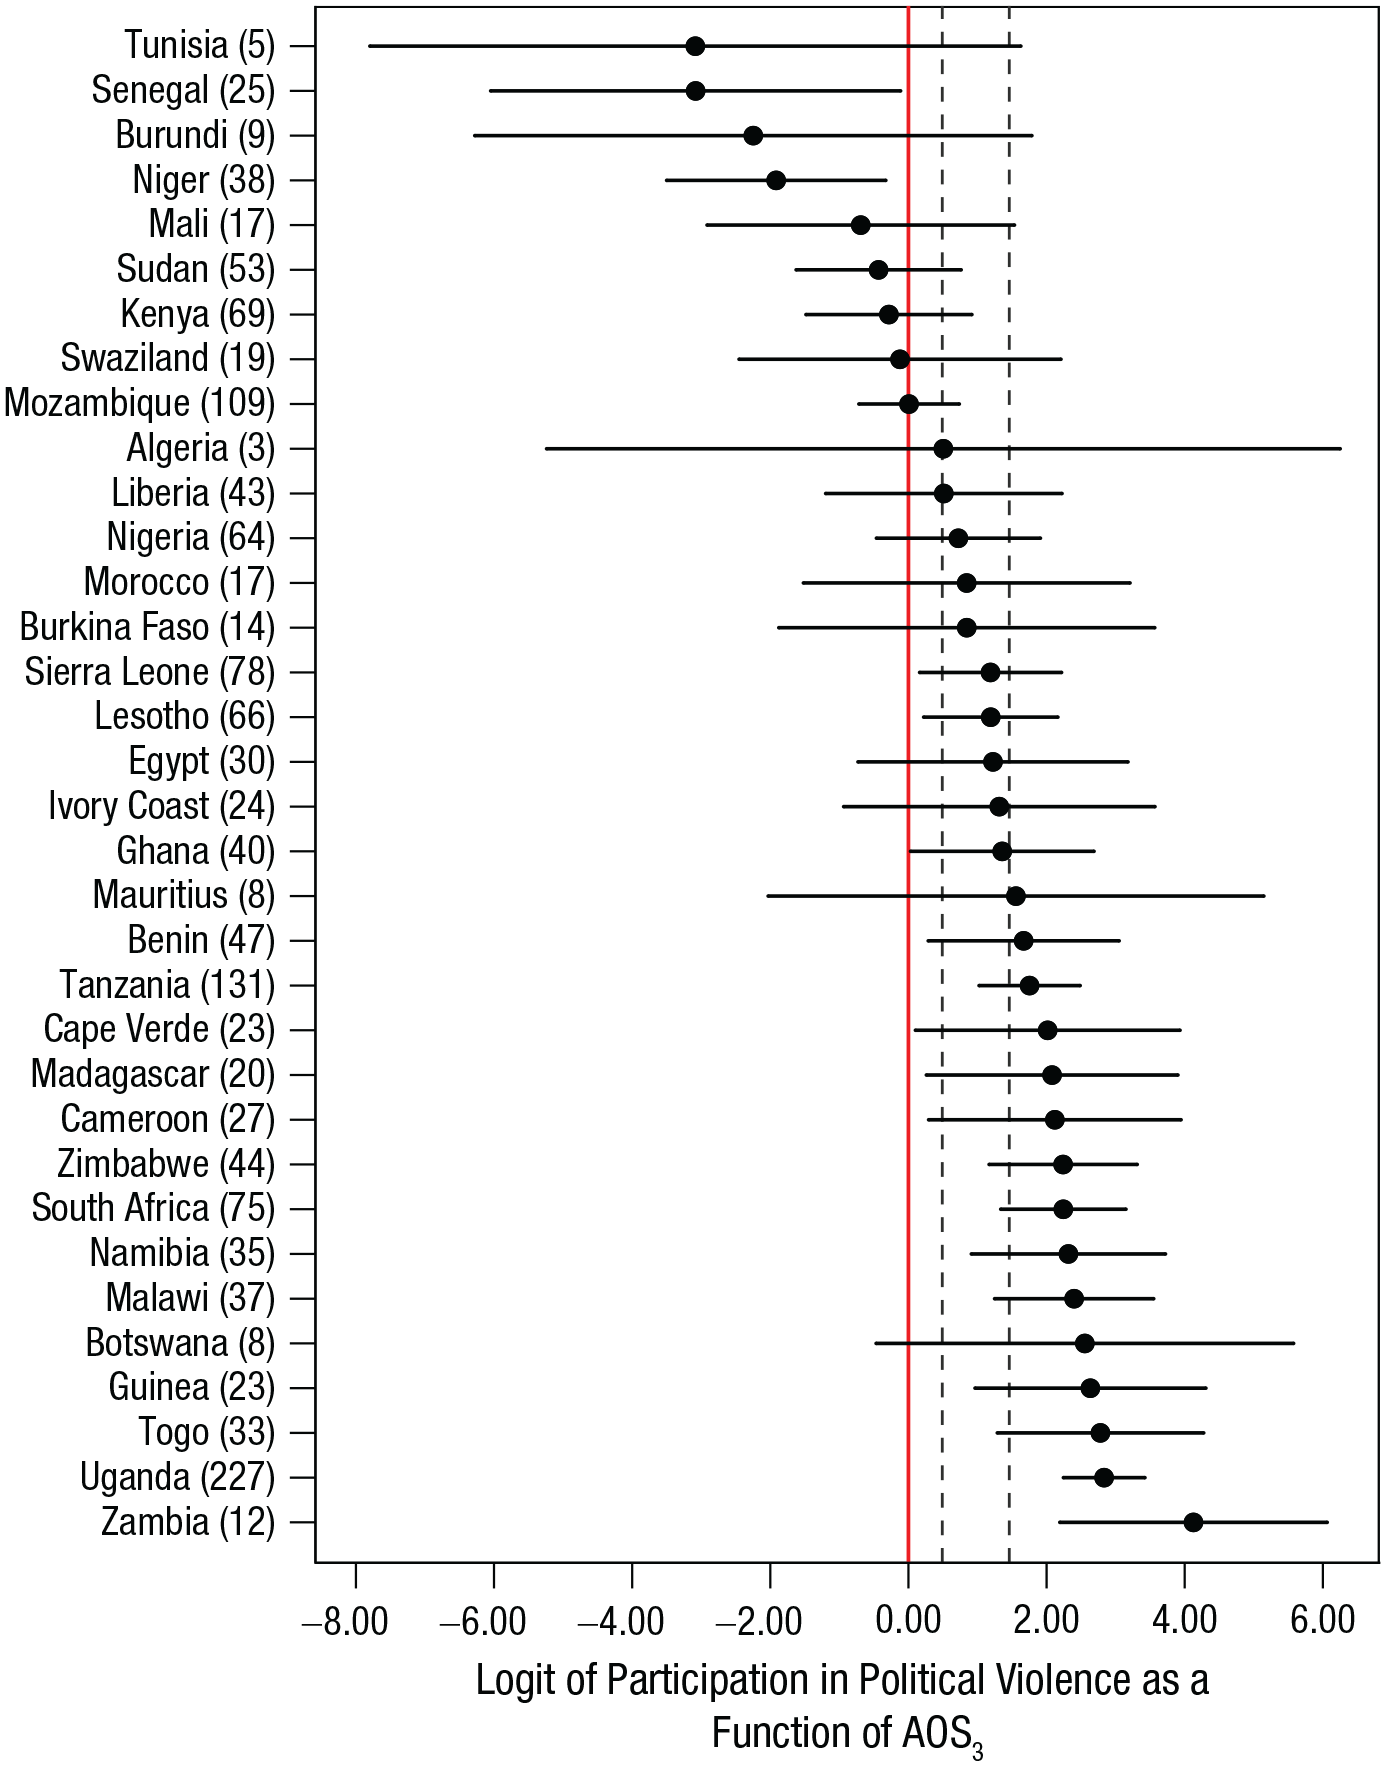
The association between autocratic orientation and political violence by country in Study 1. The figure shows the logit of participation in political violence as a function of the three-item Autocratic Orientation Scale (AOS3). Horizontal lines indicate 95% confidence intervals (CIs). The numbers in parentheses after each country name are counts of interviewees who reported participation in political violence. Dashed vertical lines indicate the 95% CI of the fixed-effect logit estimated across all countries in the multilevel analysis (Model 1, Table 1).
How robust are the results?
We demonstrate in the Supplemental Material that these results are not sensitive to alternative modeling choices, including specifications with alternative outcome measures and alternative estimators, hierarchical models with the cumulative logit link function (i.e., ordered logit), or the identity link function (hierarchical linear models; see Section S3 in the Supplemental Material for elaboration and Table S6 in the Supplemental Material for estimates). We also examined whether the results were driven by (a) particular operationalization of autocratic orientations (i.e., we analyzed the AOS7 as an alternative), (b) autocracy-oriented individuals engaging in violence in support of the government, (c) democracy-oriented individuals providing biased responses because of self-presentation concerns, (d) democracy-oriented individuals suffering more from political repression, (e) dishonest or influenced answering, and (f) lack of comprehension of the survey questions (see Tables S7–S13 in the Supplemental Material). None of these alternative processes accounted for the results.
Adding Level 2 predictors considerably reduced the between-country variation in the intercepts (see Table 1); yet the var(constant) remains above 0, suggesting that some Level 2 influences on the individual-level propensity to violence remain unaccounted for, pointing to potential higher level omitted-variable bias (i.e., confounding by country-level characteristics). To account for such unobserved Level 2 factors, we used country-mean centering and Mundlak’s (1978) specification. These techniques remove all Level 2 influences from the estimates of fixed effects (McNeish & Kelley, 2019; but see the qualifications in Section S3 in the Supplemental Material). These analyses produced nearly identical results (see Table S14 in the Supplemental Material), suggesting that Level 2 characteristics do not confound the association between individual-level autocratic orientations and political violence.
Study 2: Assessing Underlying Motivations: The Role of Dominance Orientations
Study 1 found that autocratic orientations relate to political violence. Study 2 examined the underlying motivations. Specifically, we tested whether measures of autocratic orientation statistically mediate (or confound) the association between measures of dominance and political violence (i.e., Hypothesis 2).
Method
Data
We conducted a survey in South Africa (N = 2,170) via the survey agency YouGov. The survey was administered in English in October 2017 and was quota-sampled for age, sex, geography, and education to obtain an approximately nationally representative sample. We selected South Africa because we predicted that this sample would generate a sufficient number of participants in political violence (on the basis of Study 1; see Fig. 1; other countries with large counts of participants in violence, such as Uganda, Tanzania, Mozambique, or Sierra Leone, were not accessible to the agency at the time).
Outcomes
The questionnaire included measures of participation and willingness to participate in political violence that were analogous to those in Study 1. Unlike in Study 1, we did not measure support for political violence. Instead, we included an alternative, validated four-item measure of willingness to participate in political violence: the Radicalism Intention Scale (RIS; Moskalenko & McCauley, 2009; e.g., “I would participate in a public protest against oppression of my group even if I thought the protest might turn violent”; strongly disagree = 0, strongly agree = 6; see Section S5 in the Supplemental Material for other items).
Predictors
The questionnaire included the same 10 questions used in Study 1 to generate measures of autocratic orientations, the AOS3 (α = .75) and the AOS7 (α = .60). Confirmatory factor analysis indicated that the AOS3 was a unidimensional scale; that is, the three items of the AOS3 loaded highly on a single latent factor (for details, see Section S4 in the Supplemental Material).
To assess Hypothesis 2, we first analyzed measures of a well-established psychological construct of an orientation toward dominance at the intergroup level: SDO. We used the 16-item SDO7 scale (Ho et al., 2015), which in the South African sample showed satisfactory reliability (α = .82). We also analyzed the subdimensions of SDO: SDO Dominance (“preference for systems of group-based dominance in which high status groups forcefully oppress lower status groups”) and SDO Egalitarianism (“preference for systems of group-based inequality that are maintained by an interrelated network of subtle hierarchy-enhancing ideologies and social policies”; Ho et al., 2015, p. 1003). The subscales, SDO Dominance and SDO Egalitarianism, showed satisfactory reliability (αs = .70 and .73, respectively).
Note that SDO refers to a preference for dominance hierarchies in general rather than support for hierarchies benefiting one’s group. The SDO7 was developed to explicitly measure the former construct. We expected, however, that both dominance-based seeking of in-group status and general support for dominance hierarchies would relate to violence because both—as we have argued—are outcomes of a general preference for dominance as a status-attainment strategy. Using the SDO7, hence, we could assess only one part of our argument. Moreover, SDO exclusively refers to the intergroup domain.
Given this, we introduced two additional variables: a measure of individual differences in dominance-based pursuit of in-group status and a measure of dominance-based pursuit of individual status. These measures were part of the Domain-Specific Risk Scale (DSRS; Wilke et al., 2014). The DSRS covers risk taking in 10 key domains of human life. The original scale was designed for undergraduate populations, with some items not applicable to nationally representative samples. Therefore, we focused on risk taking only within the following domains: (a) in between-group competition, (b) to gain power and status, (c) in within-group competition for leadership, (d) when exploring environments, (e) for acquiring food, (f) on behalf of kin, and (g) to attract mates. The adjusted 21-item scale includes three items per domain. The questionnaire asked interviewees to indicate “the likelihood that you would engage in the described activity or behavior if you were to find yourself in that situation” (very unlikely = 0, very likely = 4). The first two domains refer to risk taking or status seeking based on dominance (e.g., “Adamantly defending the honor of your local community against a person from a different community, even if it may cause a fight” and “Blackmailing your opponent to win an election,” respectively). The third domain refers to risk taking or status seeking without reference to dominance (e.g., “Trying to take a leadership role in any group you join”), and all other domains lack reference to status entirely (see Section S6 in the Supplemental Material). Thus, the scale provided an opportunity to test Hypothesis 2 with discriminatory validity. If the link between autocratic orientation and political violence reflects dominance-driven risk taking (rather than risk taking driven by other motivations), then autocratic orientation should mediate the associations between violence and risk taking only within the first two domains when we control for risk taking in the other domains.
Finally, to assess the construct validity of our overall conclusions, we also included a measure of RWA, defined as “submission to in-group authority figures” (Zakrisson, 2005, p. 864). Although both measures pertaining to dominance and measures pertaining to RWA may relate to political violence, our claim that political violence is driven by dominance-based status seeking as well as preference for social hierarchies implies that SDO but not RWA should predict violence. We used the RWA scale presented by Duckitt et al. (2010), which showed satisfactory reliability in our sample (α = .78).
We also obtained measures of sex, age, education, and SES. As in Study 1, all predictors were normalized from 0 to 1. See Table S16 and Figures S4 to S6 in the Supplemental Material for summary and descriptive statistics and Table S17 in the Supplemental Material for a bivariate correlation matrix. For comparability, we used logit models analogous to those in Study 1, with the exception of an ordinary least squares model in the analysis of the continuous RIS.
Results
Are the main results replicated in the South African sample?
In our South African sample, 3.00% of interviewees (65 of 2,170) reported participation in political violence, similar to 3.12% (75 of 2,400) reporting in Study 1. Subsequently, consistent with Study 1, results showed that autocratic orientations, as indexed by the AOS3, predicted participation in political violence (logit = 4.28, 95% CI = [3.24, 5.32]), willingness to participate in political violence (logit = 1.94, 95% CI = [1.09, 2.79]), and willingness to participate in political violence as measured by the RIS (b = 0.36, 95% CI = [0.31, 0.42]; Table S18 in the Supplemental Material shows detailed estimates). Similarly, proneness to political violence was higher among men than women (participation: logit = −0.81, 95% CI = [−1.38, −0.23]; willingness: logit = −0.74, 95% CI = [−1.15, −0.33]; RIS: b = −0.08, 95% CI = [−0.10, −0.05]). Likewise, age was significantly associated with willingness to participate in political violence (logit = −1.06, 95% CI = [−2.03, −0.10]) and the RIS (b = −0.12, 95% CI = [−0.17, −0.07]) but not with participation in political violence (logit = −1.07, 95% CI = [−2.65, 0.50]). Education was significantly and positively associated with participation in political violence (logit = 2.94, 95% CI = [1.19, 4.69]) and the RIS (b = 0.16, 95% CI = [0.09, 0.23]) but not with willingness to participate in political violence (logit = 0.91, 95% CI = [−0.35, 2.16]). SES was significantly associated only with the RIS (b = 0.06, 95% CI = [0.002, 0.11]). Note, once again, that none of the coefficients reported above are larger than those of the AOS3. We also analyzed the alternative measure of autocratic orientations, the AOS7, finding similar results (see Table S19 in the Supplemental Material). The results are not sensitive to alternative modeling choices, including specifications with alternative outcome measures and alternative estimators (see Tables S18 and S19).
Does an autocratic orientation mediate the association between dominance and political violence?
We first assessed the correlation (r) between social dominance (SDO7) and autocratic orientations (AOS3), which amounted to .36 (see Table S17). Subsequently, we tested whether SDO7 independently predicted the three outcomes and found significant estimates (participation: logit = 3.16, 95% CI = [1.74, 4.58]; willingness: logit = 1.80, 95% CI = [0.84, 2.76]; RIS: b = 0.21, 95% CI = [0.16, 0.26]; for details, see Table S20 in the Supplemental Material). In turn, we analyzed the SDO7 and AOS3 in one block and found that the coefficients for the former were substantially attenuated (participation: logit = 1.14, 95% CI = [−0.45, 2.74]; willingness: logit = 1.23, 95% CI = [0.20, 2.26]; RIS: b = 0.10, 95% CI = [0.04, 0.16]; see Table S21 in the Supplemental Material). In generalized linear models, such as logit, coefficients are not directly comparable across different (nested) specifications. Kohler, Karlson, and Holm (2011) developed a method that allows such direct comparisons, decomposing the total effects into direct effects and indirect effects, that is, effects attributable to mediating or confounding variables (following conventions, here we refer to “effects” rather than “associations”). Using this method and holding sex and age constant, we estimated that 42.15% of the total SDO7 effect on participation in violence, 25.58% of the total SDO7 effect on willingness to participate in violence, and 50.43% of the total SDO7 effect on the RIS were significantly (p < .001, p = .01, and p < .001, respectively) mediated or confounded by the AOS3 (see Table S22 in the Supplemental Material). Analogous percentages for models with SDO Dominance were 44.35%, 28.88%, and 46.92%, respectively (ps ≤ .001), and with SDO Egalitarianism were 44.65%, 26.15%, and 55.87%, respectively (ps ≤ .001). The total effects of SDO Dominance were larger than the total effects of SDO Egalitarianism—participation: logit = 2.90 vs. 2.53; willingness: logit = 1.71 vs. 1.63; RIS: b = 0.23 vs. 0.18, respectively (see Tables S23 and S24). Subsequently, we substituted the SDO7 with the AOS3 and examined the possibility that the AOS3 relates to political violence via the SDO7. We found that the SDO7 was a significant but much weaker mediator or confounder of the AOS3 effects: Analogous percentages were 14.33%, 23.17%, and 10.75% (p = .035, p = .012, and p < .001, respectively; see Table S25 in the Supplemental Material).
SDO, autocratic orientations, and political violence can relate in multiple ways: SDO and autocratic orientations may have independent effects on violence, autocratic orientations may partly or fully mediate the effects of SDO on violence, and SDO may partly or fully mediate the effects of autocratic orientations on violence. Our nonexperimental data do not allow us to adjudicate between these alternative theoretical models (Fiedler, Harris, & Schott, 2018); however, the estimates above are consistent with the model in which autocratic orientation partly mediates the SDO effects on violence and in which SDO and political orientation have partly independent effects on violence. These results are in line with Hypothesis 2.
Analyses of an alternative measure of dominance motivations, the DSRS, also produced results consistent with Hypothesis 2. Risk taking within the first and second domains (between-group competition and status/power) correlated with autocratic orientations as indexed by the AOS3 with rs of .31 and .42, respectively. DSRS (between-group competition) independently predicted the three outcomes (participation: logit = 5.78, 95% CI = [4.48, 7.08]; willingness: logit = 2.07, 95% CI = [1.17, 2.97]; RIS: b = 0.45, 95% CI = [0.40, 0.51]; see Table S26 in the Supplemental Material). These coefficients were attenuated by the inclusion of the AOS3 (participation: logit = 4.47, 95% CI = [3.06, 5.87]; willingness: logit = 1.65, 95% CI = [0.70, 2.59]; RIS: b = 0.38, 95% CI = [0.33, 0.43]; see Table S27 in the Supplemental Material). Similarly, DSRS (status/power) independently predicted the three outcomes (participation: logit = 4.41, 95% CI = [3.45, 5.37]; willingness: logit = 1.82, 95% CI = [1.02, 2.61]; RIS: b = 0.45, 95% CI = [0.40, 0.50]; see Table S28 in the Supplemental Material), and the coefficients were attenuated by the inclusion of the AOS3 (participation: logit = 3.26, 95% CI = [2.15, 4.37]; willingness: logit = 1.28, 95% CI = [0.40, 2.16]; RIS: b = 0.36, 95% CI = [0.30, 0.42]; see Table S29 in the Supplemental Material). A decomposition analysis in which sex, age—and risk taking in other domains—were held constant indicated that 9.76% of the total DSRS (group competition) effect on participation in violence, 33.66% of the total DSRS (group competition) effect on willingness to participate in violence, and 16.28% of the total DSRS (group competition) effect on the RIS was significantly (ps = .017, .050, and .002, respectively) mediated or confounded by the AOS3 (see Table S30 in the Supplemental Material). Analysis of the DSRS (status/power) revealed similar patterns: The AOS3 partly (24.85%, p = .002) mediated or confounded the effects on participation in violence, fully mediated or confounded (p = .011) the effects on willingness to participate in violence, and partly mediated or confounded (32.08%, p < .001) the effects on the RIS (see Table S31 in the Supplemental Material). Subsequent decomposition analyses indicated that the AOS3 did not significantly mediate the effects of risk taking in any of the other five domains (see Tables S32–S36 in the Supplemental Material). In Section S7 in the Supplemental Material, we also report an analysis of the Status-Driven Risk-Taking Scale, as an alternative to the SDO and DSRS, and an analysis of RWA.
Study 3: Assessing Generalizability: Will WEIRD Democrats Fight for Democracy?
Studies 1 and 2 focused on non-WEIRD countries, with short or no histories of democratic governance. Hence, the interviewees may have had little socialization to democratic values and little motivation to engage in violence against nondemocratic regimes. By contrast, in societies socialized to democratic values, democracy-oriented individuals may have higher motivation to oppose autocratic regimes, suggesting that our findings may not hold in WEIRD samples. To assess generalizability, we conducted a survey in a highly democratic country: Denmark.
Method
Data
The survey was administered online in Danish via YouGov in October 2016. The survey was designed to generate a sample representative of the adult population (N = 1,012) with respect to gender, age, education, and geography. We selected Denmark because it continuously ranks among the most democratic countries in the world according to various indices (e.g., Economist Intelligence Unit, 2017) and has a history and salient memory of resistance against an autocratic regime during the Second World War.
Outcomes
There were no prominent events of political violence in Denmark during or prior to the survey. Therefore, we did not measure participation in political violence. We obtained two other outcome measures.
First, we aimed to assess general support for political violence. While designing the survey, we were concerned that Danish citizens may be reluctant to report such attitudes. Therefore, we opted for an indirect measure generated via a double-list experiment (Glynn, 2013) embedded in the survey. A double-list experiment is a variant of the simpler single-list experiment. A list experiment allows the estimation of the proportion of a sample that supports a sensitive statement without individual interviewees explicitly expressing support for it. Specifically, half of the interviewees are randomly assigned to a baseline list with four neutral statements (e.g., “I enjoy listening to music”) and are asked to indicate how many of the statements they agree with. The other half of the interviewees are assigned to the treatment list, a list that includes the same four neutral statements plus the treatment item (i.e., the sensitive statement), and are similarly asked how many of the statements they agree with. In this study, the treatment item was “It is justifiable to use violence against the government of Denmark.” Given that the interviewees are asked to indicate the number of the statements they agree with, rather than agreement with particular statements, the list experiment is thought to decrease socially desirable responding.
The list experiment is based on the assumption that agreement with the neutral statements should (on average) be the same for individuals presented with the baseline list and those presented with the treatment list. Based on this assumption, the standard procedure for analyzing a list experiment involves estimating the proportion of interviewees who agree with the treatment item by computing the difference between the mean agreement for the treatment list and the mean agreement for the baseline list. The double-list experiment was developed to produce more accurate measurement than the standard single-list experiment. In the double-list experiment, each interviewee is presented with two separate list experiments (A and B) and receives the baseline list for one list experiment and the treatment list for the other list experiment. The double-list experiment thus produces two estimates of agreement with the treatment item, and the researcher then takes the average of these two.
Our double-list experiment followed the procedures described by Glynn (2013). Specifically, interviewees first received list experiment A and later in the survey list experiment B (for all statements, see Section S8 in the Supplemental Material). For both A and B, the baseline condition included four neutral statements, whereas the treatment condition included the same four neutral statements plus the fifth treatment item (support for political violence). Interviewees who were in the treatment condition for list experiment A were in the baseline condition for list experiment B, and vice versa. List experiment B included four different neutral statements and the same treatment item.
As mentioned, the standard procedure for analyzing data from a double-list experiment yields an estimate of the proportion of interviewees in a sample who agree with the treatment item, not estimates of agreement for individual interviewees. Hence, research using list experiments has typically examined associations with individual-difference variables by splitting in subsamples (e.g., subsamples based on education; Kramon & Weghorst, 2019). Following this, we examined the association with autocratic orientation by computing estimates of agreement for three subsamples (high, average, and low scores for autocratic orientation) and then comparing these estimates. In an alternative procedure, we also analyzed scores reflecting agreement with the sensitive item for individual interviewees. We obtained these scores by subtracting the number of items with which an interviewee agrees in the baseline list from the number of items with which the interviewee agrees in the treatment list. We then used these scores as values on the outcome variable in an ordinary least squares regression model. This model also included a binary variable indicating whether an interviewee received the treatment list in list experiment A or B to control for differences in agreement across the two list experiments due to different neutral statements.
Second, we aimed to assess how far the difference goes between autocrats and democrats in terms of willingness to use violence. Accordingly, we introduced a measure of willingness to participate in political violence in defense of democracy. The questionnaire included an introductory text describing that Denmark may become more autocratic in the future (this text included a definition of an autocratic government: “A regime in which the people do not elect the government”; for details, see Section S9 in the Supplemental Material). The interviewees then received four vignettes describing that the Danish government had become autocratic because of either a domestic political change or foreign aggression and that there was a resistance movement fighting “to make Denmark democratic again.” The vignettes explicitly hinted at the historical resistance movements during the Second World War to facilitate realism. Subsequently, for each vignette, interviewees indicated agreement with five statements on a 7-point scale (strongly disagree = 0, strongly agree = 6): “If the resistance succeeds, people like me will have more influence on politics”; “I would participate in a protest march organized by the resistance movement”; “I would help members of the resistance movement”; “I would join the resistance movement”; and “I would use physical violence for the cause of the resistance movement.”
To obtain a score of willingness to use violence, we averaged responses for the fifth statement across the four vignettes (α = .93). In the analyses below, we also include the first item, referring to the potential benefits of a successful resistance. We expected that such perceptions of benefits would relate to willingness to engage in violence and might differ between autocrats and democrats. Responses for the first item were averaged across the four vignettes (α = .93).
Predictors
We were wary of the possibility that statements such as “the army comes in to govern the country” or “elections and parliament abolished” may not resonate with Danish citizens. Therefore, instead of using Afrobarometer questions, we created an alternative, 10-item AOS for democracies (AOS-D). This scale accounts for the more subtle differences between autocratic and democratic orientations. To generate an equal number of pro and con trait items, we included six items from the Support for Democratic Values Measure (Canetti-Nisim, 2004; e.g., “Public participation of the people is not necessary if decision making is left in the hands of a few trusted leaders”) and four items from the Scale of Democratic Values (Miklikowska, 2012; e.g., “Society shouldn’t have to put up with the views that are fundamentally different from the views of the majority”; for other items, see Section S10 in the Supplemental Material). The scale ranged from 0 (strongly disagree) to 6 (strongly agree) and showed satisfactory reliability (α = .81). Corresponding to the measures in Studies 1 and 2, lower AOS-D scores indicate a democratic orientation, and higher AOS-D scores indicate an autocratic orientation.
We also obtained measures of RWA (six-item Conservatism subscale), SDO (eight-item short SDO7 scale), sex, age, SES, education, marital status, whether the interviewees had foreign parents, and identification with Danish society. All variables were normalized from 0 to 1. See Table S38 and Figures S7 to S9 in the Supplemental Material for summary and descriptive statistics and Table S39 in the Supplemental Material for bivariate correlations for all variables.
Results
Does a democratic political orientation predict support for political violence in Denmark?
Following conventions (Glynn, 2013; Kramon & Weghorst, 2019), we first estimated the proportion of interviewees who agreed with the treatment item for three subsamples. Specifically, we split the sample in terciles on the basis of their scores on the AOS-D, resulting in subsamples with a relatively “democratic orientation” (n = 329), “moderate orientation” (n = 327), and “autocratic orientation” (n = 356). We then estimated the proportion of interviewees in each subsample who agreed with the treatment item, following the estimation procedure by Glynn (2013; see Table S40 in the Supplemental Material).
We found that support for political violence was lowest among interviewees with a democratic orientation (estimated proportion of interviewees who agreed with the treatment item = 0.01, 95% CI = [−0.05, 0.07]), somewhat higher among interviewees with a moderate orientation (0.11, 95% CI = [0.04, 0.17]), and highest among interviewees with an autocratic orientation (0.17, 95% CI = [0.10, 0.23]). The difference in support for political violence (i.e., the difference in the estimated proportion of interviewees who agreed with the treatment item) between the democratic and autocratic subsamples was significant (difference = 0.16, 95% CI = [0.07, 0.24]), t(683) = 3.51, p < .001. In an alternative analysis, we regressed individual support for violence (measured by individual agreement with the sensitive item) on the AOS-D and found a significant association (b = 0.05, 95% CI = [0.01, 0.10]; for details, see Table S41 in the Supplemental Material). Thus, as in Study 1, a democratic political orientation related to lower support for violence, and an autocratic orientation related to higher support for violence.
Are democracy-oriented individuals willing to use violence to defend democracy?
We regressed willingness to fight for democracy on autocratic orientations (AOS-D) and found insignificant estimates (b = 0.02, 95% CI = [−0.09, 0.12]). Thus, democrats and autocrats were equally willing to engage in political violence in defense of democracy. On the one hand, these results are inconsistent with the claim that autocrats, compared with democrats, are more prone to political violence. On the other, they reveal that autocrats are just as willing to use violence—in support of a cause that is antithetical to their preferences—as democrats, whose preferences perfectly align with the cause. Furthermore, once we controlled for perceived benefits of a successful resistance, the AOS-D significantly predicted willingness to fight for democracy (b = 0.17, 95% CI = [0.06, 0.28]; see Table S42 in the Supplemental Material). Unsurprisingly, perceived benefits also predicted willingness to fight for democracy (b = 0.29, 95% CI = [0.22, 0.37]). Controlling for perceived benefits allowed us to account for democrats’ greater preference for a return to democracy. Once this difference between democrats and autocrats was removed, we saw that autocrats were more willing to use political violence.
This analysis thus did not corroborate Hypothesis 1 in its original formulation; however, it provided additional evidence for a link between an autocratic orientation and willingness to engage in violence. Overall, on the basis of the analyses of the list experiment and willingness to defend democracy, we conclude that Study 3 partly supports Hypothesis 1.
Does an autocratic orientation mediate the association between dominance and political violence?
The standard procedure for analyzing a list experiment does not allow one to assess mediating or confounding effects. Hence, to test Hypothesis 2, we analyzed the measure of willingness to fight for democracy and followed steps analogous to those in Study 2. We found that SDO (SDO7) correlated with autocratic orientations (AOS-D) at an r of .47. The SDO7 also independently predicted willingness to fight for democracy (b = 0.10, 95% CI = [0.004, 0.20]). Without controlling for perceived benefits of a successful resistance, we found that the SDO7 did not significantly predict the outcome (b = 0.02, 95% CI = [−0.08, 0.12]). The association between the SDO7 and violence (when we controlled for perceived benefits) was substantially attenuated by the inclusion of the AOS-D (b = 0.02, 95% CI = [−0.09, 0.13]; see Table S43 in the Supplemental Material). A decomposition analysis in which sex, age, and perceived benefits were held constant indicated that the AOS-D significantly (p < .001) and fully mediated or confounded the total effect of SDO on willingness to fight for democracy (see Table S44 in the Supplemental Material). Similarly, the AOS-D significantly (p < .001) and fully mediated or confounded the effect of SDO Dominance and partly mediated or confounded (77.10%, p = .001) the effect of SDO Egalitarianism. In contrast to the effects in the South African sample, the total effects of SDO Dominance were smaller (and insignificant) than the total effects of SDO Egalitarianism (b = 0.05, 95% CI = [−0.04, 0.13] vs. b = 0.10, 95% CI = [0.01, 0.19], respectively; see Tables S45 and S46 in the Supplemental Material). In sum, these estimates support Hypothesis 2; however, given that significant results were produced only by the models that controlled for perceived benefits of a successful resistance, Study 3 only partly supports Hypothesis 2 (for an analysis of the Conservatism subscale as an alternative to the AOS-D, see Section S11 in the Supplemental Material).
Study 4: Assessing Generalizability: Replicating Study 2 in a WEIRD Sample
In Study 3, we analyzed the boundary conditions of the difference between autocrats and democrats; hence, we measured willingness to use violence in defense of democracy. Given this, we could not determine whether differences in results between Studies 2 and 3 reflected design differences or differences between WEIRD and non-WEIRD settings. Therefore, we conducted Study 4, a direct replication (preregistration: https://osf.io/8wzms) of Study 2 but in a WEIRD country.
Method
Data
We conducted a survey in the United States (N = 1,539) via YouGov. The survey was administered in October 2019 and was quota sampled for age, sex, geography, and education to obtain an approximately nationally representative sample. The United States is a paradigmatic case of a WEIRD country. In addition, low-intensity political violence has often occurred there: Beyerlein, Barwis, Crubaugh, and Carnesecca (2018) counted 1,037 unique protest events between June 2010 and August 2011, with 7% involving police arrests, 11% involving “participants throwing an object,” and 4% incurring property damage. Given this, we expected the U.S. sample to contain at least some participants who had engaged in political violence.
Outcomes and predictors
The questionnaire included outcome and predictor measures identical to those in Study 2. All variables were normalized from 0 to 1. See Table S47 and Figures S10–S12 in the Supplemental Material for summary and descriptive statistics and Table S48 in the Supplemental Material for a bivariate correlation matrix. To test Hypotheses 1 and 2, we followed procedures analogous to those of Study 2. All key scales showed satisfactory reliability (αs = .86, .86, and .89, respectively, for the RIS, AOS3, and SDO7). Further, 7.21% of interviewees reported participation in political violence, and 6.17% reported willingness to participate in political violence.
Results
Are the main results replicated in the U.S. sample?
Consistent with Study 2, results showed that autocratic orientations (AOS3) predicted participation in political violence (logit = 6.29, 95% CI = [5.22, 7.36]), willingness to participate in political violence (logit = 1.99, 95% CI = [1.09, 2.90]), and willingness to participate in political violence as measured by the RIS (b = 0.37, 95% CI = [0.32, 0.43]; for detailed estimates, see Table S49 in the Supplemental Material). Similarly, proneness to political violence was higher among men than women (participation: logit = −0.70, 95% CI = [−1.26, −0.14]; willingness: logit = −0.97, 95% CI = [−1.46, −0.49]; RIS: b = −0.07, 95% CI = [−0.10, −0.05]). Age was also significantly associated with participation in political violence (logit = −5.12, 95% CI = [−6.70, −3.56]), willingness to participate in political violence (logit = −3.06, 95% CI = [−3.99, −2.12]), and the RIS (b = −0.25, 95% CI = [−0.30, −0.21]). Education was significantly and positively associated with the RIS (b = 0.06, 95% CI = [0.02, 0.11]) but not with participation in political violence (logit = 0.35, 95% CI = [−0.58, 1.29]) or willingness to participate in political violence (logit = 0.11, 95% CI = [−0.72, 0.93]). The associations between SES and the three outcomes were insignificant. Note that, save for the age coefficient in the model of willingness, none of the coefficients reported above are larger than those of the AOS3. We also analyzed the alternative AOS, the AOS7, and found similar results (see Table S50 in the Supplemental Material). The results were not sensitive to alternative modeling choices, including specifications with alternative outcome measures and alternative estimators (see Tables S51 and S52 in the Supplemental Material). In sum, Study 4 provides unequivocal support for Hypothesis 1.
Does an autocratic orientation mediate the association between dominance and political violence?
SDO (SDO7) and autocratic orientation (AOS3) correlated at an r of .39 (see Table S53 in the Supplemental Material). The SDO7 also independently predicted participation (logit = 6.24, 95% CI = [4.70, 7.77]) and willingness to participate in political violence (logit = 2.15, 95% CI = [0.99, 3.31]) but not the RIS (b = −0.02, 95% CI = [−0.08, 0.05]; see Table S51 in the Supplemental Material). These coefficients were attenuated by the inclusion of the AOS3 (participation: logit = 4.51, 95% CI = [2.29, 6.73]; willingness: logit = 1.42, 95% CI = [0.13, 2.70]; RIS: b = −0.21, 95% CI = [−0.28, −0.14]; see Table S52 in the Supplemental Material). A decomposition analysis in which sex and age were held constant indicated that 39.33% of the total SDO7 effect on participation in violence and 29.71% of the total SDO7 effect on willingness to participate in violence was significantly (p < .001 and p = .003, respectively) mediated or confounded by the AOS3 (see Table S53). In contrast to the effects of the SDO7, the total effects of the SDO Dominance subscale were significant on all three outcomes (participation: logit = 6.65, 95% CI = [4.75, 8.55]; willingness: logit = 2.04, 95% CI = [0.93, 3.15]; RIS: b = 0.08, 95% CI = [0.02, 0.14]; see Table S54 in the Supplemental Material). A decomposition analysis indicated that the AOS3 partly mediated or confounded the SDO Dominance effects on participation in violence (46.87%, p < .001) and willingness to participate in violence (29.61%, p = .011) and fully mediated or confounded the SDO Dominance effects on the RIS (p < .001). Similar to those of the SDO7, the total effects of the SDO Egalitarianism subscale were positive and significant in the models of participation and willingness (participation: logit = 4.02, 95% CI = [2.44, 5.61]; willingness: logit = 1.09, 95% CI = [0.11, 2.06]) but not in the model of the RIS (see Table S55 in the Supplemental Material). In this model, the point estimate for the SDO Egalitarianism subscale was negative but not significant (b = −0.05, 95% CI = [−0.10, 0.004]). If SDO Egalitarianism has no (or a negative) association with radicalism intentions, then this explains why the RIS had a weaker association with the overall SDO7 scale than with the SDO Dominance subscale.
Subsequently, we analyzed the DSRS. Risk taking within the first and second domains (between-group competition and status/power) correlated with the AOS3 with rs of .47 and .65, respectively. The DSRS (between-group competition) independently predicted the three outcomes (participation: logit = 5.84, 95% CI = [4.70, 6.97]; willingness: logit = 2.21, 95% CI = [1.20, 3.22]; RIS: b = 0.42, 95% CI = [0.37, 0.48]; see Table S56 in the Supplemental Material). These coefficients were attenuated by the inclusion of the AOS3 (participation: logit = 2.66, 95% CI = [1.36, 3.97]; willingness: logit = 1.77, 95% CI = [0.68, 2.87]; RIS: b = 0.32, 95% CI = [0.26, 0.38]; see Table S57 in the Supplemental Material). Similarly, the DSRS (status/power) independently predicted the three outcomes (participation: logit = 5.71, 95% CI = [4.75, 6.68]; willingness: logit = 3.34, 95% CI = [2.44, 4.24]; RIS: b = 0.48, 95% CI = [0.42, 0.53]; see Table S58 in the Supplemental Material), and the coefficients were attenuated by the inclusion of the AOS3 (participation: logit = 3.30, 95% CI = [2.18, 4.41]; willingness: logit = 3.27, 95% CI = [2.18, 4.35]; RIS: b = 0.38, 95% CI = [0.31, 0.45]; see Table S59 in the Supplemental Material). A decomposition analysis in which sex, age—and risk taking in other domains—were held constant indicated that 63.65% of the total DSRS (group competition) effect on participation in violence and 30.63% of the total DSRS (group competition) effect on the RIS was significantly (ps < .001) mediated or confounded by the AOS3; however, the AOS3 did not significantly mediate or confound the total DSRS (group competition) effect on willingness to participate in violence (p = .103; see Table S60 in the Supplemental Material). For the DSRS (status/power), we found that 51.44% of the total effect on participation in violence and 38.93% of the total effect on the RIS was significantly (ps < .001) mediated or confounded by the AOS3; again, the AOS3 did not significantly mediate or confound the total DSRS (status/power) effect on willingness to participate in violence (p = .540; see Table S61 in the Supplemental Material). Subsequent decomposition analyses indicated that the AOS3 did not significantly mediate the effects of risk taking in any of the other five domains (see Tables S62–S66 in the Supplemental Material). In Section S12 in the Supplemental Material, we also report an analysis of the Status-Driven Risk-Taking Scale, as an alternative to the SDO and DSRS, and an analysis of RWA. Altogether, the above estimates provide support for Hypothesis 2, with only slight differences compared with Study 2.
Discussion
Studies 1, 2, and 4 corroborated Hypothesis 1, suggesting that political violence across WEIRD and non-WEIRD populations relates to autocratic political orientations. Study 3 examined the boundary conditions of this association in another WEIRD sample and found that it is possible to push against the relationship between autocratic orientations and violence if the violence occurs to promote democracy. Still, even under these “most-likely” conditions for democrats to favor political violence, we found that autocrats were just as willing to engage in such violence. In addition, part of Study 3 (the list experiment) supported Hypothesis 1. Furthermore, Studies 2 through 4 supported Hypothesis 2, suggesting that the association between autocratic orientations and political violence, across WEIRD and non-WEIRD populations, reflects dominance. However, whereas Study 2 unequivocally supported Hypothesis 2, some analyses in Studies 3 and 4 only partly corroborated Hypothesis 2. In sum, the net evidence across the four studies provides unequivocal support for Hypothesis 1 and weaker but considerable support for Hypothesis 2.
In line with research on interpersonal aggression (Daly & Wilson, 1988), our findings also show that sex robustly relates to all outcomes, whereas age robustly predicts willingness to participate in and support for political violence but not actual participation. This suggests that although young individuals may be more prone to violence, they may not have opportunities to engage in it. Sex and age relate to dominance; hence, the fact that sex and age predicted political violence provides additional support for our overarching argument that political violence relates to dominance.
Concurring with existing psychological studies (Becker & Tausch, 2015), our results indicated that perceived injustice and political efficacy relate to political violence. In contrast to prior research, our results indicated that political efficacy positively predicts violence. In an analysis of WEIRD samples, Tausch et al. (2011) argued that low efficacy should predict violence. Low efficacy, according to Tausch et al., reflects powerlessness to effect political change through more conventional channels, for example, protest. Yet such conventional channels do not always exist in non-WEIRD settings, pointing to important differences between collective actions—and their predictors—in WEIRD and non-WEIRD contexts (see also Becker & Tausch, 2015, p. 77). Finally, our analyses indicated no or a weak association between SES and violence. This is striking given the prominent theoretical claims in the macro-level literature stressing the role of low income in rebel recruitment (Collier & Hoeffler, 2004).
Altogether, the findings point to two major implications. First, political violence is characterized by incompatibilities over political issues; hence, a comprehensive account of the psychology of political violence cannot exist without including the role of political orientations. Indeed, our analyses indicated that autocratic political orientation, as a predictor of political violence, outperformed most other variables emphasized in existing research, including SES, perceived group-based injustice, and political efficacy. Although there are some methodological concerns (see below), these results suggest that political orientations must be considered among the key explanatory factors for political violence in future research.
Second, individual differences in dominance—a major predictor of interpersonal aggression and intergroup hostility—also predict political violence. This finding underscores the importance of crossing the boundaries of research fields, particularly the integration of psychological research into the study of political violence, a subject primarily studied by political scientists and economists. We found the constructs of dominance (as a status-seeking strategy) and dominance orientations (as the preference for social hierarchies) to be central to our theorizing on political violence. To understand a pressing phenomenon such as political violence, it is essential to integrate psychological research into other social sciences.
Limitations
First, we opted for a research strategy based on survey data to prioritize external validity. Although this strategy is consistent with prior research on the associations of stable individual differences (e.g., personality traits and political ideology), it implies that we cannot buttress causal claims. Future studies are required to explore the possibilities of using experimental designs that allow for causal traction without compromising ethical standards.
Second, although we took care to gather data from culturally different contexts, these contexts are still limited to Africa, Northern Europe, and the United States. Thus, it is possible that the identified relationships will not hold under conditions in other regions. Exploratory analyses suggested that the association between political orientation and violence might be moderated under the conditions or recent history of high-intensity violence. This implies that autocratic orientations may not reliably predict participation in large-scale violence and, conversely, that the identified relationships are particularly likely to hold in the more peaceful conditions that exist in most WEIRD countries.
Finally, because Study 1 used existing cross-cultural survey data, we relied on an ad hoc measure of political orientations. This measure consisted of only three items and therefore had low reliability in some samples. Furthermore, because this measure has not yet been validated, it is possible that the scales used to measure autocratic orientation across Studies 1 through 4 capture several related constructs. More generally, there is currently no validated dominance scale beyond the individual and intergroup domains. There is thus a need to develop and validate a scale of dominance-driven status seeking in politics to examine the causes and consequences of such orientations. The present findings suggest that such a scale would constitute a—if not the—key predictor of disruptive political behavior in both WEIRD and non-WEIRD contexts.
Supplemental Material
Bartusevicius_OpenPracticesDisclosure_rev – Supplemental material for Dominance-Driven Autocratic Political Orientations Predict Political Violence in Western, Educated, Industrialized, Rich, and Democratic (WEIRD) and Non-WEIRD Samples
Supplemental material, Bartusevicius_OpenPracticesDisclosure_rev for Dominance-Driven Autocratic Political Orientations Predict Political Violence in Western, Educated, Industrialized, Rich, and Democratic (WEIRD) and Non-WEIRD Samples by Henrikas Bartusevičius, Florian van Leeuwen and Michael Bang Petersen in Psychological Science
Supplemental Material
Bartusevicius_Supplemental_Material_rev – Supplemental material for Dominance-Driven Autocratic Political Orientations Predict Political Violence in Western, Educated, Industrialized, Rich, and Democratic (WEIRD) and Non-WEIRD Samples
Supplemental material, Bartusevicius_Supplemental_Material_rev for Dominance-Driven Autocratic Political Orientations Predict Political Violence in Western, Educated, Industrialized, Rich, and Democratic (WEIRD) and Non-WEIRD Samples by Henrikas Bartusevičius, Florian van Leeuwen and Michael Bang Petersen in Psychological Science
Footnotes
Transparency
Action Editor: Leaf Van Boven
Editor: D. Stephen Lindsay
Author Contributions
All the authors developed the study concept, designed the research, collected and analyzed the data, and drafted the manuscript. All the authors approved the final manuscript for submission.
Notes
References
Supplementary Material
Please find the following supplemental material available below.
For Open Access articles published under a Creative Commons License, all supplemental material carries the same license as the article it is associated with.
For non-Open Access articles published, all supplemental material carries a non-exclusive license, and permission requests for re-use of supplemental material or any part of supplemental material shall be sent directly to the copyright owner as specified in the copyright notice associated with the article.