
Abstract
The purpose of this paper is to study the impact of road structure on traffic noise from an urban network planning perspective, to provide solutions to control and prevent traffic noise at source. The process is divided into three parts. Firstly, the stochastic user equilibrium model for traffic flow allocation is improved to be more accurate. Secondly, a global traffic noise simulation method is proposed for the network based on the noise prediction model, and the noise data is visualized. Finally, a noise evaluation system is established to study the traffic noise evolution patterns under different road structures. The results show that with the increase of network density, the traffic noise value of the network decreases. The layout of one-way roads will reduce the regional traffic noise value. The impact of road grade adjustments on traffic noise is positively correlated with the rate of change in road capacity. The study can provide an effective basis for control traffic noise from the network planning stage.
Introduction
Traffic noise pollution has become a globalized problem with the rapid development of traffic, Europe, India, China and others are facing serious noise pollution.1–4 Studies have shown that traffic noise can harm human health, such as causing sleep disorders, anxiety disorders, coronary heart disease and high blood pressure.5,6 Excluding health harms, traffic noise also generates huge economic losses, with costs of up to 7.8 billion RMB for traffic noise prevention and control in China by 2021. 7 Therefore, from the perspective of network planning, effective control of traffic noise and improvement of the living environment has become hot issue for current research. Evaluating the impact of urban network structures on traffic noise can provide a powerful reference for traffic noise control.
The influencing factors of traffic noise are rooted in road traffic flow and speed, however, the urban network as a carrier determines the distribution of flow and speed. Therefore, the structural characteristics of the network indirectly determine the distribution of traffic noise. The impact of road network structure on traffic noise is reflected at two levels: at the macro level, the functional layout of the city and the network hierarchy complete the spatial configuration of vehicles, which determines the traffic load on the road. At the micro level, the network spacing, road width, traffic organization and management strategies influence speed and traffic density. Hence, the rational layout of the network structure is of great significance to the control of traffic noise.
Scholars have done detailed studies on the impact of traffic noise at the macro and micro levels of network characteristics. At the micro level: Abdur-Rouf K 8 compared the noise changes when intersection types were converted through simulations and field measurements and found that signalised intersections generated more traffic noise than roundabouts. Lu 9 demonstrated through macro and micro traffic simulations that frequent acceleration and deceleration of vehicles at traffic signals would aggravate intersection noise pollution, while road width was positively correlated with traffic noise. Ju 10 also pointed out that with the increase of lanes will produce more noise pollution. However, other people came to the opposite conclusion. Liu 11 found that as the road width increases, the traffic density drops leading to a decrease in traffic noise when the road traffic flow is the same, which means that the road width is negatively correlated with traffic noise. Abdur-Rouf K 12 comparing intersections of different types and sizes, and find that two-lane roundabouts had lower traffic volume than the three-lane roundabouts but generated much higher traffic noise levels.
Further, at the macro level, many scholars have explored the relationship between urban network layout, urban morphology and traffic noise from the city-region scale. Margaritis 13 obtained the relationship between urban green cover and traffic noise distribution by correlation analysis. They found that traffic noise levels were low in cities with a higher urban green cover. Hao 14 gridded traffic noise and urban morphology indicators for analysis using bivariate and second-order regression methods to investigate the effect of urban morphology indicators on traffic noise. Hong 15 used local spatial regression to analyze the human perception of environmental noise and provide effective strategies for urban sound environment planning. Ryu 16 predicted traffic noise by building a statistical model and regressed noise levels on urban morphological indicators, pointed out that road area density, the proportion of industrial land, traffic volume, and traffic speed has a significant effects on noise levels. By studied urban morphology and traffic noise in Braga, Silva 17 indicated that the layout of urban buildings and streets has a significant impact on urban noise, which means that appropriate planning measures can reduce the impact of traffic noise. In addition, scholars have analyzed the influence of urban network structure on traffic noise from traffic noise maps,18,19 urban network data20,21 and urban points of interest 22 and crowd distribution characteristics23,24 to provide an effective reference for urban network planning considering the acoustic environment. Moreover, the urban landscape and building layout have an important influence on noise propagation attenuation. Studies have shown that noise levels are significantly lower in areas with high greenery coverage,13,25 and the construction and layout of buildings also affect the distribution of traffic noise.26,27
Scholars have done a lot of research on the influence of network structure at macro and micro levels on traffic noise. These confirm that there is a correlation between network structural characteristics and traffic noise, but there are still some shortcomings. Current studies mostly investigate the effects of different urban network morphological features on traffic noise and their correlation results. However, traffic characteristics have a great gap in different countries, cities, and network morphologies. It is difficult to determine whether differences in traffic noise are caused by network structure or traffic characteristics. Therefore, this paper studies the law of traffic noise evolution in the same region under different network structures from the perspective of urban network planning. The road network structure is the only variable, keeping the regional traffic demand and other conditions constant, to explore the noise impact of the network structure on traffic as well as to obtain quantitative results.
Methods
Overview of the methods
First, to improve the accuracy of traffic flow distribution in the network, the delay values generated by vehicles at intersections are added to the road impedance function to establish an improved stochastic user equilibrium model. Secondly, based on the specificity of traffic noise prediction in the road network planning stage, it is difficult to obtain various traffic flow parameters. Therefore, a univariate traffic noise prediction model in accordance with the network planning stage is established to simulate the global traffic noise data of the network and present the traffic noise in the form of spatial distribution. Finally, a traffic noise impact evaluation system is established to investigate the impact of different network structures on traffic noise.
Improved stochastic user equilibrium model
At road intersections, continuous traffic flow controlled by traffic signals can cause delays due to traffic interruptions. The delay value of a vehicle through a signalized intersection has three components: the deceleration delay resulting from the process of slowing down before entering the intersection or stopping at a red light, the stopping delay waiting for a green light to be released and the acceleration delay before exiting the intersection and reaching normal travel speed. For road sections, they contain both upstream and downstream intersections. At the upstream intersection, the delay value is the acceleration delay incurred when exiting the intersection. At the downstream intersection, the delay value is the deceleration delay and stopping delay on entering the intersection, shown in equation (1):

In practice, the assignment of traffic flows on the network will be influenced by traffic control measures, especially at road junctions. The traffic signal control or traffic yield rules will influence the route selection behaviour of travelers. In classical traffic flow assignment theory, the impedance function is mostly used in the American Highway Department BPR function,
28
shown in equation (2).

Its focus on the travel time of the section, but ignores the travel delays of the section. Therefore, the delay factor generated at the intersection is added to the impedance function. The expression for the road impedance function considering intersection delays is shown in equation (3).

The stochastic user equilibrium model
30
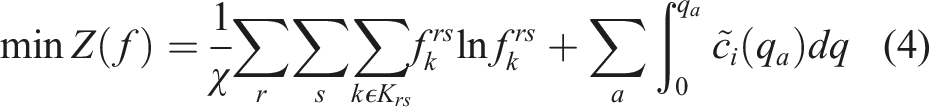
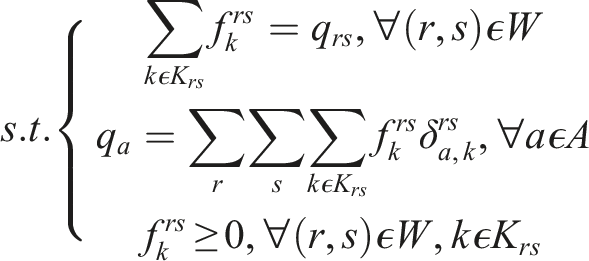
(SUE) is widely used as a classical model for traffic flow allocation. Improved SUE model to establish the SUE model considering the delay, shown in equation (4).
Traffic noise simulation of networks
Accurate prediction of traffic noise is the basis for traffic noise control and research. Simulating traffic noise on the network and presenting the traffic noise data graphically as a noise distribution map provides a more intuitive view of the noise distribution.
It is difficult to accurately obtain the traffic flow parameters required for traffic noise prediction in the network planning stage, therefore a univariate traffic noise prediction model based on traffic flow is established. The relationship between traffic flow and vehicle speed is established based on the Van Aerde macroscopic traffic flow model, which reduces the input parameters in the prediction model by replacing the speed variable with the flow variable, shown in equation (5), the accuracy and applicability of the model have been proved.20,22 Receiving point noise calculation.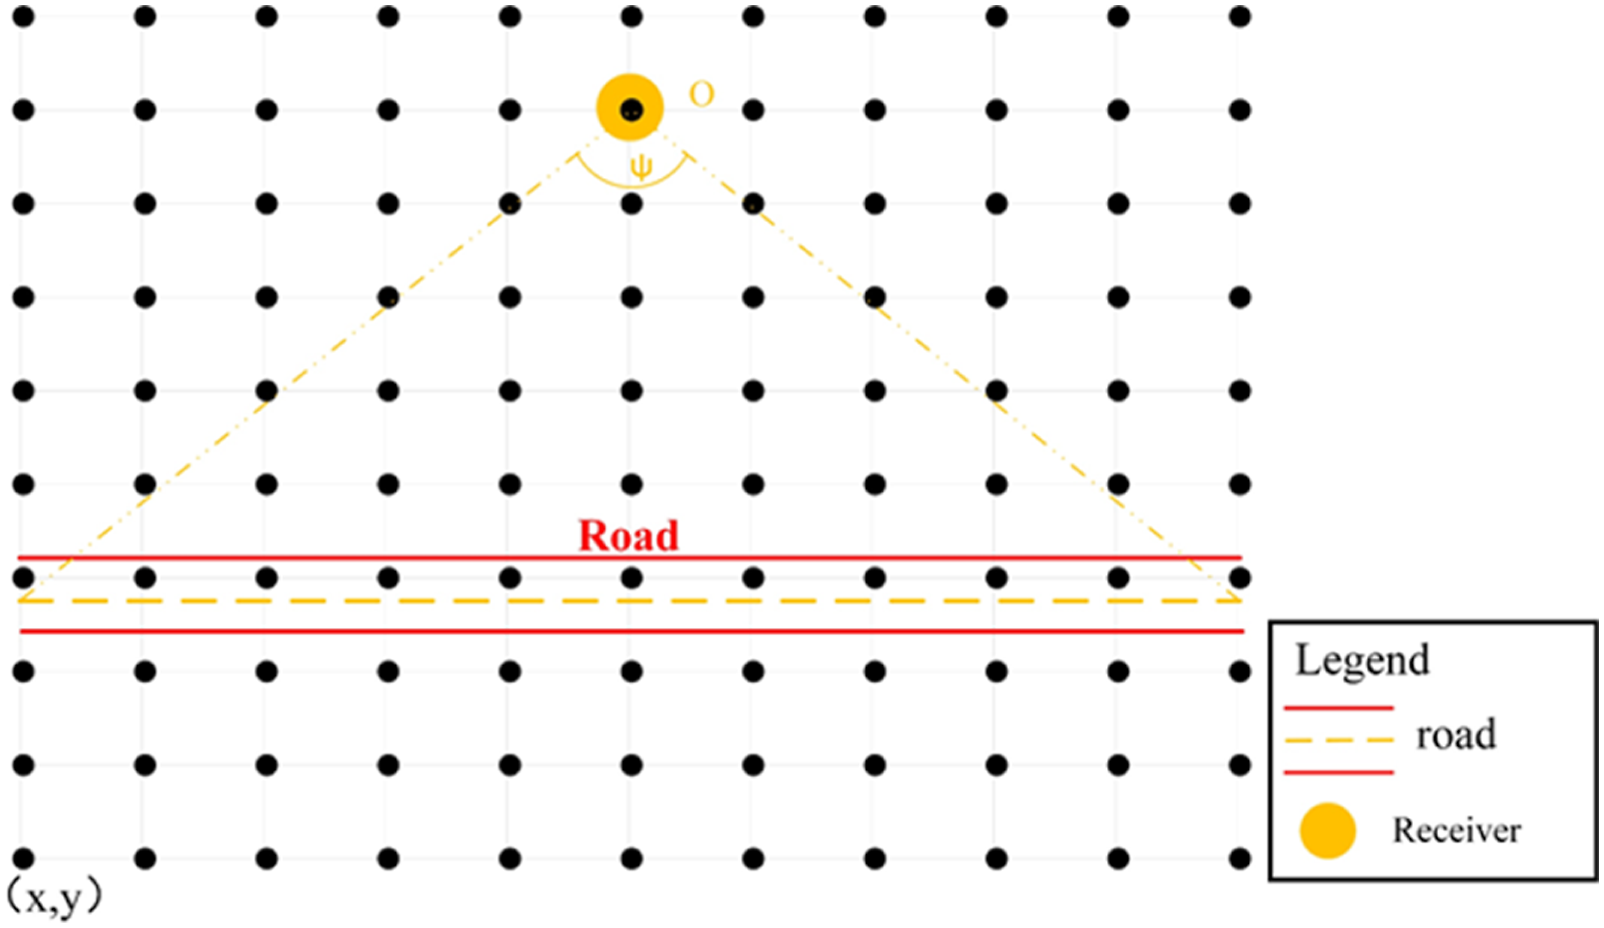

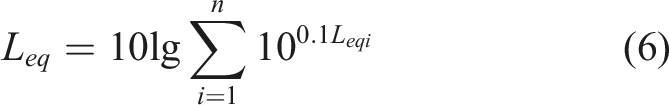
As the region may be affected by multiple road noise sources, the noise impact of each road on the receiving point is calculated separately and then the control point noise value is obtained by the principle of energy superposition, shown in equation (6).
Based on a univariate noise prediction model, the traffic noise of the network is simulated. The network is divided into a grid to set noise receiving points at the nodes. The noise at each noise reception point is calculated separately to obtain network noise data, as shown in Figure 1. Subsequently, the noise data is processed using the Kriging interpolation method to obtain a traffic noise map of the network for a more intuitive view of the noise distribution.
Noise evaluation system
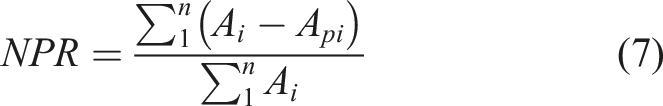
The Noise pollution Rate (NPR) is the ratio of the area where the noise value exceeds the standard value, shown in equation (7). Import the noise data into the geographic information software Surfer, the spatial distribution of noise in network areas is drawn, and the area lower than the noise standard value of i-th sound functional area (
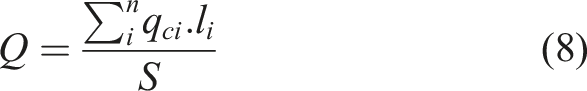
Capacity per unit area: It is the ratio of the capacity multiplied by the length of the road to the area of a certain region, which reflects the regional road grade and the density of road distribution, shown in equation (8)
Rate of change in capacity per unit area: indicates the change in capacity per unit area in the same area under different road network conditions, shown in equation (9).

Case study
Description of the scenario
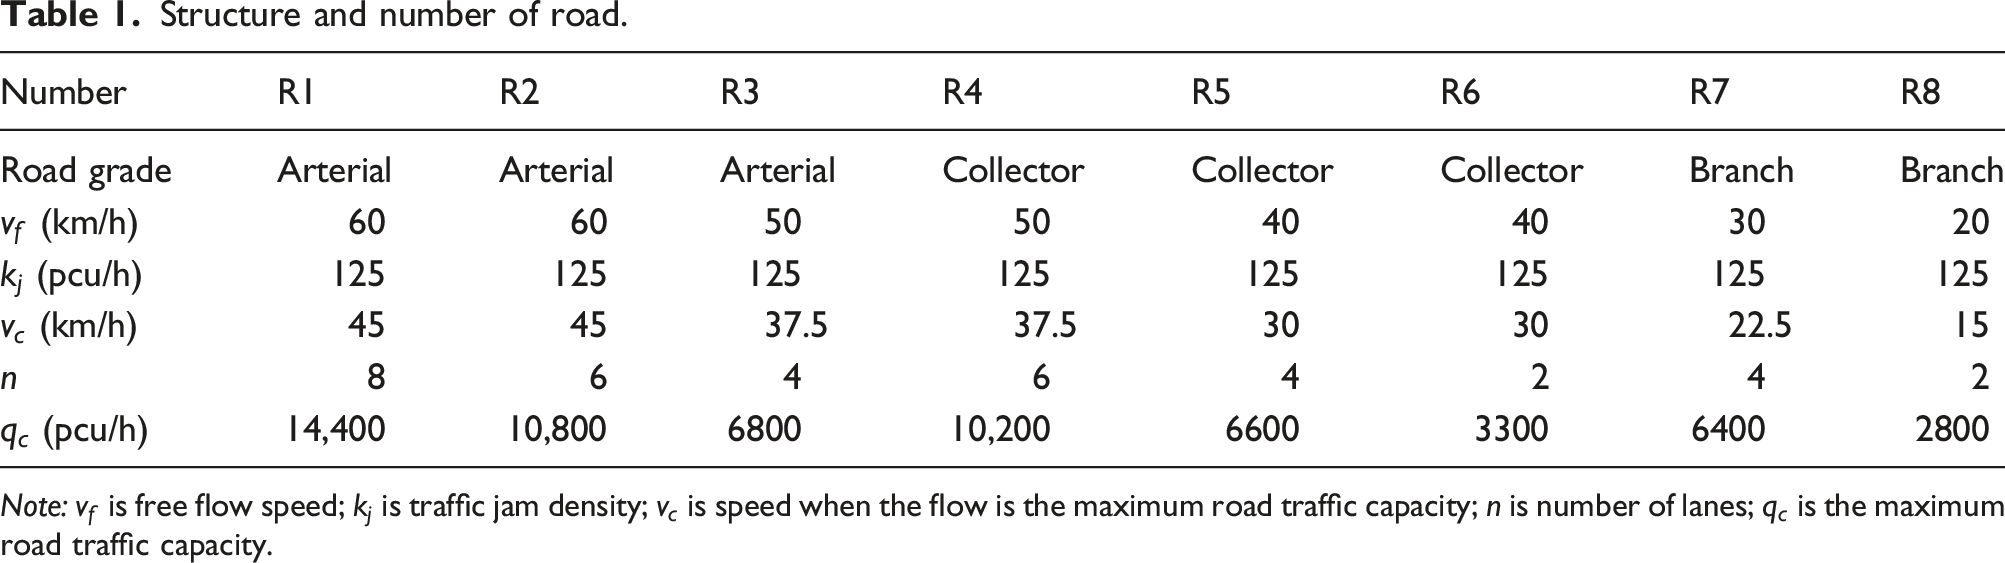
The typical network is selected as the research object, the network as shown in Figure 2, according to the code for the design of urban road engineering CJJ37-2012
29
and the actual situation of the network, the arterial road, collector road, branch road three-level road numbering is shown in Table 1, where the representing method of road attributes is: section number, road structure number, and section length. Case network structure. Structure and number of road. Note: 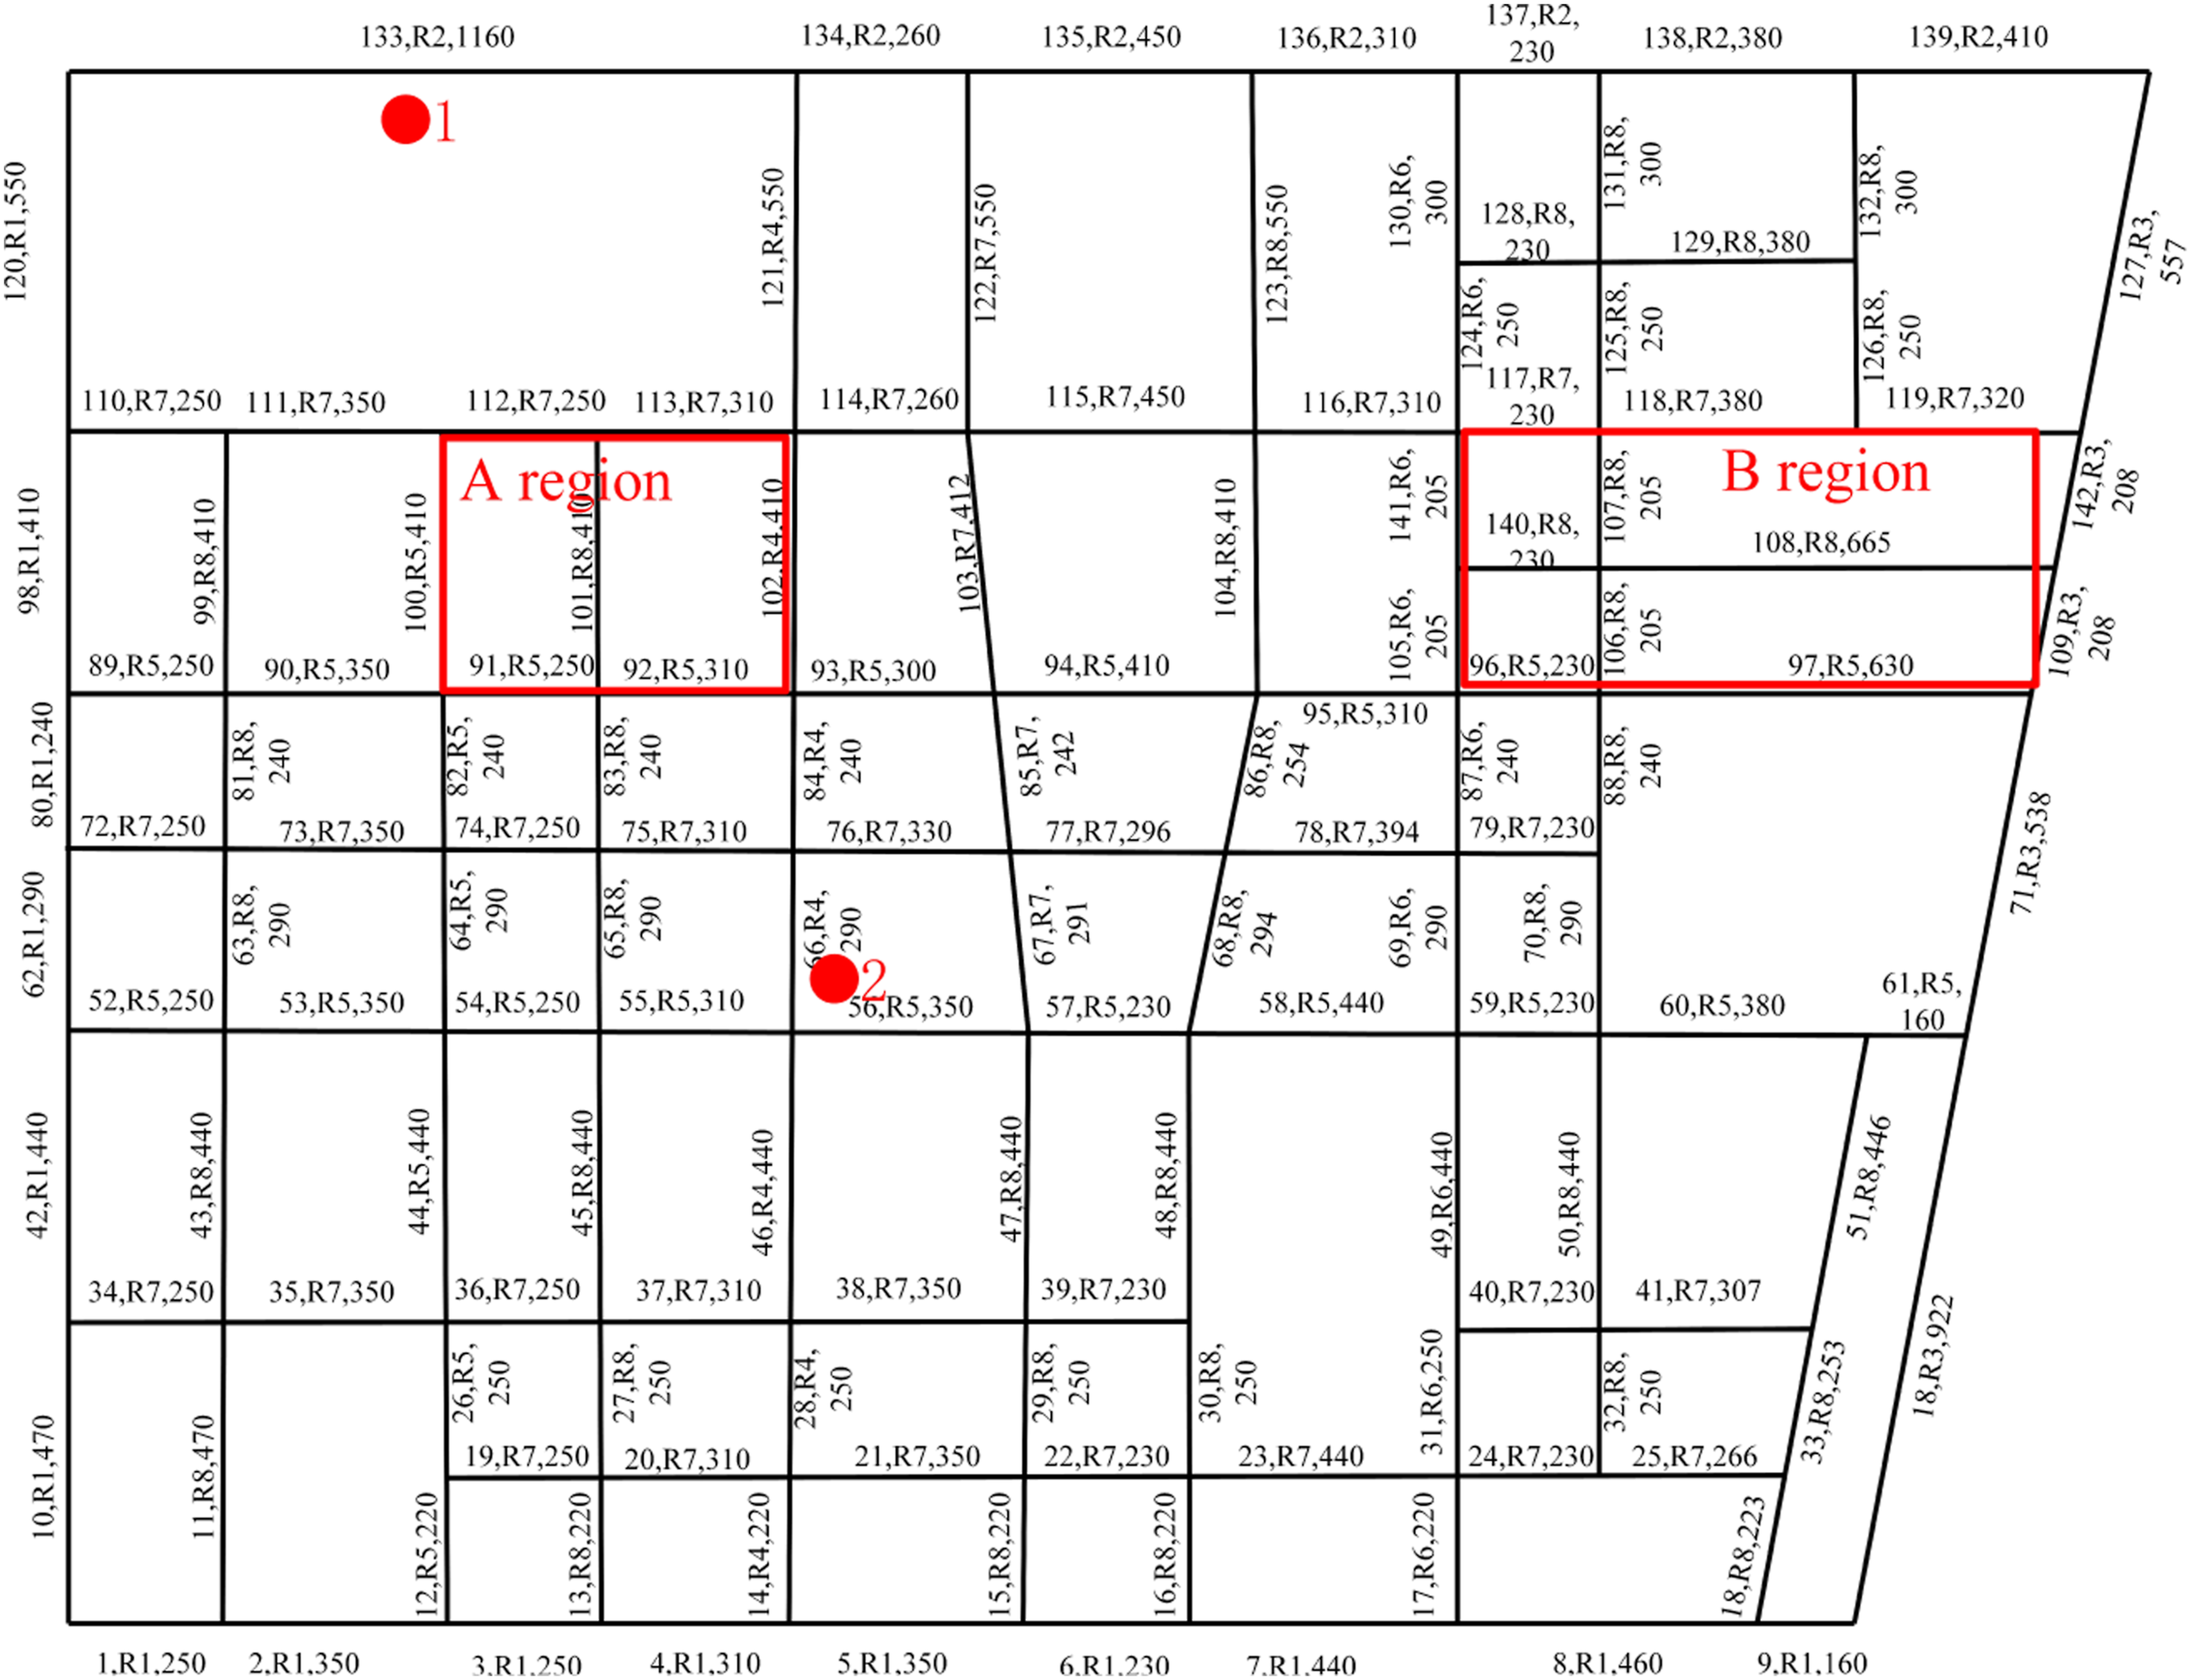
Based on the improved SUE model and the univariate traffic noise prediction model, the noise-receiving points are positioned in 5 m steps. The noise value at each noise-receiving point was calculated according to equation (5) and Figure 1. Subsequently, Kriging interpolation was used to present the traffic noise data in the form of a spatial distribution as shown in Figure 3. Case network noise distribution.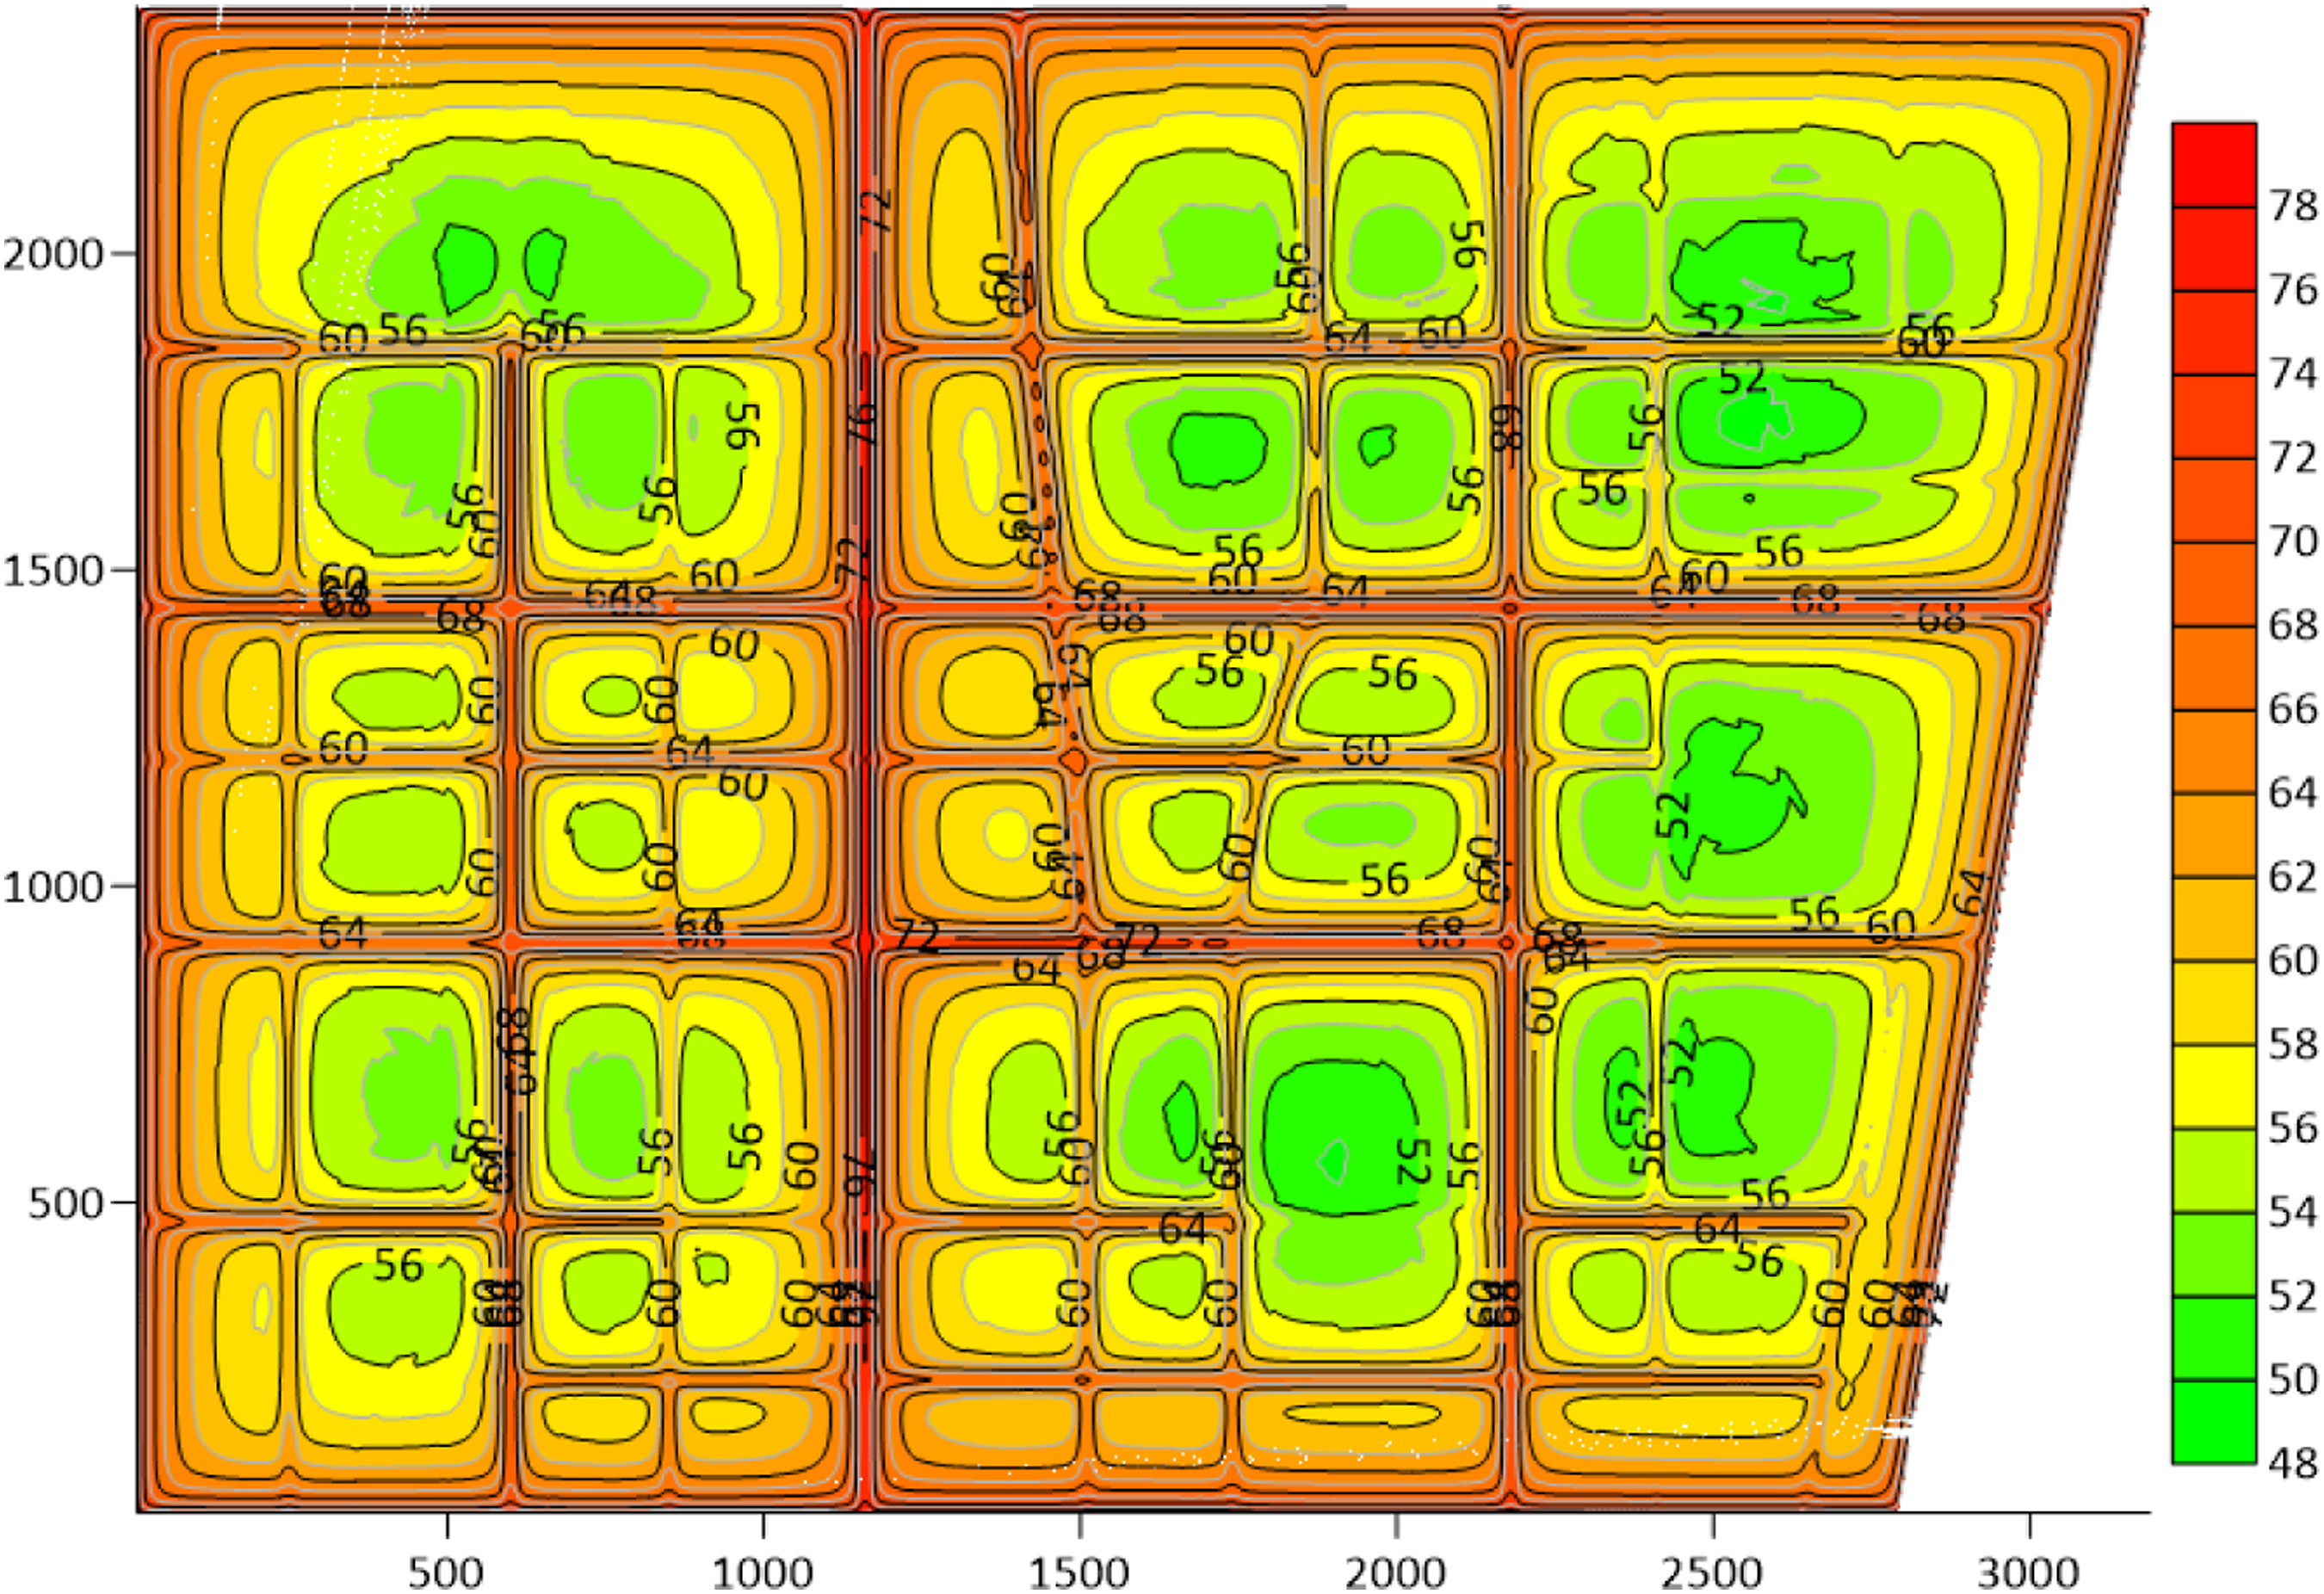
Impact of network density on traffic noise
The density of the network determines the accessibility of the city. The concept of “small neighborhoods and dense networks” was proposed in China. This requires an increase in the average urban network density to 8 km/km2, a road area ratio of 15% and urban road spacing of less than 300 m. Therefore, it is of great significance to study the impact of different urban network densities on traffic noise to improve the quality of the traffic sound environment from an urban planning perspective.
Network density is the ratio of the total mileage of the road network to the area of the region, in this paper, network density is 6.5 km/km2 in the case network. However, the road network density only reflects the road length but ignores the road space information. Therefore, to ensure that the network density is the only variable and keep the road area of the network constant, with a gradient of 1 km/km2, four groups of comparison networks with network densities of 4.5 km/km2, 5.5 km/km2, 7.5 km/km2 and 8.5 km/km2 were set up to study the laws of traffic noise at different network densities, as shown in Figure 4. Comparative network structures. (a) 4.5 km/km2 network. (b) 8.5 km/km2 network.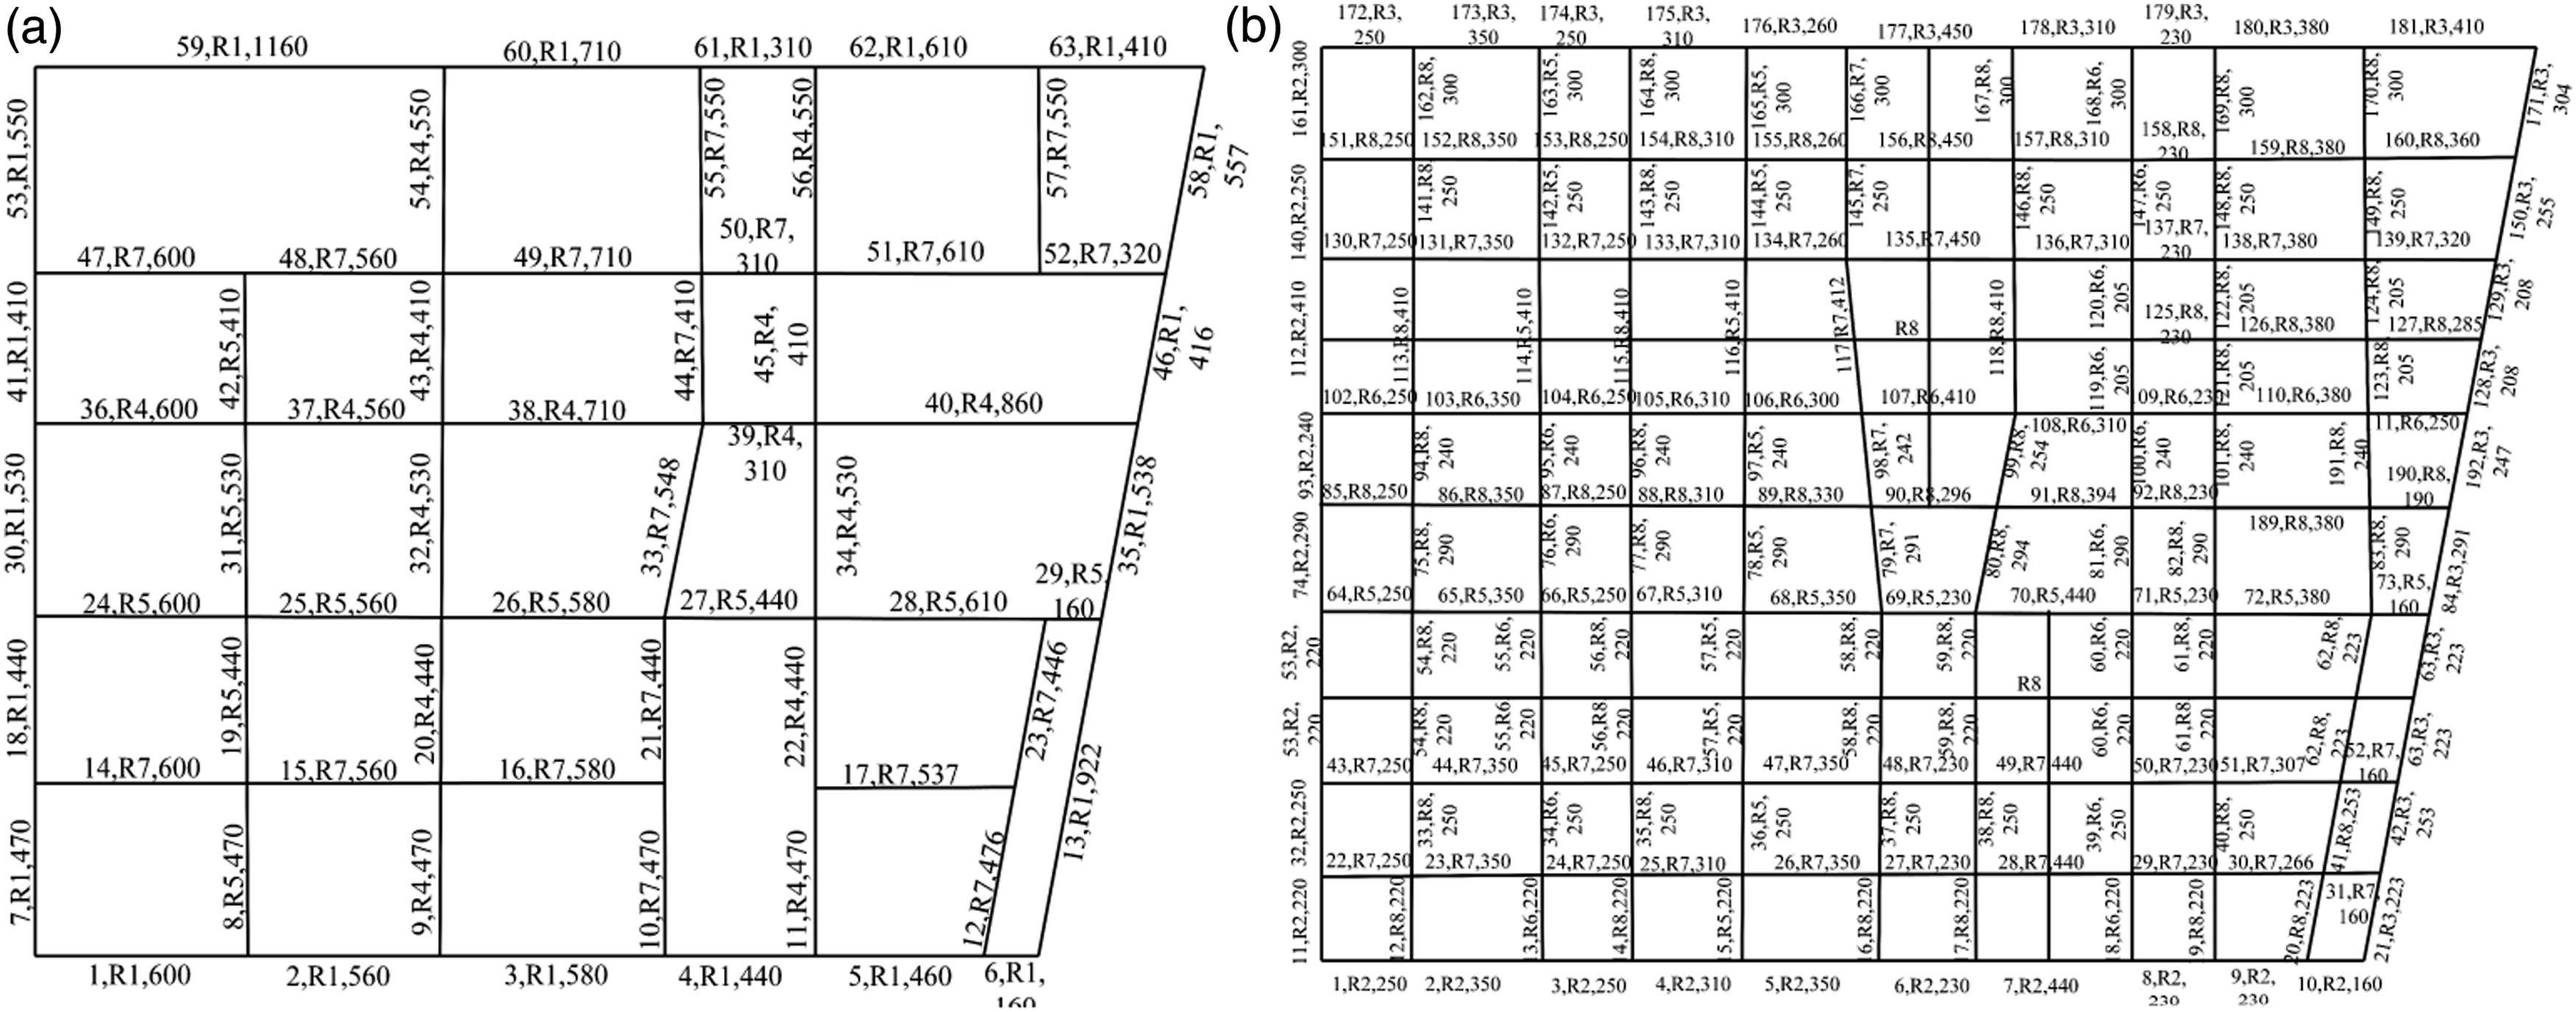
The improved SUE model and univariate traffic noise prediction model were adopted to obtain the distribution of traffic noise under different network densities while keeping the total traffic demand of the network constant. According to the Sound Environment Quality Standard (GB 3096-2008)
31
and the actual situation of the network, the region is a mixed commercial, residential and industrial area, in which the noise daytime limit is 60 dB. The changes in average traffic noise and NPR for different network densities are shown in Figure 5, noise and NPR decrease as the density of the network increases. The impact of changes in network density on traffic noise is greater when the network density is low. In turn, the impact decreases as the network density increases. The traffic noise and NPR change rates increase by 2.7% and 32% respectively when the network density decreases from 6.5 km/km2 to 4.5 km/km2, and decrease by 0.5% and 13.87% respectively when the network density increases from 6.5 km/km2 to 8.5 km/km2. Trends in 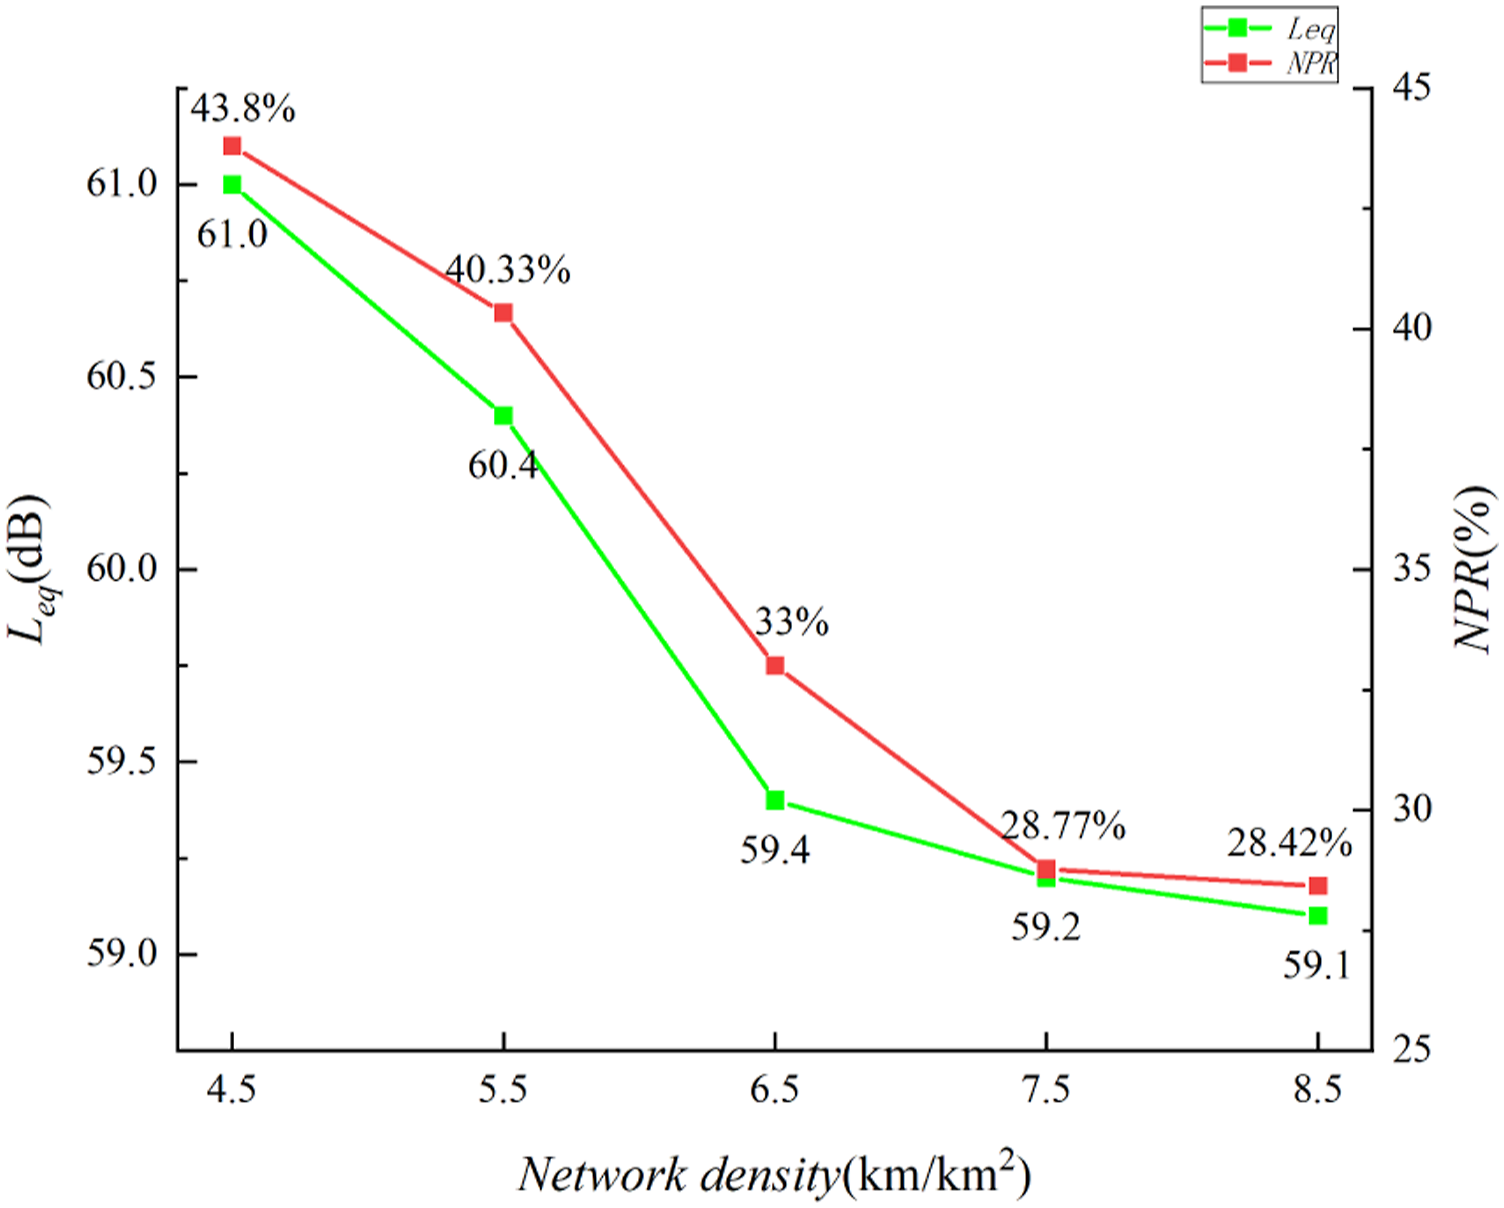
Take the comparison network A (4.5 km/km2), B (8.5 km/km2) as an example to analyze the traffic noise evolution law when the network density changes. Compare with the original network noise data, network A and B noise evolution is shown in Figure 6. Network noise change distribution. (a) Network A noise change. (b) Network B noise change.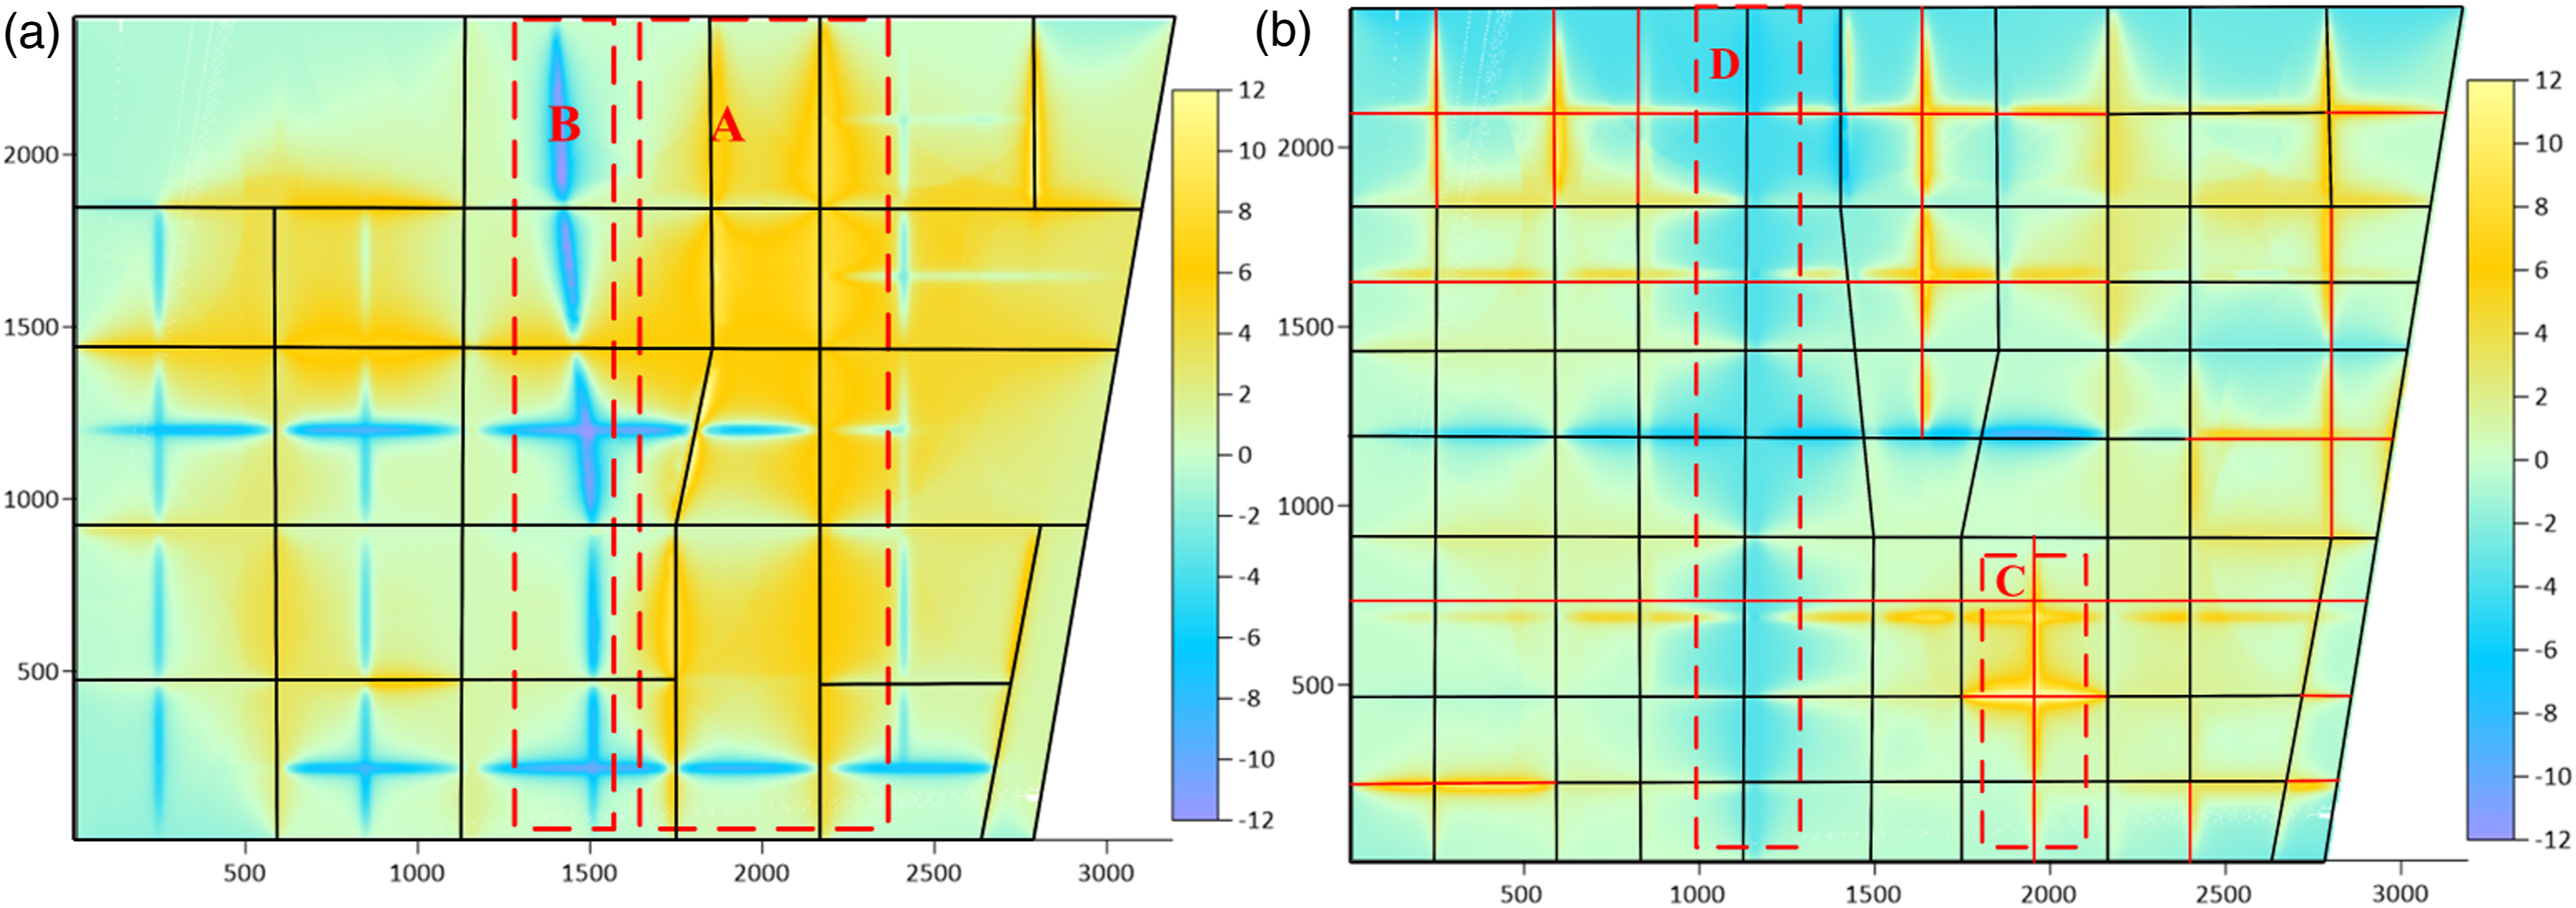
In Figure 6(a), when the network density decreases from 6.5 km/km2 to 4.5 km/km2, the noise increases in most regions of the network, but also decreases in some regions, with the average noise of the whole network increasing from 59.4 dB to 61.0 dB. In Figure 6(b), when the network density increases from 6.5 km/km2 to 8.5 km/km2, the average noise of the whole network noise decreases from 59.4 dB to 59.1 dB. A typical region is selected for noise analysis. In regions A and C, the noise of the network increases 3.9 dB and 2.4 dB respectively. In region A, due to the reduced density of the network, the number of roads decreases, which means that the accessibility of the network is diminished. Therefore, the road in region A will undertake more traffic flow resulting in increased noise. At the same time, the region close to the road will be exposed to greater noise pollution. In region C, noise increase around the additional roads due to the increased density of the network breaking up the original road layout. In contrast, the noise decreases by 1.1 dB and 2.6 dB for regions B and D, respectively. The loss of the original network roads in region B leads to a reduction in noise. In region D, due to the increase of network density, there are more alternative routes for the network traffic flows. As a result, the road flows are dispersed leading to a reduction in traffic noise. At the same time, it is found in Figure 4 that changes in the density of the network will not only affect traffic noise at road changes, but will also have an impact on other regional noise.
Control points are selected in the network to analyze the traffic noise evolution at different network densities. Control point 1 is located in the open zone of the road network, the noise value is mainly affected by the adjacent roads. Control point 2 is located at the intersection of the central zone of the network and the noise values are influenced by a number of roads in the surrounding region. The locations of control points 1 and 2 are shown in Figure 2. Noise and traffic flow evolution at control points are shown in Figure 7. Trends in noise and flow. (a) Point 1. (b) Point 2.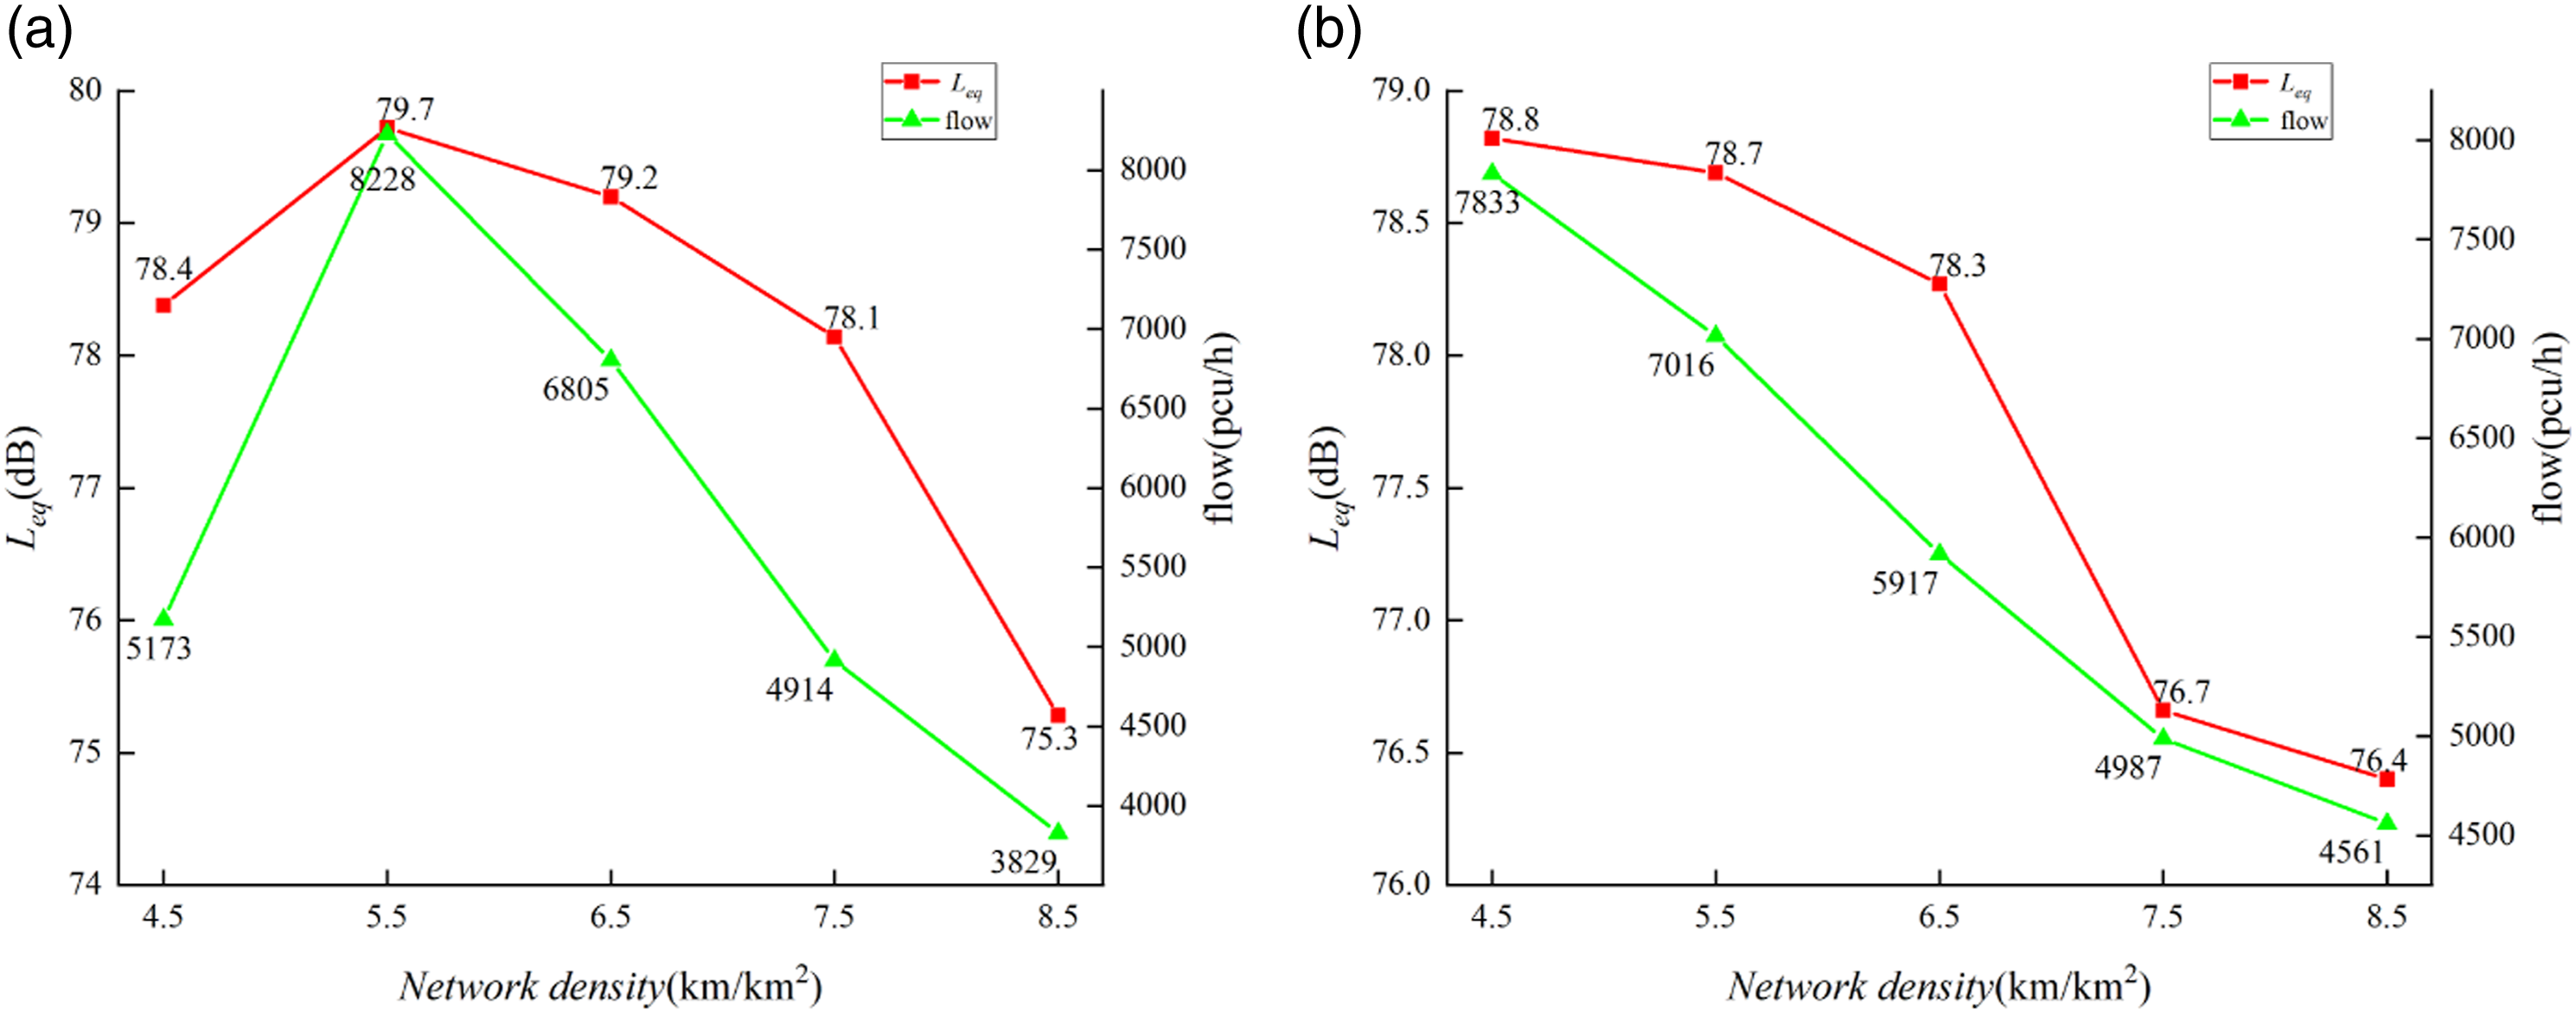
As the density of the network increases, the traffic noise at the control points tends to decrease. However, at point 1, when the network density is 5.5 km/km2, the maximum noise is 79.7 dB, and the noise increases rather than decreases. Analysis of road flow and speed showed that traffic noise was significantly and positively correlated with road flow and speed, with correlation coefficients of 0.85 and 0.48 respectively. Therefore, the increased density of the network allows for more alternative paths for traffic flows, and the dispersion of flows is the main reason for the noise reduction.
Typical residential zones A and B of the network were selected for noise analysis, the zones A and B are shown in Figure 2. The noise and NPR of the zones are calculated separately as shown in Figure 8. As the network density increases, the zone noise and NPR tend to decrease. However, when the network density increases to a specific value, there is a tendency for the zone noise to increase, which could be a direction for subsequent research. When the network density increases excessively, the zone will be exposed to more noise pollution from surrounding traffic noise sources, which is the main reason for the increase in zone noise. Zones noise trends. (a) Zone A. (b) Zone B.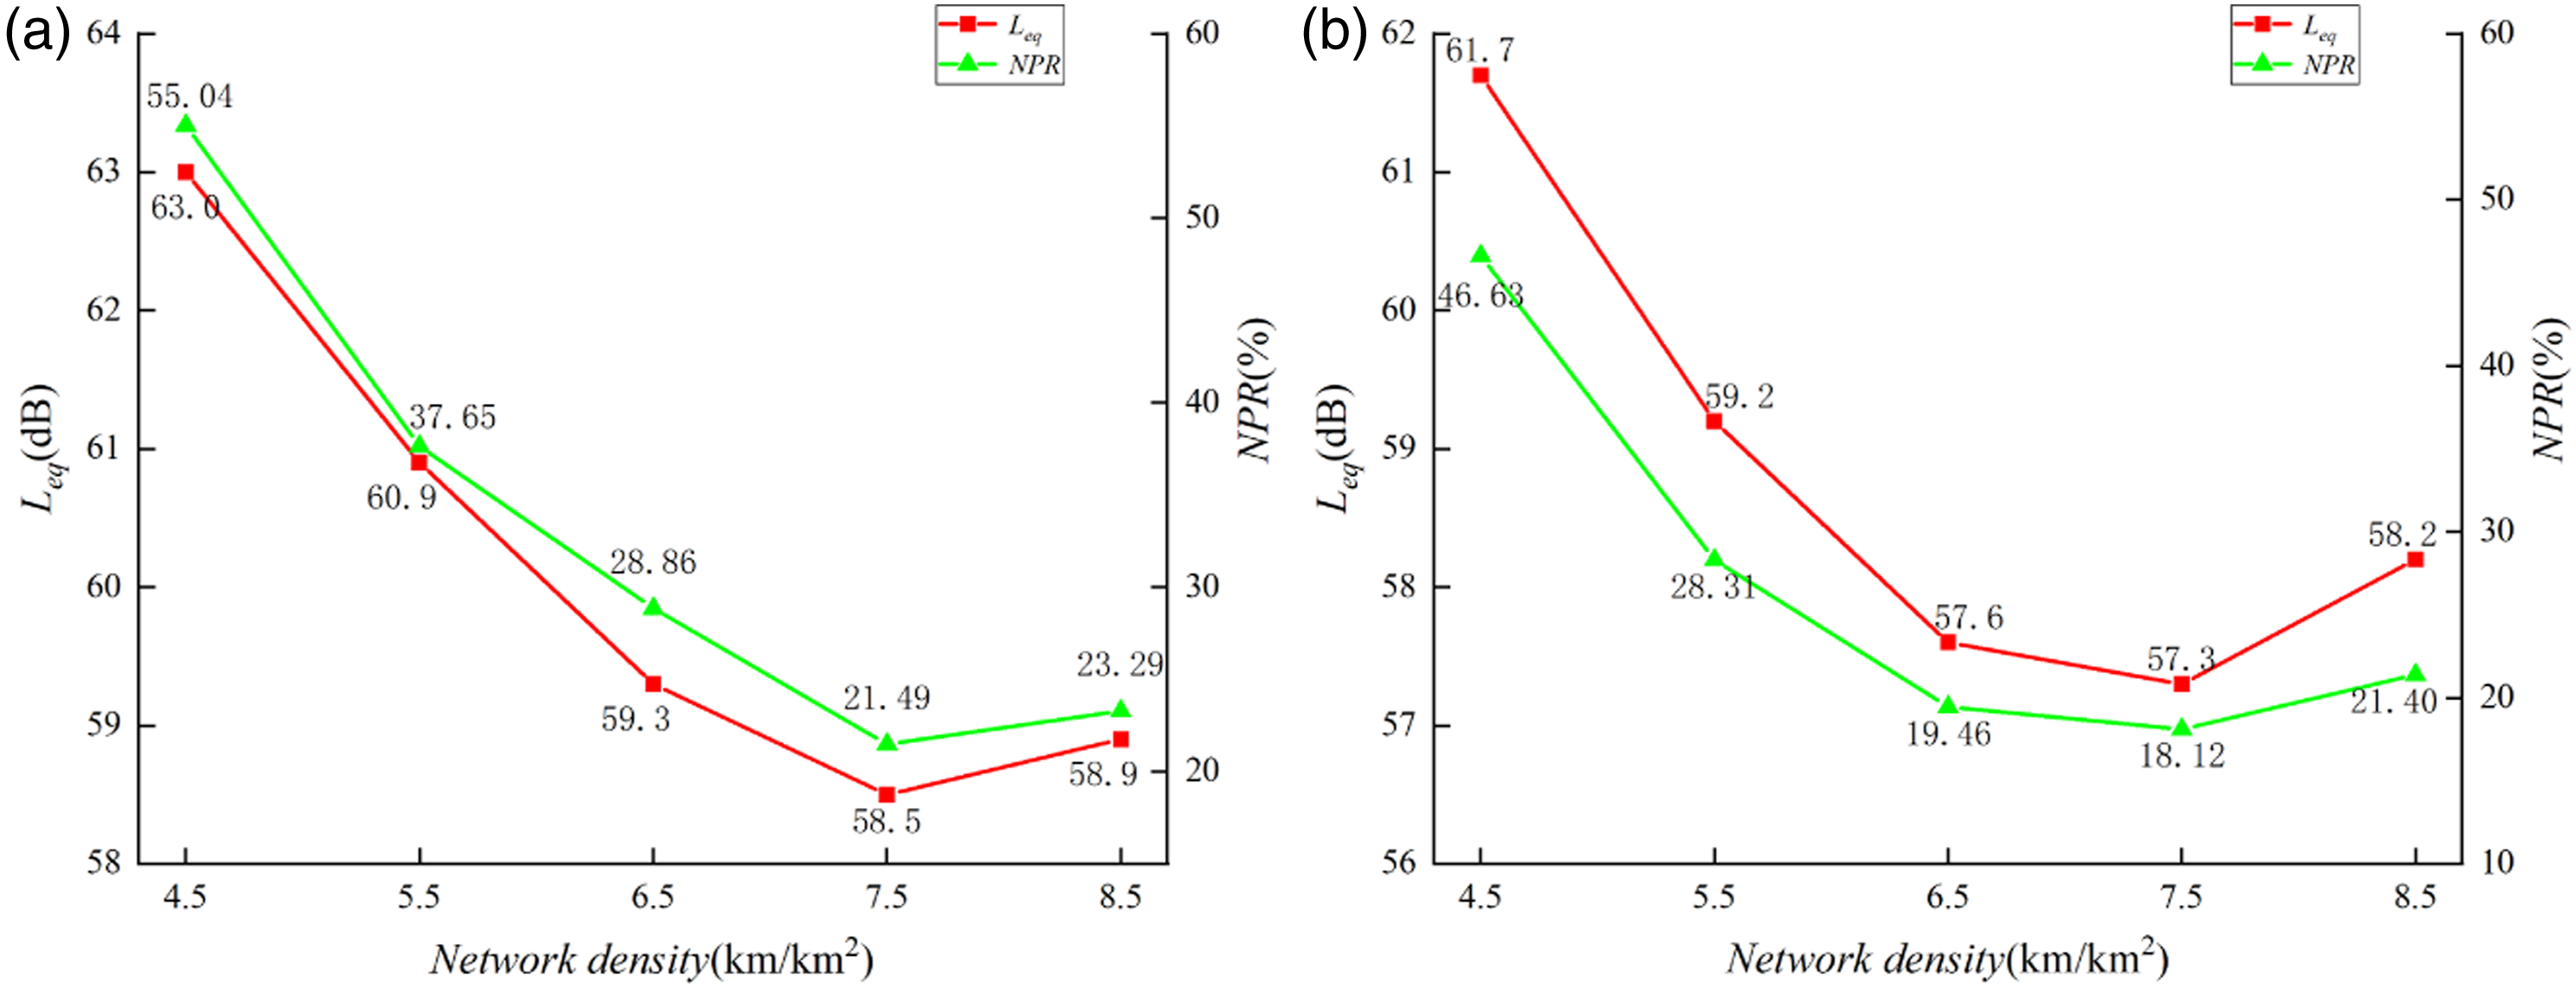
Traffic noise impact from road attributes
The density and spatial layout of the urban network determine the spatial distribution of traffic flow on a macro level, while the attributes of urban roads determine the traffic flow and speed on a micro level, these factors will directly determine the traffic noise. Therefore, this section studies the impact of urban road attributes on traffic noise at a micro level.
Impact of a one-way road on regional traffic noise
To study the effect of one-way roads on traffic noise, a total of three one-way roads were set up in the network, as shown in Figure 9. One-way road one is set up in a north-south direction, with the original road class as a branch road and low traffic flows. Therefore, when a one-way road is set up, the original north-to-south traffic flow can be replaced by parallel roads on both sides. One-way roads two and three are set up to run north-to-south and south-to-north respectively. A comparison with the original network was made to explore the impact of the setting up of one-way roads on regional noise. Subsequently, analysis of noise evolution in zones A and B and six control points. One-way road network.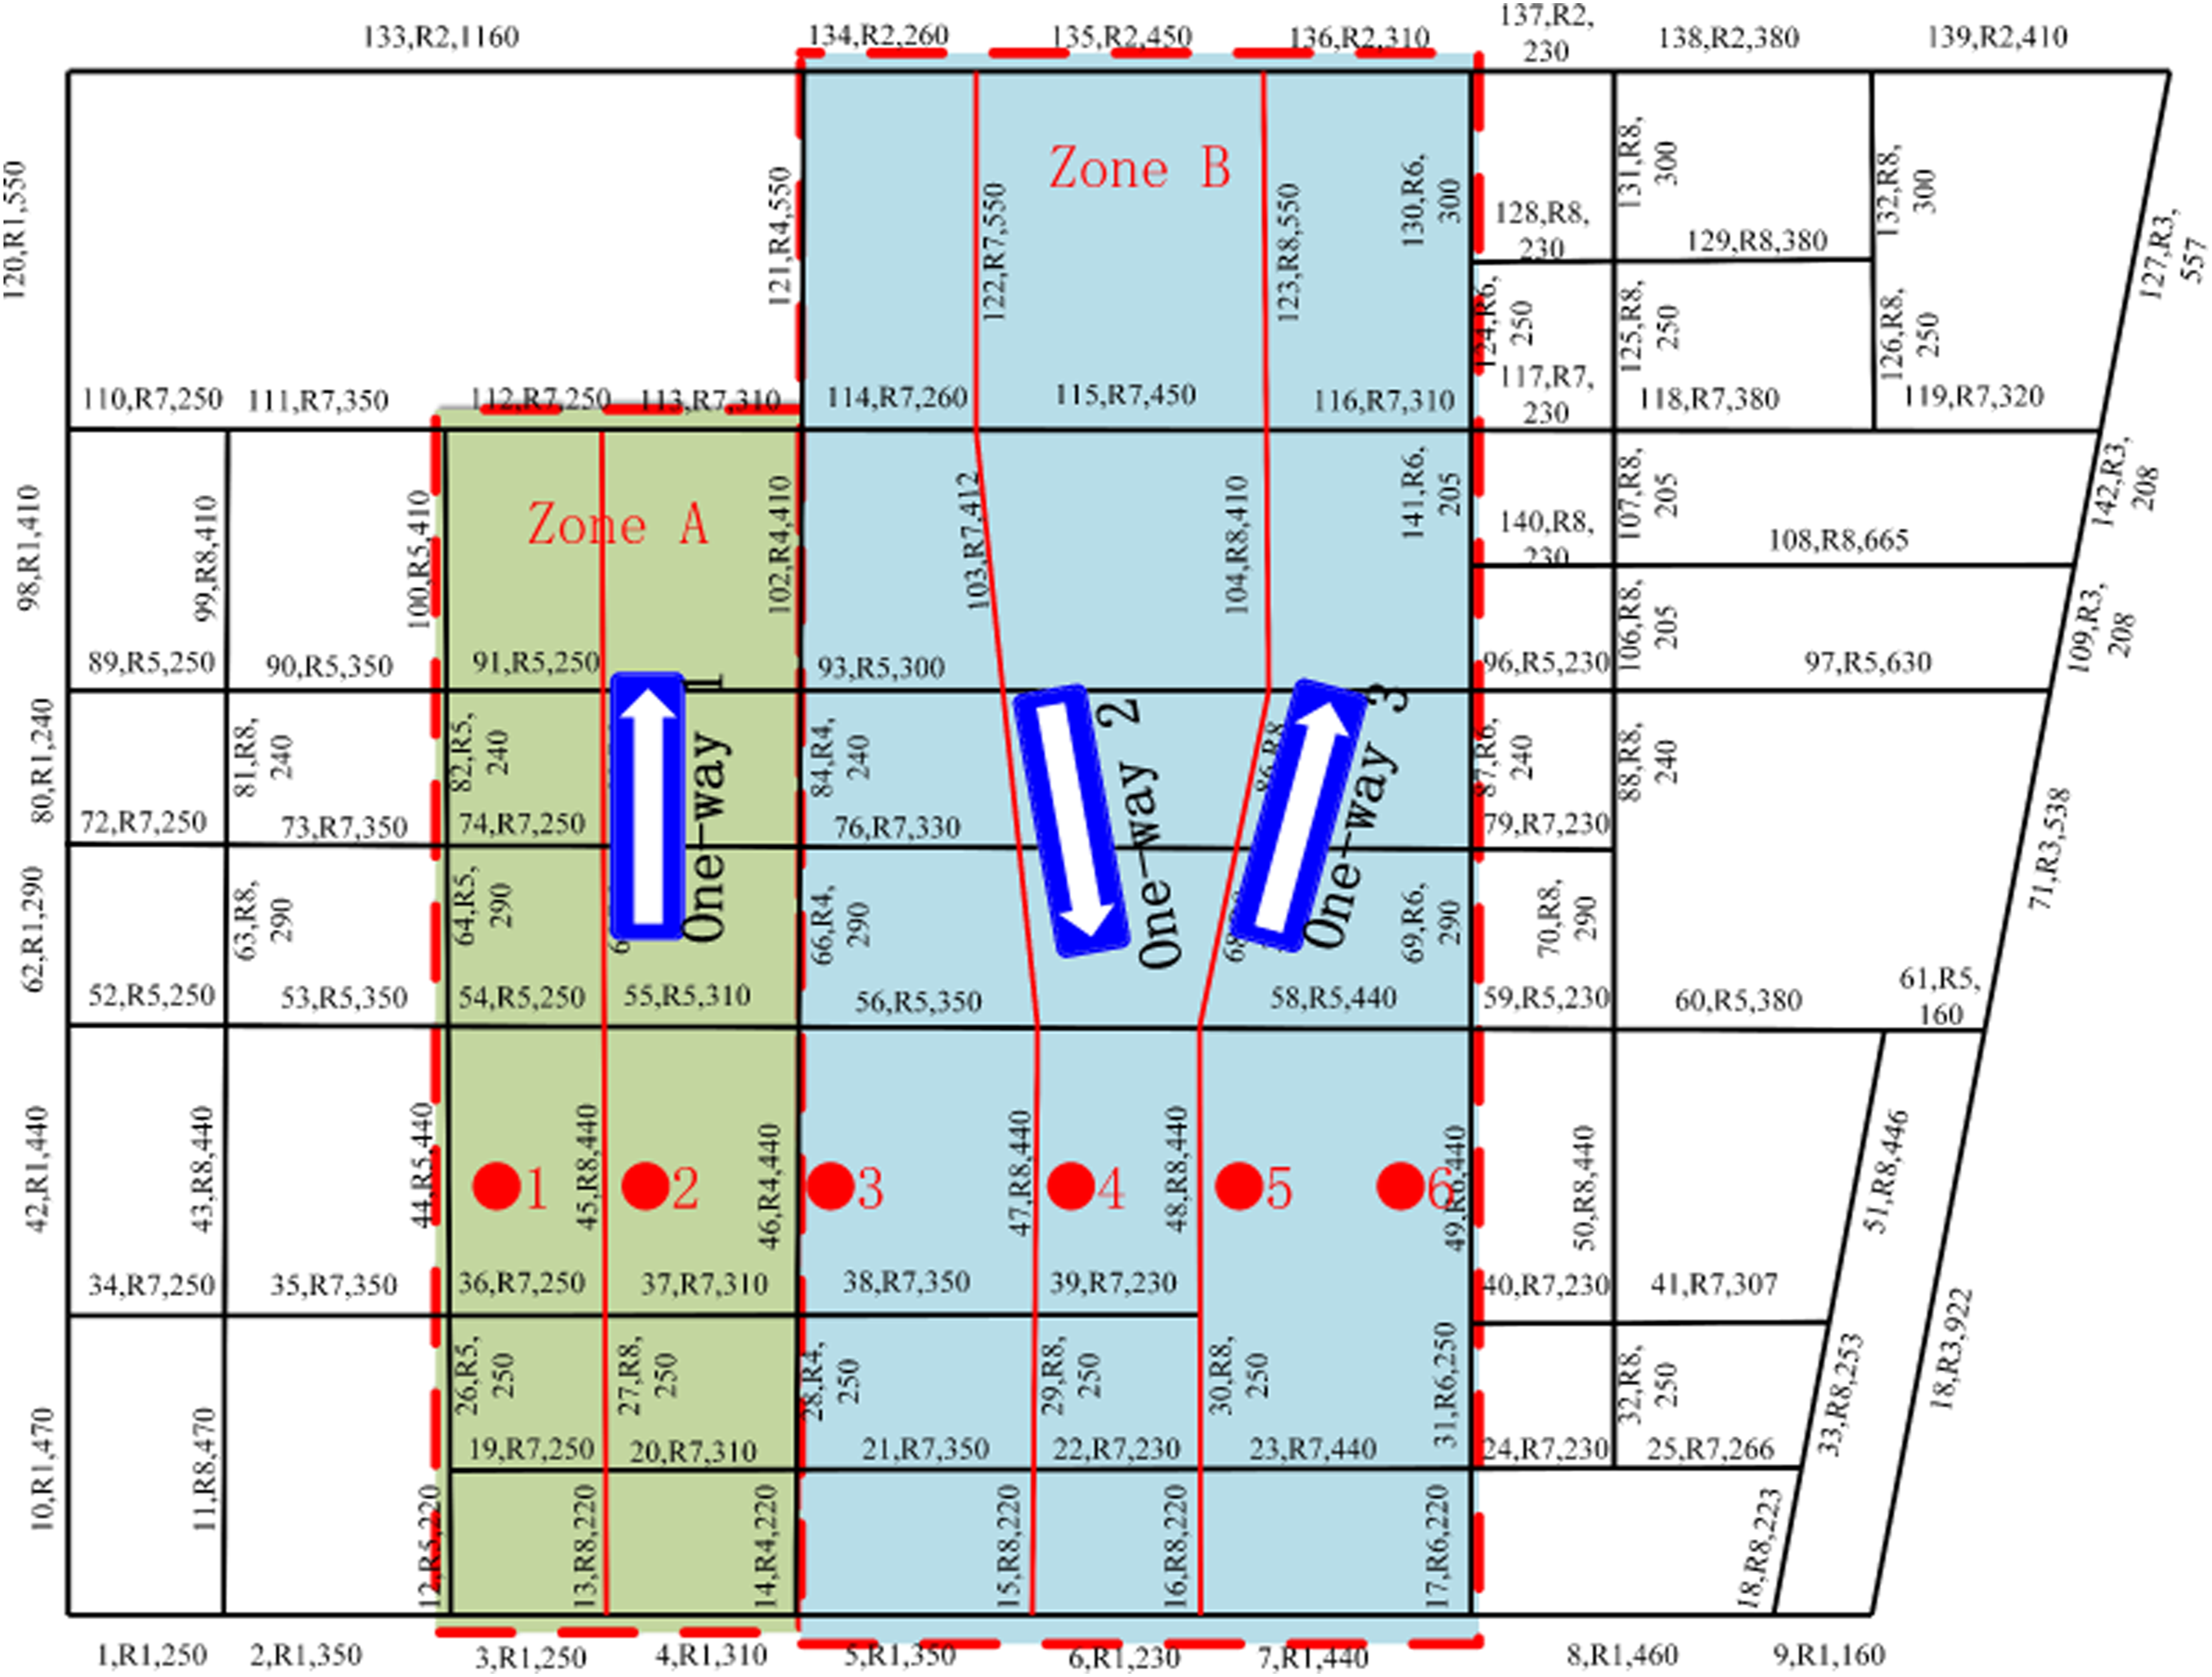
Changes in regional noise indicators.
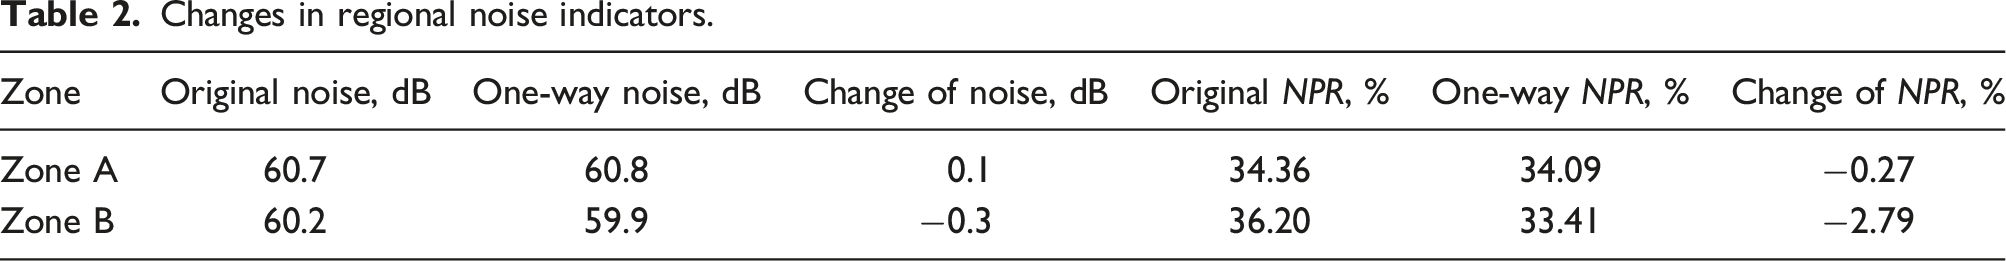
Six control points were selected in the zone at a distance of 7.5 m from the road, with control points 2, 4, and 5 located beside the one-way road. Compared with the original network, the evolution of noise at the control points is shown in Figure 10. The noise levels at control points 2, 4, and 5, which are located beside the one-way road, were significantly reduced by 2.0 dB, 1.6 dB and 1.7 dB respectively. The other three control points show a slight increase in noise, with a maximum value of only 0.3 dB. Noise comparison at control points.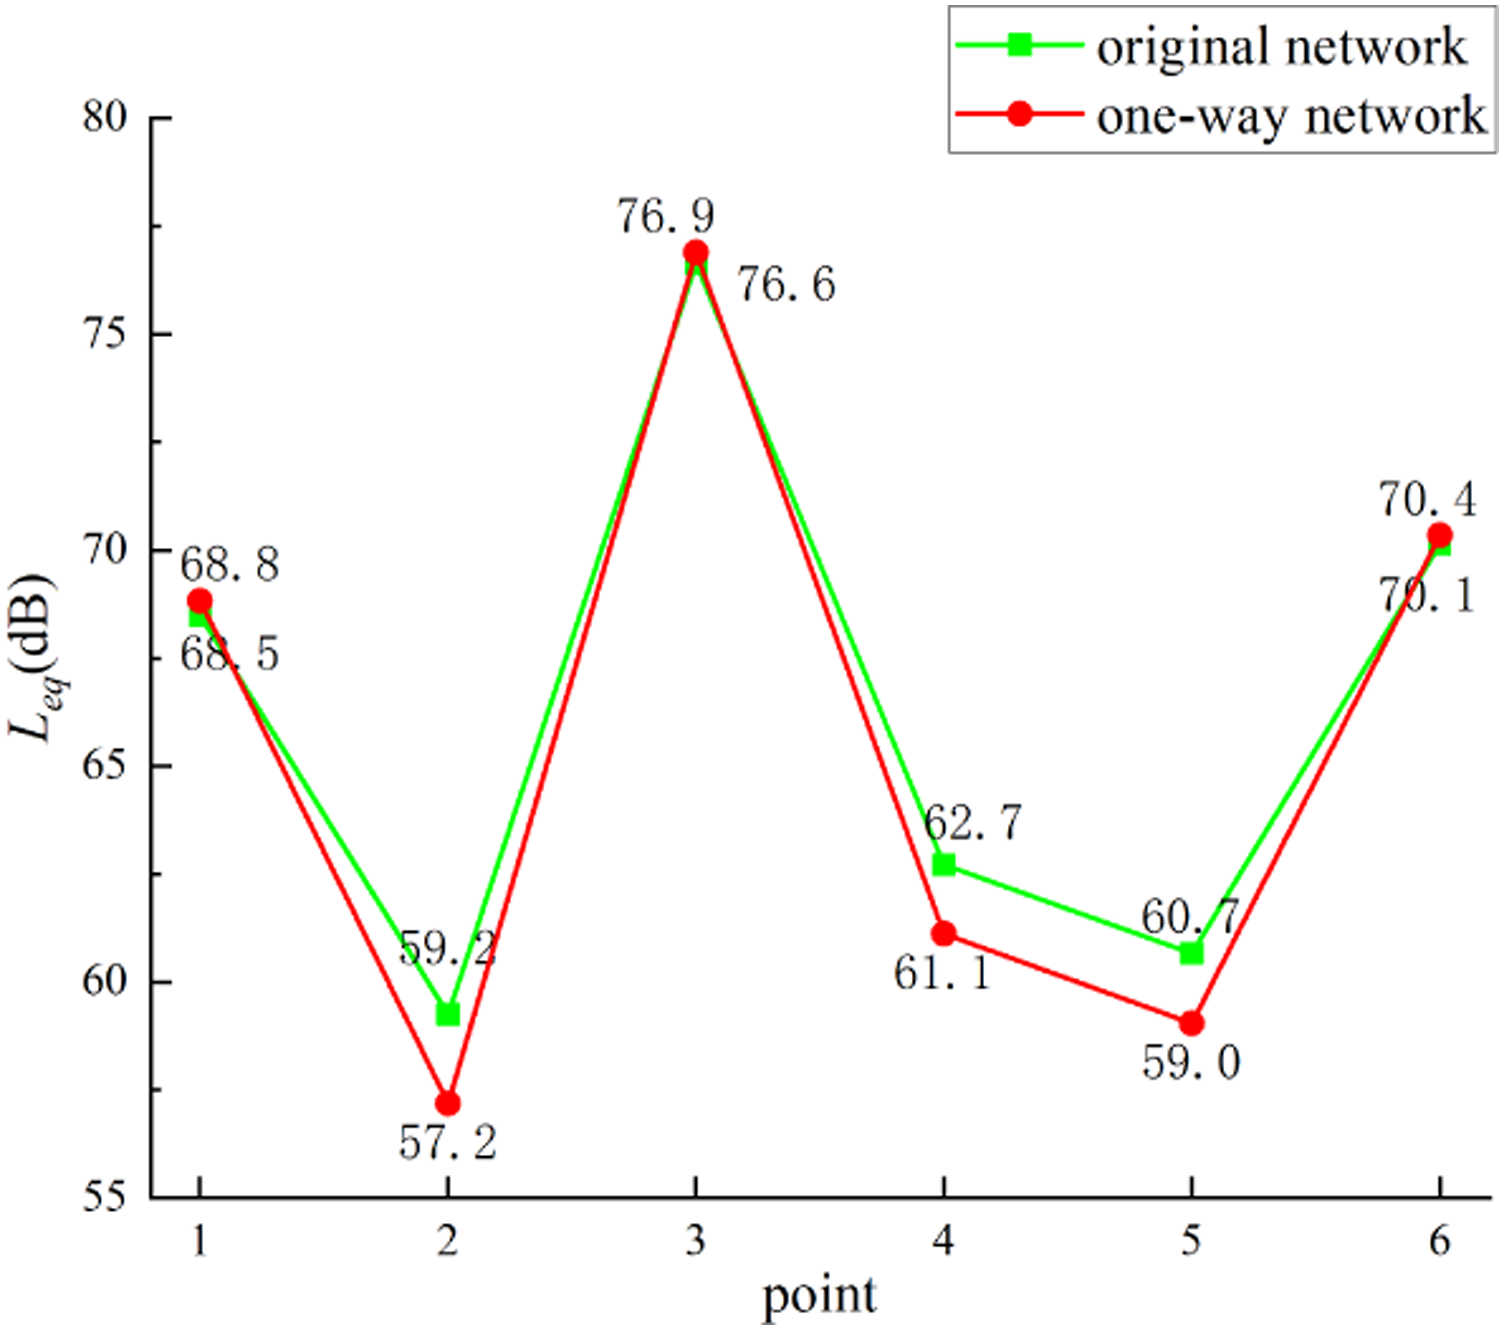
The setting up of one-way roads results in a significant reduction in noise levels in the zones on either side of the one-way road and a small increase in noise levels in other zones, which results in a reduction in overall noise levels and NPR in the zone. Therefore, the layout of one-way roads can be an effective means of controlling traffic noise in the region.
Impact of road grade adjustments on traffic noise
To improve the efficiency of the network by adjusting the road grade according to the actual road service level (v/c) of the case network. The network road grade changes and noise control point settings are shown in Figure 11. Blue roads mean downgrade of road grade, red roads mean upgrade of road grade. Roads as a carrier of traffic flow, road grade changes will affect the state of the network traffic flow, which in turn affects the traffic noise. To evaluate the effect of road grade change on traffic noise, two control points were selected beside each road. The evolution of noise at each control point is calculated. Road grade adjustment.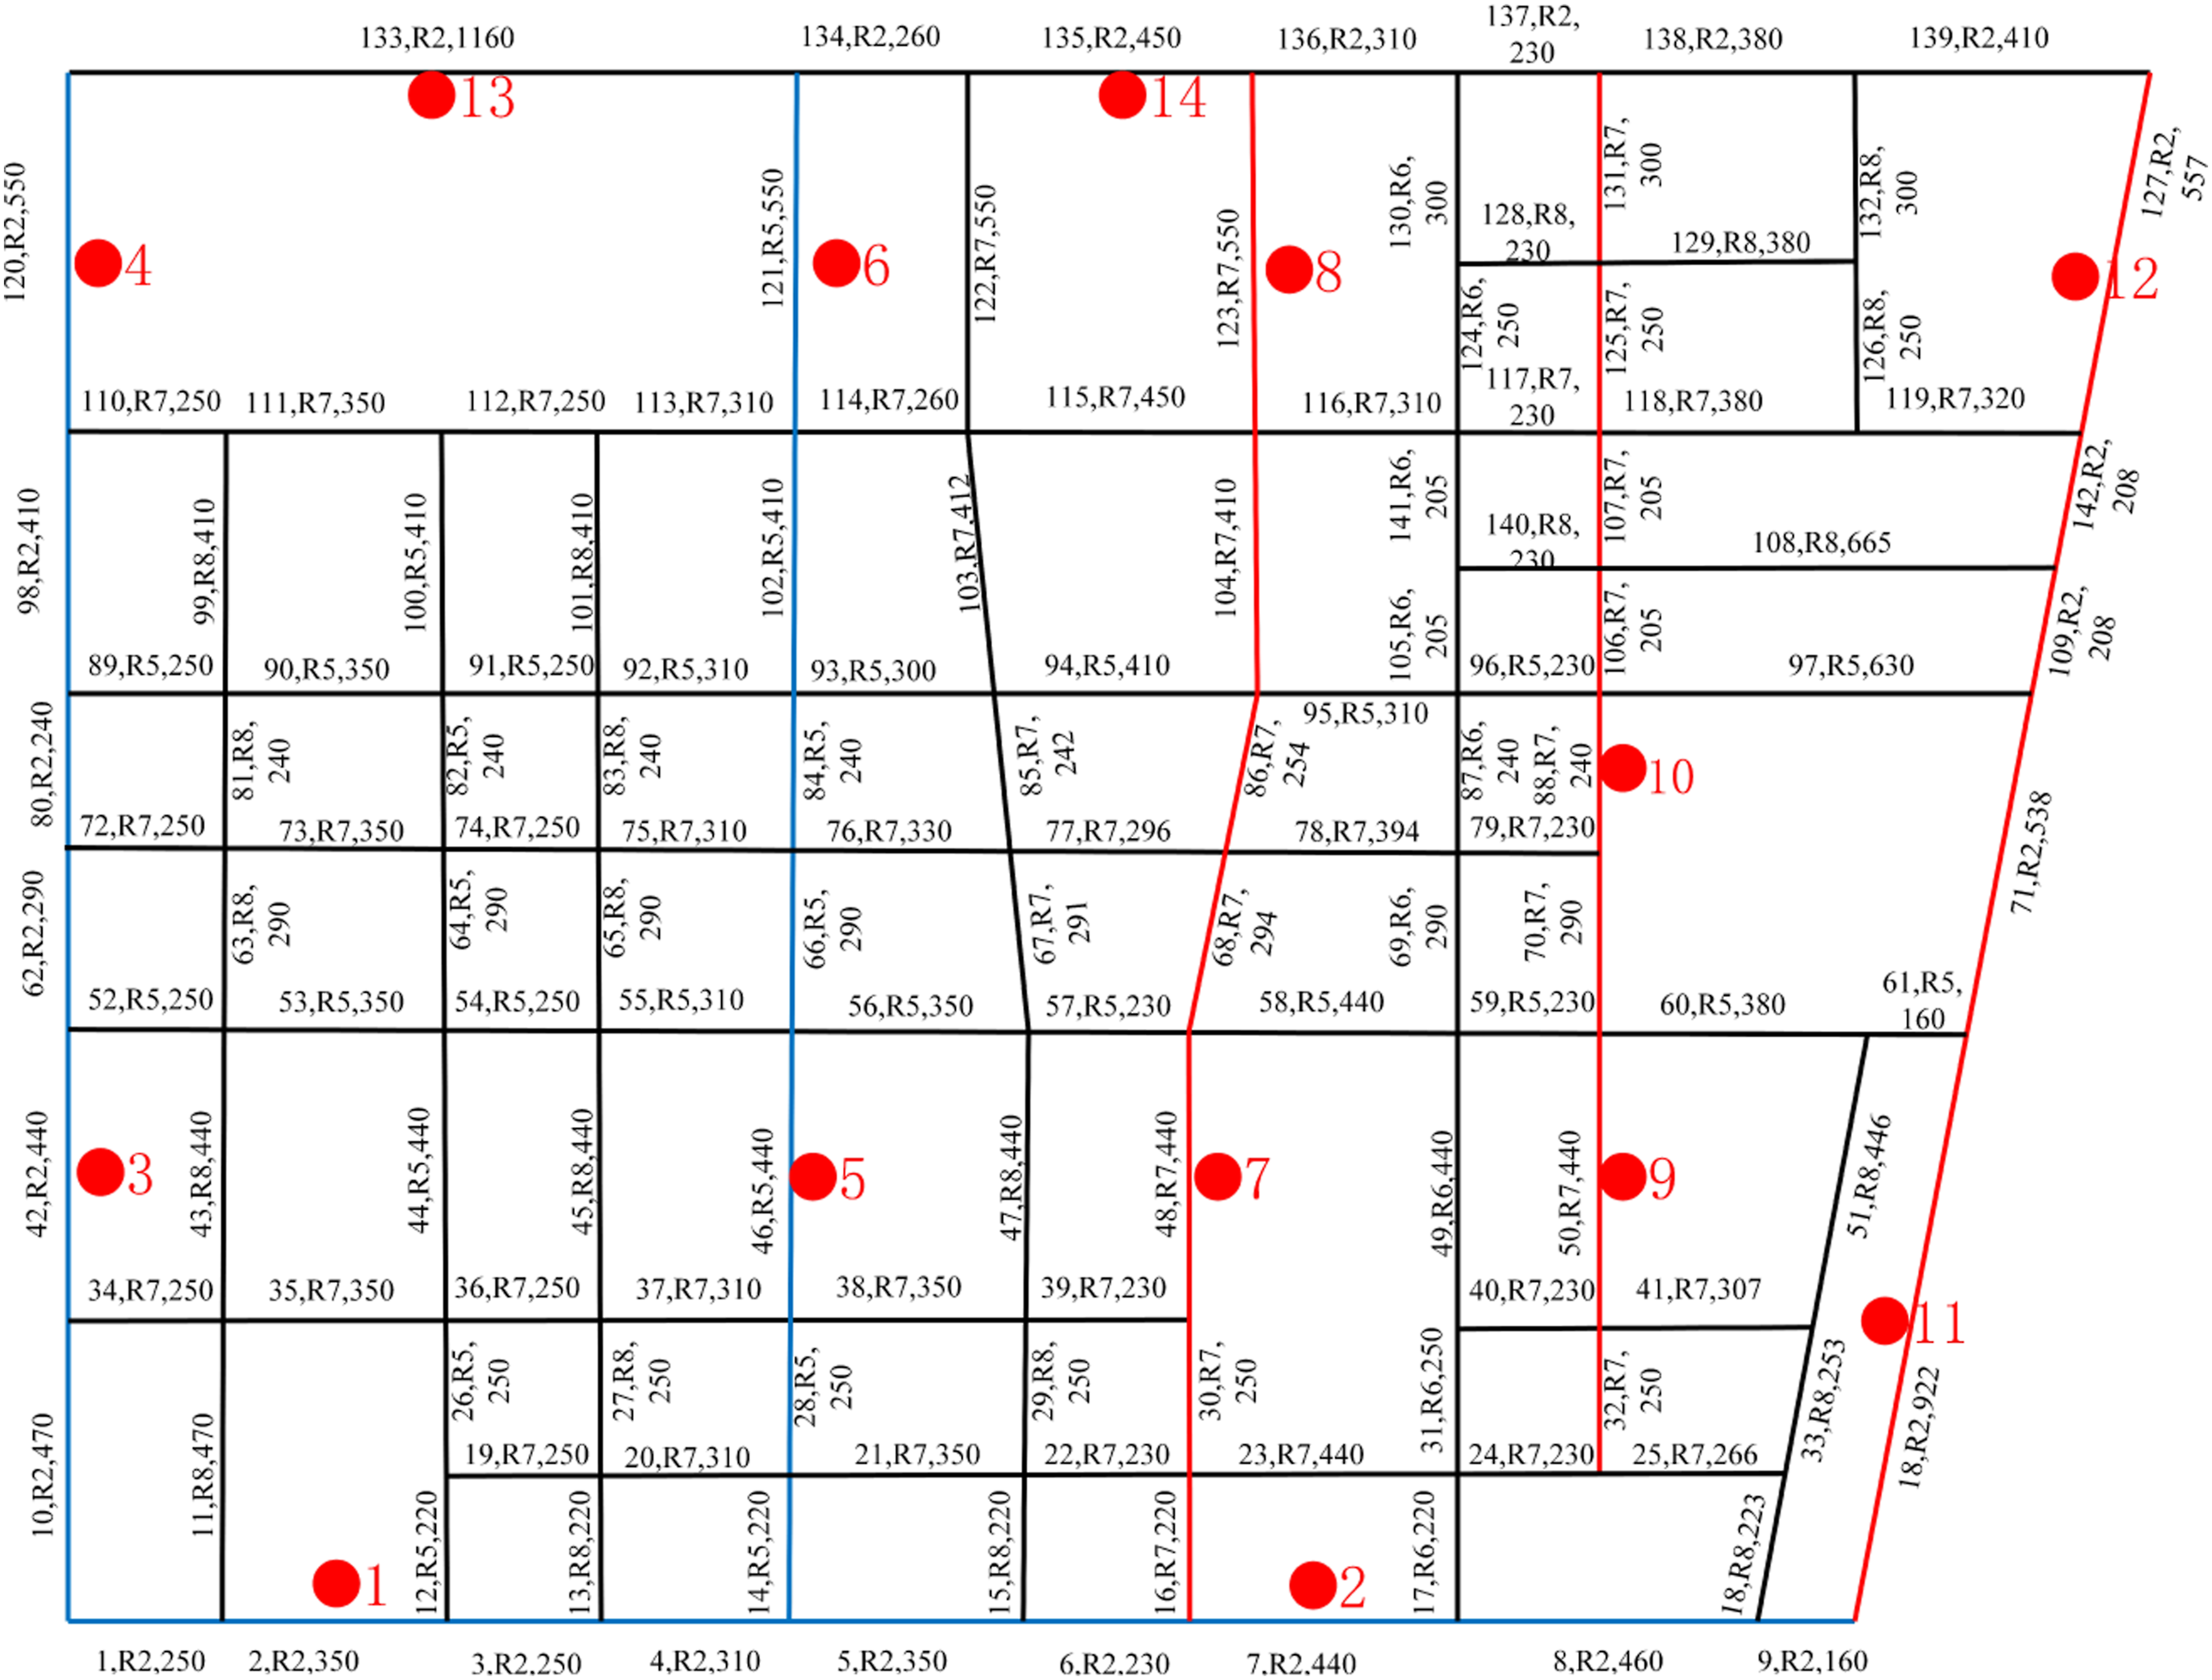
The overall analysis shows only a slight change in both the average noise and NPR. Compared to the original network, the average noise increased by 0.04 dB and NPR decreased by 0.51%.
Noise and capacity evolution at control points.
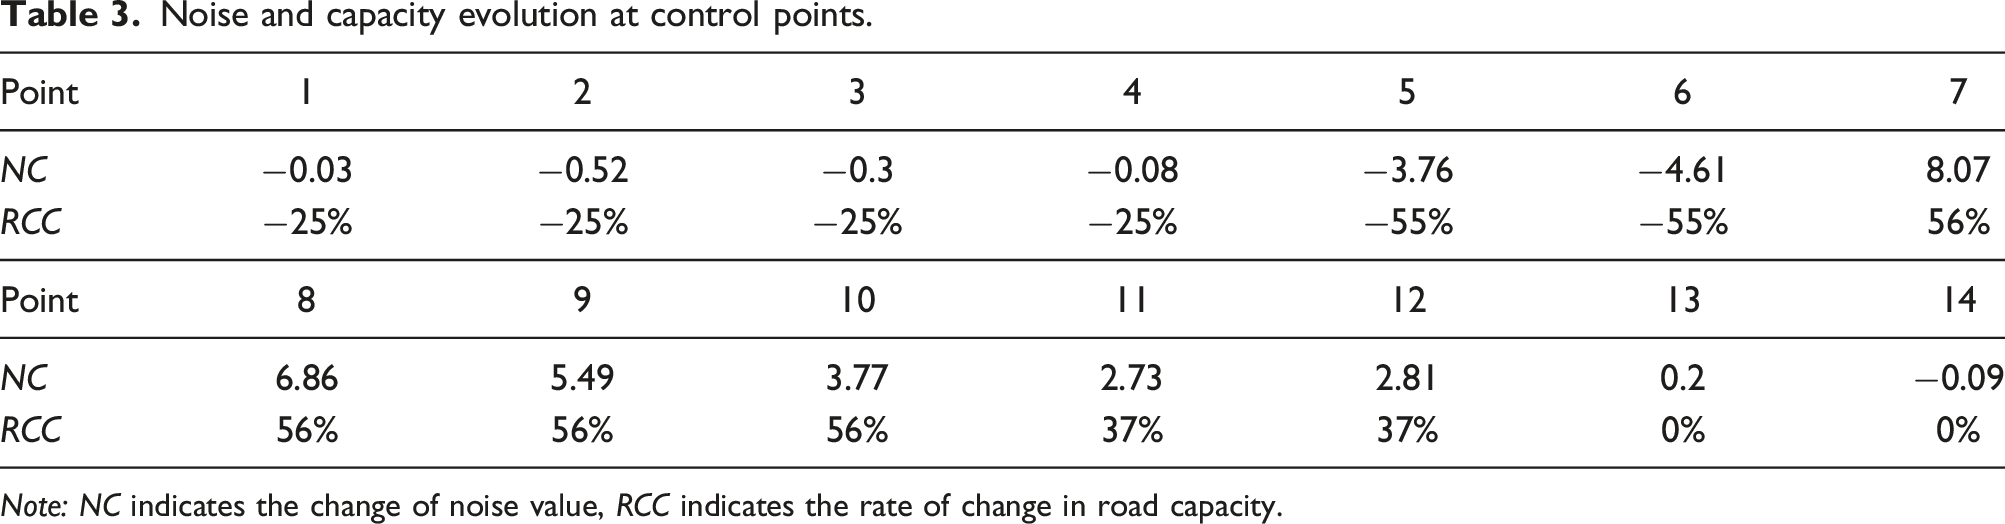
Note: NC indicates the change of noise value, RCC indicates the rate of change in road capacity.
The control points were divided into four categories according to the rate of change in road capacity (RCC). The evolution of noise values and RCC are compared for different categories of control points, shown in Figure 12. We found a positive correlation between the rate of change in road capacity and traffic noise. Roads with a high road grade have a high original capacity. Therefore, the resistance to disturbance is high, the impact of adjusting the road grades on the RCC and NC is relatively small. This demonstrates that high grade road adjustments have a small impact on traffic noise in the surrounding region, while low grade road adjustments have a large impact on traffic noise in the surrounding region. Trends in RCC and NC.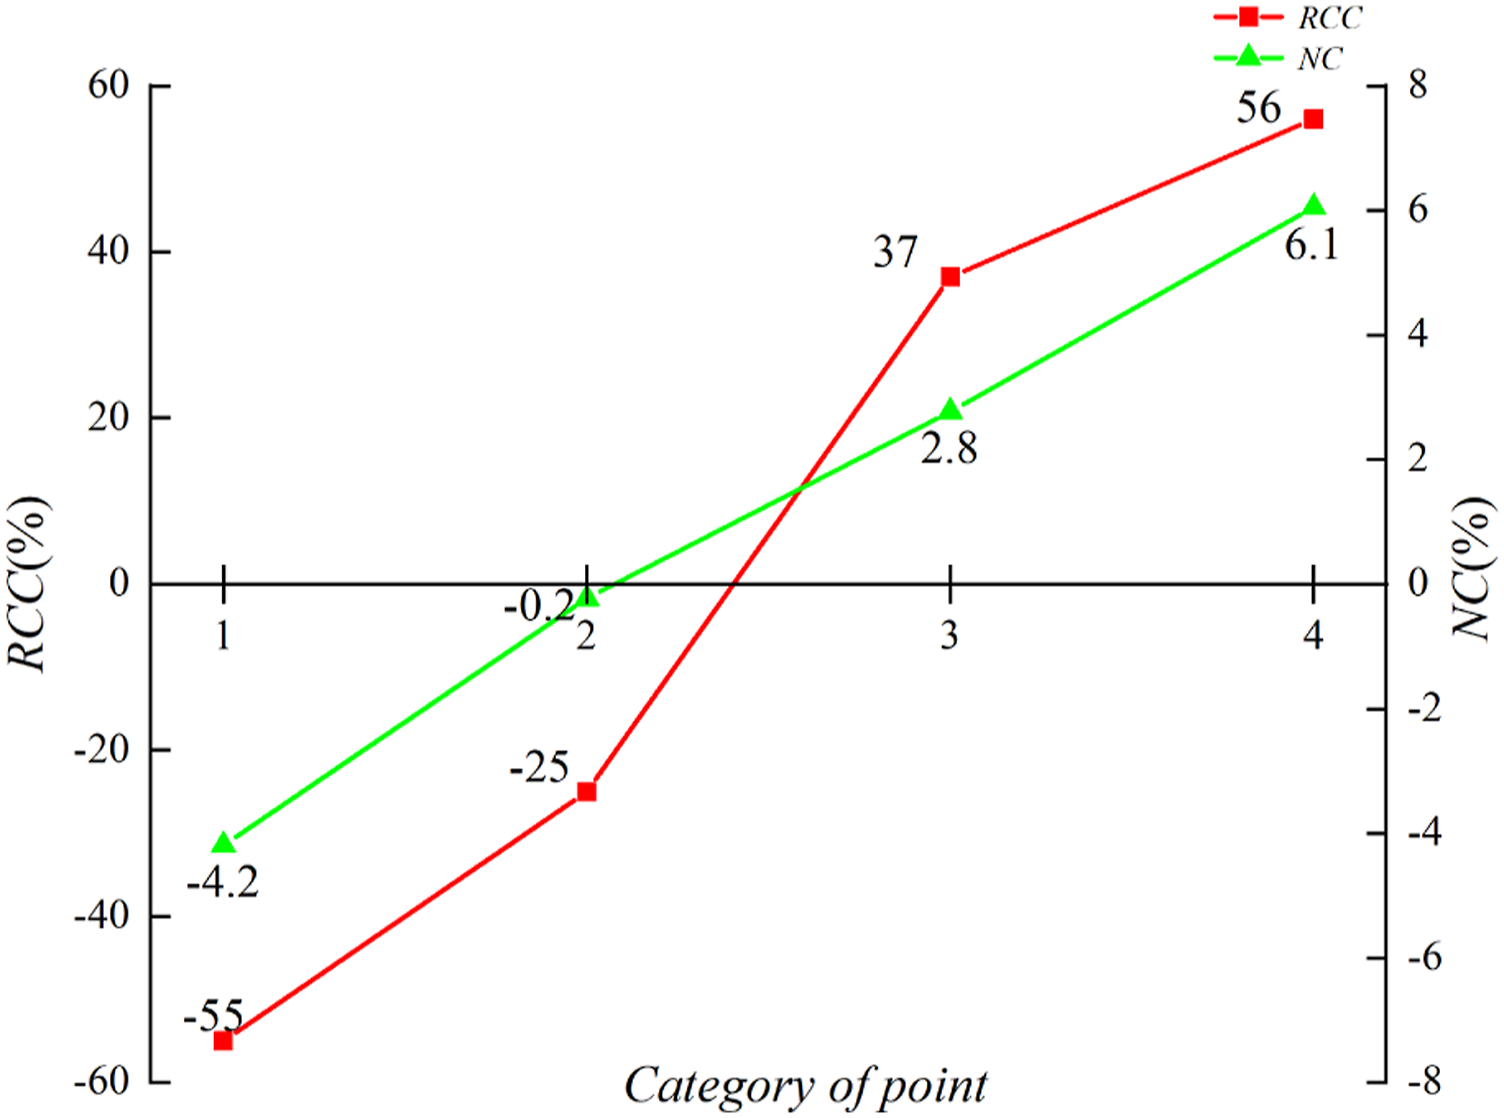
The impact of road grade adjustments on regional traffic noise was explored by sub-region, dividing the region into 12 square sub-regions. Noise indicators and regional capacity per unit area (Q) are calculated separately for each sub-region. Comparing the original road network, the relationship between QR and NPR difference and noise difference for each sub-region is shown in Figure 13. Sub-regions noise indicators difference.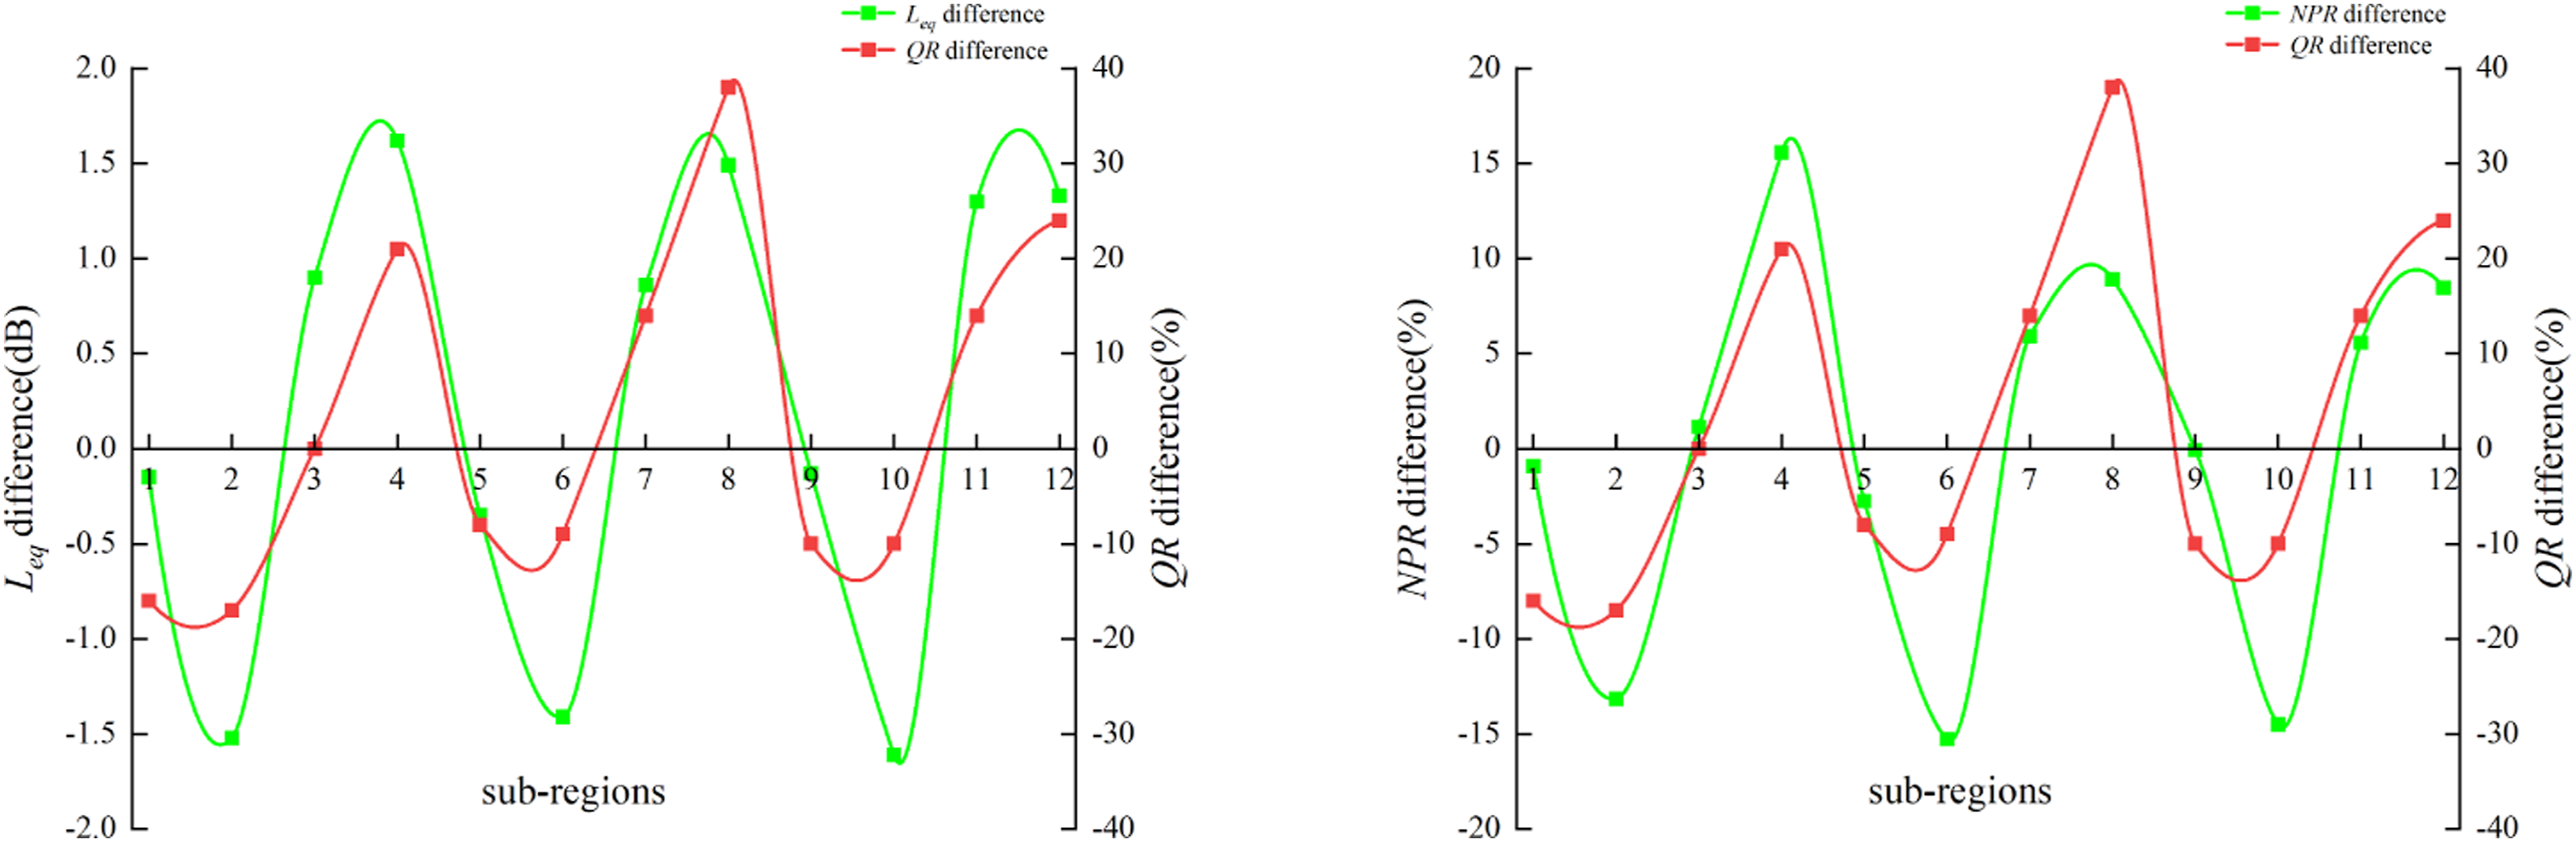
As clearly shown in the figure, regional capacity per unit area is positively correlated with noise and NPR, as regional capacity per unit area decreases, regional noise and NPR decreases simultaneously. The road grade directly determines the capacity per unit area, therefore the evolution of the noise value and NPR is closely related to the road grade. This again demonstrates that the high grade road adjustments have a small impact on traffic noise, while the low grade road adjustments have a large impact on traffic noise.
Therefore, the above study can be concluded as follows: (1) Traffic noise and road capacity are closely related, the greater capacity (the higher the road class) will suffer from greater traffic noise pollution. (2) Adjusting the road attributes of the road, the change in traffic noise depends mainly on the rate of change in capacity. Therefore, higher road grades have a smaller impact on noise when adjusting road grades.
Conclusion
This paper studies the impact of network structure on traffic noise from the perspective of network planning to search for strategies to prevent and control traffic noise at source. First, an improved stochastic user equilibrium model is developed considering intersection delay values to improve traffic flow assignment accuracy. Subsequently, a univariate traffic noise prediction model is used to simulate and visualize the network traffic noise data to provide a more intuitive view of the traffic noise distribution. Finally, an evaluation system is established to study the evolution of traffic noise under different network structure conditions. The study indicates that:
As the network density increases, the regional traffic noise values decrease. Network density affects traffic noise by changing the distribution of network traffic flow and speed, the correlation coefficients between traffic noise and flow, speed are 0.85 and 0.48 respectively. Improved network accessibility due to increased network density, which means that travelers have more route options and the traffic flow on the network is more easily dispersed resulting in reduced regional traffic noise. However, when the network density increases to a certain value, there is a possibility of an increase in regional traffic noise, which depends mainly on the region and traffic volume.
The impact of urban road attributes on traffic noise is divided into two parts. Studies have shown that the setting of one-way roads reduces regional traffic noise due to the dispersal of traffic to other high grade roads. Because the higher grade roads have greater resistance to noise interference. As a result, the overall noise value is reduced. The impact of road grade adjustments on traffic noise is positively correlated with the rate of change in road capacity (RCC).
From the perspective of network planning, the impact of network structure on traffic noise is evaluated. The results show that a reasonable network layout and appropriate traffic control measures can effectively reduce traffic noise, which provides a theoretical basis for controlling urban traffic noise at source.
Footnotes
Declaration of conflicting interests
The author(s) declared no potential conflicts of interest with respect to the research, authorship, and/or publication of this article.
Funding
The author(s) disclosed receipt of the following financial support for the research, authorship, and/or publication of this article: This work was supported by the Opening Project of Key Laboratory of Road Traffic Environmental Protection Technology, Ministry of Transport, PRC (F20221101), and the Basic and Applied Basic Research Project of Guangdong, China (2023A1515012482).