
Abstract
The aim of this paper is to investigate the relationship between energy consumption, financial development, and economic growth in the case of the G7 economies and emerging market economies. To this end, the role of the banking sector, as well as data from both the stock and the bond market, are explicitly used to proxy financial development. It is used the panel VAR method for the data period from 1990 to 2015. The results illustrate that there is a positive link between the stock market development and energy consumption in both G7 and top 10 emerging market economies in the long run. Also, while banking sector development in G7 countries decreases energy consumption in the long run, increases it in emerging market economies. Another aspect of the results is the determination of the energy-enhancing effect of the bond market development in the G7 countries. Moreover, while the results once again emphasize the existence of the link between financial development and energy consumption, they differ in terms of developed and developing countries.
Introduction
The role of financial development on economic growth has been extensively analyzed in the literature.1,2 In contrast, the empirical literature provides mixed results.3–5 At the same time, the studies exploring the relationship across financial development, energy consumption, and economic growth are relatively limited. The goal of this study is to shed further light on the relationship between energy consumption, financial development, and economic growth, from the perspective of both advanced and emerging economies, given the importance of those economies as energy consumers.
Financial development is reported to affect the demand for energy in various ways. The impact of financial development on energy consumption is associated with its effects on economic growth. Developments in the financial system stimulate economic growth, thus, exerting a positive effect on the energy demand. Sadorsky6,7 explains the theoretical mechanism relative to the positive effect of financial development on energy consumption, by emphasizing that the relationship between these two variables not very clear. In particular, he argues that only empirical evidence can clearly provide their actual association. To better explain this relationship, it may be appropriate to refer to the bilateral relations across financial development, economic growth, and energy consumption. It is widely acknowledged that financial development accelerates economic growth.1,8–11 Well-developed financial systems play an important role in contributing to the efficiency of the economy. Financial development affects saving rates, investment decisions, technological developments, and, hence, long-run growth rates.9,10 Currently, the theoretical literature provides four views on the relationship between financial development and economic growth: i) the ‘demand following’ view, which asserts that financial development is the result of economic growth. 12 ii) the ‘supply leading’ view, which stresses that financial development enhances economic growth, 13 iii) the presence of bidirectional causality between financial development and growth, and iv) Lucas 14 proposes the absence of any causality effects.1,15
By contrast, the relationship between energy consumption and economic growth has been analyzed in many studies focusing on different countries and periods and under different methodologies. The empirical analysis generated mixed and conflicting results on the direction of causality. For causality issues, four testable hypotheses are tested: neutrality, conservation, growth, and feedback.3,16 The ‘neutrality hypothesis’ stresses that there is no causality between energy consumption and economic growth, while policies that can decrease energy consumption may not have any adverse effects on economic growth. The ‘conservation hypothesis’ argues that there is a unidirectional causality running from economic growth to energy consumption, implying that economic growth leads to energy consumption. The ‘growth hypothesis’ supports unidirectional causality, running from energy consumption to economic growth, illustrating the leading role of energy consumption. Finally, the ‘feedback hypothesis’ stresses the presence of bidirectional causality, denoting that energy consumption and economic growth are mutually linked.
Our goal is to analyze the relationship across energy consumption, financial development, and economic growth in the case of the comparison of G7 economies and top 10 emerging economies. Understanding the carbon economy is an urgent requirement, especially for businesses and investors looking to adopt sustainable growth strategies. However, sustainability is firmly linked to energy/carbon efficiency, leading to efficient resource allocation and utilization, which in turn enhances the bottom line of businesses, enhancing corporate performance in the long run. The crux of the financing problem is the redirection of existing and planned capital flows from traditional high carbon to low emission, resilient investments. Across all countries, economic growth should continue and potentially lock in new carbon-based assets.
The current literature has focused mostly on developing countries. For example, Jalil and Feridun 17 investigate the impact of financial development, economic growth and energy consumption on environmental pollution in China. Their results illustrate a negative sign for the coefficient of financial development, implying that financial development in China has not arisen at the expense of environmental pollution. In contrast, Zhang 18 points out that China's financial development appears to be an important driver for carbon emissions increases. Shahbaz et al. 19 emphasize that financial development and energy use Granger cause each other in China, while in the case of Pakistan, Kakar et al. 20 find unidirectional causality between financial development and energy consumption. Another study for China is Ouyang and Li. 21 They used provincial data for the 1996Q1-2015Q4 period. They found that financial development has a negative impact on energy consumption in all regions. Shahbaz and Lean 22 investigate the relationship across energy consumption, financial development, economic growth, industrialization, and urbanization in Tunisia, and their result document long-run bidirectional causality between financial development and energy consumption, financial development and industrialization, and industrialization and energy consumption, while financial development, economic growth, industrialization and urbanization increase energy consumption in the long-run. Through the ARDL cointegration approach, Ozturk and Acaravci 23 investigate the relationship across financial development, trade, economic growth, energy consumption, and carbon emissions in Turkey and they provide evidence that there is a long-run causal relationship running from per capita energy consumption, per capita real income, the square of per capita real income, openness and financial development to per capita carbon emissions. The writers emphasize that financial development has an important role in the higher levels of energy consumption and income. In the case of Indonesia, Shahbaz et al. 24 explore the dynamic relationship across economic growth, energy consumption, financial development, trade openness, and CO2 emissions. Their findings show a long-run association across all variables in the presence of structural breaks, while financial development Granger cause CO2 emissions, economic growth, and trade openness. In the case of South Africa, Shahbaz et al. 25 show that financial development lowers energy pollutants, while economic growth increases them. Islam et al. 26 report that energy consumption in Malaysia is influenced by both economic growth and financial development, while Tang and Tan 27 find that energy consumption and financial development in Malaysia Granger causes each other in both the short- and in the long-runMahalik et al. 28 studied for Saudi Arabia for the 1971–2011 data period. They used the ARDL approach and results suggested that financial development has a positive impact on energy demand.
In terms of a panel of countries framework, Sadorsky 6 finds a positive and statistically significant relationship between financial development and energy consumption, using a panel data set on 22 emerging countries, while Sadorsky 7 examines the impact of financial development on energy consumption across Central and Eastern European economies. His results highlight the presence of a positive and statistically significant relationship between financial development and energy consumption. Al-Mulali and Sab 29 find that both energy consumption and CO2 emissions have a long-run relationship with both financial and economic development across 19 selected countries. In a study for thirty Sub-Saharan African economies, Al-Mulali and Sab 30 find that energy consumption has a causal relationship with economic growth and financial development, while in the case of 27 European Union (EU) countries, Coban and Topcu 31 find that increased levels of financial development lead to increases in energy consumption only for the case of old EU members. In contrast, in the case of the new members and in relation to stock market indicators there is not any relationship between financial development and energy consumption. Their results also provide evidence that financial development displays an inverted U-shaped pattern when it is measured using banking variables and only for the new members. Al-Mulali and Lee 32 investigate the impact of financial development on energy consumption in the case of the Gulf Cooperation Council countries. As a result, they find unidirectional causality running from financial development to energy consumption. Chang 33 analyzed the financial development, income, and energy consumption relationship in 53 countries covered the data period 1999–2008. Results proved that energy consumption increases with income in developing countries. Also, energy consumption increases with financial development in non-high-income countries. Gaies et al. 34 studied for finance-energy nexus in MENA countries for the period from 1996 to 2014, using linear and nonlinear dynamic panel data model. Their results confirmed that financial development positively and significantly impacts energy demand. Chiu and Lee 35 used different proxies of financial development. Accordingly, banking sector development has larger impacts on energy consumption than stock market development in OECD and non-OECD countries.
In the light of the studies examined above, it can be said that the literature on financial development and energy consumption is quite extensive. However, it is determined that there is a gap in making a comparison between developed and developing countries within the scope of the nexus addressed in these studies. Considering that developed and developing countries are quite different from each other, especially in the context of financial market developments, it is inevitable that such a comparison increases the effectiveness of the findings. Moreover, it is possible to bring a new perspective to the subject discussed by filling the gap determined in the current literature. In addition, it is noteworthy that the domestic credits to private sector variable is widely used as an indicator of financial development in the related literature.19,22,24–26,28–30,32 Apart from these, some studies include indicators regarding the stock market in addition to the indicators of the banking sector,18,31,35 but it is noticed that the bond market is excluded as an indicator of financial development. Therefore, another novelty of this paper is to emphasize the bond market as well as banking and the stock market in the dealt with the relationship between financial development and energy consumption. Although attention to the banking system and stock markets is greater, the importance of the bond market in financial development cannot be ignored. It is known that the absence of a well-functioning bond market leads to a decline in the efficiency of the economy and a vulnerability to financial crises. 36 In addition, the fact that there is no consensus in the related studies is one of the most important reasons for reconsidering this relationship by focusing on the specified gaps.The study is expected to contribute to the literature in different ways. First, our paper is differentiated from similar studies in the sense that not only the banking sector variable is explicitly considered, but also data from both the stock and the bond markets are explicitly used to proxy financial development. In that sense the paper offers room to the empirical analysis to explicitly measure the relative importance of individual financial development indicators (i.e., banking, stock market, and bond market) in energy consumption, while studies in the relevant literature have focused on the role of financial intermediaries and the role and importance of capital markets cannot be ignored, given the rapid development of financial and capital markets as the outcome of financial liberalization. Second, the empirical analysis not only conducted for developed countries but also for emerging economies. Emerging countries are economies that grow at higher levels than developed countries by their nature. The source of this is associated with the process of their rapid industrialization and financialization. Therefore, these developments inevitably have a cost. In this respect, the energy issue is critical to the sustainability of the development process of these countries, which are of critical importance for the world economy, especially recently. In addition, G7 countries are responsible for about a third of the global economy and have high energy dependency. Therefore, comparing these two country groups gives an idea about the future of sustainability in the current economic and financial performances of G7 countries, and bright up the possibilities of emerging markets to reach the level of developed countries. Third, to serve the goal of the empirical analysis, we use panel Vector Autoregressive (PVAR) methodology to explore the above links. One of the most important advantages of this method is that it tries to capture the dynamic relationship between variables by using a minimum constraint set. This method, which enables impulse-response and shock analysis, is useful for identifying possible policy effects. 37 In addition to these, presenting a causality relationship is another factor in the selection of the method.
The rest of the study is structured as follows. In the next second, related literature is discussed. In the next section, the model and dataset are introduced, the method and findings are evaluated. Last section is conclusion and policy implications.
Data, methodology, and results
The study obtains annual data spanning the period 1990–2015 on GDP (per capita constant at 2010 US$), energy consumption (kg of oil equivalent per capita), and financial development indicators. Data on GDP and energy consumption are obtained from World Development Indicators, while those of financial development indicators (i.e., bank deposits to GDP ratio, proxying the banking system size, the stock market total value traded to GDP, and stock market capitalization to GDP, proxying the stock market size, and the outstanding domestic private debt securities to GDP, proxying the bond market size) are obtained from the Global Financial Development Database.
38
The empirical analysis starts with the following long-run relationship

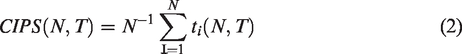
We begin the analysis by examining the presence of unit roots. A second-generation panel unit root test is employed to determine the degree of integration of the respective variables. The Pesaran
39
panel unit root test does not require the estimation of factor loading to eliminate cross-sectional dependence. Specifically, the usual ADF regression is augmented to include the lagged cross-sectional mean and its first difference to capture the cross-sectional dependence that arises through a single-factor model. The null hypothesis is a unit root for the Pesaran,
39
the CIPS test is specified as follows:

The panel unit root test results are presented in Table 1 below:
CIPS panel unit root test results.
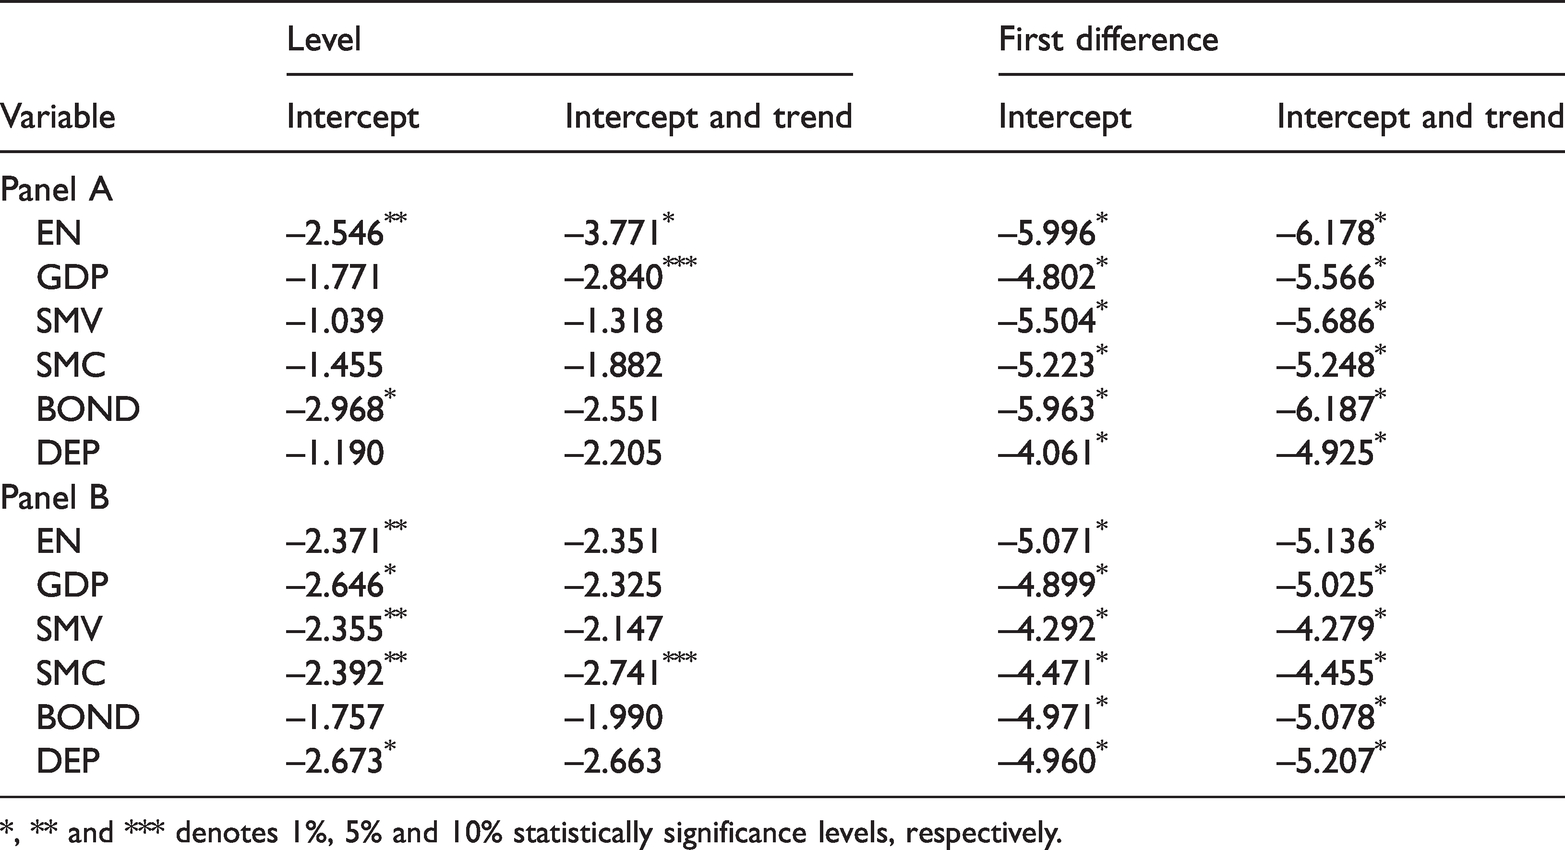
*, ** and *** denotes 1%, 5% and 10% statistically significance levels, respectively.
Table 1 reports the results of the panel unit root test based on CIPS testing procedures and different deterministic components. Results indicate that all variables integrated at first difference for both Panel A and Panel B. Therefore, all variables are adopted as I (1) because the series must stationary at same level, which is a prerequisite for the panel VAR approach.
Panel VAR lag length selection criteria.
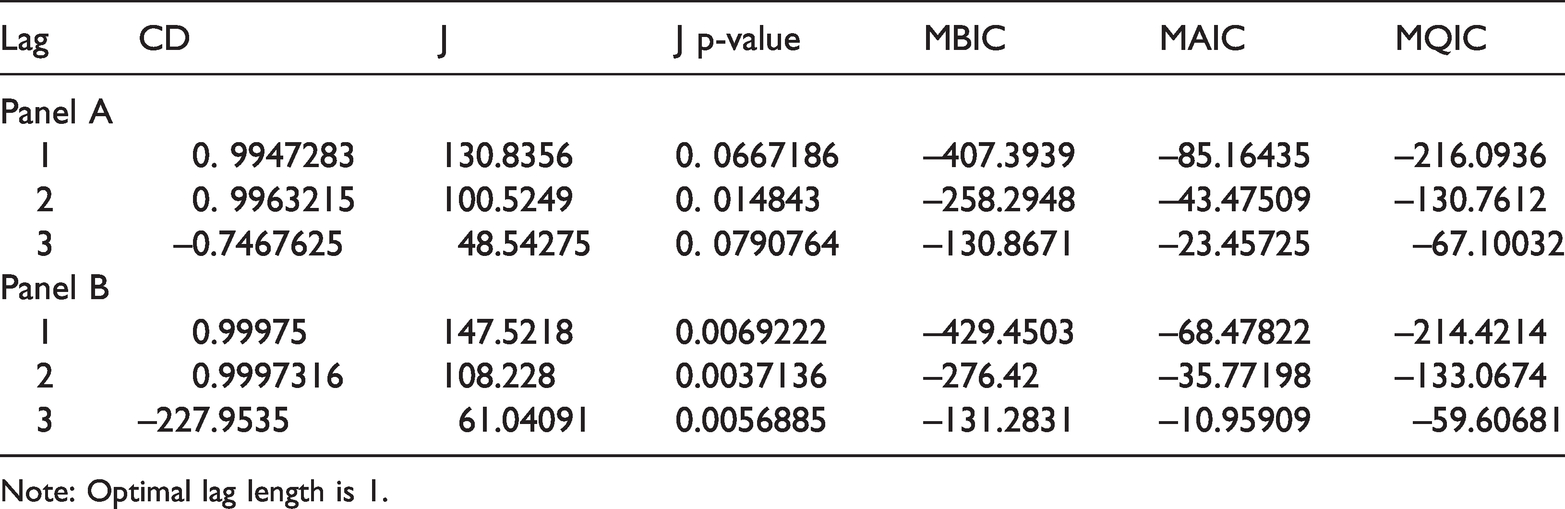
Note: Optimal lag length is 1.
Next, we use Panel VAR method for determine the long run relationship between variables. Although similar studies are methodologically focused on either long run coefficient6,7,31 or causality tests,21,29 both long run coefficient estimation and causality analysis are performed in this study. Also, short run dynamics are determined as a feature of the method used with impulse-response graphs. Moreover, the opportunity to determine the source of the changes in the variance of each variable is obtained by the panel VAR method. It is generally assumed that all variables in VAR models are endogenous and interdependent and panel VAR model consists of a combination of traditional VAR method and panel data models.
37
A basic panel VAR equation can be written as
41

There are a number of econometric advantages within the panel VAR method. This method is effective in analyzing the transmission of shocks that may occur within a unit and time. Panel VAR models are suitable for creating average effects in groups of no non-homogeneous units and analyzing specific differences relative to the mean. The panel VAR method can also be used to analyze the importance of interdependencies and to check whether feedback is generalized. 37
When Table 2 is examined, it can be seen that first-order panel VAR is the preferred model, since this has the smallest MBIC, MAIC, and MQIC for both Panel A and Panel B. In the next stage panel VAR method is applied using GMM style estimation according to lag (1). Panel estimation results based on the GMM approach are given in Table 3.
Estimation VAR results (GMM), lag (1).
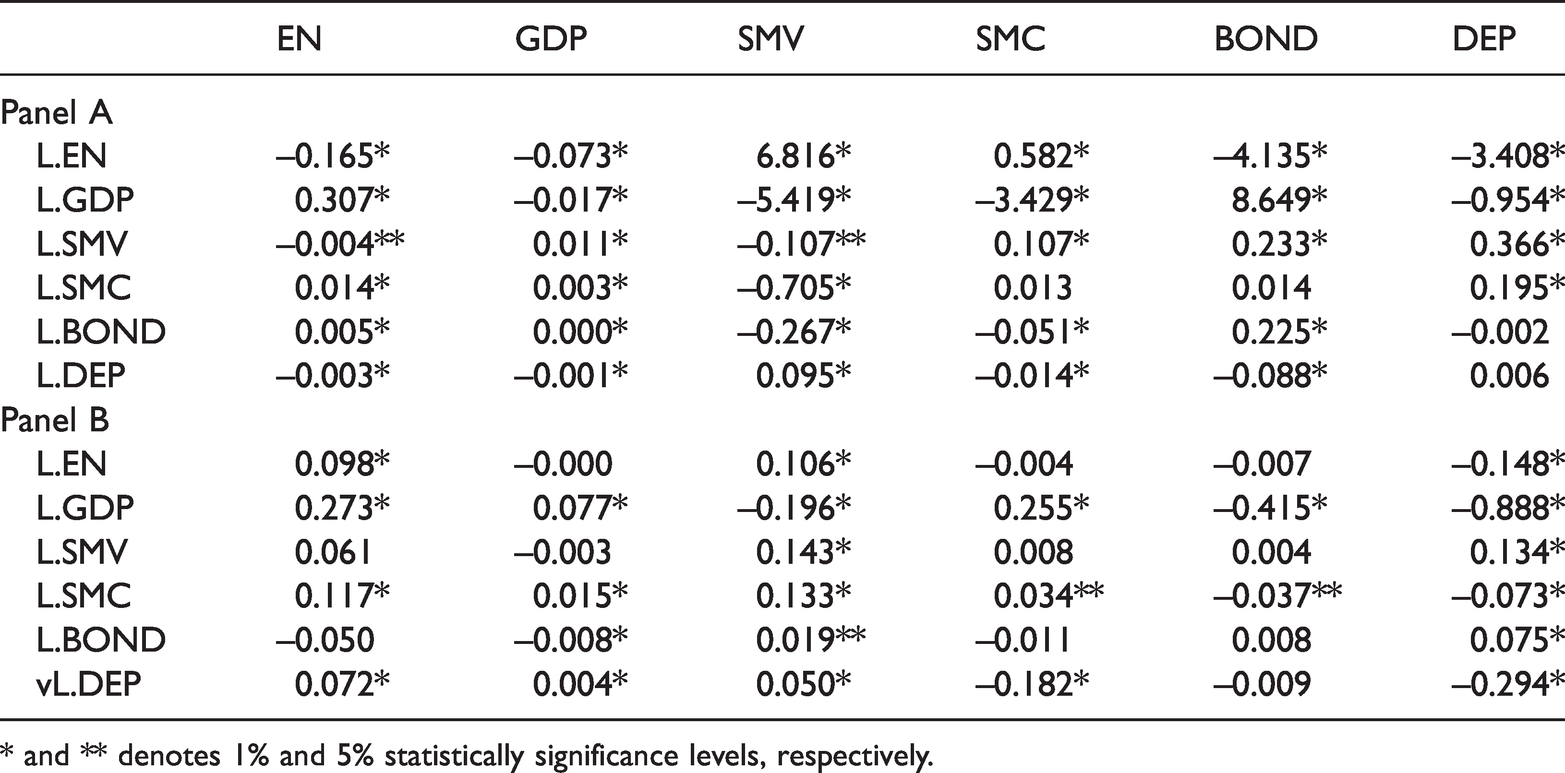
* and ** denotes 1% and 5% statistically significance levels, respectively.
First, the results for Panel A, representing the G7 countries are remarkable. VAR results suggest that GDP per capita has a positive and significant impact on energy consumption. This means an increase in GDP per capita leads to a 0.30 percent increase in energy consumption. When financial development indicators are analysed, bank deposits and stock market total value have a negative effect on energy consumption, while the coefficients of stock market capitalization and bond market are positive. On the other hand, the positive effect of stock market capitalization is greater than the negative effect of the stock market total value. In other words, considering the negative and slight effect of the stock market total value traded in these countries, it is necessary to focus on stock market capitalization. So, we adopt that the developments in the stock market capitalization increase energy consumption. Since stock market capitalization essentially expresses the capital value of firms traded on the stock market, it is a normal result to expect an increase in energy consumption. At this point, it is possible to talk about two different influence channels. First, an increase in the capital value of firm is associated with the increase in stock prices, which brings along an increase in transactions in the stock market. Second, it is possible that the activities of firms with increased capital value are positively affected by this situation. The result of both influence channels is an increase in energy consumption. Considering the results in terms of the bond market, it is seen that the use of bonds in the financing of enterprises increases the energy consumption, albeit slightly. As the financial markets gain depth and high interest levels decline, the private sector’s borrowing by issuing bonds in domestic markets increases. Such an investment contributes to the economy by increasing liquidity and consequently increases energy consumption in developed countries. A slight but unexpected effect is that an improvement in the bank deposits indicator used to represent the banking sector reduces energy consumption. While the increase in bank deposits means the deepening of financial institutions, it can be evaluated as a reflection of high deposit interest rates. High interest rates, on the other hand, may lead to an increase in firm costs and a slowdown in economic activities and thus a decrease in energy consumption. In addition, an increase in energy consumption decreases GDP per capita. While, the increase in GDP per capita increases energy consumption, the increase in energy consumption reduces GDP per capita, indicating that in the long run, the sustainable development goal cannot be achieved without energy saving.
Second, Panel B results, which represent top 10 emerging economies are summarized in Table 3. Results suggest that GDP per capita, stock market capitalization and bank deposits have a positive and statistically significance impact on total energy consumption. Accordingly, an increase in GDP, SMC and DEP leads to a 0.27, 0.11 and 0.07 percent increase in energy consumption, respectively. Therefore, although the contribution of financial development to the increase in energy consumption is clear in emerging countries, it can be said that the contribution of the developments in the stock markets is larger than the banking and bond market. Moreover, the explanations of the results from the G7 countries for the stock market are also valid for emerging market countries, but it is a fact that the positive effect is greater in these countries. Unlike G7 countries, bank deposits have an increasing effect on energy demand in these countries. Considering that, by their nature, emerging market countries consider economic growth to be the top priority, more emphasis is placed on the conversion of deposits into credits in these countries. When also the results from bond market are evaluated, it can be said that loans are used for financing investments of firms rather than bonds. Therefore, the increase in energy consumption through the banking channel is an expected result for these countries.
Results for SMC and BOND in Panel A and results for SMC and DEP in Panel B are compatible with, Shahbaz and Lean, 22 Ozturk and Acaravcı, 23 Mahalik et al., 28 Sadorsky,6,7 Chang 33 and Gaies et al. 34 Also, the results in terms of SMV and DEP in Panel A are compatible with Shahbaz et al. 25 and Ouyang and Li. 21
Next, we estimate causal dynamics. Panel VAR analysis structurally contains three techniques, namely Granger causality analysis, impact-response analyzes and variance decomposition. The causality test is a simple application of Granger
42
to heterogeneous panel data models. The basic model for panel causality is constructed as follows
According to Table 4, there is bidirectional causality between energy consumption and all dependent variables. Results means that energy consumption and financial development in G7 countries Granger causes each other. This finding is compatible with Shahbaz and Lean 22 and Tang and Tan. 27 Also, there is same causality relationship between GDP and stock market total value, stock market capitalization, bond market, and bank deposits. In addition, while there is bidirectional causality between stock market total value and stock market capitalization, bond market, and bank deposits, there is unidirectional causality from bond market to stock market capitalization and from bank deposits to bond market. In emerging economies, there is bidirectional causality between energy consumption and bank deposits, while there is unidirectional causality running from energy consumption to stock market total value.
Panel VAR granger causality Wald test results.
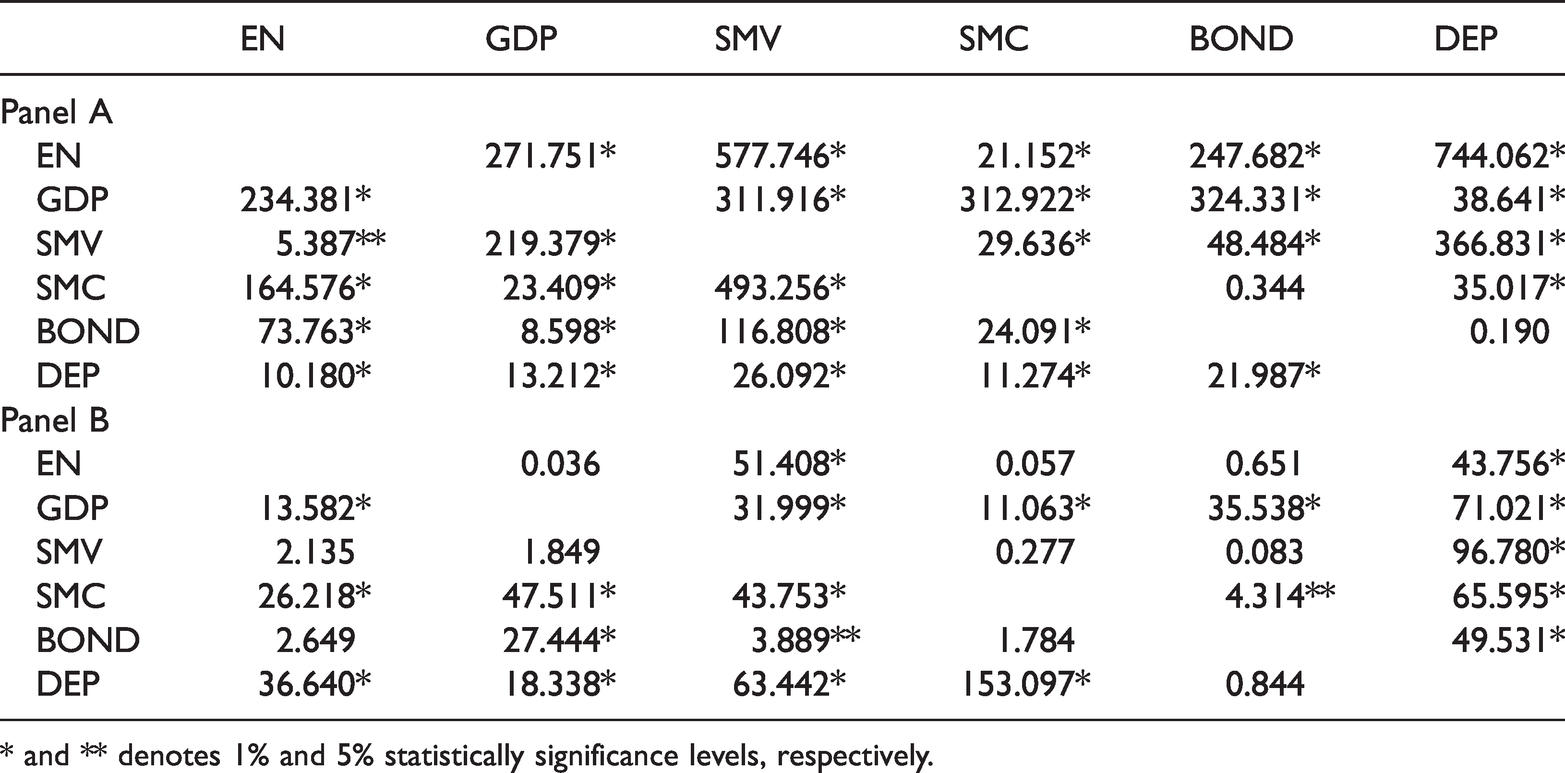
* and ** denotes 1% and 5% statistically significance levels, respectively.
After estimating the coefficient and investigating the causality, the stability condition is checked. The resulting graph (Figure 1) of eigenvalues at above confirms that the estimate is stable. Ensuring the stability condition is moving the study to the next stage.
According to the impulse response graphs presented in Figure 2 below, an increase in bank deposits and stock market total value firstly decreases the energy consumption, and then increases it in the short run. In addition, an increase in bond market size, stock market capitalization, and GDP per capita firstly increases energy consumption, then decreases it in the short run. These results are consistent with long run GMM results. From the findings of emerging economies, a standard deviation shock of stock market capitalization and stock market total value first increase energy consumption and then decrease. Also, the response of energy consumption to one standard deviation shock of bank deposits is firstly positive, secondly negative, and then positive. On the other hand, a standard deviation shock of bond market firstly decreases and then increases energy consumption. Compared the impulse-response functions of both country groups, even though the results are similar in terms of SMC, they are completely different in terms of DEP, BOND and SMV. Thus, the impact of shocks emerging in the financial sector is more devastating in terms of energy in developed countries.
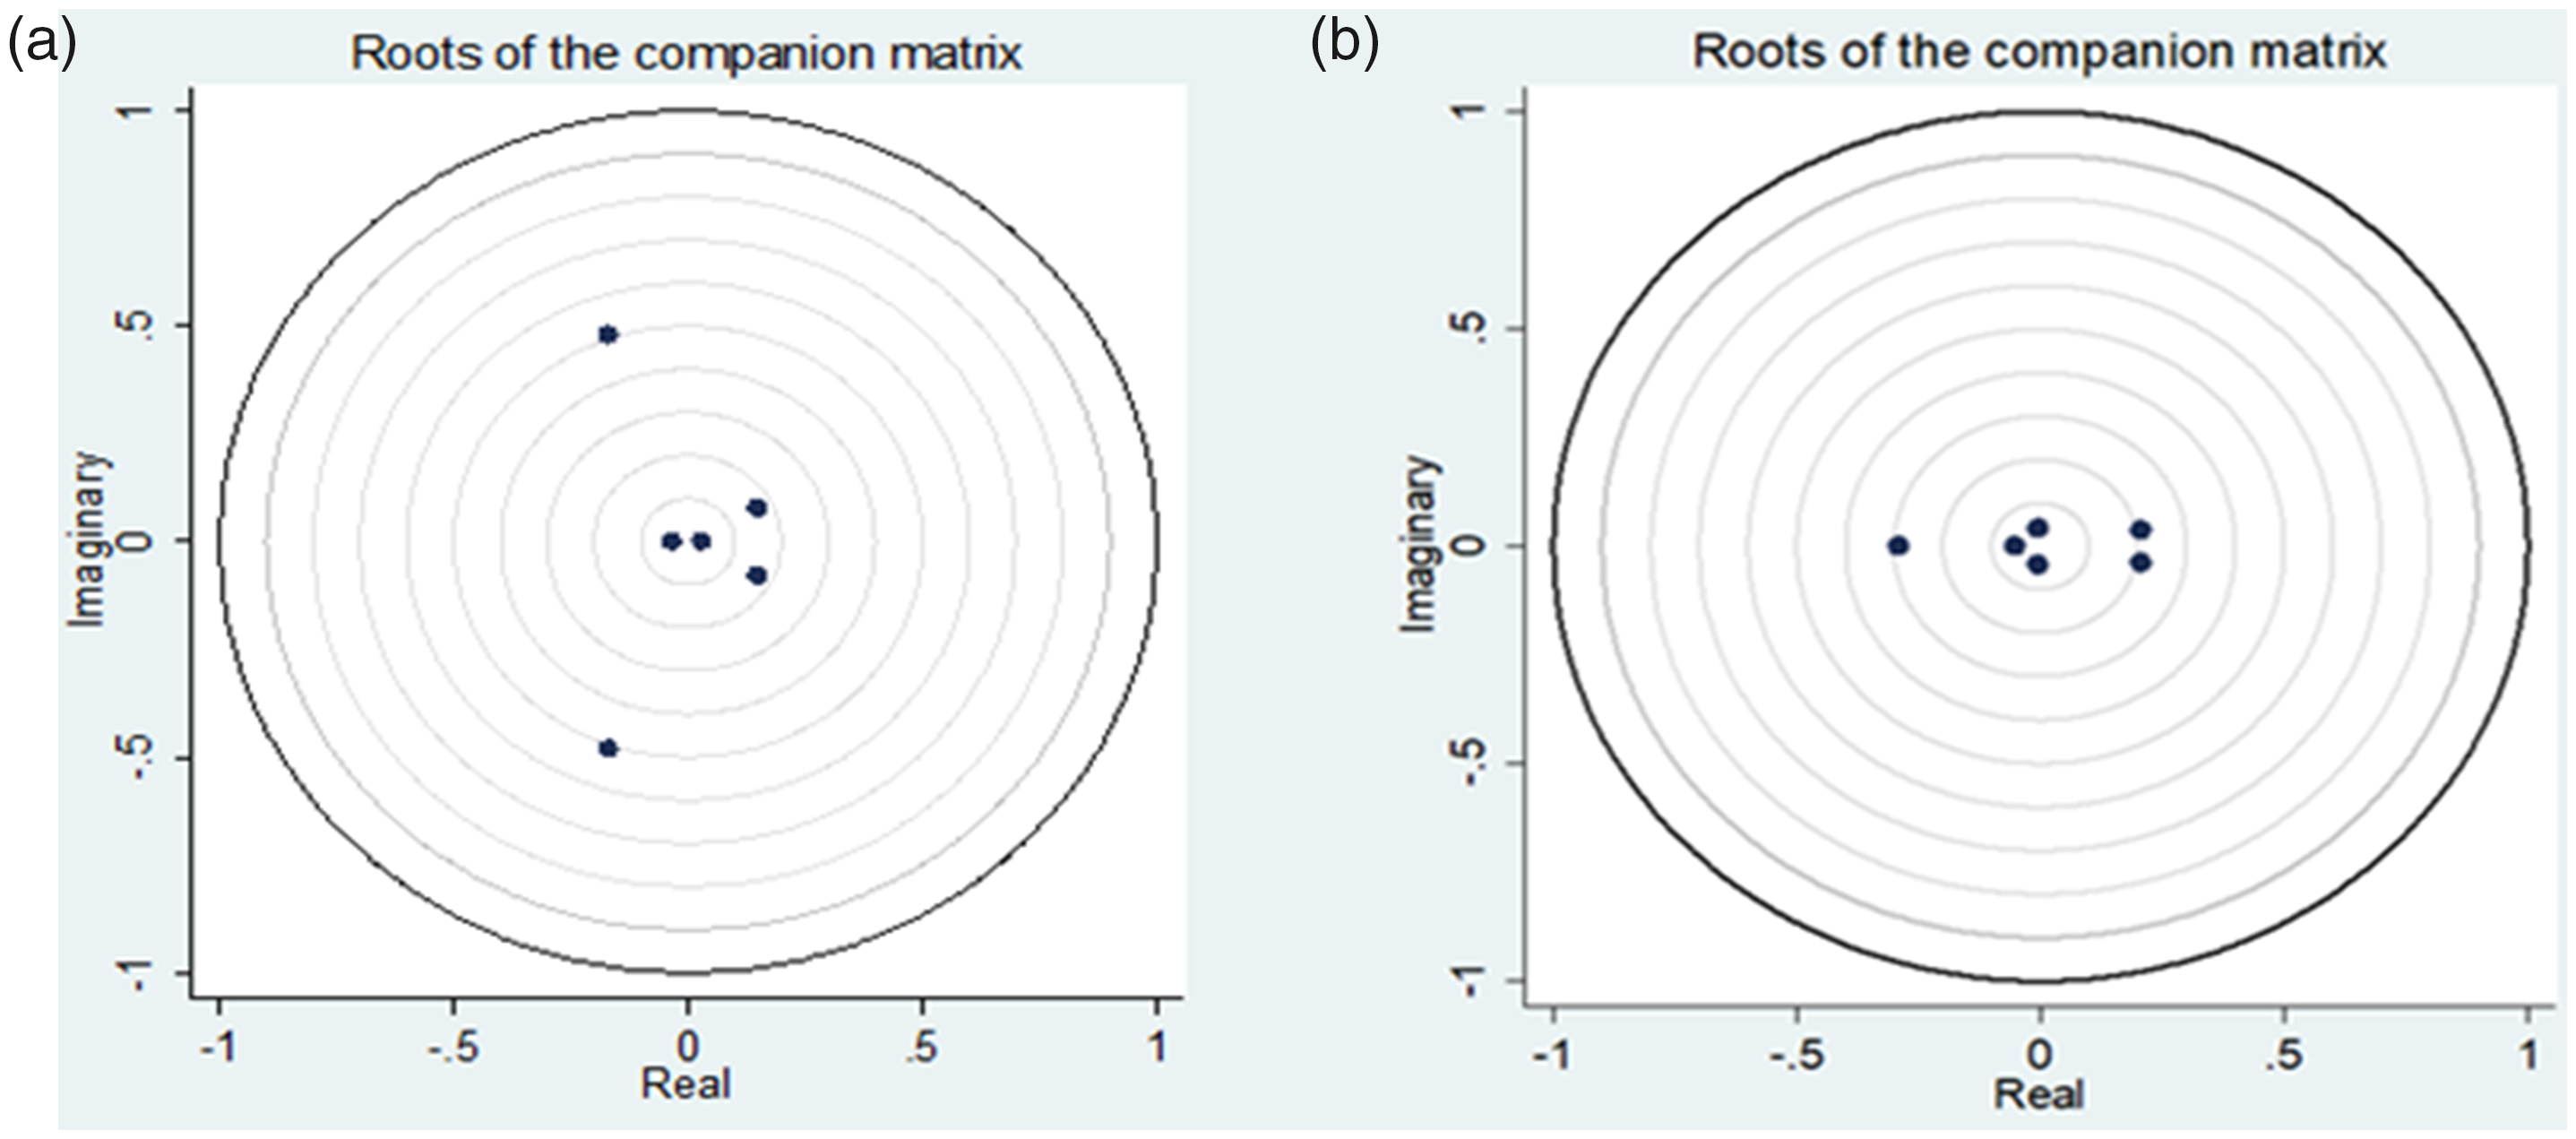
Roots of companion matrix.
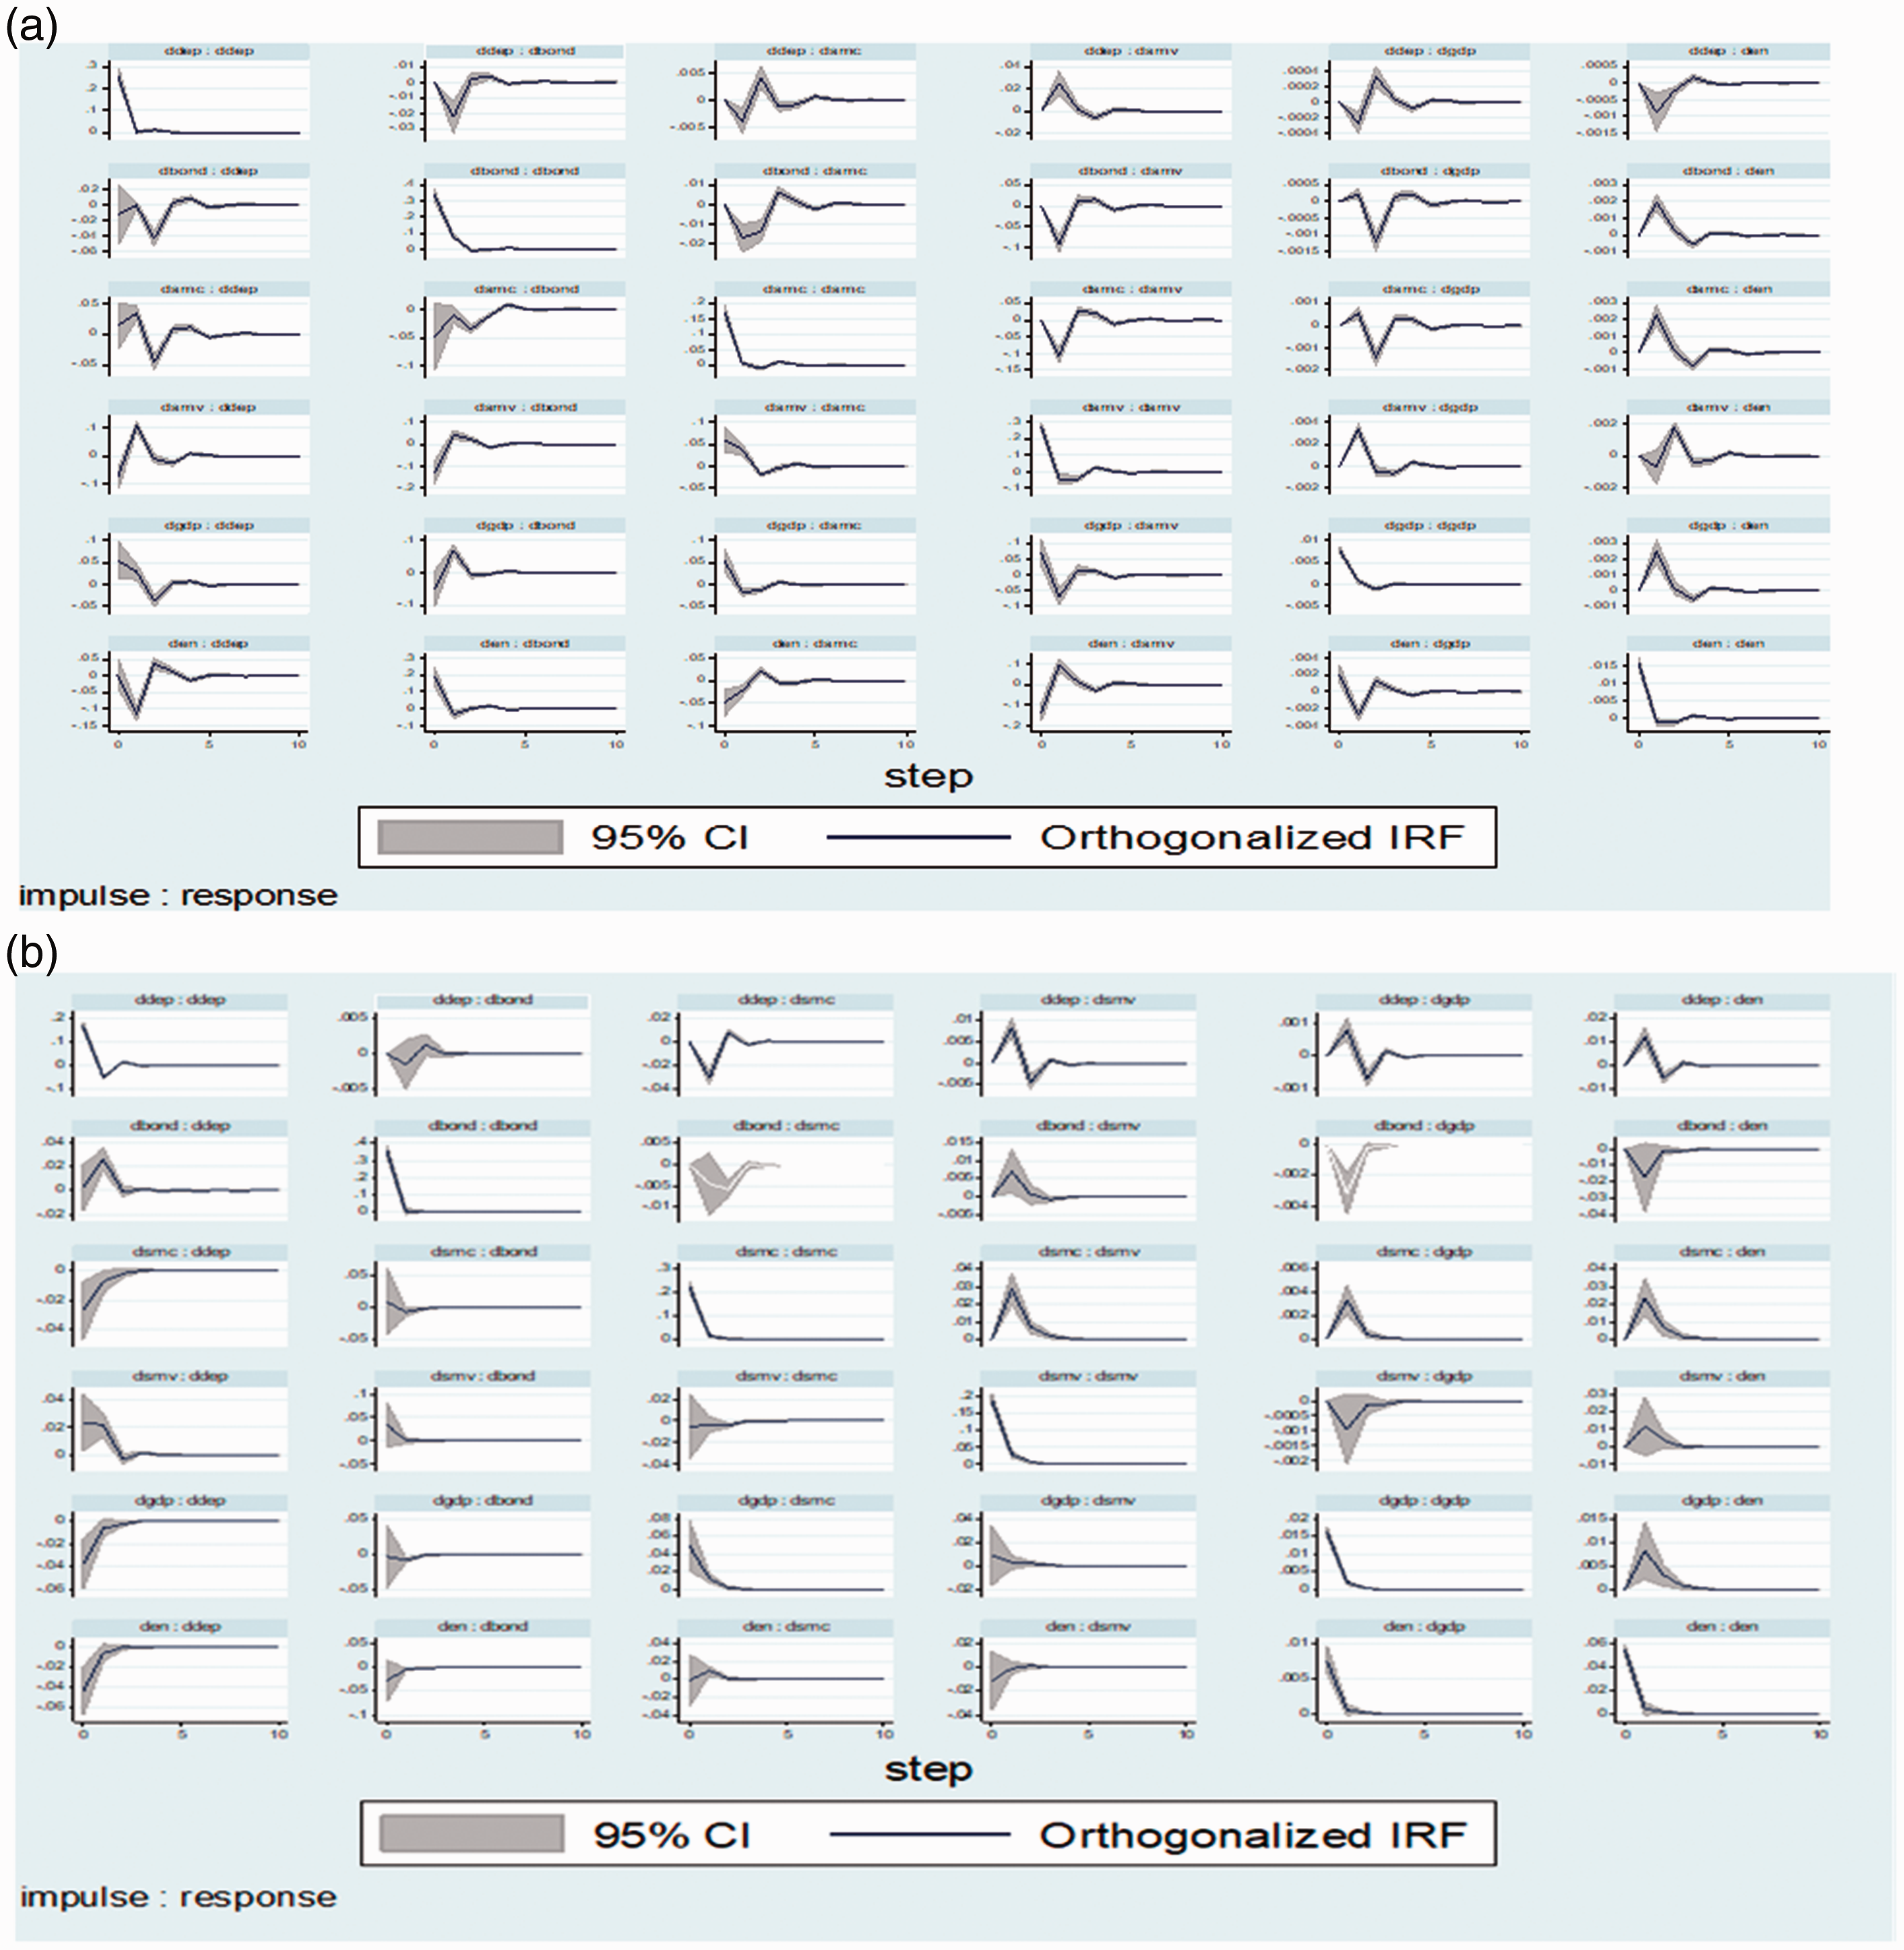
Impulse-response graphs.
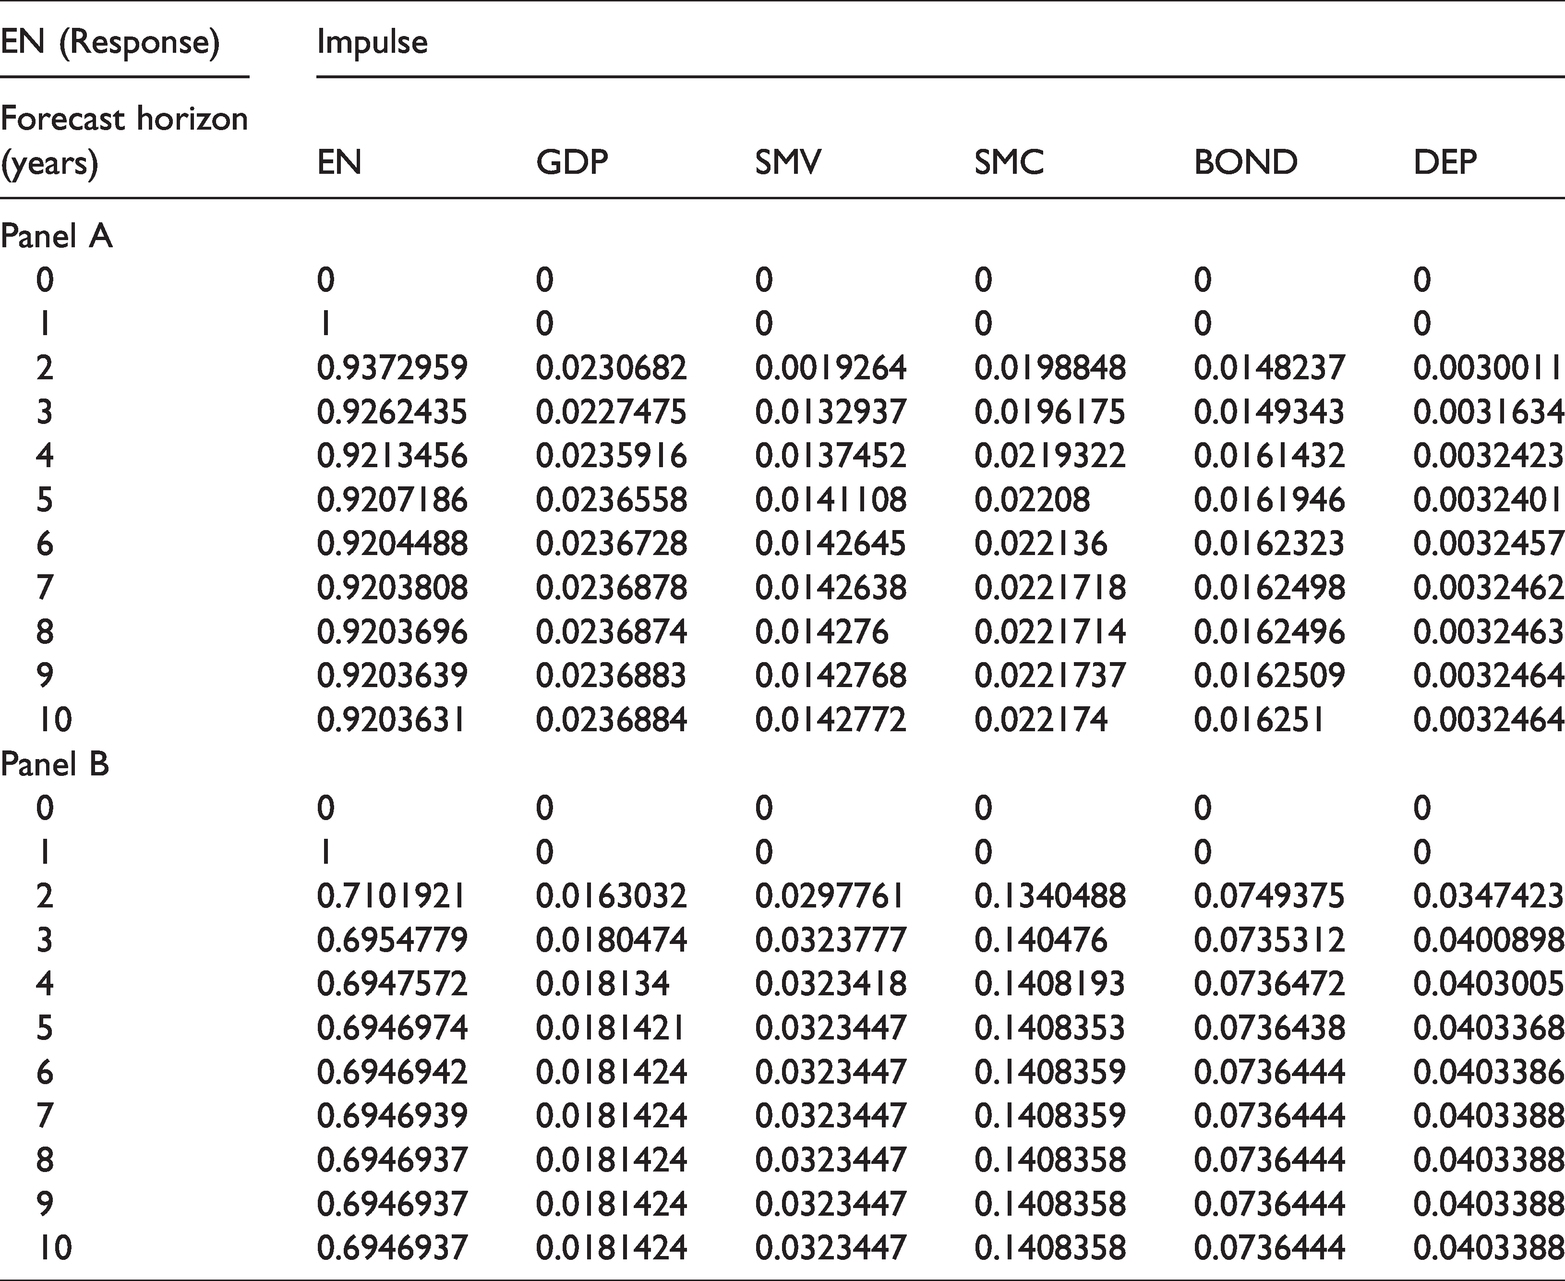
Another important component of the analysis is variance research. The variance decomposition obtained from the moving averages section of the VAR model expresses the source of the shocks that occur in the variables themselves and other (explanatory) variables as a percentage. Variance decomposition results imply that percentage of a change in the dependent variables that are due to themselves versus explanatory variables. When Table 5 is examined, variation of energy consumption is explained %2 by past GDP per capita, about %1 by past stock market total value, %2 by past stock market capitalization, %1 by past bond market size, and %9 by past own changes at 10 periods ahead. This result shows that energy consumption is greatly affected by its domestic dynamism. Panel B results suggest that about 70 percent fluctuations in energy consumption are results of past own changes. Energy consumption is followed by SMC, BOND, DEP, SMV and GDP respectively.
Variance decomposition.
Conclusions and policy implications
The relationship across energy consumption, financial development and economic growth was the primary research focus of this paper. Given that the empirical literature on the issue does not provide clear cut conclusions, this motivated the paper to explore the relationship across the variables in question from the perspective of the two country groups. The empirical analysis employed an extended range of financial development indicators, such as the bank deposits to GDP ratio as a proxy for banking system size, the stock market total value to GDP ratio and stock market capitalization to GDP ratio as proxy for the stock market size, and the outstanding domestic private debt securities to GDP ratio as a proxy for the bond market spanning the period 1990–2015. We estimated the long-run model by panel VAR methodology, and the results obtained from G7 displayed that energy consumption has a positive association with both stock market capitalization and bond market size in the long-run. At the same time, bank deposits seem to exert a negative impact on energy consumption, implying that higher levels of bank deposits -through expanding bank credits- facilitate more access to bank funding for projects supporting energy efficiency, thus, leading to the reduction of energy consumption. This means the development and efficiency of capital markets seems to facilitate access to long-term capital, leading to higher levels of investment and increases in energy consumption. Finally, panel causality test results recommend the presence of bidirectional causality between energy consumption and bond market, stock market, banking, GDP. Potential future research venues should expand the analysis to the case of developing economies, by taking explicitly both money and capital markets into account. Emerging economies results suggest that GDP per capita, stock market capitalization and bank deposits have a positive and statistically significance impact on total energy consumption. Also, there is bidirectional causality between energy consumption and bank deposits, while there is unidirectional causality running from energy consumption to stock market total value.
The empirical findings continue an on-going managed dialogue across energy markets, financial and capital markets and institutional investors, a dialogue that should lead to policy objectives regarding the role of those markets for future energy market developments and to the role of stakeholders’ role to achieving the policy objectives. In addition, the results are clearly interesting for regulators as well since they emphasize the need for a good investment climate, including coherent governance and regulatory structure, clear enforcement rules, property rights and a strong rule of law. The role of financial and capital markets is also important for the mitigation and carbon reduction strategies in a way that ensures resilience in key economic sectors. Their role becomes very critical for emission reductions and for efficient strategies of climate finance which should be linked to corporate and project governance requirements around risk disclosures. Finally, the results seem to be of interest for policy makers who should have active programmes of public (climate) finance to support, underpin and develop investment grade projects that mobilise private capital.
Beyond the general policy implications, it is possible to make more specific recommendations for both country groups. First, in G7 countries, in terms the banking sector, increased financial development leads to reduced energy consumption, implying that policymakers, while formulating their energy conservation strategies, should eliminate potential barriers firms may encounter while they need to access bank funding. Since in this manner both the goal of enhanced of energy efficiency and that of reduction of energy consumption may be meet. On the contrary, a banking sector-based financial development in emerging markets causes negative results in terms of energy consumption. Instead, financial development policies that result in an increase in the stock market total value gain importance. But, beyond that, these countries should prevent excessive and uncontrollable developments in the stock market due to the high negative impact of stock market capitalization on energy demand. The primary policy is to shift investments from the stock market to the banking sector, using tools such as interest rates and reserve requirements. Therefore, an increase in interest rates and reduction of required reserves may serve this purpose.
Overall, the results highlight the need for policymakers to take financial development explicitly into consideration when formulating energy policies. Financial development with respect to capital markets is substantially important to business investments because it allows businesses access to additional sources of funding and equity financing. In terms of financial development related to the banking sector, increased financial development leads to reduced energy consumption, implying that policymakers, while formulating their energy conservation strategies, should eliminate potential barriers firms may encounter while they need to access bank funding, since in this manner both the goal of energy efficiency and that of reduced energy consumption can be met. As a future investigation, we believe that the nexus among disaggregated financial development, energy consumption and growth is at the beginning and researches can scrutinize this nexus with precision.
Footnotes
Declaration of conflicting interests
The author(s) declared no potential conflicts of interest with respect to the research, authorship, and/or publication of this article.
Funding
The author(s) received no financial support for the research, authorship, and/or publication of this article.