



Abstract
The study aims to compare CO2 emissions, renewable energy, trade openness, gross domestic product (GDP), financial development (FD), and remittance in selected G-20 countries. The study carried out fully modified ordinary least square (FMOLS) and dynamic ordinary least square (DOLS) models for estimation covering annual data from the year 1990–2019. LM tests detected the cross-section dependency while stationarity of the variables was checked through Levin-Lin-Chu and Im-Pesaran-Shin tests along with Hansen's Covariate-Augmented Dickey Fuller (CADF) test in the presence of cross-section dependency. The panel unit root tests reported that all variables became stationary after converting them into the first difference. The Panel Cointegration and Wester-Lund test examined the existence of long-run equilibrium nexus among selected variables in the context of G-20 countries. The study's findings show that there is a significant and negative relationship between renewable energy and CO2 emissions. It was proven in two models that the economic growth of selected G-20 countries has a positive relationship with CO2 emissions. Furthermore, findings indicate that the coefficient of financial development is positive and significantly impacts CO2 emissions. The remittances have a significant positive effect on CO2 emissions, while trade openness has an insignificant impact on CO2 emissions in both models. This research will enlighten policymakers, researchers, governments, and environmentalists toward attaining a sustainable environment by wisely consuming remittances and renewable energy resources.
Introduction
In the present era, development attempts are being made to increase and focus on economic growth and achieve environmentally friendly economic growth. There is a strong nexus between economic activities and a reverse impact on environmental standards, and scientists agree that economic activities cause environmental degradation. According to past studies, energy consumption increases with an increase in economic activities, and this gush consumption of energy produces more carbon dioxide (CO2) emission, which leads to environmental degradation. According to Mardni et al., 1 the world economy would face a severe problem of increasing CO2 emission by 2050. They argue that CO2 emission is expected to increase by 0.8% in high income-level economies and 3.6% in low income-level nations. As a result, global energy consumption is predicted to increase by 80%, and greenhouse gas emissions are expected to grow rapidly by 50% in a similar period. These findings are in favor of Kahouli, 2 Nkengfack and Kaffo, 3 and Erdoğan et al., 4 who argue that as nations become more industrialized, they spend more resources, which leads to environmental degradation. The association between environmental degradation and other economic factors has been extensively researched in current decades. The discussion is yet in progress, and even at the G-20 economic stage, there are several different views about what the G-20 can do. Mardani et al. 1 studied CO2 emissions, energy use, and economic growth for 1962 and 2016 in the G-20. In this analysis, the energy use and economic growth of the countries affected by CO2 emissions significantly predicted the emission of CO2 to the atmosphere. The danger to nature and society in the 21st century is seen as immense in climate change. 5 As global warming was increased, climate change has been the main concern for scientists around the globe. Global warming is caused by the dramatic changes perceived to be the main threat. 6 Global warming is primarily due to rising average earth surface temperature from over-emission of greenhouse gases such as carbon dioxide (CO2). Efforts have been made to achieve eco-friendly economic growth instead of increase while just focusing on growth. There is a clear connection between economic activity and its opposite effect on existing literature's environmental standards. There is an accord among researchers that economic activity contributes to the deterioration of the environment. Established and developing economies are jointly taking steps to reduce the problem of CO2. Climate warming has appeared as a key part of national and foreign policy discussions. Environmental issues are not just the main environmental issues but also economic and political ones. The main aim of the global war against adverse global environmental transformation is to lower CO2 emissions globally. The inflow of FDI has increased speedily in almost every area of the world, especially in G-20 countries. As the world economy was growing, the global environment has been rapidly worsening. Thus, the macro-level impacts of investment and trade on the environment must be fully understood. Greenhouse gas (GHG) emissions are the main cause of global warming. G-20 countries are now addressing environmental issues due to global warming and extreme climate change conditions in the face of increasing concern for viable economic growth. Most of the G-20 countries' organizations are taking some successful initiatives and cooperation to control global warming's adverse effects and are committed to reducing CO2 emissions. In the past few years, India has decreased its CO2 intensity by 35% to fulfill the ambitious goal of minimizing environmental degradation. This study aims to test the effect of remittance, economic growth, financial development, trade openness, and energy consumption on CO2 in G-20 countries. This study examines the nexus among remittance, financial development, trade openness, GDP, renewable energy consumption, and CO2 emissions in G-20 using dynamic panel data from 1990 to 2019. The nexus between remittance and CO2 emissions were not explored in the G-20 countries in previous literature. The previous literature describes that most studies have ignored identifying the cross-section dependency issues in panel dynamic data analysis. This research is more unlike and comprehensive than prior researches in several ways. Firstly, this research attempts to identify the nexus amid remittance and CO2 emissions first time in chosen G-20 countries. Secondly, the study has tested cross-section dependency problems and was detected by Breusch Pagan LM, Pesaran scaled LM, and Bia-corrected scaled LM tests, while stationarity of the variables was checked through Levin-Lin-Chu and Im-Pesaran-Shin tests along with the second-generation test, i.e., CADF test in the presence of cross-section dependency. In detecting cross-section dependency, the Wester Lund cointegration approach is conducted to explore the long-term nexus. Comprehensively, a methodology is explained as the data is a dynamic panel, and the primary step is to test the stationarity of variables. For checking the stationarity problem, the Levin-Lin-Chu test is used, and for cointegration, Pedroni and Kao tests are used. For model estimation, we employ the FMOLS model, but DOLS is also performed for robustification.
Review of literature
The debate and investigation of the relationship amid economic and energy consumption determinants by utilizing different econometric techniques started with Kraft and Kraft. 7 Most of the earlier study targets the developed nations because their data is readily available compared to developing and underdeveloped economies. This research aims to analyze both the short and long-run association amid environmental pollution and economic variables. We have identified the influence of economic indicators on CO2 in selected G-20 countries. Amri 8 tested the EKC hypothesis for 1980 to 2011 in Algeria by governing renewable and nonrenewable energy consumption. The findings ensure the occurrence of the environmental Kuznets curve. They argued that RE's impact upon carbon dioxide is not significant in Algeria because of the significantly less share of RE sources to that of total energy consumption. Isık et al. 9 verified the EKC hypothesis for ten united states having the maximum levels of CO2 emissions by employing panel data techniques and robustification of the cross-section dependence in their analysis. They found that the inverted U-shaped hypothesis is only helpful for Florida, Illinois, Michigan, New York, and Ohio. Simultaneously, negative influences of fossil energy consumption on carbon dioxide in Texas, which is considered a top oil-producing state in the US, were statistically insignificant.10,11
Energy works as the building block upon modernized economic development, but the environmental damages by energy growth cannot be denied. Energy consumption is pivotal for developing economic growth activities, but the future of a sustainable environment has lied in renewable energy consumption. Consequently, alternative energy resources with environmentally friendly consumption ways are focused on every nation, region, community, and institution. The expenditure of research and development on renewable & nonrenewable energy consumption can help to sustain the environment. Moreover, the positive nexus of RE consumption in Florida was significantly less than the other states of the US.11–15 Although the research was carried out in different states of the same republic, the findings were contradictory. These conflicting findings exhibit that energy-growth-emission discussion is a never-ending and alarming issue for an investigation. Mahmood et al. 16 examined the nexus between environmental impacts of economic growth and energy consumption in Saudi Arabia using 1968 –2014. The conclusions report a positive and significant nexus between energy consumption, economic development, and CO2 emissions in both the long-term and short-term. This implies that an upsurge in economic growth and energy consumption in the United Kingdom had social costs on the economy in pollution.17–19 Waheed et al. 20 performed a study on both a single economy and multi-economies and investigated nexus amid economic growth, energy consumption, and CO2 emission. Findings conclude no association between carbon emission and economic development in developed economies.21–23 However, it was proved that higher energy consumption plays a significant role in emitting elevated CO2 in developed economies. Sobia Salamat et al. 24 performed a study on the association amid trade, CO2 emissions, and RE in Pakistan. This research conducted a simultaneous equation approach using the 1998–2017 period for empirical analysis. The conclusion reported that an upsurge in trade volume leads to increased CO2 emissions in Pakistan. There was a bi-directional causality amid RE and CO2 emissions in Pakistan and India during a single country analysis.25,26 However, in India's case, emissions of CO2 rise with an increase of openness of trade and economic growth.
In current eras, novel studies have been performed to review the nexus among FD and emissions of CO2 for diverse states. Other research tested the association between income, FD, trade, and CO2 by applying dynamic panel data in India. The conclusion reported that there exists a positive nexus amid financial development and CO2. Ozturk, I. and A. Acaravci 27 studied the cointegration between GDP and consumption of energy, FD, and trade openness in Turkey. They indicated that emissions of carbon started decreasing while receiving per capita threshold level. However, there exists no link between FD and emissions of CO2 in the long term. Tamazian et al. 28 explore the connection between financial development and emissions CO2 in BRICS economies. They conclude that FD contributes to CO2.
The current study tested by Ahmad et al. 29 explores the nexus amongst the emissions of CO2 and financial development in economic and RE growth in China's context using the period of 1980–2014. This research first performed the NARDL model to grasp asymmetry raised from positive or negative components of FD. The ARDL bound test results indicate a cointegration and positive nexus amid CO2 emissions, FD, economic growth, and RE. Moreover, the short-run relationship is reported by the error correction model (ECM) amid emissions of CO2, FD, economic development, and energy consumption. A study conducted by Ahmad et al. 29 attempted to create a new theoretical framework that examines how the inflow of remittances leads to a rise in carbon emissions. They assumed no direct association between the inflows of remittances and CO2 emissions, but carbon emissions are increased indirectly through five different stages. They identified the link between remittances inflow and CO2 emissions after forming a theoretical framework. The findings of the NARDL bound test report that the influx of remittances is cointegrated with CO2 emissions. On the other side, the Wald test concluded an asymmetric nexus amid remittances and CO2 emissions in both the short and long term. They figured that a positive component's impacts are more significant than the influence of a harmful element of remittances on CO2 emission. A study carried by Rahman et al. 30 identified the nexus between remittance and CO2. They found that CO2 emission increases significantly with an increase in remittance inflow in the short-run and long-run in Sri Lanka, Philippines, Pakistan, and Bangladesh.
In contrast, this effect is not significant in the short term in the context of Bangladesh. I comparison, the inflow of FDI is significantly and positively associated with CO2 emission in Sri-Lanka, India, and China in the short-term and long-term, supporting the pollution haven hypothesis in these states. In contrast, the result is insignificant for other countries, for instance, the Philippines, Pakistan, and Bangladesh. Thus, the findings reveal a significant and negative nexus between FDI and the release of CO2 for Bangladesh both in the long and short run, hence approving the pollution halo hypothesis.
Data and methodology
Data
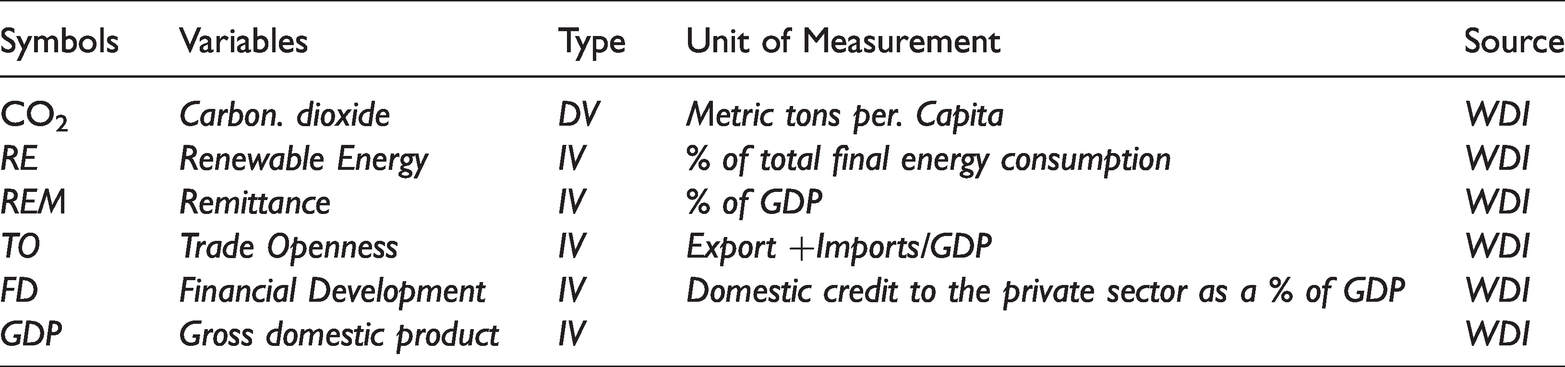
This research attempts to identify the nexus among remittance, trade openness, GDP, financial development, renewable energy consumption, and CO2 emissions by utilizing the FMOLS model and DOLS model in selected G-20 nations using panel dynamic data 1990 to 2019. Data on remittance, trade openness, GDP, FD, renewable energy consumption, and CO2 emissions are gathered from WDI. CO2 emissions are taken as a dependent variable which is calculated in metric tons of oil equivalent. While explanatory variables selected for the empirical research are trade openness measured as export + import/GDP. In contrast, GDP is the gross domestic product, and renewable energy is computed as % of total final energy consumption. Financial development is measured as domestic credit to the private sector as a % of GDP, and remittance is measured as % of GDP. The seven G-20 countries, namely Argentina, Australia, Brazil, Canada, Japan, Turkey, and Russia, are selected according to data availability (Table 1).
Measurement of variables.
Methodology
This study explores the proper dynamic panel data analysis of CO2 emissions and remittance-nexus in selected G-20 countries and represents only the first time. The main points are clearly outlined, and some details follow. First, the data is analyzed descriptively to explain the characteristics of the data. Then the information is pre-processed and analyzed to make informed decisions regarding pre-processing and estimation. It is necessary to check for stationarity in a time series before proceeding with a cointegration test since results would be inaccurate if a time series is not stationary. If all the variables start at the same point at the beginning of the dataset, then Pedroni and Wester's tests are applied. Pedroni's “cointegration” test measures four within-group and three between-group “cointegration” statistics. The Pedroni test is commonly used but does not account for cross-sectional panel dependency. As a result, the other method for estimating four-panel cointegrations is the Wester Lund test, which approximates four-panel cointegrations. Two of the measured statistics (Gt and Ga), while the others (Pt and Pa) to the panel. Following the determination of the long-run relationships, the long-run coefficients are calculated. The paper explores the use of the Completely Modified OLS and DOLS parametric methods in parameter estimation. For the robustification, we will employ two models, i.e., FMOLS and DOLS method developed by Pedroni,; 31 regression is formulated as follows:
The association can be expressed in the following manner

In regression form,

Where
Stationarity tests and cross-sectional independence test
Before checking the stationary properties of remittances, trade openness, GDP, FD, renewable energy consumption, and CO2 emissions, this analysis investigates whether there is a cross-sectional dependence within each panel series of the corresponding time series results. The errors can occur because of the cross-sectional dependence; this issue must be taken into consideration. However, to do this, you would have to remove the cross-sectional dependency in panel unit root experiments such as Levin et al.
32
and Im et al.
33
To assess the unit root's presence, the tests to define the first-generation unit root should be performed first. In that case, second-generation unit root tests such as SURADF, CADF, and CIPS must be run. Cross-sectional dependence can be implemented in the sense of a linear panel. In economics, it means that in a situation where there is an economic shock, then the associated goods and services are also affected. Various tests are performed to assess the cross-sectional dependence in panel data. We will use Breusch Pagan Correction for measurement error. Without time-series stationarity, you can't do ARMA models. In this case, the panel unit and second-generation unit tests are applied (1). When all the structures are stationary on the first difference, then a panel-autoregressive method can be used.

Where
Unit root tests are used for cross-section data. The test uses ADF statistics with averaged data across groups. For example, the average of the t-statistics for P1 from the individual augmented dicky fuller regressions tiTi (Pi).

And the t-bar is normalized, and it goes back to being a normal distribution as N and T increase towards infinity. IPS 1997 recommends the t-bar test is more stable when N and T are less in the panel model. When constructing their cross-sectionally version of unit root tests, they created a common time feature that is contained in errors of diverse regressions.
Panel cointegration tests
The linear combination can be stationary unless two non-stationary series are separated. In the language of economics, two variables would be cointegrated if they have a long-run association or equilibrium association between them”. 34 The linear combinations of non-stationary series may cause spurious regressions to be estimated, with the estimated coefficients partially calculated. 34 First of all, it is vital to know the unit root order for panel cointegration testing in the sequence. Co-integration panel testing can only be done between a series of the same integration order. Secondly, if the presence of panel co-integration is confirmed, then to explore the long-run nexus, this paper conducted two tests to examine the long-run association called the Padroni test and the Kao test. However, in cross-dependency, this study also performs Wester Lund, 35 Panel cointegration tests to explore the long-run association. This test assesses whether panel data suits a cointegration. The findings of Wester Lund 35 are strong in small samples. This test is the method for deciding whether cross-sectional dependence exists.
H0: No cointegration
H1: Cointegration exists
This paper will employ the panel FMOLS model and DOLS if the above tests demonstrate a cointegration among the variables.
Panel fully Modified-OLS and Dynamic-OLS
After finding long-term relationships among the panel set, the size and sign of these relationships must be assessed. In other words, only the presence of long-term relations between eight models was verified by the co-integration analysis. To allow definitions and correlations, quantitative values are essential. The OLS and dynamic OLS approaches are defined as parametric approaches in the estimation literature on tables, whereas the OLS approach is not a parametric approach for FM (fully modified). There was no consensus among researchers in the panel root and cointegration tests on estimating less biological and robust coefficients works better. As Kao and Chiang 36 described in the study, FMOLS appears to be more representative than DOLS. For more than 60 observations, Banerjee 37 found that DOLS and FMOLS are asymptotically equivalent. The panel will utilize an OLS technique and a dynamic ordinary least squares approach created by Pedroni to address this issue. The least-square estimators of FMOL and DOLS were developed after using the least square method of series with a long-term relationship showed deviated values. The non-parametric histogram equalization and endogeneity correction methods used in FMOLS correct the autocorrelation and endogeneity problems.
FMOLS Pedroni’s estimator is constructed as follows


As the covariance matrix can be broken down as
Data analysis
Before analyzing panel data, a detailed statistical analysis of the selected variables is carried out in selected G-20 countries (Argentina, Australia, Brazil, Canada, Japan, Turkey, and Russia). Table 1 shows the descriptive statistics and reveals that RE growth's mean value is 9.634127 with a standard deviation of 6.103442. The average value for RE is 17.99823 along with a standard deviation of 15.09409, the mean value for FD is 94.34374, along the standard deviation of 60.18404, the mean value for REM is 0.131681 with a standard deviation of 0.125043 (Tables 2 and 3).
Descriptive statistics.

Cross-section dependence tests.

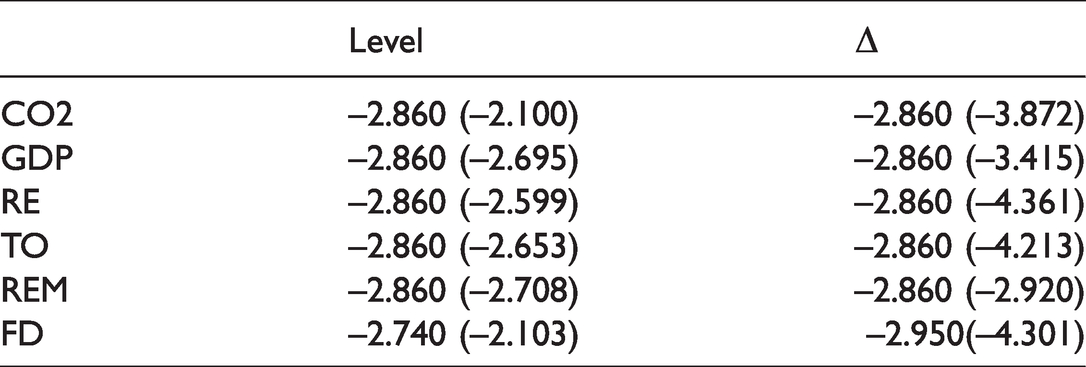
Before analyzing the stationarity of the series, the cross-sectional dependence of the series was examined. The findings can be seen in the table. The primary hypothesis cannot be dismissed, according to the results. Cross-section dependence occurs. The stationary conditions of the series have been studied after examining the cross-sectional dependence of the series. Table 2 indicates that the sequence is not fixed at the stage of the series. It was noted that the first differences in the line provided stationarity. The results obtained from first-generation tests lose their validity in the case of cross-sectional dependence.
For this reason, with CADF along with first-generation tests, the stationarity of the series was reconsidered. According to above to the table, p-values are statistically significant for all the tests. Therefore, it is concluded that there is cross-section dependence in our model (Table 4).
Stationarity tests.

Levin-Lin-Chu and Im-Pesaran-Shin tested the stationarity of the variables, and the findings of the two experiments indicate that CO2 was not stationary at the stage but became stationary at the first difference. Likewise, renewable energy (RE) was checked by Levin-Lin-Chu and Im-Pesaran-Shin tests and was not stationary at I(0) but stayed stationary at 1st difference. GDP was not set at the level. Similarly, TOP was non-stationary at levels but transformed to the first difference when they became stationary. All variables were non-stationary at levels, thus translating them to the first difference became stationary. Accordingly, this analysis concluded that all variables are stationary at the first difference stage. Hence, it gives room to employ Padroni and KAO cointegration tests for long-run association.
Results from panel unit root test
This research first checks for cross-sectional dependence by applying Pesaran's CD test to examine integration properties of remittance, trade openness, GDP, FD, renewable energy use, and CO2 emissions. Due to the panel data, the CADF panel unit root test of Pesaran 38 should favor other traditional panel unit root tests because it does not assume there is no dependence across the panel. Therefore, the CADF panel can be used in cross-section situations. CADF analysis was used to evaluate the stationary characteristics of remittance, trade transparency, GDP, FD, renewable energy usage, and CO2 emissions sequence. Although the unit root test results for all units in the panel are smaller than the essential values of the test based on the uniform residuals, the null hypothesis indicating the presence of unit root cannot be dismissed. That is why there is no stationary structure in any of the countries comprising the panel. Therefore, converting them into the first difference becomes stationary (Table 5).
CADF test.
Within-dimension.
Kao residual cointegration test.

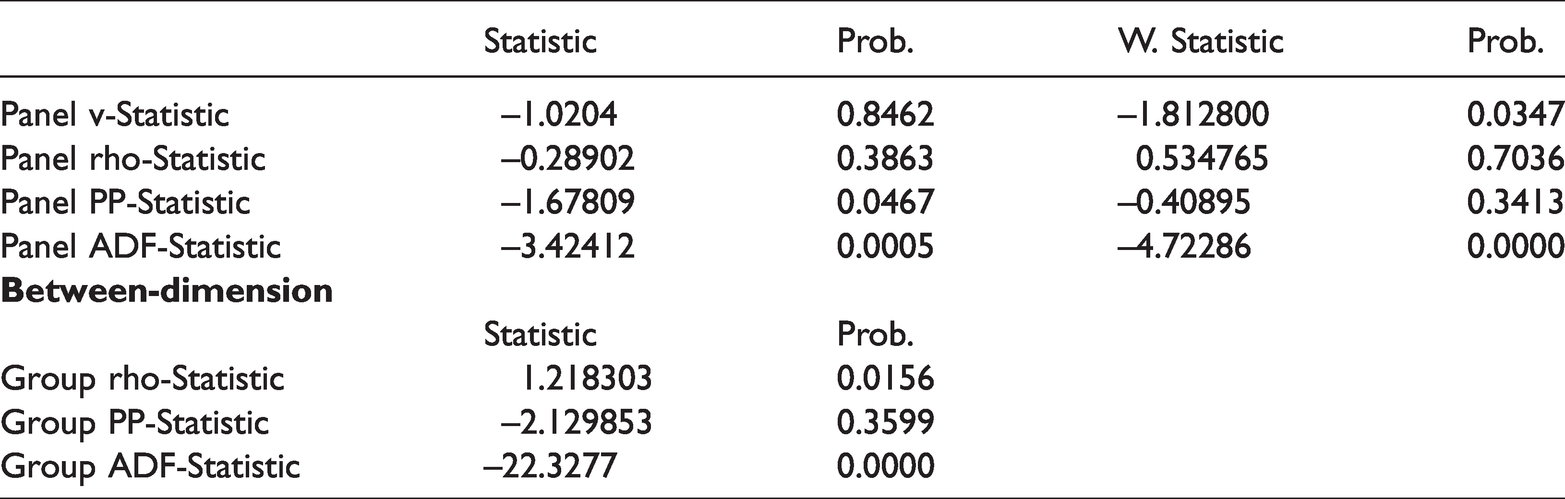
Padroni cointegration test (Table 6)
Cointegration test (Table 7)
The analysis concludes that all the factors being analyzed are fully integrated into order one. First, though, the cointegration test is executed to govern whether there is a long-run association between the variables. After panel unit root tests, cointegration tests are employed to identify the long-run connection between RE, GDP, FD, TO, REM, and CO2. Hence for this aim, we apply Pedroni, 31 and Kao, 36 tests. In agreement with the unit root tests, Padroni and KAO cointegration tests are used. Pedroni31,39 developed the cointegration test to calculate four within-group and two between-group cointegration statistics. According to the Pedroni test result, most of the tests reject the null hypotheses of no cointegration and describe a long-run association between CO2 and other underlying variables. For the robustification, we employed the Kao test, and the Kao test reconfirms the result. The Kao test also discovered that CO2 and its determinants are associated in the long run. In other words, we can conclude that there is a stable long-run connection between carbon dioxide emissions and financial development, gross domestic product, trade openness, remittance, and renewable energy (Table 8).
Wester Lund cointegration test.

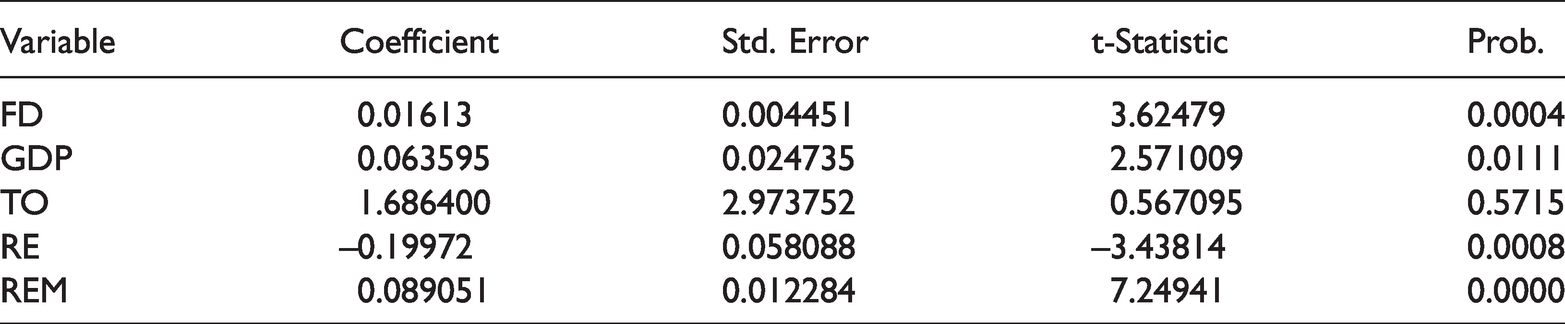
Method: Panel fully modified least squares (FMOLS) dependent variable (CO2).
Method: Panel dynamic least squares (DOLS) dependent variable (CO2).

The findings represent Wester Lund panel cointegration test outcomes, and results specify that the null hypothesis is rejected. It means that the p-value is less than 5%, suggesting a long-run association between CO2 and REM, TO, GDP, FD, and RE.
FMOLS table (Table 9)
DOLS table (Table 10)
Results of FMOLS and DOLS
As per FMOLS and DOLS results, the table indicates the influences of the particular carbon emissions variables. Therefore, the coefficient of renewable energy is negative and highly significant at the 1 percent level. This proposes that an upsurge in renewable energy will reduce carbon dioxide emissions directly. Our results are in line with the work of. 40 On the contrary, remittances have a substantial positive effect on CO2 in G-20 countries; as per previous studies, many immigrants of such countries go to foreign countries, particularly to the American and Canadian send return their money to their home countries. Most of the time, these immigrants do not send money through regular channels, such as banks, so financial development is not improved. However, this investment causes economic growth and improves the individuals’ per capita income, producing high demands for energy that can damage the environment. The findings for FMOLS and DOLS indicate that the financial development coefficients are positive and have a considerable effect on CO2 emissions.
Consequently, a 1 percent rise in financial development leads to a 0.01613% upsurge in CO2 emissions in G-20 countries. 2 emissions. This implies that the banking sectors in chosen G-20 countries do not indulge in green banking or environmentally sustainable investment and do not prefer specific manufacturing sectors that use renewable energy sources. As a result, financial changes are taking place in selected G-20 countries at the expense of rising CO2 emissions.
On the other side, there is a positive and substantial connection between GDP and CO2 emissions. More specifically, an increase of 1% in GDP corresponds to a rise of 0.063595 percent in CO2 emissions. As the GDP coefficient is positive and confirmed in the two models, the economic growth of G-20 countries has a positive connection with the CO2 emissions. On the other side, the variable of trade openness has an insignificant impact on CO2 emissions in both models in the selected G-20 countries. We performed two models for the robustification, i.e., fully modified-OLS and Dynamic-OLS, to estimate variables in selected G-20 countries. The FMOLS and DOLS results match to a great extent in the case of selected G-20 countries (Argentina, Australia, Brazil, Canada, Japan, Turkey, and Russia). In other words, both FMOLS and DOLS provide the same results for coefficient signs and significance in the case of selected G-20 countries (Argentina, Australia, Brazil, Canada, Japan, Turkey, and Russia).
Discussion
This research demonstrates the relationship between CO2 emissions, renewable energy, trade openness, gross domestic product (GDP), financial development (FD), and remittance in selected G-20 countries from 1990 to 2019. To check the relationship between variables chosen and environmental sustainability, Fully Modified Ordinary Least Square (FMOLS) and Dynamic Ordinary Least Square (DOLS) models are employed. The cross dependency and stationarity of analytical data are checked by the LM test and PURTs (panel unit root tests). The panel cointegration and Wester-Lund test are used to confirm the long-run relationship among selected variables and CO2 emissions. The study's findings show a significant and negative nexus between renewable energy and CO2 emissions in selected G-20 countries. It was proven in two models that the economic growth of selected G-20 countries has a positive relationship with CO2 emissions.
Furthermore, findings indicate that the coefficient of financial development is positive and significantly impacts CO2 emissions. On the other hand, remittances have a significant positive effect on CO2 emissions. Further, the variable of trade openness has an insignificant impact on CO2 emissions in both models in the selected G-20 countries. Environmental degradation can be removed by maintain green policies and using green technology for productive activities. The leading nations of the world in the Paris Climate Conference (COP21) agreed to join hands to ensure the sustainability of the environment and deal with the challenges of climate. Unfortunately, the United States abandoned to be part of the Paris agreement, so the European Union, with the collaboration of China, had tried to reunite the international countries to overcome the degradation of environmental pollution. In the current era, people are fully aware of the significance of environmental sustainability.
Conclusion and policy implications
This study seeks to establish a new theoretical framework that describes how remittances' inflow triggers an increase in carbon emissions. The hypothesis is based on the premise that inflows of remittances have a positive impact on CO2 emissions. Even though many types of research have examined the determinants of CO2 emissions, one criticism associated with the prevailing literature is selecting data. Most of the research scholars apply aggregate energy consumption in the previous studies. The choice of panel estimation techniques chosen for analysis is also criticized in most studies. Panel methods are used in almost all studies that ignore cross-sectional dependence. Ignoring the issue of cross-sectional dependence may result in forecasting errors. This study attempts to identify the nexus between remittance, trade openness, GDP, financial development, renewable energy consumption, and CO2 emissions by utilizing the FMOLS model and DOLS model in selected G-20 countries using panel dynamic data 1990 to 2019. The findings of the paper may be summarized as under. The LM tests noticed the existence of cross-sectional dependence in each time-series panel. The second-generation CADF unit root test shows that the study's variables became stationary at first difference. In this study, the variables' stationarity was also checked through Levin-Lin-Chu and Im-Pesaran tests and concluded that all variables become stationary on 1st difference. The stationarity tests reported that all variables are stationary at the first difference, and it gives room to employ cointegration tests for long-run nexus.
The Padroni and Kao cointegration tests indicated a long-run equilibrium among remittance, trade openness, GDP, financial development, renewable energy consumption, and CO2 emissions. Furthermore, for the robustification and cross-section dependency purpose, the wester-Lund cointegration test was also performed after padroni and Kao cointegration tests and concluded that remittance, trade openness, GDP, financial development, renewable energy consumption, and CO2 emissions are cointegrated and thus have a long-run association.
Furthermore, the FMOLS and DOLS methods were performed to test the nexus. The paper's findings show a negative and significant nexus between renewable energy and CO2 emissions in elected G-20 countries. The results of the paper show that there is a substantial and positive nexus between GDP and CO2 emissions. Two models confirmed that selected G-20 countries' economic growth has a positive association with CO2 emissions. The findings for FMOLS and DOLS indicate that the coefficient of financial development is positive and significantly impacts CO2 emissions.
Consequently, a 1% growth in financial development leads to a 0.01613% rise in CO2 emissions in G-20 countries. This implies that the banking sectors in chosen G-20 nations do not participate in green banking or environmentally friendly investment and do not prefer those industrial sectors that use renewable energy sources.
On the contrary, remittances have a substantial positive effect on CO2 in the case of G-20 countries, as according to different studies, a large number of immigrants of such countries go to foreign countries, especially to the American and Canadian countries, and send return their money to their home countries. Most of the time, these immigrants do not send money through regular channels, for example, banks. This investment causes economic growth and improves the individuals’ per capita income, producing high demands for energy that can damage the environment.
On the other hand, the variable of trade openness has an insignificant impact on CO2 emissions in both models in the selected G-20 countries. Therefore, we performed two models for the robustification, i.e., fully modified-OLS and Dynamic-OLS, to estimate variables in selected G-20 countries. The FMOLS and DOLS results match to a great extent in the case of selected G-20 countries (Argentina, Australia, Brazil, Canada, Japan, Turkey, and Russia). In other words, both FMOLS and DOLS provide the same results concerning coefficient signs and significance in the case of selected G-20 countries (Argentina, Australia, Brazil, Canada, Japan, Turkey, and Russia).
The findings of the study have several significant policy implications. First, even though other research studies found that financial development could decrease CO2 emissions in various countries, our research investigates the opposite. In the case of selected G-20 countries that we have examined, the positive nexus between financial development and CO2 emissions may suggest that firms should expand their production through credit rather than developing energy-saving technologies. This aspect should increase concerns with the policymakers regarding the environmental impacts of financial development. Other actions could be taken, including supporting the growth of energy creation like renewable sources, i.e., hydro, solar, and wind, or assigning aids for adopting “green” technologies. Governments should emphasize those strategies that mix economic incentives with regulatory measures to mitigate CO2 emissions in the interval. This research has shown that considerable output growth contributes to higher fossil fuel usage, paying higher emissions levels. The results have significant functional and policy significance. The need to convert low-carbon technology to mitigate deforestation and sustainable economic development cannot be overstressed because they keep the economy green and protect the atmosphere for future generations. One of the main benefits of encouraging energy efficiency is that it is beneficial for both the atmosphere and the economy, promoting energy stability and lower CO2 emissions.
Footnotes
Declaration of conflicting interests
The author(s) declared no potential conflicts of interest with respect to the research, authorship, and/or publication of this article.
Funding
The author(s) disclosed receipt of the following financial support for the research, authorship, and/or publication of this article: This paper is partly supported by “National Social Science Foundation of China (No. 19ZDA081).
