



Abstract
For a few decades, factors affecting environmental deterioration have been at the center of much interest This paper examines the impact of income level, disaggregated energy consumption, types of globalization level, and urbanization on per capita ecological footprint by utilizing novel machine learning techniques (tree regression, boosting, bagging, and random forest) for 27 OECD countries during 1971–2016. It is found that the random forest algorithms best fit the dataset. The empirical results exhibit that oil product consumption, electricity consumption, and gross domestic product are the most significant variables for our model. Besides, the partial dependence plots results show that economic growth and especially fossil fuel energy consumption damage the environment. These findings have important implications for both developed and developing countries for designing proper energy and environmental policies. Especially, policymakers should focus on sustainable development instead of plain economic growth.
Keywords
Introduction
For several decades, scientists have discussed global warming, climate change, and their consequences on society and the environment. Finally, these issues have been recognized by world public opinion, and it has been taken into action several international initiatives. For instance, in 1992, the United Nations organized a conference called the Rio Summit, and they accepted that there is an issue related to environmental deterioration in the world. After, the Kyoto Protocol was adopted in 1997 in order to mitigate greenhouse gas emissions, especially in developed countries. Then, the Paris Agreement was signed in 2015 to control an increase in the global temperature for the purpose of decreasing global warming. 1 Also, in 2015, the Sustainable Development Goals (SDGs) were adopted by United Nations to provide sustainable development including cleaner environment and more efficient use of energy. The 2021 United Nations Climate Change Conference (COP26) held in the United Kingdom to discuss how to combat with climate change. Recently, European Union countries introduced the European Green Deal which aims to make the union climate neutral in 2050.
As discussed above, for a few decades, environmental deterioration has been at the center of much interest Also, it is known that developed countries (including OECD countries) are primarily responsible for the high level of emission levels in the atmosphere. 2 Therefore, this study aims to investigate the factors affecting environmental quality in 27 OECD countries for the period 1971–2016. Factors affecting environmental degradation can be determined and effective policies can be designed with this investigation thanks to novel machine learning methods. The study utilizes annual longitudinal data and uses per capita ecological footprint as an ecological indicator, while per capita income, types of energy consumption (oil products, coal, natural gas, electricity, and renewable energy), dimensions of globalization (trade, financial, social, and political), and urbanization rate are determined as input variables. The aforementioned series are the most used variables as determinants of environmental pollution in the empirical literature. In addition, the research data are drawn from four primary sources: Global Footprint Network, World Bank, International Energy Agency (IEA), and KOF Swiss Economic Institute.
We choose OECD countries as the current study's sample since we believe that the reliability of these data can be higher than in developing countries. In some developing countries, governments have control over the statistical institutions and force them to declare faulty statistics. Furthermore, it is accepted that this set of countries are primarily responsible for the high level of emission levels in the world currently. 2 For this reason, these developed countries try to increase environmental quality through international initiatives such as the Kyoto Protocol, the Paris Agreement, and the European Green Deal. Therefore, their environmental actions and policies should be considered. Moreover, we try to work on a group of countries that share similar economic characteristics rather than geographical connections because the economic properties of countries have a more prominent role in environmental degradation. As known, most of the OECD countries have high-income levels except a few. For the above-mentioned reasons, we focus on OECD countries in this study.
The present study has shed a contemporary light on the contentious issue of the impact of economic variables on environmental deterioration through various machine learning techniques (tree regression, boosting, bagging, and random forest). These techniques have many advantages compared to conventional econometric methods. For instance, machine learning algorithms provide lots of instruments to capture nonlinear relationships in the data, 3 and they allow functional form flexibility. 4 Besides, they perform more efficiently handling a large dataset in comparison to other empirical methods. 5 Lastly, there is no need for a priori assumption on theoretical links and distribution of the variables.6,7
To our knowledge, the present research explores, for the first time, the effects of income level, energy consumption, globalization, and urbanization on the ecological footprint for OECD countries through a bunch of machine learning techniques. There are only a few initiatives that examine the determinants of ecological footprint using similar methods in the empirical literature; Sun, 8 Janković et al., 9 Roumiani and Mofidi, 10 and Yu. 11 In these studies, Sun 8 finds that the random forest methodology is the best algorithm for the model examined, among others, and energy structure, energy efficiency, energy intensity, and economic development affect energy carbon footprint in Liaoning province for the period 1998–2016. Besides, Janković et al.'s 9 results for random forest algorithm show that coal, oil, and natural gas consumption are the most significant factors affecting ecological footprint for 41 countries covering the period 1971–2014. Roumiani and Mofidi 10 conducted a few machine learning techniques to determine which variables can affect the ecological footprint significantly of G20 countries during 1999–2018. According to the LASSO (least absolute shrinkage and selection operator) method results, carbon dioxide emissions, gross fixed capital formation, and gross domestic product were determined as the most significant variables for ecological footprint. Recently, Yu 11 found that GDP, energy consumption, and total retail of consumer goods are the most significant factors for projections of ecological footprint in China.
The remaining part of the paper proceeds as follows: Section 2 presents the empirical literature, while Section 3 introduces the dataset and discusses the specific methods by which the study and analyses were conducted. Section 4 highlights the empirical results and discusses the results, while the final section concludes the current research.
Literature review
This section summarizes the literature on the determinants of environmental deterioration, primarily focusing on the ecological footprint as a degradation index.
Income level
The effect of income level on the environment can be linear or nonlinear (quadratic or cubic). Its impact can be affected by various factors, including the structure of the economy and the environmental consciousness of citizens, firms, and governments.
Among the studies considering time-series analyses, Saboori et al. 12 conducted an ARDL methodology to find the relationship between these variables for ten OPEC countries covering the period 1977–2008. They found that the EKC hypothesis was valid for Algeria, Iraq, Kuwait, Nigeria, Qatar, and Venezuela. Also, Mrabet et al. 13 and Danish et al. 14 employed the same method for the Qatari (1980–2011) and Pakistani (1971–2014) economies, respectively. They found that an increase in income level damage the environment. Besides, Hassan et al. 15 found that the EKC hypothesis was confirmed for Pakistan in the long-run for the period 1970–2014.
Of the studies employing panel data analyses, Al-Mulali et al. 16 and Ozturk et al. 17 utilized the GMM method to find the impact of GDP on the ecological footprint considering comprehensive samples; 93 and 144 countries, respectively. The former study demonstrated that the EKC hypothesis is valid for only upper-middle- and high-income countries. Besides, the second study supported Al-Mulali et al.'s (2015) findings regarding the above two income groups. In addition, the negative impact of the economic growth on environmental quality was confirmed by Uddin et al. 18 for the 27 highest emitting countries, Alola et al. 19 for 16 European Union countries. Furthermore, Aydin et al. 20 carried out the panel smooth transition regression considering 26 EU countries covering the period 1990–2013. Lastly, Awosusi et al. 21 found that an increase in income led to a rise in environmental pollution in BRICS countries for 1992–2018.
In addition to the above studies, some of the empirical papers focus on the OECD countries directly. Among these studies, Ulucak and Koçak 22 and Ozcan et al. 23 revealed that economic growth pollutes the environment in OECD countries. Besides, Ulucak et al.'s 24 findings backed up the validity of the EKC hypothesis for 26 OECD countries for the period 1980–2016. Contrarily, Destek and Sinha 25 found that there is a U-shaped link between these two variables for 24 OECD countries for the period examined.
Energy consumption
This subsection classifies the literature as non-renewable (including natural gas, oil products, coal, and electricity) and renewable energy consumption considering OECD countries.
In the empirical literature, there are a bunch of studies examined the effect of aggregate energy consumption on environmental deterioration. Among them, Destek and Sinha 25 conducted the ECM-based panel cointegration test for 24 OECD countries, and Ozcan et al. 23 used the PVAR (Panel Vector Autoregression) technique for 35 OECD countries, while Ulucak et al. 24 employed the Durbin-Hausman panel cointegration test for 26 OECD countries. Their empirical findings suggested that a rise in energy use causes environmental degradation in this set of countries.
Electricity consumption is one of the components of total energy consumption. Even if a significant amount of electricity is generated from renewable energy sources for a few decades, a remarkable amount is still generated from fossil fuel sources. Among the studies considering OECD countries, Ergün and Polat 26 found that CO2 emissions and electricity consumption is cointegrated in the long-run. Their findings supported the previous linkage between the aforementioned variables in the literature. They found that the coefficient of electricity consumption is positive and significant for 17 out of 30 countries. Besides, Lau et al.'s 27 findings suggested that electricity production generated from non-renewable sources affects the emission level positively, while electricity production generated from nuclear power has a negative effect on it. Besides, to our knowledge, there is not any study considering the effects of natural gas and coal on ecological footprint in OECD countries.
Among the studies considering OECD countries, the empirical results of Destek and Sinha 25 and Ulucak et al. 24 stated that an increase in renewable energy use mitigates ecological footprint according to the panel results. The country-specific FMOLS (Fully Modified Ordinary Least Squares) results of Destek and Sinha 25 showed that the negative relationship between these variables is confirmed for 14 out of 24 OECD countries. The coefficients are statistically insignificant for the remaining ten countries.
Globalization
In this subsection, the study provides an overview for the empirical literature on the impact of overall globalization and/or its components (trade, financial, social, and political) on environmental quality.
The impact of globalization on environmental pollution is ambiguous, according to the empirical literature. On the one side, empirical results of Shahbaz et al. 28 for African countries, Zafar et al. 29 for 27 OECD countries, Ansari et al. 30 for 22 countries, and Ibrahiem and Hanafy 31 for Egypt provided evidence for the positive impact of globalization on the environmental quality. On the other side, Sabir and Gorus 32 for South Asian countries, Etokakpan et al. 33 for Turkey (only in the long-run), Le and Ozturk 34 for 47 emerging economies, and Usman et al. 35 for the United States revealed that an increase in globalization level damages the environment. Recently, Awosusi et al. 21 revealed that an increase in globalization level caused a decline in ecological footprint in BRICS countries from 1992 to 2018.
In recent years, considerable literature has grown up around the theme of the dimensions of globalization. Among the preliminary studies, Destek and Ozsoy 36 found that an increase in economic globalization decreased CO2 emissions in Turkey for the period 1970–2010. Besides, Shahbaz et al.'s 37 results demonstrated that all dimensions of globalization affect the environmental quality negatively in the long-run. Also, Bilgili et al. 38 exhibited that financial, political, and trade globalization have a positive effect on environmental quality. Contrarily, it was found that economic and social globalization hurt the environment in Turkey. Langnel and Amegavi 39 found that environmental quality increases only when there is a rise in the political globalization index in Ghana. In addition, Suki et al.'s 40 empirical findings showed that an increase in overall globalization and economic globalization damages the environment, while social and political globalization help to heal the environment at higher quantiles. Recently, Ulucak et al. 41 suggested that financial globalization helps to increase environmental quality in emerging countries.
Urbanization
In the empirical literature, the impact of urbanization on environmental quality is expected negative. Also, most of the studies confirm this expectation, such as Destek and Ozsoy 36 for Turkey (in the long-run), Ozturk et al. 17 for 144 countries, Charfeddine 42 for the Qatari economy, Pata 43 for Turkey, Joshua et al. 44 for South Africa (in the long-run), Langnel and Amegavi 39 for Ghana, Ulucak et al. 41 for emerging economies, and Islam et al. 45 for Bangladesh. However, several studies are in favor of the opposite hypothesis; urbanization leads to an environmental improvement in the long-run. These studies can be listed as Shahbaz et al. 46 for South Africa, Hassan et al. 15 for Pakistan, and Ansari et al. 30 for 22 countries.
In addition, Beck and Joshi 47 utilized the GMM method for 22 OECD countries, while Alola et al. 48 used a panel quantile approach for 31 OECD countries. The former study supported the pollutive impact of urbanization on the environment for the period 1980–2008. The latter one also confirmed this relationship only at the higher quantiles.
Data and methodology
In this study, the research material uses quantitative data related to factors affecting per capita ecological footprint for 27 OECD countries, 1971–2016. For this purpose, the study collected publicly available data related to one output variable and eleven input variables; in other words, our sample consists of 14,904 observations. To process the research material collected, a bunch of tree-based machine learning techniques is utilized: tree regression, bagging, boosting, and random forest
Data presentation
This study sets out to shine new light on the determinants of environmental degradation by employing machine learning techniques for 27 OECD countries. These countries can be listed as follows: Australia, Austria, Belgium, Canada, Chile, Denmark, Finland, France, Germany, Greece, Ireland, Israel, Italy, Japan, Korea Republic, Luxembourg, Mexico, Netherlands, New Zealand, Norway, Portugal, Spain, Sweden, Switzerland, Turkey, the United Kingdom, and the United States. This investigation utilizes the annual panel data from 1971 to 2016 to determine the most significant factors affecting environmental quality in this group of countries. For that purpose, this study uses per capita ecological footprint as an ecological indicator. Besides, we choose the main 11 variables that can affect environmental quality according to data availability. Also, these series are the most used variables as determinants of environmental pollution in the empirical literature.
The research data in this study are drawn from four main sources: Global Footprint Network, World Bank, International Energy Agency, and KOF Swiss Economic Institute. Table A.1 in the appendix presents the variables used in this study with their units, forms, and sources. All the variables except the urbanization rate and the globalization indices are on a per capita basis. In addition, we take the natural logarithm of each of the variables except per capita coal, natural gas, renewable energy consumption (these three series include zero values).
Empirical methodology
Machine learning techniques have started to gain importance in the field of applied economics for a few decades. These techniques aim to make a good prediction of the target variable using a set of features (predictors). They have substantial advantages over traditional statistical and/or econometric techniques. First, they provide a set of tools to capture nonlinear relationships in the data. 3 That is, as Athey 4 stated that, it allows functional form flexibility, unlike the conventional methods. Second, they perform more efficiently dealing with a large volume of datasets compared to traditional techniques. 5 Last but not least, there is no need for a priori assumption or judgment on theoretical links and distribution of the variables.6,7 This paper focuses on four main machine learning algorithms: tree regression, bagging, boosting, and random forest All of these are tree-based algorithms.
First, the sample is divided into subsamples to get a higher level of purity in the target variable according to the regression tree prediction. For this purpose, if-then statements are taken into consideration, and the dataset is split according to the observed value of the input variables properly. 6 This splitting process ends when all final nodes become terminal nodes. 49 Regression trees are favorable tools for economists since they are easy to interpret and able to detect nonlinear relationships. However, they are unstable and tend to be overfitting. That is, a slight change in the data causes significant changes in the splits. 5
Second, the bootstrap aggregating, in other words, bagging, was introduced by Breiman.
50
This method is used to mitigate variance related to unstable prediction.
51
Also, Bühlmann and Yu
52
exhibited that this approach leads to a decrease in mean squared error (MSE); therefore, it helps to increase predictive quality. The bagging predictor builds a bootstrap sample by randomly drawing N times with replacement from the data. The bootstrapped estimator is calculated, and then, this procedure is repeated M times;
Third, boosting (specifically, adaptive boosting) is one of the most commonly used algorithms in machine learning techniques, and it was developed by Freund and Schapire.
55
This technique utilizes the same learning set repeatedly; therefore, there is no need for large datasets. This algorithm aims to combine the strength of weak learners to get a strong learner.
56
In this case, the weak learner means whose error rate is close (but lower than) to random guessing (which equals 0.5), while the strong learner denotes the whose probability of error is small.
57
According to the adaptive boosting, M classifiers are formed and trained on a weighted version of the dataset. The initial weights become
Finally, the random forest algorithm was proposed by Breiman; 58 it is an extension of bagging and developed to compete with boosting. 59 In this model, a set of trees are constructed to predict the target variable accurately. The random forest method also constructs a bootstrap sample by randomly selecting N times with replacement from the data as bagging. In addition, it chooses a set of predictors randomly from the input variables.3,60 This is one of the main distinctions between the random forest and bagging algorithms. Then, the output of trees is used to predict the target variable by taking the average. 7 Besides, Baba and Sevil 60 stated that the correlation between trees decreases since the variables are chosen randomly. Also, they argued that this algorithm shows resistance to overfitting and provides a strong prediction.
This study selects the best machine learning algorithm through error measurements—MSE, MAPE (mean absolute percentage error), MAE (mean absolute error), and RMSE (root mean squared error)—to measure forecast accuracy. Then, it utilizes the variable importance and partial dependence plots analyses in order.
Empirical results and discussion
This study employs various machine learning techniques to predict the target variable using a set of input variables. For this purpose, the study follows the steps suggested by Basuchoudhary et al.
6
:
Selecting the algorithm that best fits the training data using error measurements, Evaluating the variable importance, Presenting the partial dependence plots
At first, this investigation divides the dataset into a learning sample and a test sample. Randomly chosen 70 percent of data is utilized as a learning sample, while the remaining 30 percent is used as a test sample.6,54 Table 1 displays the predictive quality of machine learning techniques, namely, tree regression, bagging, boosting, and random forest methods. In addition to these techniques, we also present the predictive quality of the panel OLS regression. This paper uses four types of error measurements: mean squared error, mean absolute percentage error, mean absolute error, and root mean squared error. According to the table, the random forest model provides the minimum value across three error measurements. Therefore, we can say that performing the random forest model is more appropriate than the remaining machine learning techniques. Besides, the panel OLS regression is eliminated by not only its predictive quality (it is not bad compared to other machine learning techniques) but also possible problems regarding spurious regression, functional form, heteroskedasticity, autocorrelation, normality, or multicollinearity. Taken together, the random forest model provides more reliable results compared to other methods.
The predictive quality of empirical methods.
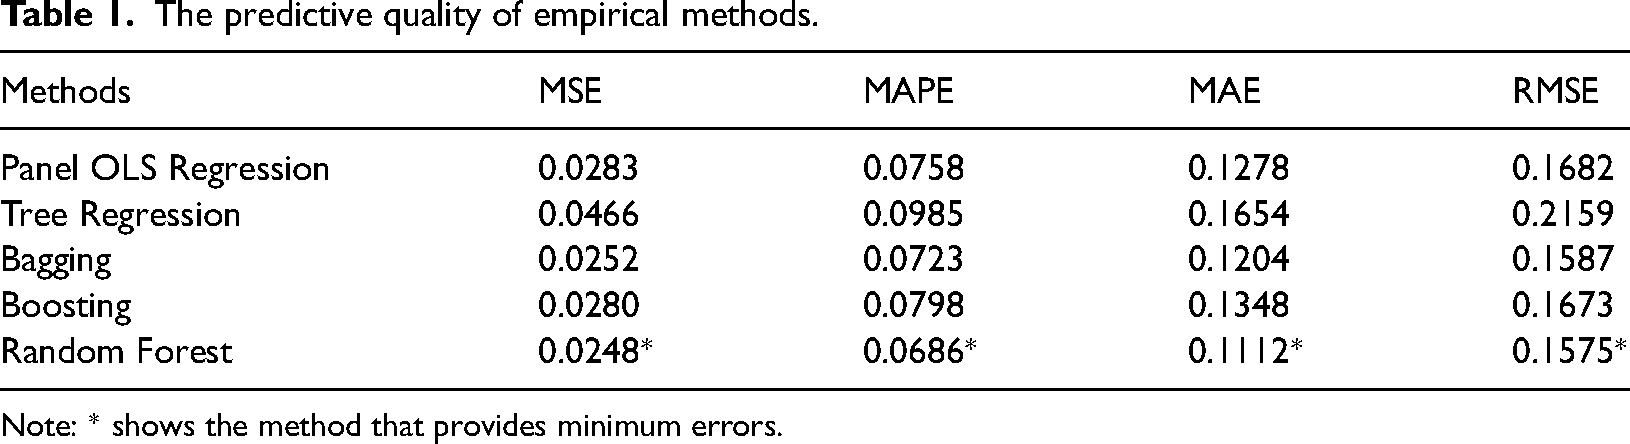
Note: * shows the method that provides minimum errors.
Table 2 presents the variable importance results for four main machine learning techniques. Since the random forest model fits our dataset, we take into consideration its variable importance result. The variables are sorted according to the highest value to the lowest value. The table exhibits the percentage increase in errors when a variable for each algorithm is omitted from the model. To be more precise, if oil product consumption is removed from the random forest model, MSE increases by 36.23%. So, we can say that including this variable is very important to estimate our machine learning model.
Variable importance according to models.

Note: ↓ denotes sorting from the largest value to the smallest one.
The Figure 1 shows the partial dependence plots on various factors for ecological footprint. So, these graphs exhibit the incremental impacts of several variables on the environmental deterioration for OECD countries. The figures are listed according to their variable importance levels.
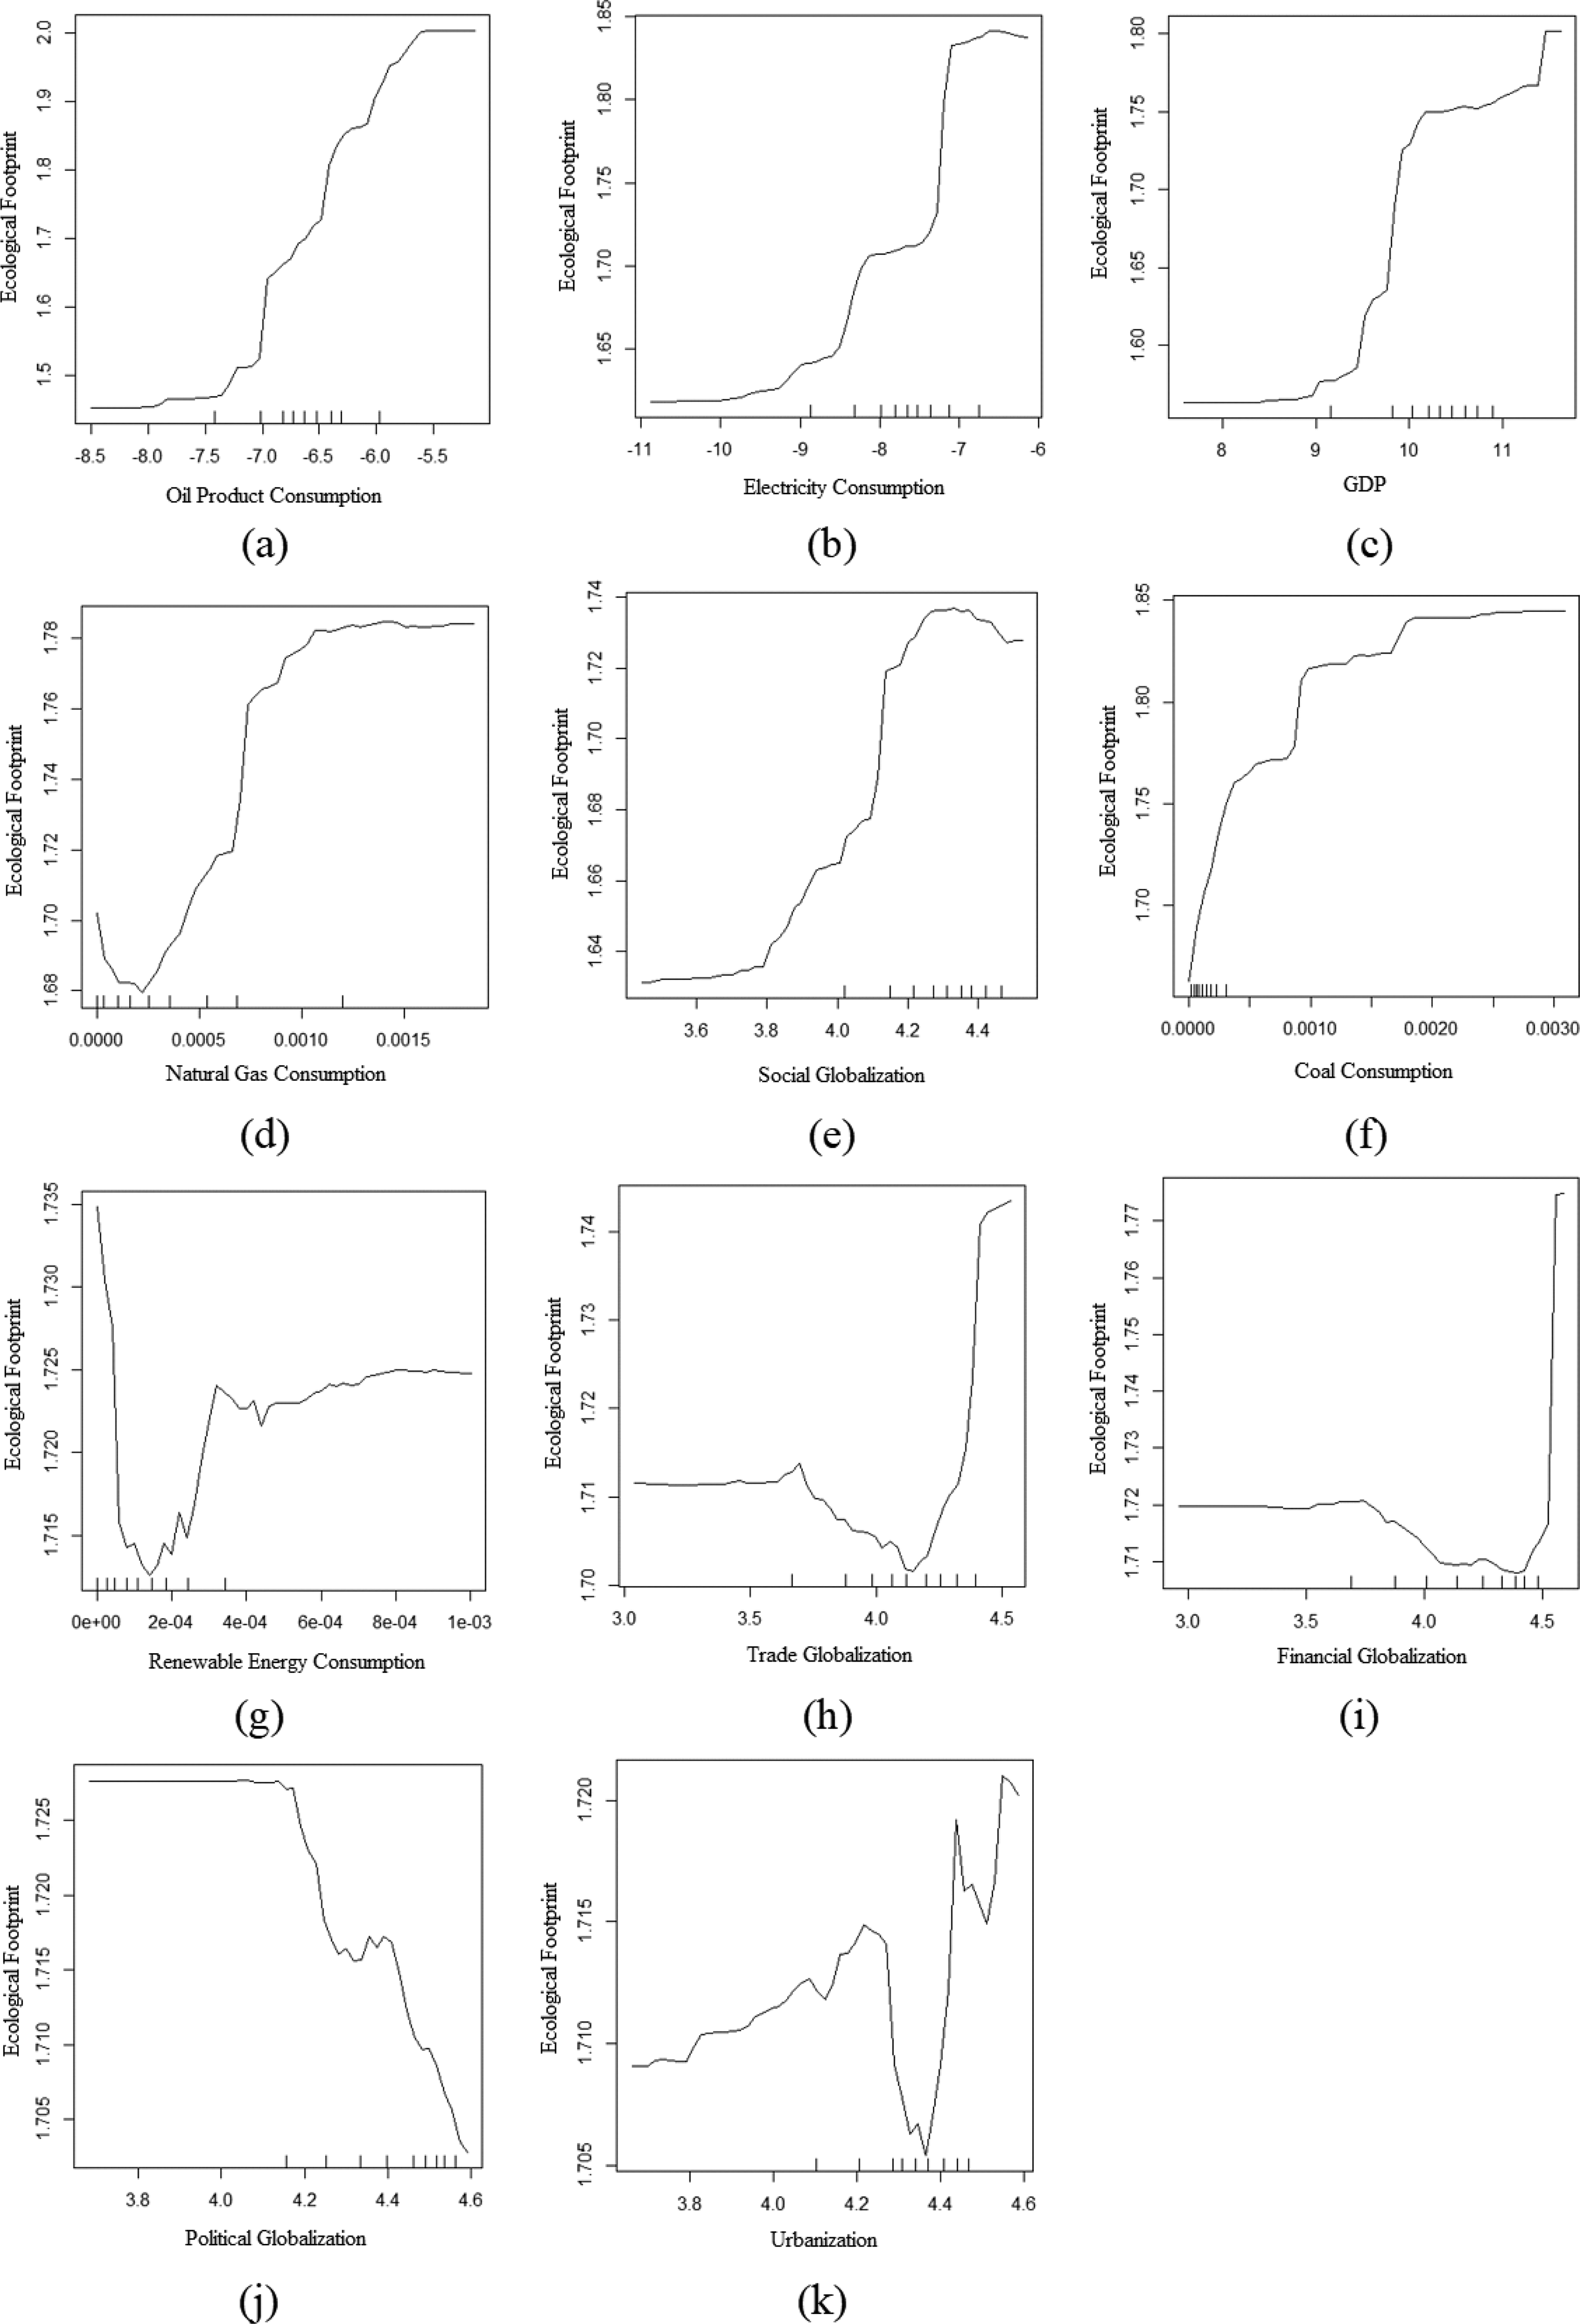
Partial dependence plots.
In Figure 1.a, the horizontal axis denotes oil product consumption, while the vertical axis shows the ecological footprint. It is inferred from the figure that the relationship between these two variables is not linear. It is seen that the effect of oil product consumption on environmental deterioration is positive throughout the sample. However, its impact is slight up to a certain point, while its effect on the environment becomes harsh with increases in the consumption level. Oil products are fossil fuels, and it is accepted that fossil fuel combustion damages the environment. The pollutive effect of oil product (total energy, nonrenewable energy, or fossil fuel) consumption was also supported by Destek and Sinha, 25 Ozcan et al., 23 and Ulucak et al. 24 for OECD countries.
There are three main sources of electricity generation in the world: fossil fuels, renewable energy sources, and nuclear energy. Although many countries have constructed renewable- and nuclear energy facilities for a few decades, the use of fossil fuels (coal, natural gas, and oil) in electricity generation is still dominant. 61 Therefore, in Figure 1.b, it is revealed that an increase in electricity consumption causes environmental degradation in OECD countries. However, after a threshold point, its pollutive effect decreases a bit. This movement can be attributed to an increase in the share of renewable energy sources over total electricity generation. The empirical results of Ergün and Polat 26 and Lau et al. 27 supported the pollutive effect of electricity consumption on the environment for OECD countries, which was similar to our findings.
A nonlinear relationship between ecological footprint and GDP is depicted in Figure 1.c. In the initial stage of economic development, an increase in the income level pollutes the environment too much. However, after a specific level of income, the environmental damage caused by economic growth slows down. This slowdown can be attributed to a few reasons; the environmental consciousness of people rises, and they demand more ecological quality from the governments. Thus, governments design and implement more stringent environmental policies to mitigate damage to the environment. As a result of tight environmental regulations and advancements in technology level, firms start to use cleaner production technologies. Also, the structure of the economy affects the pollution level in a country. Environmental damage decreases when the economy moves from the pre-industrial and industrial stage to the service economy. However, even if the increase in pollution level slows down with the increase in income after a specific point, it is seen that the EKC hypothesis is not valid in OECD countries. Therefore, one can state that the technology effect cannot dominate scale and composition effects too much in OECD countries. Besides, Stern and Cleveland 62 asserted that shifting from the industrial economy to the service economy does not eliminate environmental deterioration totally because the service sector has a large demand for energy consumption for construction and maintenance activities for office towers, shopping centers, restaurants, real estate services, etc. In addition, Gill et al. 63 argued that the EKC hypothesis is mainly focused on the production side of the economy; however, the consumption side also has a significant impact on it. The demand for luxury goods and electronics (they might be energy-dependents goods) may increase in the higher level of income level due to the conspicuous consumption behaviors of the citizens. For instance, according to D'Arpizio et al., 64 the value of personal luxury goods (e.g. jewelry, watches, cars, accessories) market value in the world reached 281 billion euros in 2019.
Moreover, although people living in developed countries acknowledge that airplanes do more damage to the environment than trains or that private cars pollute nature more than public transportation, 65 they still prefer these goods/services for their own comfort and pleasure. All these issues can be accepted as the main reasons why the EKC hypothesis does not hold in the OECD countries. Nevertheless, if the environmental consciousness of every economic agent continues and is assisted by various policy tools, the pollution level may start to decrease. Some studies backed up the pollutive effect of the income level throughout history, such as Ulucak and Koçak 22 and Ozcan et al. 23 for OECD countries, and Alola et al. 19 for European Union countries.
A nonlinear relationship (can be regarded as U-shaped) between ecological footprint and natural gas consumption is presented in Figure 1.d. Natural gas can be used as a substitute for other fossil fuels like coal, diesel fuel, gasoline, and oil in some circumstances. Since natural gas emits less carbon emission compared to coal, 66 it can also be used in heating. Thus, the initial impact of natural gas use is less pollutive. According to Dong et al., 67 these findings could be explained by natural gas is a cleaner substitute for other fossil fuels. However, its negative impact on the environmental quality rises harshly in the huge amount of consumption level because the drilling, extraction, and transportation of natural gas release a significant amount of methane (that has a detrimental impact on the environment). 68 Some of the empirical studies in the literature supported our findings (e.g.69–71 after the threshold point. Besides, the U-shaped relationship between these two variables was backed up by Xu and Lin 72 for China and the Central Region. This kind of shape can be explained by optimizing the energy structure at the initial stage; however, the environmental degradation level increases with consuming more and more natural gas (which is one of the fossil fuels). 72
Figure 1.e shows the incremental impacts of social globalization on environmental pollution. It is clearly seen that there is a positive association between these two variables. Since the social globalization index covers the number of airports, international tourism activities, migration, and movements of international exchange students, an increase in the social globalization index causes ecological problems in the majority of the sample; there is only a small decline after a threshold level of globalization. So, fuel and gasoline consumption rise, and the emission level is enhanced in nature because tourism activities and student movements trigger the transportation volume. Besides, migration may cause overpopulation and an increase in population density within the country, which affects environmental quality negatively. Empirical studies in the literature supported our findings, namely, Bilgili et al. 38 and Langnel and Amegavi. 39
Figure 1.f displays that a small amount of coal consumption leads to a rapid deterioration in environmental quality. Its impact on environmental degradation is enormous, as coal is considered by scientists to be the most carbon-emitting fossil fuel source. This empirical finding was backed up by many studies such as Saboori and Sulaiman, 69 Shahbaz et al., 73 Pata, 43 Xu et al., 71 and Magazzino et al. 74 In addition, there are negative consequences of the massive amount of coal consumption on human health, such as respiratory illness, cancer, cardiovascular disease, preterm delivery, fluorosis, arsenism, selenosis, and adverse child development. 75 Therefore, it should be hesitated to consume a massive amount of coal use for public health.
Figure 1.g displays the incremental impacts of renewable energy consumption on the ecological footprint for OECD countries. At the initial stage of consumption, providing energy through renewable sources decreases environmental deterioration. However, there is a limited level of installed capacity regarding renewable energy sources. Countries require new facilities to produce a higher level of renewable energy. Therefore, there is a need to construct renewable energy facilities, including turbines (solar thermal, geothermal, biomass) and solar photovoltaics, then, installed capacity increases. All of these constructions cause environmental deterioration in several ways. According to Willmott Dixon, 76 buildings led to a rise in air pollution, water pollution, landfill waste, and ozone depletion. Hence, the impact of an increase in total renewable energy consumption on environmental pollution turns positive. However, it is seen that its pollutive effect is lower than the initial level. Empirical studies in the literature—Destek et al., 77 Adedoyin et al. 78 and Altıntaş and Kassouri 79 considering the European countries; Destek and Sinha 25 and Ulucak et al. 24 considering OECD countries—supported our findings even if up to the threshold point.
Figure 1.h illustrates the relationship between per capita ecological footprint and trade globalization. The impact of trade globalization on environmental quality is positive up to a threshold point. However, after this point, its effect turns negative on the environment. The export volume of the countries grows in a more globalized trade environment because an increase in trade agreements and trade partner diversity and a decrease in trade taxes and tariffs affect the trade volume. Therefore, the production level in the countries increases, including energy-intensive manufacturing. Thus, the environment can be damaged by an increase in the production level. In the same vein, Bilgili et al., 38 in their work, stated that trade globalization has a positive impact on environmental quality in Turkey. This result is consistent with our results up to a certain point; however, its impact turns to negative in the highly globalized trade environment, according to our findings. Supporting this empirical result, Yilanci and Gorus 80 found a positive correlation between ecological footprint and trade globalization in 14 MENA countries.
The partial dependence plot for financial globalization in Figure 1.i shows that a more globalized financial environment causes a decline in the pollution level in OECD countries for a certain point, then, it starts to increase sharply. As it is known, the financial globalization index includes many items related to investment activities such as FDI inflows, portfolio investment, and investment agreements. So, an increase in financial globalization means a higher level of inflow, including both FDI and portfolio investment. Since OECD countries have tighter environmental regulations compared to developing countries, foreign investors do not invest in dirty industries in the host country; they make investments in clean industries and the service sector. Thus, environmental quality increases in these countries thanks to environmentally-friendly technologies and management capabilities of the foreign companies. 81 In short, financial globalization creates a pollution halo effect for OECD countries for a specific level of financial globalization. These results are in accord with recent studies (see,38,41), indicating that financial globalization provides a cleaner environment. However, after a threshold point, financial globalization damages the environment too much because a high level of development in financial markets causes a decrease in interest rates. Since low-interest rates trigger investment activities and increase the consumption level of people, demand for goods and services rises, and the use of energy sources multiplies. 82
The partial dependence plot for political globalization over per capita ecological footprint in Figure 1.j exhibits that an increase in the index heals the environment in OECD countries for the period 1971–2016. According to the figure, at the lower level of political globalization, it has a small or zero impact on environmental quality. However, when governments engage in more international political cooperation and treaties (including environmental summits and meetings), the demand for natural assets decreases gradually; then, environmental quality increases. These empirical findings were consistent with those of Shahbaz et al., 37 Bilgili et al., 38 Destek, 83 Langnel and Amegavi, 39 and Suki et al. 40
Figure 1.k shows the relationship between environmental deterioration and the percentage of people who settled in urban areas. The above figure outlines that there is a positive association between these two variables. This kind of relationship was supported by a bunch of studies, including Beck and Joshi, 47 Ozturk et al., 17 Alola et al., 48 and Ulucak et al. 41 In detail, the figure shows that an increase in urbanization rate increases environmental degradation until a specific point gradually. This environmental deterioration can be attributed to the rise in population density, deforestation, transport services, heating, production level, and construction facilities. However, a sharp decline is observed after a threshold point; therefore, an inverted U-shaped relationship can be confirmed up to a particular level of urbanization level; less than 4.40 in terms of the natural logarithm. A sharp decrease in pollution level with an increase in urbanization rate can be attributed to the municipalities’ intervention. This can be explained by the better services carried out by municipalities, such as sewers, infrastructure, and waste management. An inverted U-shaped link between pollution level and urbanization rate was also revealed in the studies carried out by Bekhet and Othman 84 and Ahmed et al. 85
Nevertheless, the pollution level starts to increase again in the case of high urbanization level. That is, the massive migration from rural to urban areas leads to more environmental problems. Overall, the nonlinear relationship between the aforementioned variables shows an N-shaped pattern for the OECD countries. One of the main reasons behind this issue is the management capabilities of municipalities; they cannot handle and manage overpopulation problems compared to the optimal level of urban population appropriately. In addition, one of the indirect impacts of urbanization is energy efficiency, thanks to technological innovations and developments in the energy sector. A decrease in energy prices following a rise in energy efficiency causes a rebound effect if economic agents demand more energy and energy-related goods and services. 86 Also, a rise in urban population triggers an expansion in the service sector, and an increase in the service sector may cause development in subsectors that are closely related to CO2 emissions such as transport services, hotels, restaurants, real estate, and public administration services. 87 Moreover, Ji and Chen 88 argued that the lifestyle and consumption patterns of the people may change when they move from rural to urban areas (or during the urbanization process). Therefore, their demand for goods and services rises since their consumption behavior shifts from survival to development and/or enjoyment modes. All of these issues can be considered as the main reasons why a high level of urbanization damages the environment. A similar pattern (N-shaped) was found by Sheng et al. 89 for the Yangtze River Delta region of China and Yassin and Aralas 90 for the Asian countries.
Conclusion
This study set out to explore the influence of income level, energy consumption, globalization level, and urbanization on environmental deterioration—per capita ecological footprint—through utilizing various machine learning techniques for 27 OECD countries. This investigation used the annual panel dataset for the period between 1971 and 2016. There are plenty of advantages of machine learning techniques over traditional econometric methods; a) functional form flexibility, b) deals with a large volume of datasets, c) no need for a priori assumption of the variables.
This study selected the algorithm that best fits the training data using three error measurements. According to the findings, it was suggested that the random forest model provides the minimum error level. Then, this study presented the variable importance and partial dependence plots based on the random forest algorithm.
The empirical results based on the variable importance demonstrated that oil product consumption, electricity consumption, and GDP are the most significant variables for our model. If they were removed from the random forest model, errors increase significantly. To be more precise, if oil product consumption was removed from the random forest model, MSE increases by 36.23%, while if electricity consumption and GDP were excluded from the model, errors increase by around 15%. On the other side, it was seen that urbanization, political, financial, and trade globalization levels had little importance in determining ecological footprint per capita. Moreover, the partial dependence plots indicated that economic growth and especially fossil fuel energy consumption damage the environment. Contrarily, renewable energy consumption polluted the environment less than oil products, coal, natural gas, and electricity consumption. Besides, it could be revealed that the demand for natural assets decreases gradually when governments engage in more international political cooperation and treaties, while trade and financial globalization levels heal the environment only up to a certain level. After these levels, these two indicators drastically increased the per capita ecological footprint in OECD countries. Lastly, the empirical findings showed that an excessive level of urbanization causes environmental deterioration for the period examined.
Empirical results of this study indicated that the EKC hypothesis is not validated for the OECD countries even though the marginal impact of income level on environmental pollution decreases gradually after a specific level of income. This finding might be attributed to the inability of the technology effect to dominate the scale and composition effects. In addition, the enlargement of the service sector might cause development in subsectors that are closely related to fossil fuel energy use. Besides, the conspicuous consumption behaviors and usual consumption patterns of the people which are highly dependent on their own comfort and pleasure can prevent a high decline in the pollution level in the countries examined. However, if the environmental consciousness of every economic agent is increased and sustainable development is assisted by miscellaneous policy tools, the pollution level may start to decrease in the OECD countries.
Taken together, these empirical findings have important implications for developing appropriate environmental policies. First, policymakers should ensure the transition from fossil fuel energy sources to renewable energy sources. For this purpose, they can make investments in renewable and clean energy projects. Besides, they can support and subsidy the private sector to increase the use of cleaner technologies. Second, governments should help to provide the optimum level of globalization regarding trade and finance since an excessive amount of economic globalization deteriorates the environment. Third, governments should engage in more international cooperation regarding the environmental problems in the world. Finally, they should control the internal migration from rural to urban areas because massive migration movements to urban settings decrease environmental quality.
This study is unable to encompass the entire possible factors affecting environmental degradation such as tourism activities, per capita military expenditure, technology level because the balanced panel dataset is not available for OECD countries during the period 1971–2016. This can be accepted as the main limitation of this study.
In further investigations, it might be possible to use components of the ecological footprint as the ecological indicators. The impacts of input variables on the output variable such as built-up, land, carbon, cropland, fishing, forest, and grazing land footprints can be slightly or entirely different. Also, the causal relationship between these variables could be examined through the recent machine learning techniques; therefore, the policymakers can conduct more effective economic and environmental policies to mitigate environmental pollution.
Supplemental Material
sj-docx-1-eae-10.1177_0958305X221112913 - Supplemental material for Factors affecting per capita ecological footprint in OECD countries: Evidence from machine learning techniques
Supplemental material, sj-docx-1-eae-10.1177_0958305X221112913 for Factors affecting per capita ecological footprint in OECD countries: Evidence from machine learning techniques by Muhammed Sehid Gorus and Erdal Tanas Karagol in Energy & Environment
Footnotes
Data statement
The datasets used and/or analyzed during the current study are available from the corresponding author on reasonable request
Declaration of conflicting interests
The author(s) declared no potential conflicts of interest with respect to the research, authorship, and/or publication of this article.
Funding
The author(s) received no financial support for the research, authorship, and/or publication of this article.

Supplemental material
Supplemental material for this article is available online.
Notes
References
Supplementary Material
Please find the following supplemental material available below.
For Open Access articles published under a Creative Commons License, all supplemental material carries the same license as the article it is associated with.
For non-Open Access articles published, all supplemental material carries a non-exclusive license, and permission requests for re-use of supplemental material or any part of supplemental material shall be sent directly to the copyright owner as specified in the copyright notice associated with the article.
