
Abstract
This paper is concerned with the impact on the global greenhouse effect issues and focus on comprehensive multi-indicator though analyze the relationship between CO2 emissions and real GDP, energy intensity, fraction of the renewable energy supply out of the total energy supply, and energy consumption from different sectors, including the agricultural, service, industrial and transport sectors. The panel data encompass all 37 Organization for Economic Co-operation and Development (OECD) member countries covering 20 years from 2000 to 2019 and divide into two subsamples, the first and second ten years, for comparison. The empirical results of all parameters track the sound progress of green growth trend in OECD countries in the second ten years (2010–2019). According to the OECD, green growth strategy had been acknowledged in OECD Ministerial Council Meeting in June 2009. Thus, the study divided into the first and second ten years with 2010 as the boundary to compare and the empirical result also indicates the green growth strategy in OECD countries have gradually matured in the last ten years. The implementation of the policy framework and measures includes pricing, removing perverse subsidies, ensuring the regulatory standards of energy efficiency, innovation, and infrastructure investments might also provide a reference and important information for energy policy makers.
Introduction
Green growth means fostering economic growth and development, while ensuring that natural assets continue to provide the resources and environmental services on which our well-being relies. To achieve the environmental targets proposed by the Paris Agreement and the sustainable development goals, decoupling economic growth from CO2 emissions is critical and vital to achieving the goal. Typically, the term “decoupling” has often been used to refer to breaking the link between “environmental bads” and “economic goods.” In particular, it refers to the relative growth rates of pressure on the environment and of an economically relevant variable to which it is causally linked. In the case of CO2 emissions, decoupling is explored with emissions accounted for on both production and consumption bases, thus considering the potential bias in decoupling patterns as a result of carbon leakage. Therefore, the understanding of the direction of causality between CO2 emissions, economic growth, renewable energy supply and energy consumption from industry could have an important implication for energy policy-makers.
This study chooses the Organization for Economic Co-operation and Development (OECD) countries as the context of study because their characteristics are adapted to the objective of this inquiry. OECD countries have a great impact on the global warming effect and have historically emitted the bulk of global greenhouse gas (GHG) emissions. The top energy-consuming countries showed different patterns in 2019. The United States alone reduced its total energy supply by 27 Mtoe; the result of opposing trends for coal was −43 Mtoe and natural gas was 20 Mtoe, mostly driven by continued substitution in power generation. Similarly, Japan (−2%) and most European countries (France −2%, UK −2%, Italy −2%, and Germany −0.5%) declined in energy consumption. Conversely, one-third of the OECD members registered an increase (Canada +1%, Mexico +2%, Turkey +2%, and Australia +3%). Due to the combined fall in coal and increase in gas and renewable energy in the total energy supply for 2019, the carbon intensity of the energy mix continued to decrease, resulting in an almost 3% drop in energy-related carbon dioxide emissions. Over two-thirds of OECD countries decreased emissions, several of them by 3% or more: United States 3%, Germany 5%, Korea 3%, UK and Italy 4%, France 3%, Poland 4%, and Spain 8%.
The main drivers behind GHG emissions in OECD countries are energy production and use. In the 1990s and 2000s, energy intensity per unit of GDP decreased in OECD countries overall as a consequence of structural changes in the economy and strengthened climate policies, such as promoting renewable energy and energy conservation measures since 2009, as a consequence of slowdown in economic activity following the economic crisis. In some countries, the decrease was due to the transfer of energy-intensive industries to other countries.
Hence, most countries have achieved only a relative decoupling between emissions and economic growth, although some have managed to reduce emission levels in absolute terms; while decreasing in OECD America and OECD Europe, energy-related CO2 emissions continue to grow in the OECD Asian-Oceania region. The share of renewables is growing in OECD Europe, mostly due to the implementation of policies that promote the use of renewable energy. However, Europe's energy mix has the lowest share of fossil fuels among OECD regions (72%). Renewable energy sources, however, still represent a small share of energy use in OECD countries: 10% of total primary energy supply (TPES) and 26% of electricity production on average. Emissions of OECD countries peaked in 2007, have fallen over the past ten years (−9%) and now seem to be stabilizing. The main drivers behind GHG emissions in OECD countries are energy production and use, in particular fossil fuel use in the transport and industrial sectors and by household. In the 1990s and 2000s, energy intensity per unit of GDP decreased in OECD countries overall as a consequence of structural changes due to the outsourcing of energy-intensive industrial production to other countries. There was an overall increase in the TPES between 1990 and 2018 and a growing energy demand for transport. 1
On average, energy consumption in the agricultural sector (2.8%), service sector (11.9%), industrial sector (25.4%), and traffic sector (30.5%) in OECD countries occurred in 2018. Variations in CO2 intensity among OECD countries are wide (from 0.07 to 0.36). The CO2 intensity of GDP depends on energy and economic structure and income, geography, energy policies and prices, and country endowment in different types of energy resources (see Figure 1). Changing economic structures is not easy or automatic and involves a complex process of social, political, and technical experimentation and innovation. A successful climate policy is therefore likely to involve political innovations in terms of institutions, regulations, and economic incentives to encourage changes both on the production side and consumption side of the economy and government investments in key infrastructures and support for advanced technologies and energy markets.
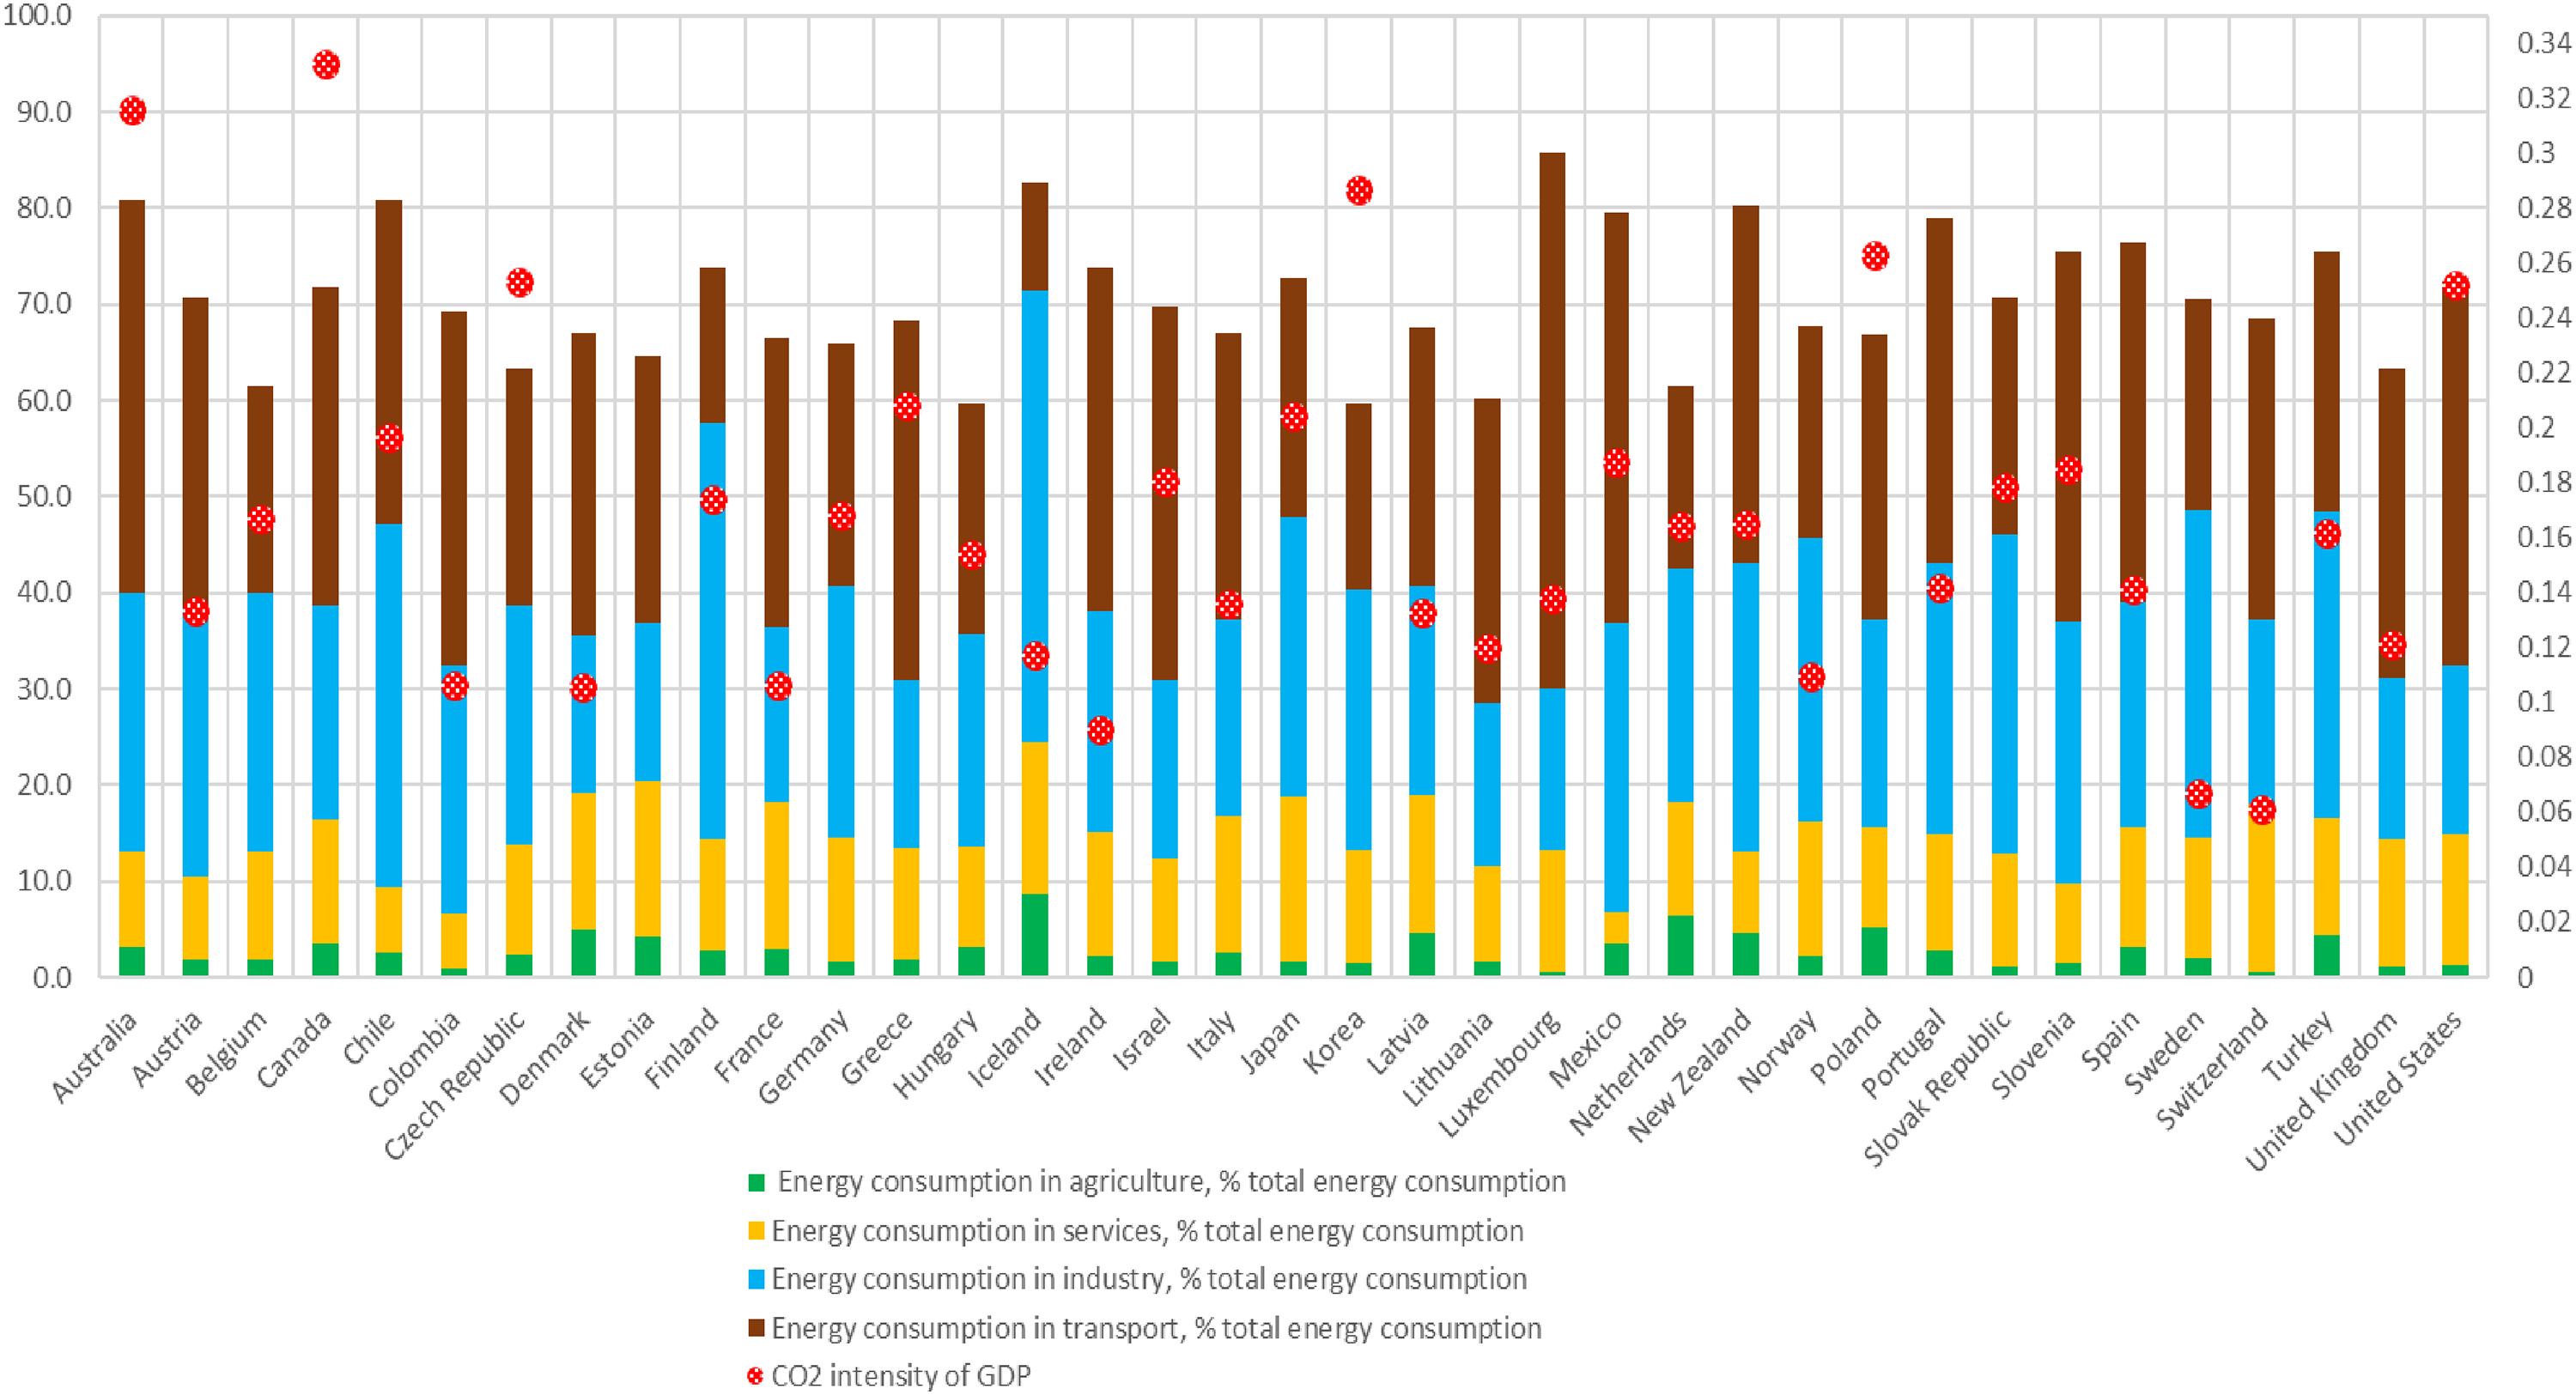
CO2 intensity of GDP and energy consumption (%) from different sectors of OECD countries in 2018.
Therefore, this study focusses on analyzing the relationship between CO2 emissions and energy consumption in all the different industries in OECD countries. The empirical approach examines the panel regression model. The panel data combine time-series and cross-sectional observations, resulting in a large panel dataset in statistics and econometrics. The estimates of coefficients derived from models of pooled regression, fixed effects or random effects can be subject to omitting small sample bias from outliers. Hence, this study uses panel data that contain multiple countries and years to investigate the relationship between CO2 emissions and energy intensity, real GDP, renewable energy supply and energy consumption from different industries. The empirical panel dataset is formed across all 37 member countries of the OECD and the sample period from 2000 to 2019.
The most important contribution of this paper is that the empirical results provide strong evidence of the relationship between CO2 emissions and real GDP, energy intensity, renewable energy supply of total energy and energy consumption from different industries, including the agricultural, service, industrial, and transport sectors. Furthermore, to examine the effectiveness of CO2 emission reduction in different periods, this paper also analyzes and compares the coefficient of CO2 emissions in different periods: the first ten years (2000–2009) and the second ten years (2010–2019). There is an important finding in which the empirical panel data indicate that the OECD countries have achieved successful achievements in moving forward to an energy transition and green economy in the second ten-year period. This also indicates that CO2 emission reduction policies and measures in OECD countries are gradually maturing.
Literature review
In the current academic literature, there is evidence that with more economic growth, energy consumption has increased. A significant positive relationship between economic growth and CO2 emissions has been clearly observed.2–7 The empirical literature on the effects of economic growth on CO2 emissions is often separated into two parts8,9: empirical evaluations of the environmental Kuznets curve (EKC) and the decomposition literature. The EKC hypothesis10,11 postulates an inverted U-shaped relationship between national income and environmental degradation that emanates from the assumption that countries will use more green technology, decrease their goods production and increase their service production as they experience economic growth. However, empirical research has found little support for an existing EKC for CO2 emissions.12–14 Another line of investigation in terms of the causality issue of economic growth and CO2 emissions is based on time series or panel data econometric techniques, such as unit root tests, cointegration and the related error correction model. The nature of the causality between per capita GDP and per capita CO2 emissions, short-run dynamic movements and long-run cointegration has been explored. 8 Therefore, economic growth affects CO2 emissions; namely, urbanization, population, energy structure, industrial structure, industrialization, income levels, energy technology research, development, and demonstration (RD&D), and energy intensity all affect CO2 emissions. Moreover, renewable energy consumption and high oil prices also contribute to the decoupling of economic growth from carbon emission, and the contribution of renewable energy is stronger than that of high oil prices. Energy technology RD&D is essential to curb CO2 emissions and build a clean energy system. Furthermore, the co-movements between renewable energy and CO2 emissions also has been discussed, these findings highlight the mixed evidence on the interaction between renewable energy and CO2 emissions among different countries. The relationship between renewable energy and CO2 emissions is controversial, and both neutrality and feedback hypotheses were observed. Energy policy plays an important role in providing incentives such as loan guarantees, lending support mechanisms, grants, investment tax credit for renewable energy.15–23
Towards green growth usually focus on the concept of decoupling which aim at promoting economic growth while reducing the use of natural resources and GHG emissions. GDP growth coinciding with absolute reductions in emissions is denoted as absolute decoupling, as opposed to relative decoupling. The policies or strategies in the decoupling literature can be classified into three groups: (1) Green growth, if sufficient reductions of resource use or emissions were deemed possible without altering the growth trajectory. (2) Degrowth, if reductions of resource use or emissions were given priority over GDP growth. (3) Others, for example, if the role of energy for GDP growth was analyzed without reference to CO2 emissions mitigation. Absolute decoupling is rare and generally only occurs during periods of low GDP growth. At the global level, only relative decoupling can be observed. 24
The analyses of TPES and CO2 emissions from fossil fuel combustion and industrial processes dominate the literature sample. Primary energy use can be decoupled from GDP only to the extent to which conversion efficiency from primary energy to useful exergy can be increased. Other indicators including materials, energy, final energy, and full GHG emissions are analyzed much less. The study also provides evidence that these reductions were a result of the policies to increase renewables and energy efficiency. In terms of methods of analysis applied can be classified into five categories, which are cross-sectional analysis, descriptive trend analysis, decomposition and regression analysis, econometric time series analysis, and econometric causality tests or causality testing methods. However, the decomposition and regression analyses and econometric time-series analyses are most prevalent, the research on the interdependence between energy at its various conversion steps and economic growth, often using econometric timeseries. Overall, consumption-based perspectives are crucial innovations in the decoupling discussion, the combination of production and consumption-based issue is highly valuable for informing environmental policies.25,26
To estimate country's carbon baseline, Kaya equation and the IPAT model have been used to evaluate the timing of the CO2 emissions peak, and determine factors that affect country's potential to reach a peak carbon emission. The STIRPAT model is a system dynamic model stochastic effects model based on the regression analyses of the random effects of population, wealth, and technology on the environment. Th STIRPAT model is able to overcome the defects of the Kaya equation and the IPAT model that all factors influence carbon emissions with the same proportion. To investigate decoupling statuses between energy-related CO2 emission, the Tapio decoupling index has been widely employed in the literature, Tapio proposed a framework of decoupling and divided it into three categories and eight types of decoupling status, which are negative decoupling, decoupling, and coupling. Negative decoupling includes three possibilities: expansive negative decoupling indicates that GDP and CO2 emission both increase, but emission grows faster; weak negative decoupling denotes that GDP and CO2 emission both decrease, and GDP declines faster; strong negative decoupling means that carbon emission grows but in economic recession. Decoupling contains three statuses: strong decoupling implies economy grows but emission decreases, recessive decoupling is similar to weak negative decoupling, but emission declines faster; weak decoupling is similar to the expansive negative decoupling but GDP grows faster. Coupling occurs when both GDP and CO2 emission increase or decline, and change slightly.24,27
Empirical models and data description
The methodology
The panel data combine cross-sectional and time-series observations, resulting in a large panel dataset in econometrics and statistics. The estimates of coefficients derived from models of pooled regression, fixed effects or random effects can be subject to omitting small sample bias from outliers. Hence, this study uses panel data that contain all 37 OECD member countries and 20 years to investigate the relationship between production-based CO2 emissions and real GDP, energy intensity, renewable energy supply and energy consumption from different sectors. The formulated equations of the panel regression models to be estimated are as follows:

The ordinary least squares method provides consistent and efficient estimates, and the pooled regression model can be identified by equation (1). If the intercepts embody all observable effects and specify an estimated conditional mean from


Data description and summary statistics
The panel dataset used in this study encompasses all 37 member countries of the OECD had been derived from OECD green growth indicators database, and the sample period extends from 2000 to 2019. The data are obtained from the OECD statistical database, and all variables are defined at the end of the year. The total number of observations for the cross-sectional and time series data is 740 for each variable.
The dependent variable is production-based CO2 emissions, and the independent variables are real GDP, energy intensity, fraction of the renewable energy supply out of the total energy supply, and energy consumption from different industries (agricultural, service, industrial, and transport sectors). Consumption in agriculture includes deliveries to users classified as agriculture, hunting and forestry by the International Standard Industrial Classification. The service sector includes both commercial and public services; consumption in transport covers all transport activity; and the industrial sector includes the following subsectors: iron and steel, chemical and petrochemical, nonferrous metals, nonmetallic minerals, transport equipment, machinery, mining and quarrying, food and tobacco, paper, pulp and print, wood and wood products, and construction. Therefore, this study calculates the annual growth in percentage of all dependent and independent variables and their difference, where
Table 1 exhibits the summary statistics for each variable. The sample mean of the annual growth rate of CO2 emissions from energy use from 2000 to 2019 was negative at approximately −0.3543%. It is worth noting that the annual growth rates of CO2 emissions and energy intensity were both positive from 2000 to 2009 and then became negative after 2010, which indicates that GHG reduction policies in OECD countries achieved significant achievements in the second ten years. Otherwise, individual OECD country rates of progress varied significantly, with different national circumstances, such as composition and rate of economic growth, population growth, energy resource endowment, and the extent to which the countries have taken steps to reduce emissions from various sources.
Summary statistics.
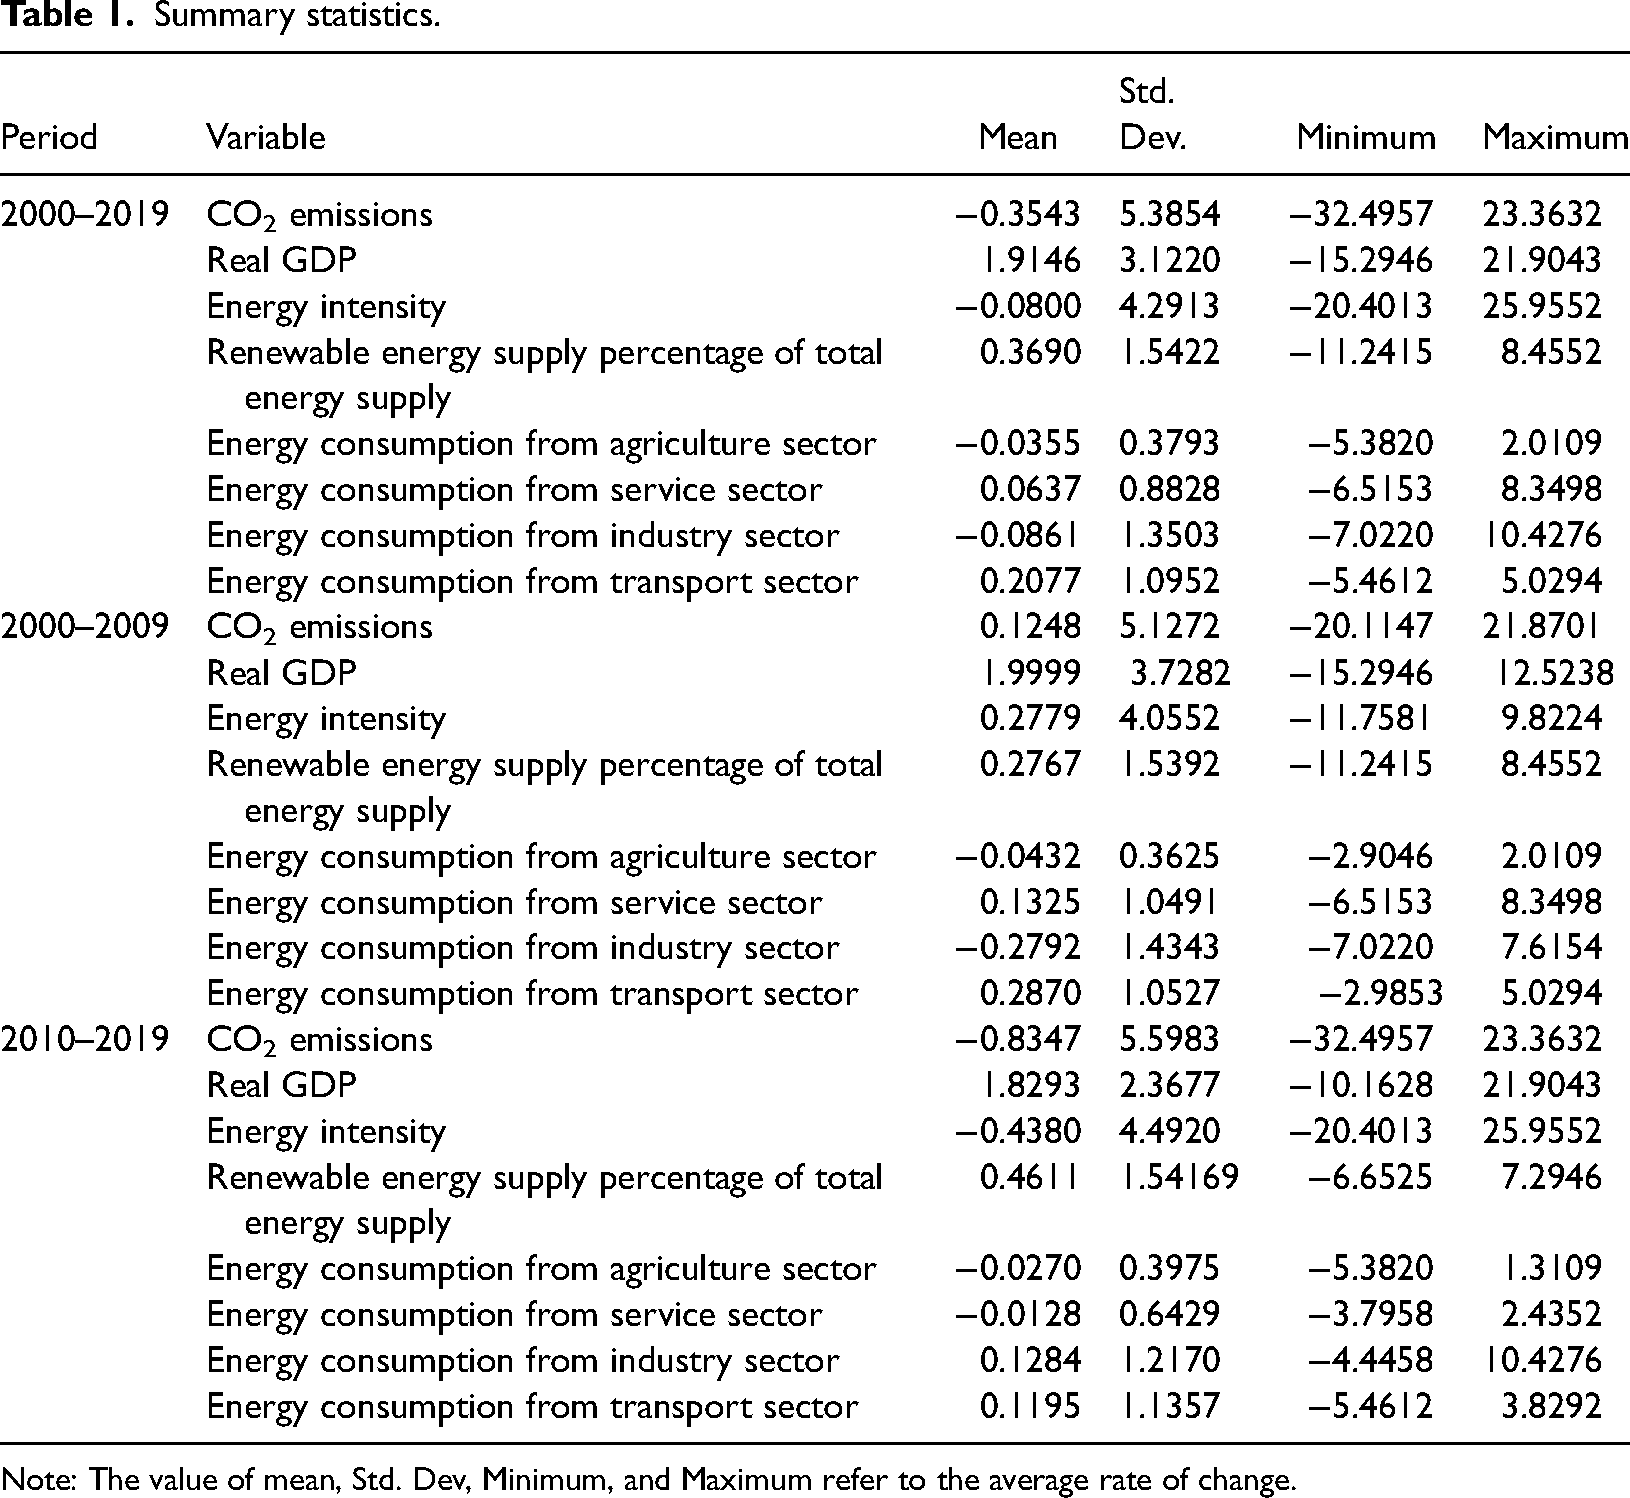
Note: The value of mean, Std. Dev, Minimum, and Maximum refer to the average rate of change.
On average, the data show that the annual contribution of renewables to the energy supply was 0.369%, and OECD countries continued to rely on fossil fuels for approximately 80% of their energy. Renewables include the primary energy equivalent of hydro (excluding pumped storage), geothermal, solar, wind, tide and wave. It also includes energy derived from solid biofuels and biodiesels. The growth in renewables was not affected by the economic crisis and was driven by OECD Europe, mostly due to the implementation of policies that promote renewable energy. A maximum contribution of 90.1388% occurred in Iceland in 2019, which indicates that this country has the highest renewable energy supply among the member countries of the OECD, with its average contribution exceeding 30% from 2000 to 2019 in each year. In fact, large-scale renewable sources of hydropower and geothermal power have been exploited in Iceland. In contrast, the minimum annual contribution of renewables to an energy supply of 0.4029% was found in Korea in 2000. The data show that renewable energy supply has gradually increased in recent years from 2000 to 2019. Generally, the energy supply structure, which may vary considerably among countries, is dependent on final demands by industry and is highly influenced by national energy policies and endowments in energy resources.
Table 1 also shows that the sample mean of the annual growth in percentage terms of real GDP was positive and amounts to 1.9146%, having a standard deviation of 3.1220. Furthermore, the sample mean of the energy intensity was negative and amounts to −0.080%, with a standard deviation of 4.2913 from 2000 to 2019. To measure and compare the energy intensity of different countries and how these changes over time, we examine the ratio of the energy supply to GDP. The TPES per thousand US dollars of GDP and the ratios are calculated by dividing each country's annual TPES by each country's annual GDP expressed in constant 2000 prices and converted to US dollars using purchasing power parities for the year 2000. Energy efficiency is defined as the ratio between the primary consumption of energy and GDP. The indicator is expressed as a change in the ratio of the compound annual growth rate of the energy intensity of GDP, and a change in the energy intensity may reflect a restructuring of the economy and the transfer of energy-intensive industries such as iron and steel out of the country. Both statistics imply a decoupling trend of economic growth from CO2 emissions in OECD countries. Energy-related CO2 emissions have decreased while economic growth has been positive since 2000. This was due to structural changes in industry and energy supply and improvements in energy efficiency in production processes. Increasing the renewable energy share and improving energy efficiency will be the most critical strategies for reducing CO2 emissions.
Energy and industrial structure vary considerably among countries. It is influenced by demand from the industrial, transport, agricultural, and service sectors. On average, for energy consumption from the agricultural sector (2.8%), service sector (11.9%), industrial sector (25.4%), and transport sector (30.5%) in OECD countries in 2018, the data show that the sample mean of the annual growth of energy consumption from the agricultural and industrial sectors was negative; in contrast, the sample mean of the annual growth of energy consumption from the service and transport sectors was positive in the entire period. It is worth noting that the results of the sample mean of energy consumption from the service sector were positive from 2000 to 2009 and then became negative from 2010 to 2019. Otherwise, the sample mean of energy consumption from the industrial sector was negative in the first ten years and then became positive in the second ten years. This indicates that for the industrial structure, the consumption pattern and economic activity in OECD countries changed over time. In some OECD countries, energy consumption from the industrial sector decreased in the first ten years due to the transfer of energy intensive industries to other countries, and because of the need for industrial development, energy consumption in the industrial sector gradually increased. This indicates increasing pressures on the global environment. Overall, if fewer energy efficiency techniques and green energy are involved, CO2 emissions will worsen. It reflects overall trends in energy supply and energy demand for each sector in OECD countries.
Empirical results and discussions
Empirical results
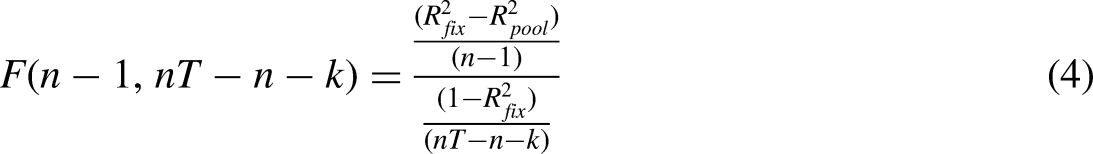
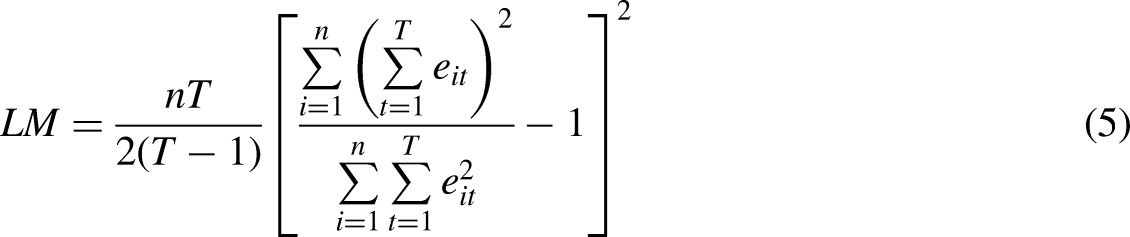
This paper examines the relationship between CO2 emissions and energy intensity, real GDP, renewable energy supply and energy consumption from different industries by estimating the specifications given in equation (1). The empirical results are shown in Table 2. The optimal model of panel data estimation is selected by the F-test for pooled regression versus fixed effects, the LM test for pooled regression versus random effects, and Hausman's specification test for random effects versus fixed effects. Table 2 shows that the pooled regression model was chosen by the F-statistics, LM statistics, and Hausman's statistics. The value of the F-statistic is not significant at the 1% level, leading to the acceptance of the null hypothesis that the pooled regression model provides a better estimation. The value of LM statistics is also not significant at the 1% level, indicating the acceptance of the null hypothesis that the pooled regression model is better than the random effects model, while indicating that the pooled regression model provides better estimation than other models.
Parameter estimations for CO2 emissions.
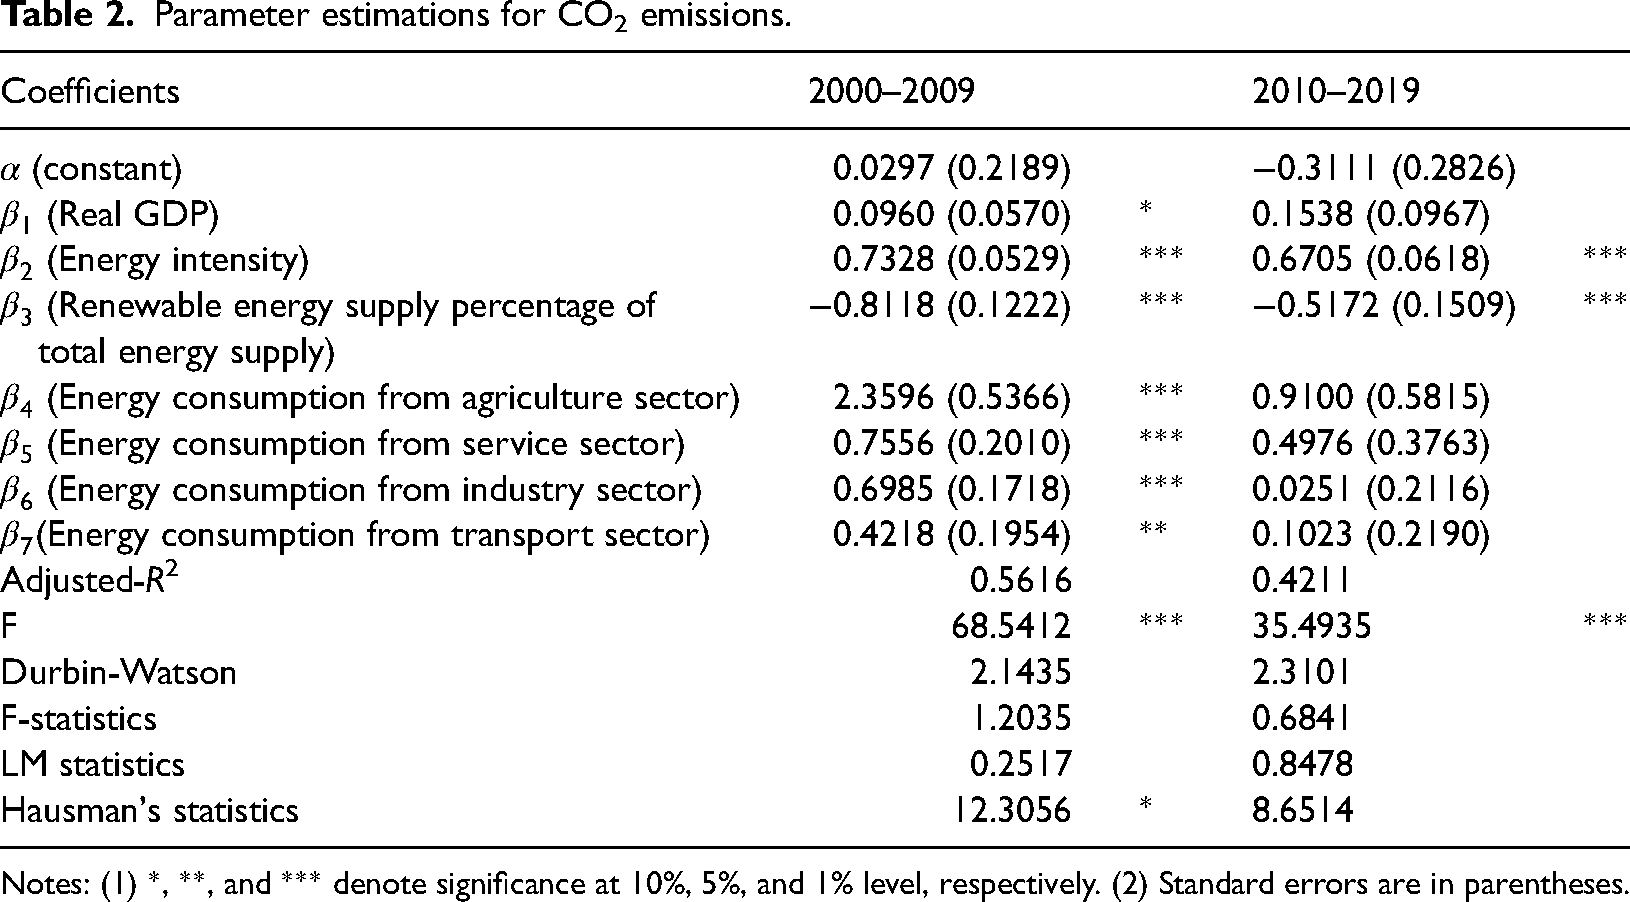
Notes: (1) *, **, and *** denote significance at 10%, 5%, and 1% level, respectively. (2) Standard errors are in parentheses.
Table 2 presents the results of the parameter estimations between CO2 emissions and real GDP, energy intensity, fraction of the renewable energy supply out of total energy supply, and energy consumption from the agricultural, service, industrial, and transport sectors in the first ten years (2000–2009) and the second ten years (2010–2019). This study intends to analyze the different periods and to find the relationship and trend line of each coefficient of CO2 emissions and to measure the effectiveness of CO2 emissions reduction in OECD countries during different periods. This study also provides some important information for energy policy-makers.
In the first ten years, the coefficients of real GDP (
In the second ten years, firstly, real GDP (
Discussions
The empirical evidence of real GDP, energy intensity was consistent with previous literature and moving toward green economic growth pathway in the second ten years in OECD countries. In supply side, the use of renewable energy sources is critical for energy transition and greener economic systems. In terms of demand side, the consumption from different sectors indicates the better energy efficiency in the agricultural, service. Industrial and traffic sectors have improved in the second ten years, denote that CO2 reduction policies and measures from the all sectors in OECD countries have made successful achievements.
In agriculture sector, agriculture is one of the sectors most affected by greenhouse effect; there is much scope for technological developments to reduce GHG emissions in the agricultural sector, such as increase the area of forest carbon sinks, strengthen forest management, increases in crop yields and productivity. In the service sector, the measures to mitigate CO2 emissions are to promote the installation of heat pumps, solar photovoltaic energy system, heat storage technology, and incentivize the installation of central cooling and heating and the use of energy efficient lighting and appliances. In the industrial sector, energy-intensive industries may install renewable energy generation equipment or purchase green electricity from the energy market, impose and strengthen energy efficiency standards, promote the use of efficient and renewable heating and cooling solutions will play an important role in mitigating CO2 emissions. In the transport sector, such as improving rail service quality or the overall accessibility of rail and public transport, road pricing could reduce environmental pressure. Electrification is considered a key solution for reducing fossil fuel dependency and environmental impacts from road transportation, but it is worth to note that more efforts are also needed in decarbonizing the electricity grid. In the future, renewable energy is increasingly the lowest-cost source in electricity markets. It will totally change the energy and economic lifestyles and patterns.
Broadly speaking, the empirical results of all parameters track the sound progress of green growth trend in OECD countries in the second ten years. According to the OECD, green growth strategy had been acknowledged in OECD Ministerial Council Meeting in June 2009. Thus, the study divided into two parts with 2010 as the boundary to compare and the empirical result also indicates that policies and measures of CO2 emission reduction of green growth strategy in OECD countries have gradually matured in the second ten years (2010–2019). It denotes that the policy framework of OECD green growth strategy can provide some important implications for policy makers. The green growth strategy develops an actionable policy framework that is designed to be flexible to be tailored to differing national circumstance and stages of development. They need to encourage environmentally friendly behavior by firms and consumers, such as removal of environmentally harmful subsidies. Implementing a green growth strategy will involve a mix of instruments which draw from two broad sets of policies. The first set reinforce economic growth and the conservation of natural capital, such as tax and competition policy. The second set policies target at incentivizing efficient use of natural resources and make pollution more expensive, they include a mix of price-based instruments such as carbon pricing mechanism that tend to minimize the cost of providing incentives for further efficiency gains and innovation. It is worth to note that policies are required to prevent energy efficiency improvement from leading to greater energy consumption, this could occur due to the so-called rebounded effects where improvements in energy efficiency reduce the relative price and may result in people use more energy. Besides, in certain cases, well-designed regulation, active technology support policies such as information-based measures and voluntary approaches maybe more appropriate to market instruments. Overall, the framework of green growth are as follows
31
:
Promoting economic growth while reducing GHG emissions, inefficient use of resources, and maintaining biodiversity. Decoupling economic growth and environmental impacts. Pricing pollution and natural resource use though mechanisms such as tax or tradable permits. Removing perverse subsidies (e.g. fossil-fuel consumption). Ensuring the regulatory standards that address pollution or energy efficiency. Green innovation. Infrastructure investments: energy, transport, water.
Finally, this paper provides some policies to create practical strategies for CO2 emission reduction. To sum up, CO2 emissions for energy consumption resulting from increasing economic growth will not speed up energy-related CO2 emissions and have gradually begun to decouple with time in OECD countries. This also indicates that policies and measures of CO2 emission reduction in OECD countries have gradually matured in recent years. The energy transition requires changes on the supply side and demand side, and renewable energy will play a dominant role in end-use sectors such as electricity; electrification is one of the technologies that can help to decarbonize sector associated with renewable power generation towards sustainable development. The enhanced renewable energy supply and energy efficiency also create low carbon services and products and decouple the dilemma between economic growth and global greenhouse effect issues.
Conclusions and policy implications
This paper is concerned with the phenomenon of global greenhouse effect issues and green growth pathway with the relationship between CO2 emissions and economic growth, energy consumption from different sectors by estimating the relationships between CO2 emissions and real GDP, energy intensity, fraction of the renewable energy supply out of the total energy supply, and energy consumption from different industries, including the agricultural, service, industrial, and transport sectors. The panel data encompass all 37 OECD member countries covering 20 years from 2000 to 2019 and two separate subsamples, the first and second ten years, for comparison.
The energy transition requires changes on the supply side and demand side, and renewable energy will play a dominant role in end-use sectors such as electricity; electrification is one of the technologies that can help to decarbonize sector associated with renewable power generation towards sustainable development. The policy pathway and measures for achieving green growth in OECD countries in mitigating CO2 emissions have achieved remarkable results in the second ten years (2010–2019), indicating that the policy and measures of CO2 emission reduction in OECD countries are gradually maturing.
The empirical results show the coefficients of consumption from agriculture sector that influence CO2 emission was greater than other sector, the agricultural sector provides for an increasing and wealthier global population. The agricultural sector generates both environmental harm and conserves ecosystem services, and both depends on and impacts natural resources (land, water, and biodiversity) in the production process. There has been need for some improvements in the environmental performance of agriculture OECD countries. The policies influence the productive efficiency and environmental performance of agriculture. Their impacts on the environment vary according to the nature and the conditions under which policy instruments are implemented. Effective resource and environmental management programs and regulations can limit the negative environmental effect, better targeting of policies to meet clearly identified objectives is needed. The policy framework includes: to increase productivity in a sustainable manner, to ensure that well-functioning markets provide the right signals, and to establish and enforce well-defined property rights. 31
The enhanced renewable energy supply and energy efficiency also create low carbon services and products and decouple the dilemma between economic growth and greenhouse effect the green growth strategy can provide an essential implication. Thus, the implementation of OECD green growth policy framework and policies includes pricing, removing perverse subsidies, ensuring the regulatory standards of energy efficiency, innovation, and infrastructure investments might also provide a reference and important information for energy policy makers. Furthermore, policy initiative should be designed in terms of cost effectiveness, adoption and compliance incentives, robust, transparent, and ability to cope with uncertainly and provide a clear and credible signal to investors. The best policy or instrument will vary by energy and environmental issues as across country or region-specific circumstance. The combination of policies also differ depending on a country's stage of development. The regulatory policies are crucial elements of the green growth policy framework, as with the reform of subsidies, regulatory initiatives, which include: (1) specific regulatory initiatives to encourage improved energy efficiency, and reduce pollutants, such as emissions performance standards, (2) product market competition, (3) private sector voluntary initiatives, and (4) rules governing trade and foreign direct investment. Regulatory instruments are often used by policy maker when markets do not provide price signals to individuals that reflect the costs of behavior. Overall, these are important dimensions for policy maker that should pay greater attention in regulatory analysis, such as establish a consistent framework for the evaluation of benefits from CO2 emissions reduction, in the United Kingdom all impact assessments for new policy across government capture the absolute level of carbon emissions generated. The assessment of policy and management options will help to ensure the green growth pathway.
The study still has further analytical work in the future, the costs and benefits of various policy instruments also need to be carried out. Moreover, identifying country-specific policy priorities on the basis of a cross-country analysis and understanding of what is good practice from OECD countries help to promote international arrangements that are conducive to greener growth in both developed and developing countries.
Highlights
Provided a clear evidence of green growth pathway in OECD countries.
The empirical results of all parameters track the sound progress of green growth trend in OECD countries in 2000–2019.
Towards sustainable development, the policies and measures under OECD framework of strategy provide implications for policy makers.
Footnotes
Declaration of conflicting interests
The authors declared no potential conflicts of interest with respect to the research, authorship, and/or publication of this article.
Funding
The authors received no financial support for the research, authorship, and/or publication of this article.