
Abstract
We propose a vector error correction model to explore the causal correlation between green finance, economic growth, and renewable energy consumption from both short- and long-run perspectives to empirically evaluate the efficacy of green finance policies. Based on time-series data from 2000 to 2020, we use the unit root test method to examine time-varying trends and cointegration for time-series data. We find that renewable energy consumption has a negative relationship with emissions but green finance is positively correlated with economic growth. Green finance is the driving factor behind the increasing utilization of renewable energy in China. CO2 emissions per unit of GDP decreased by 1.077% for every 1% increase in green finance development. Although the share of renewable energy consumption increased by 1%, CO2 emissions per unit of GDP decreased by 0.55%. Therefore, green finance is significant in decreasing CO2 emissions; it has a negative impact on CO2 emissions and the renewable energy sector and must be addressed by financial policy, stability, and long-run sustainability. We categorized green finance, which refers to carbon finance innovations such as trusteeship, to improve market demand and eventually develop industries to expand the number of emission-control industries.
Introduction
Since the implementation of the open-door policy in China, the Chinese economy has been actively participating in the global economy and has played a more prominent and influential role in the global economic pattern than ever before 1 ; on the contrary, it is becoming widespread in this process. According to information provided by, global carbon atlas. 2020, 2 pollution increased from 913.4 (million tons) in 1971 to 10,668.4 (million tons) in 2020, with a 5.44% annual compound interest growth rate, and China's annual carbon dioxide (CO2) emissions exceeded 10 billion tons.3,4 Since 2005, China has surpassed the United States as the world's largest CO2 emitter. CO2 emissions (as measured by GDP per capita CO2 emissions) have declined in recent years but remain considerably higher than that in many other countries. In other words, China's CO2 concentration in 2010 was 1.79 kg/dollar, 11 times that of France, which was 0.16 kg/dollar. 5 Carbon emissions have a considerable impact on global climate change and people's social activities. At the 2009 Copenhagen Climate Summit, the Chinese government announced that they will reduce the intensity of CO2 emissions per unit of GDP in 2020 from 40 to 45% compared with the level of 2005. China has pledged to reduce its carbon footprint by 2030, and the share of nonfossil energy in primary energy to 20% as part of the Paris Agreement. The government supports international agreements by establishing national goals for faster peaks and cooling to limit average global temperature rise to less than 2°C. 6
Thus, green finance refers to investments, financing, working capital, and other financial services that facilitate the transition to a climate-resilient economy by encouraging environmental protection and improving climate-resilient infrastructure.7–11 Ten major banks signed the Equator Principles in June 2003. This would ensure that project financing is ecologically sustainable. 12
Since the Chinese government established its climate finance policies in 2015, the country's green financial system has steadily improved. Green bonds (or climate bonds) are the most recent policy toolkit for funding environmental resource mitigation, acclimation, or protection. 13 In 2018, China issued USD 554 billion in green bonds, making it the world's largest green bond issuer. 14 The objective of China's green credit policy has been achieved as per the microdata from listed firms in China from 2009 to 2017.
This study proposes a green finance development index to empirically examine the correlations among green finance, renewable energy consumption, and China's economic growth from 2000 to 2020 using the vector error correction model (VECM). This study contributes to the literature as follows: First, it explores the nexus between green finance and economic growth (CO2 emissions per unit of GDP). Previous studies primarily focused on financial development rather than green finance. Although green finance has improved rapidly, 15 China is the world's largest consumer of electricity and carbon emissions.16–19 Second, we create a green finance development index consisting of four financial indicators—green credit, green securities, green insurance, and green investment—as per official documentation. Several researchers have proposed various indices for assessing the quality of economic development. Kong et al., 2021 developed an economic quality index system based on efficiency, stability, and long-run viability.20,21 In recent years, researchers have focused on the impact of green finance’ on the quality of economic development. 22 Third, the numerous methodologies used in correlation studies that have examined long-run equality correlations could not identify such causal correlations. Engle and Granger (EG) developed a VECM by combining the cointegration and error-correction models. VECM imposes more constraints on the typical parameters of the error-correction model, overcomes the problem of pseudoregression, and captures linear correlations between many sequences. This depicts the dynamic adjustment of variables from short-run instability to long-run equality.23,24 To the best of our knowledge, no study has explored the causal correlations between green finance, renewable energy consumption, and economic growth in China.
The rest of this paper is divided into five sections. The second section provides a brief literature review and hypotheses. The third section demonstrates the research methods and data. The fourth section contains the empirical analysis and results. The fifth section presents conclusions and policy statements.
Literature review
Many studies have examined the correlation between financial development and CO2 emissions.25–30 Some studies in the first strand conclude that CO2 emissions and financial development have no statistically significant relationship with different degrees of correlation, such as ARDL, 31 VECM for Pakistan, 32 ARDL for Kuwait, 33 Augmented single equation model for Malaysia, 25 fully modified ordinary least square (FMOLS) for South Asia, 34 The Panel Correction Standard Error (PCSE) for (Pacific and Asia), 35 VAR Model for China,36,37 Panel Threshold interactive fixed effects (PTIFEs) for developed countries,38,39 Environmental Kuznets Curve (EKC) for set and developing economies, 40 Long short-run memory (LSTM) for the USA, China, Canada, and Nigeria,41–43 and GMM for SAAR Countries. 29 The second body of research found a statistically significant relationship between fiscal development and CO2 emissions, such as44,45 environmental Kuznets curve (EKC) for the USA 46 for selected Asian countries 47 for Canada and 48 for ASEAN countries49,50 for Africa 27 for 39 countries 28 for low-income countries. As per a study on the direct and indirect effects of financial development on carbon emissions, financial development promotes increased carbon emissions, financial development reduces GDP, and energy has an impact on carbon emissions. 51 The impact of financial development on CO2 emissions is dependent on financial development. Charfeddine and Kahia, 2019. examined the impact of renewable energy consumption and financial development on carbon emissions and found that renewable energy consumption and financial development are small and cannot explain carbon emissions and economic growth. 52 Financial development significantly increases state emissions, while reducing emissions in surrounding areas, resulting in an overall reduction in carbon emissions.36,53–55 The changes in a country's industrial structure are interconnected to carbon emissions, and financial development enhances the industrial system.44,56–58 Renewable energy consumption reduces the GDP per capita and CO2 emissions. The inconsistency of the findings outlined by Fang et al. 59 and Liu and Song 53 shows no clear consensus on the outcomes of financial development and per-capita GDP assumptions, time period assumptions, methods, and definitions of various financial variables. To analyze the financial development nexus, some studies adopt conventional time-series methodologies such as the autoregressive distributed lag approach-error correction model to detect long-run equality relationships (ARDL-ECM). However, VECM methodology outperforms non-predictive economic indicators. The error correction model (ECM) improves short-run forecasts while producing reliable long-run forecasts in an economic context.60,61 When variables are cointegrated, VECM outperforms VAR and BVAR in terms of prediction error.60,62,63 The ARDL, Spatial Durbin model, and Extended STIRPAT model were among the models that were unable to identify causal correlations among the variables.32,52,53,59,64,65
Our study is based on the following assumptions. First, studies on the relationship between green finance, renewable energy consumption, and economic growth is still limited and have generated inconsistent results. Second, according to global green finance index guidelines, we develop a green finance development index. Green finance has increased significantly in recent decades, and China is the world's largest emitter of CO2. Third, most studies employ the ARDL model to examine long-run equality correlations between variables instead of causal correlations. Therefore, we expand the research in this area by reviewing the long- and short-run correlations and causal relationships among green finance, renewable energy consumption, and China's economic growth.
Methodology and data
VECM model specification
This study employs the following empirical strategies. First, we use unit root tests and standard unit root tests, including Dickey–Fuller (DF) and Phillips–Perron (PP) tests, because green finance, share of renewable energy use, and economic growth follow time factors. These tests are vital as they help verify the stability of the variables, and incorporate time and time trends. Second, the discriminant criterion is used to determine the optimal lag order; and a cointegration test, to determine whether the variables are cointegrated. It is assumed that a stationary time series can be established by linearly combining two or more non-stationary time series. Therefore, temporary time-series cointegrations were performed, and the time series contained a unit root. The maximum likelihood cointegration test proposed by Johansen is widely used 66 and we used the same here. This versatile test determines whether the variables are serially correlated or appropriately determined. Third, the influence of a standard deviation (impulse) random disturbance term on the present and future values of all intrinsic variables were calculated using impulse response functions (IRF). Fourth, the effect of each change in intrinsic variables was examined using variance decomposition (VD) analysis to evaluate the relative correlation of each effect with the model's intrinsic variables. We chose VECM because earlier studies claimed that it performs better in forecasting economic indicators. 60 stated that “the error-correction models (ECM) should produce better short-run forecasts and will certainly produce long-run forecasts that hold together in economically meaningful ways.” VECM provides substantially lower prediction errors than VAR when the variables are cointegrated, particularly for a more extended period. 61 Consequently, error-correction variables reduce errors and support conclusions.60,62 Moreover, to evaluate whether the variables had a long-run stable correlation, we employed the VECM unit root test and cointegration. A time trend is included in the unit-root test, which strengthens the robustness of the results and makes them appropriate for determining random correlations between variables.32,59 Furthermore, the Granger causality test was used to determine the correlation among variables, whereas the causal relationship of the ARDL and fully modified least squares (FMOLS) or dynamic ordinary least squares (DOLS) cannot.67–69 In addition, we used the VECM to determine all variables 1 (1).
Consequently, it loses (degrees of freedom) owing to the presence of multiple variables and time-bounded observations based on the study's data.70,71 Finally, this study uses the VECM model to examine long- and short-run correlations between green finance (lnGF), economic growth (lnGDP), and share of renewable energy consumption (lnREC). Based on the tests described above, the model was constructed as follows:

where
Synthesis methods and data sources
The selection of weights is essential for estimating composite metrics. Principal component analysis, analytic hierarchy process, expert consultation, and entropic weighting methods were used to calculate the overall index. However, estimation of the composite index depends on the chosen weights. However, the green finance index typically employs a weighted synthesis method, which determines the weight of the criterion level via an expert scoring method, indicating that it mainly depends on the subjective judgment of experts. One of the subjective-based methods is the entropic weighting method. However, objective weighting methods are considered superior to subjective weighting methods.12,66,67 Multiplication synthesis was also adopted to reflect the comprehensive level. 68
The annual Chinese data used in this study were from 2000 to 2020. Variables used in this study include green finance, renewable energy consumption, and economic growth. Green credit and green security data and CO2 emissions are calculated in a million tons (Mt) obtained from the (https://www.wind.com.cn/, n.d.). Green insurance data were provided by Reference. 72 Green investment and renewable energy consumption data were obtained from Reference. 73 CO2 emission data were derived from the China Emissions Accounts and Datasets.74,75 Owing to insufficient data, the estimation duration was limited to 2000–2020. Interpolation was used to generate missing data.
Variable selection and description
Green finance
Green finance refers to financial indicators contributing to sustainable development.76,77 Green finance helps improve environmental quality by providing support and guidance to stakeholders, creating a situation that is both economical and environmentally friendly. 77 First, green finance enables companies to obtain large credit amounts through green management strategies. This has encouraged companies to undergo a green transition.77–79 Second, the green finance system allows stakeholders to monitor the entire project process and ensure adherence to green standards.20,77 Third, green finance encourages consumers to engage in green consumption, such as renewable energy consumption, by allowing financial institutions to adjust credit for purchasing green products, such as new energy vehicles. 77 The green finance development index can be divided into four categories: green credit, green securities, green investment, and green insurance. Green finance was designated as the target layer, and green credit, securities, investment, and insurance were chosen as the criterion layers.77,80–82 The four aspects of green finance are constructed as follows.
Green credit
Green credit primarily refers to the green deposit, mortgage loans, project loans, and loans of the enterprise.83–85 Banking institutions began publishing corporate responsibility statistics in 2006 and documenting sustainable finance in 2014. The green credit data were generated owing to data availability issues such as data discontinuity; listed companies have organized statistical standards and a short duration of issuance. Thus, green credit is calculated by dividing the total green credit of listed companies by the full credit. The index has the following advantages. First, the sample is relatively representative and covers the entire period. However, there were approximately 1090 publicly traded companies in 2000. By the end of 2018, 3550 of them were dispersed across the country's market. Second, well-known accounting firms’ data on the amount and use of loans by publicly traded corporations and data disclosed by publicly listed firms in financial reports are of high quality. Based on these considerations, this index was considered appropriate for this study.
Green securities
The green securities index is calculated as the ratio of the total market value of listed companies to that of environmental protection companies.84,86 However, there are three errors in this index. First, the business value of an enterprise fluctuates significantly. Second, the index is not related to green finance, which is intended to fund pollution control projects. Third, the index does not fully describe the country's overall financial position. Therefore, we rejected the estimation technique of References84,86 and used Yang et al. 77 method. To calculate green securities, we used the market capitalization ratio of firms listed in the pollution control business recorded in the prefecture and the overall market value of listed firms to calculate green securities. This index considers initial public offerings, additional issuances, ordinary bond issuances, and convertible bond issuances.
Green insurance
Green insurance pollution insurance for environment coverage is currently in its initial phase. Green insurance can be calculated with respect to the environmental pollution liability.77,87 This approach is considered appropriate because agriculture insurance strongly correlates with natural protection of the environment and social aspects. We used agriculture insurance to represent green insurance.77,87
Green investment
Green investment refers to the allocation of resources to environmental pollution control to reduce the environmental impact of enterprise operations and achieve sustainable development. This refers to investments made by the private and public sectors in energy conservation and environmental protection projects. 77 As our study focuses on the public sector, we calculated green investment as the ratio of China's tax spending on energy conservation and environmental protection to its total tax spending.
Renewable energy consumption
Renewable energy consumption is rapidly expanding worldwide to reduce CO2 emissions.57,58 However, the energy intensity in the highly expanded state, decreases by 2.2% for every 10% increase in renewable energy consumption.28,88 This study used the total consumption ratio of hydropower; solar, wind, and geothermal energies; and biofuel and biomass to analyze renewable energy consumption.
Economic growth
The World Development Index (WDI) published data on China's CO2 emissions from 1990 to 2018. The interpolation method was used to process the annual per capita CO2 emission data from 2019 to 2020.
Table 1 presents a descriptive analysis of the main variables, which reveals significant differences between the variables. The standard deviations indicate that the variables are widely distributed throughout their means. This demonstrates that renewable energy consumption is negatively correlated with emissions, and lnGF has a significant positive effect on lnGDP. Figure 1 presents the trends in uneven development from 2000 to 2020 and indicates that the green finance index value changes over time but slowly rises, approximately tripling by 0.02416 to 0.08413, while renewable energy consumption increased by more than eight times from 11,536.33 to 69,817.32 Mt. carbon emissions per unit of GDP decreased by 0.04889 to 0.01313. These variations can explain the variations in emissions of lnGF and lnREC over time.
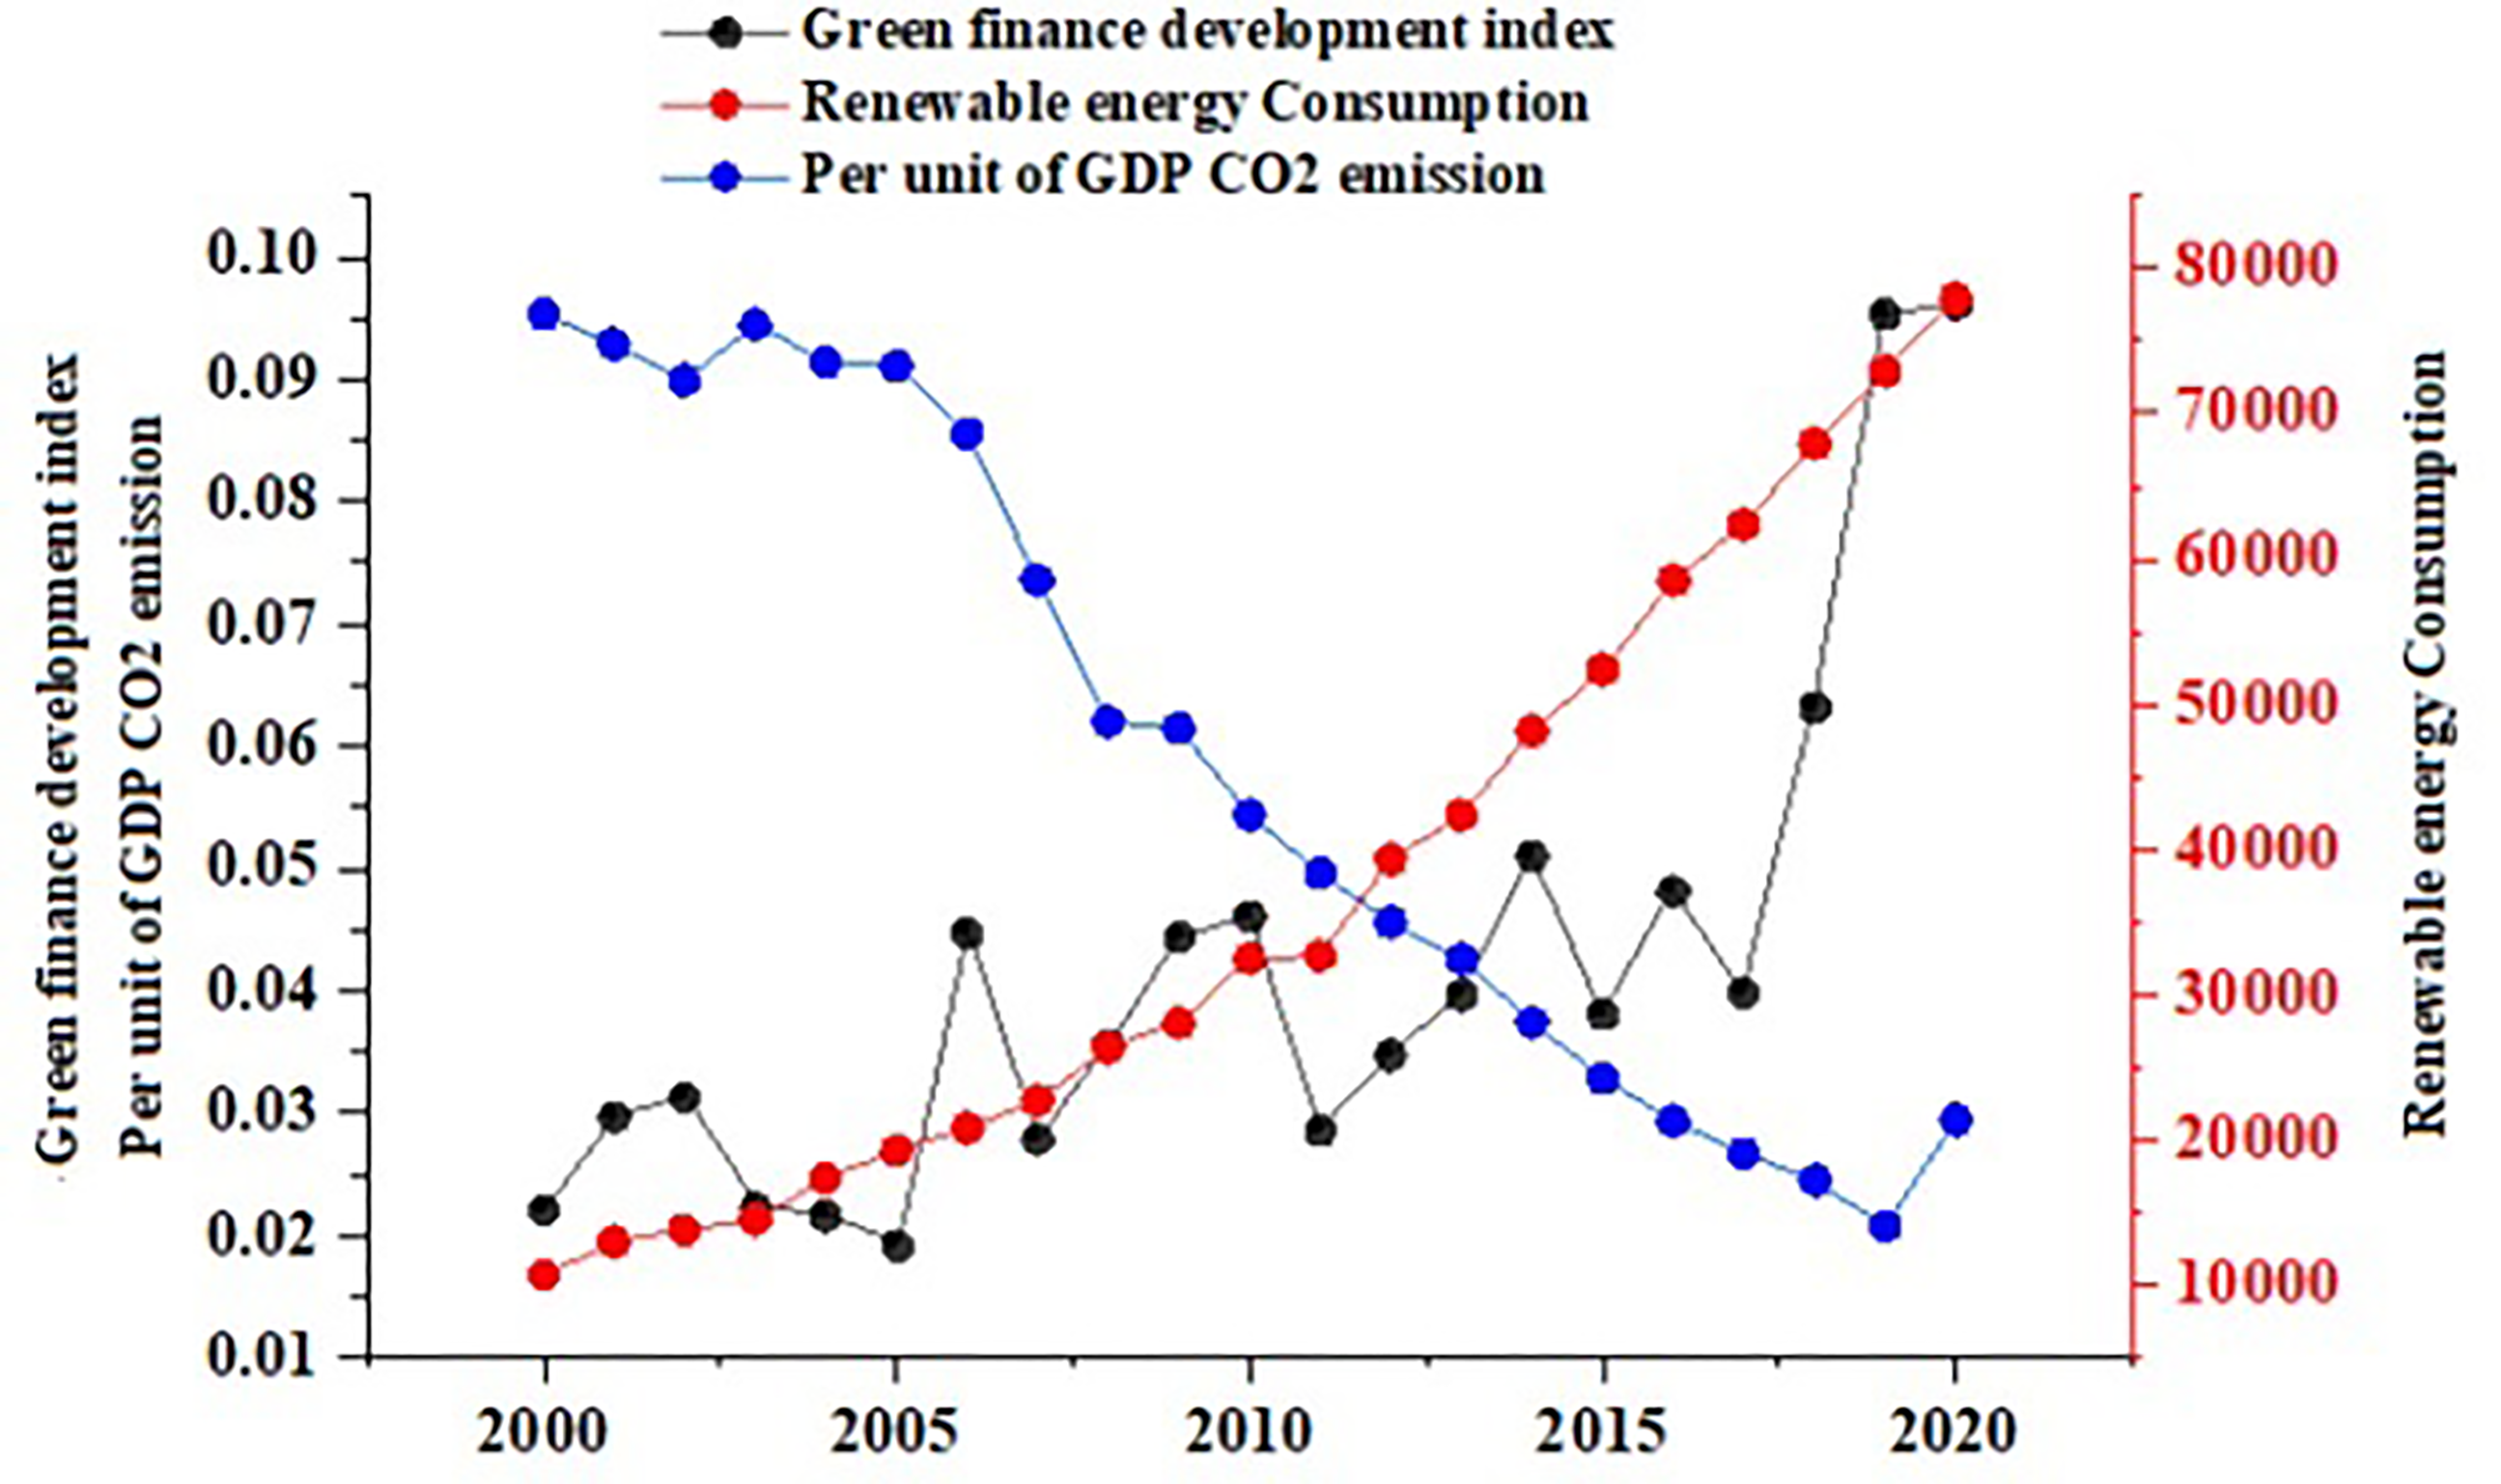
lnGF, lnREC, and lnGDP development trends.
Descriptive statistics of the main variables.
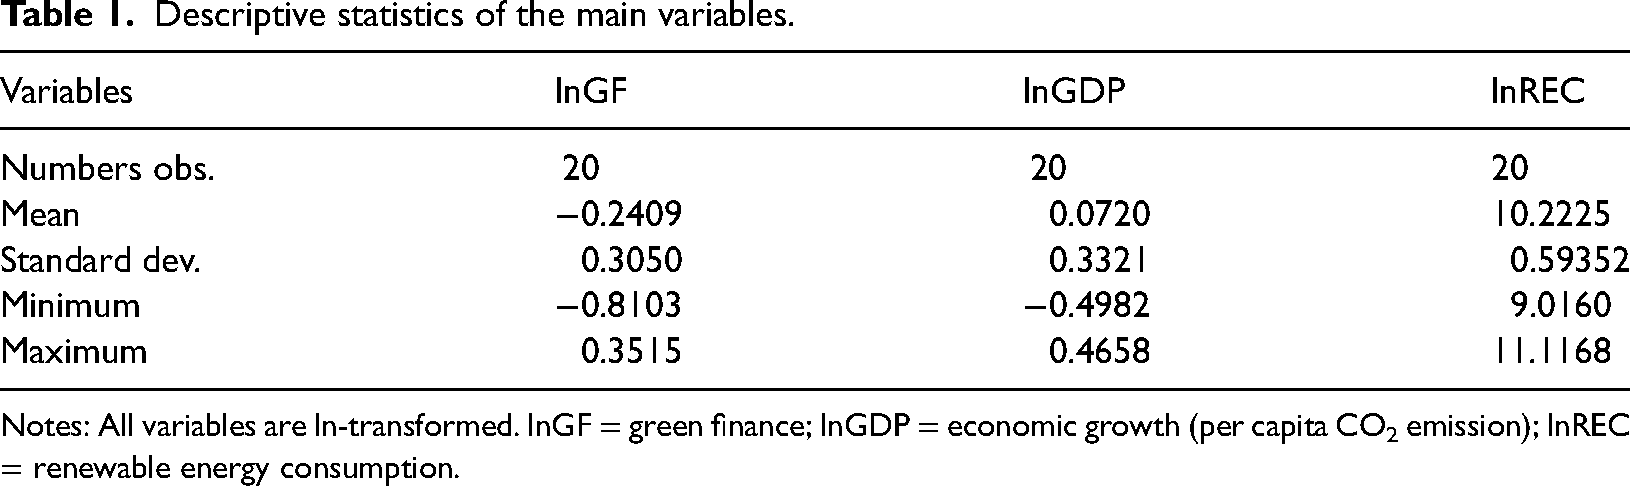
Notes: All variables are ln-transformed. lnGF = green finance; lnGDP = economic growth (per capita CO2 emission); lnREC = renewable energy consumption.
Empirical analysis
We applied unit root tests based on ADF (PP) statistics, which only considered the intercept terms. Table 2 summarizes the results, indicating that none of the serial correlations met the 10% significance level. However, after adjusting for time trends, economic growth (lnGDP) failed the unit root test, whereas green finance (lnGF) and renewable energy consumption (lnREC) passed the unit root test. The ΔlnGF, ΔlnGDP, and ΔlnREC Δ indicate a series in first difference scores, and they are all balanced, implying that the first series was a single essential. Cointegration, Schwartz's Bayesian Information Criterion (SBIC), Akaike's Information Criterion (AIC), Final Forecast Error (FPE), Levin Lin (LL), Likelihood Ratio (LR), and Standard Hannan Quinn Information (HQIC) were used to calculate the sequence determination of lag fluctuation. Except for FPE and LL criteria, we found that almost all variables are significant in the third lag order, and all variables are considered in the third lag order. Table 3 presents the findings of the cointegration tests. Table 4 contains the conclusions of the co-integration test. The null hypothesis of “no conintegration correlation” was rejected, and the additional theory was accepted. The trace statistic for the assumptions of “at most two-cointegration correlation” was 1.1888, which is considerably less than the critical threshold of 3.55 at the 93 percent probability value. In contrast, the null hypothesis was accepted. According to Johansen's cointegration test, lnGF, lnGDP, and lnREC showed long-term co-integration correlations. Therefore, the long-run cointegration equation is represented as follows:

ADF, PP, and KPSS unit root tests.
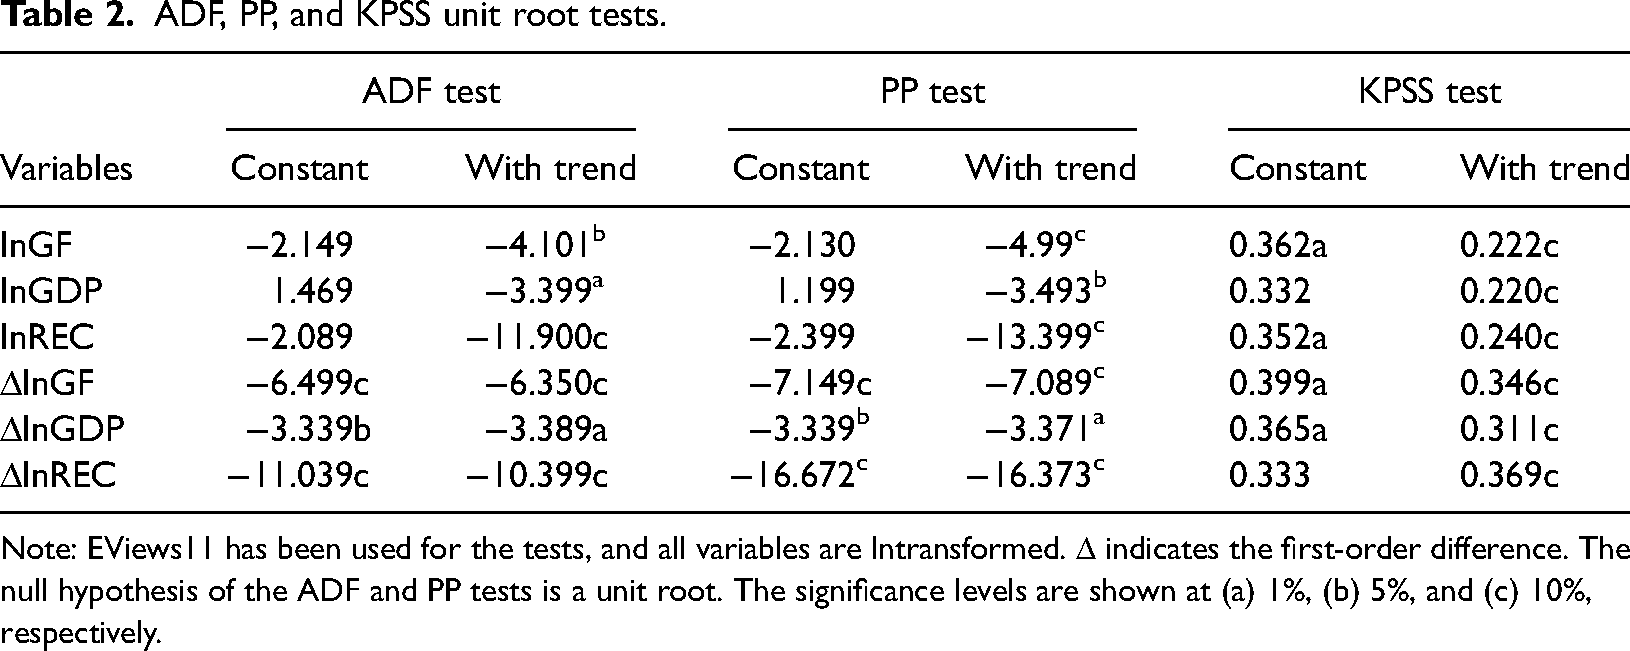
Note: EViews11 has been used for the tests, and all variables are lntransformed. Δ indicates the first-order difference. The null hypothesis of the ADF and PP tests is a unit root. The significance levels are shown at (a) 1%, (b) 5%, and (c) 10%, respectively.
The Johansen cointegration test.
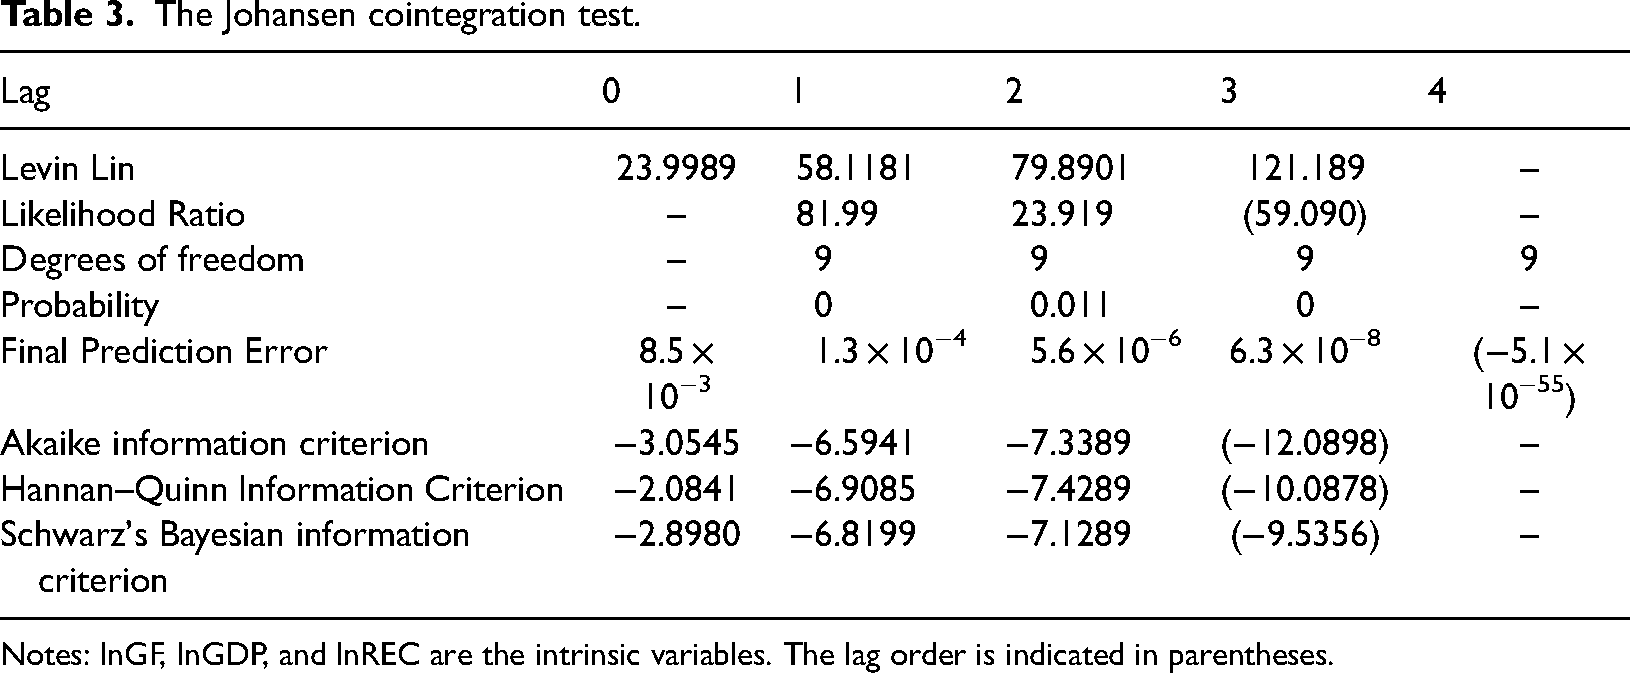
Notes: lnGF, lnGDP, and lnREC are the intrinsic variables. The lag order is indicated in parentheses.
Results of the Johansen cointegration test.

Note: Number of optimal cointegration relations presented in the parenthesis.
The statistics in parentheses represent the standard error (SE) of Equation 2. The cointegration equation calculates the long-run cointegration of each variable and reveals a positive correlation between green finance and renewable energy consumption at the 1% level. This suggests that green finance is a key factor driving up renewable energy consumption in China. Unless green finance rises by 1%, economic growth related to carbon emissions falls by 1.080%. Simultaneously, when the share of renewable energy consumption rose by 1%, and economic growth related to carbon emissions fell by 0.60%. Moreover, the long-run equality correlation between economic growth and development, green finance, and renewable energy consumption was negative. This empirically supports the growth of green finance and renewable energy consumption to reduce carbon emissions per unit of GDP.
Estimation of VECM
Based on the above analysis, the VECM model is expressed as follows:


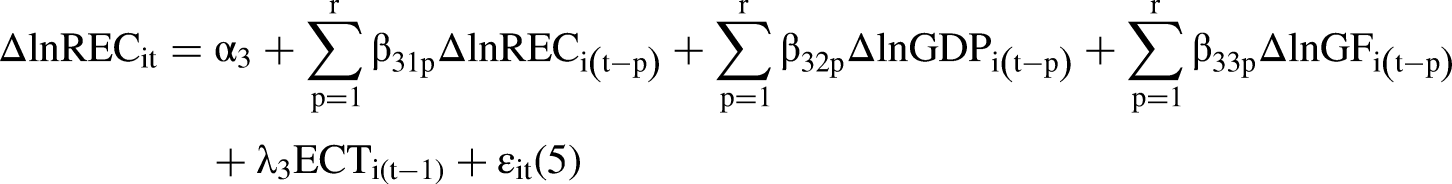
VECM represents the correlation between short-run fluctuations in each variable and long-run equality. T, as well as the correlation between the
VECM was developed based on the preceding analysis. Table 5 presents the results. The R-squared values are 0.7899, 0.7990, and 0.7999, which are all close to one, indicating that the coefficients of all three equations are significant and the fit is good. According to the findings, Model 1's error correction coefficient has a positive value of 2.0701, indicating that as lnGF proliferates and shifts down, it reverts toward its long-run equality position. Despite violating the downward correction criterion, Model 2 had a coefficient of 0.0201, which was insignificant, although it did not meet the downward correction criterion. The Model 3 coefficient is 0.1725, which is the same as Model 2.
Findings of the VECM model.

Note: (1)The signs c, b, and a represent significance at the 1%, 5%, and 10% levels, respectively; (2) standard errors are reported in parentheses.
At 10% and 5%, respectively, the other variable in (Model 1) makes the first and second lag phases of ΔlnGF positive at 1% significance. The second lag of ΔlnGDP is adversely associated with the variables, and the actual value of this coefficient was more considerable as additional factors in Model 1. This finding indicates that lower variations in carbon emissions significantly affect green finance. As carbon emissions are rising, quick-growing energy-intensive industries are also increasing, all wealthy and requiring a large amount of capital to initiate. Increased funding for such firms ultimately reduces the funding for green initiatives, leading to a decline in the green finance development index. Furthermore, ΔlnREC's first hysteresis coefficients are positively and strongly connected to ΔlnGF. The coefficients of ΔlnGF are lower than those of ΔlnREC, indicating that renewable energy is the main factor of short-run green finance adjustment.
At the 1% significance level, ΔlnGDP is negatively associated with the second lag of ΔlnGF in Model 2. This correlation reveals that when CO2 emissions do not match the long-run equality point in the short time frame, ΔlnGF can help significantly to drop CO2 emissions. The coefficient for the second lag phase is higher than that of the first lag phase, indicating that the inhibitory effect of green finance has a wide range of hysteresis. At the 5% level, the first and second lag variance correlations of ΔlnREC were also substantial, indicating that ΔlnREC has a significant self-destructive impact. In contrast to other models, Model 2 has a smaller exact value of coefficients on every variable than the other two. The results imply that it has easily grown in the short time phase and challenging to decrease.
At the 1% level, the first and second lags of ΔlnREC in Model 3 are negative, implying that economic growth is not affected faster by other factors than the other models. Therefore, reducing emissions in a short timeframe is challenging.
Stationarity test of VECM
To examine the impulse response results shown in Figure 2, a stationarity test was performed on the cointegration correlation. All the eigenvalues are less than or equal to and lie within a unit circle. The model is thought to be stable, and both cointegration equations pass the stationarity test. This indicates that the research can proceed to further analyses.

Eigenvalues and modulus of the VECM.
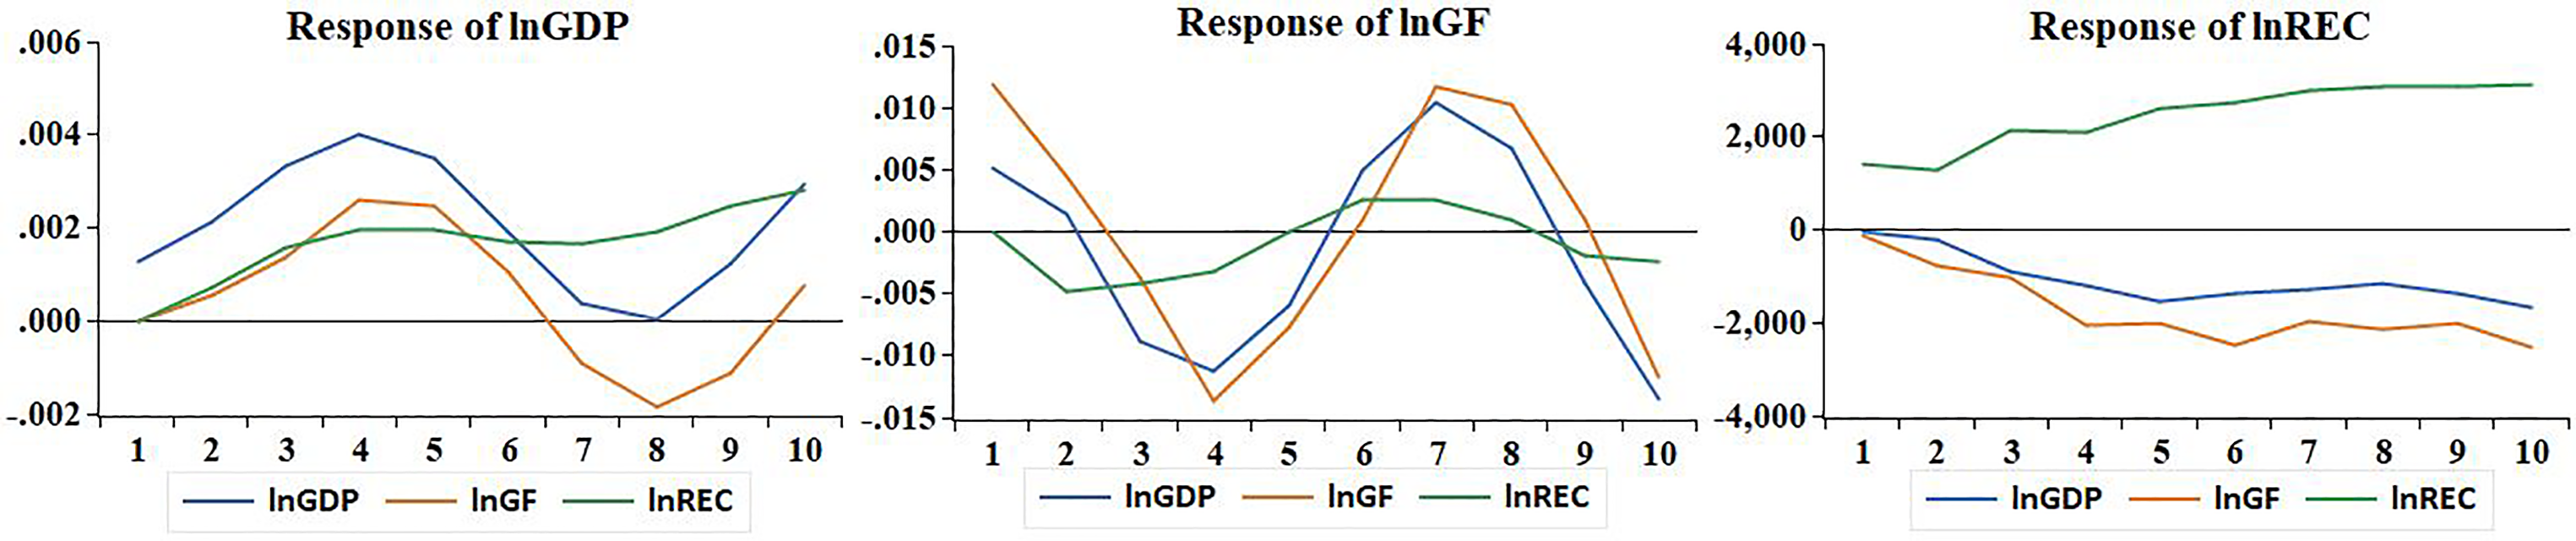
Impulse response analysis
Figure 3 presents the findings of the VECM's impulse response analysis. Each figure represents the effect of a particular variable on different variables, while each line depicts the impacts of various variables on the same variable. The x-axis scale represents the set response phase (in years). The lnGDP figure's response indicates the variables’ effect on lnGF. Economic growth has a minimal impact on green finance, showing that the influence of economic growth on green finance varies from 0. Except for phases 1, 4, and 8, the impact of lnGF itself is positive, with a maximum level of 5%, implying that the growth of green finance is primarily affected by itself. lnREC has a slight inhibitory impact on lnGF.
Responses to correlations between lnGDP, lnGF, and lnREC.
The lnGF response indicates the impact of a component of lnGDP, lnREC, and lnGF on the lnGDP element, with the lnGF response remaining negative. After fluctuating during the first eight phases, the maximum impact occurred in the third phase and remains stable below 1. These findings indicate that the growth of green finance significantly affects the long-run reduction of carbon emissions. In contrast, lnREC has a minor impact on lnGDP. Consequently, China has not been able to develop renewable energy, and its energy structure requires rapid change.
The lnREC response to lnGDP, lnREC, and lnGF indicated a one-unit standard deviation. The slopes of the three responses are high. Both lnGDP and lnGF exert a detrimental effect on lnREC. This study reveals that changes in CO2 emissions and green finance have a detrimental effect on renewable energy consumption. The effect of lnREC on itself is positive. However, it has a considerably lower effect than the other variables, indicating that renewable energy's capacity is insufficient and directed by external factors.
Variance decomposition
Figure 4 represents the variations in lnGF, GDP, and REC. The VD (variance decomposition) and lag orders were similar to the impulse response. Table 6 presents the contributing variations of VD to the 1st, 5th, and 10th phases of the variables. lnGF is reportedly influenced by itself, whereas the other variables display only a minimal effect. Energy structure adaptation played a lesser role. These findings were similar to those of the impulse response analysis—the variations of lnREC. The response to the variation of green finance grows dramatically from the 1st to the 2nd phase and is maintained at approximately 50–60%. Renewable energy consumption contributed the most significantly initially, and then steadily declined to 22%.

lnGF, lnGDP, and lnREC variation decomposition.
Contributing variations lnGF, lnGDP, and lnREC.
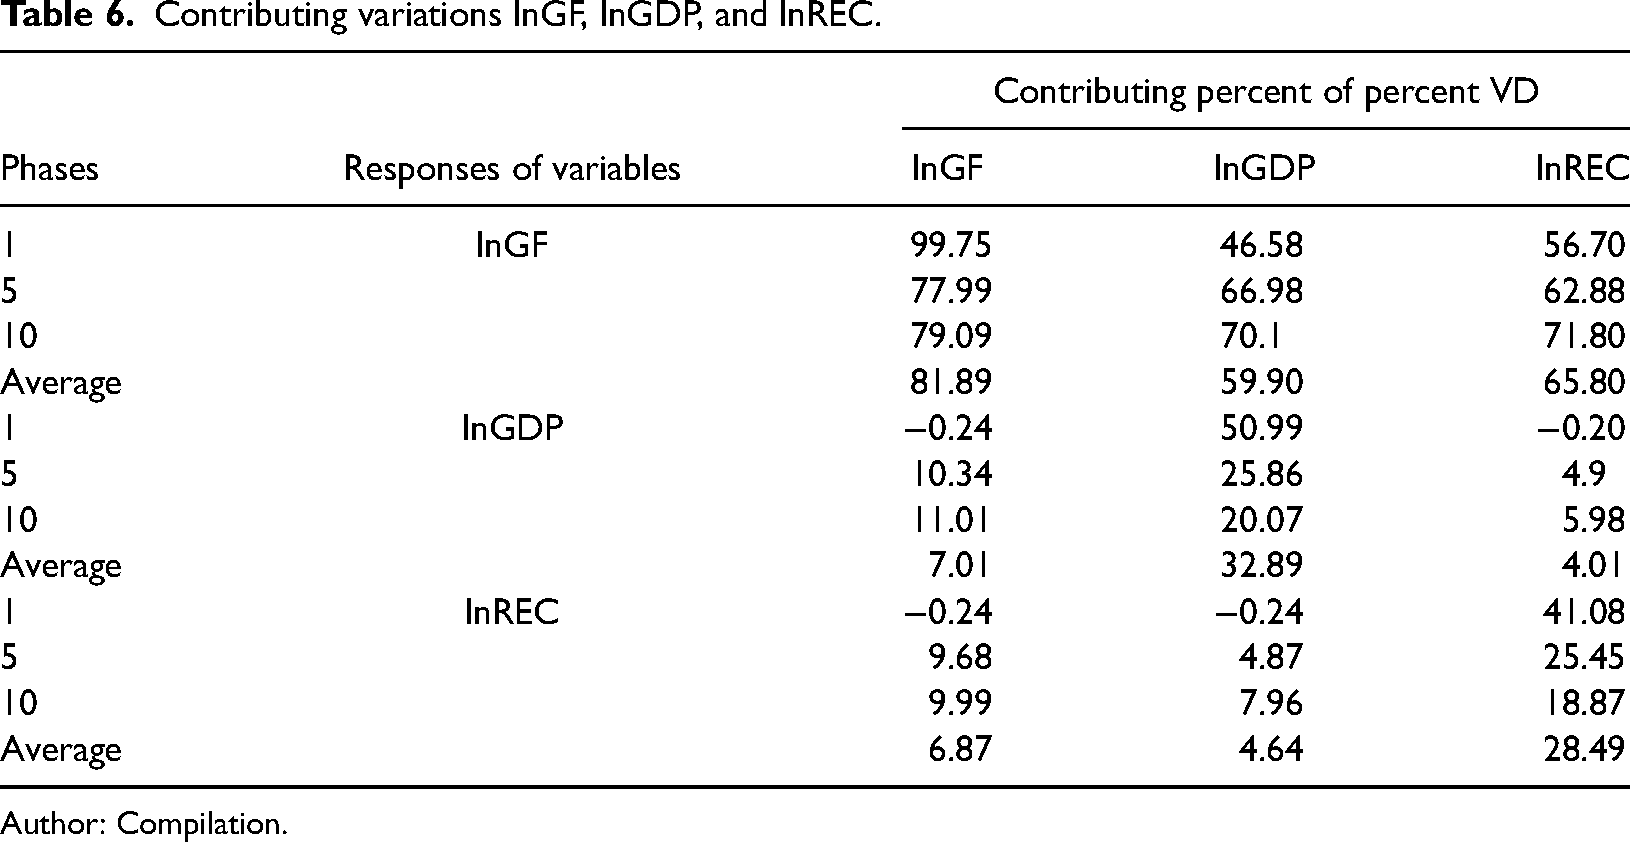
Author: Compilation.
According to the variations of lnGDP from the 1st phase, the impact of lnGF on carbon emissions grows dramatically and is maintained at over 50% around the 5th phase. The contribution of carbon emissions to VD increased around the 4th phase and was balanced by approximately 22% thereafter. This implies minimal renewable energy assistance. lnGF thus plays a considerable role in reducing carbon emissions, although the effect is minimal and gradually increased by approximately 10% throughout the phase. These three variables support the development of green finance and renewable energy sources. Almost 60% of all the variables are accounted for by green finance development. Furthermore, upgrading renewable energy sources contributed to a slight reduction in emissions.
Granger causality test
The Granger causality test is used to analyze the causal correlations between economic variables based on “prediction.” lnGDP, lnGF, and lnREC are all similarly related. Thus, the variables were considered balanced after a first-order variation of approximately 10%. The Granger causality test was performed after the initial difference in each variable. The results are presented in Table 7. At the 1% level, the correlation between lnGDP and lnGF was interdependent and considerable, and a close relationship was observed between lnGDP and lnREC. Although there is interdependence causation among lnGF and lnREC at 10%, the Granger causality test for lnGF and lnREC presents a p-value of −0.106, indicating that green finance does not play a major role in advancing new energy growth.
Granger causality test findings of ΔlnREC, ΔlnGDP, and ΔlnGF.
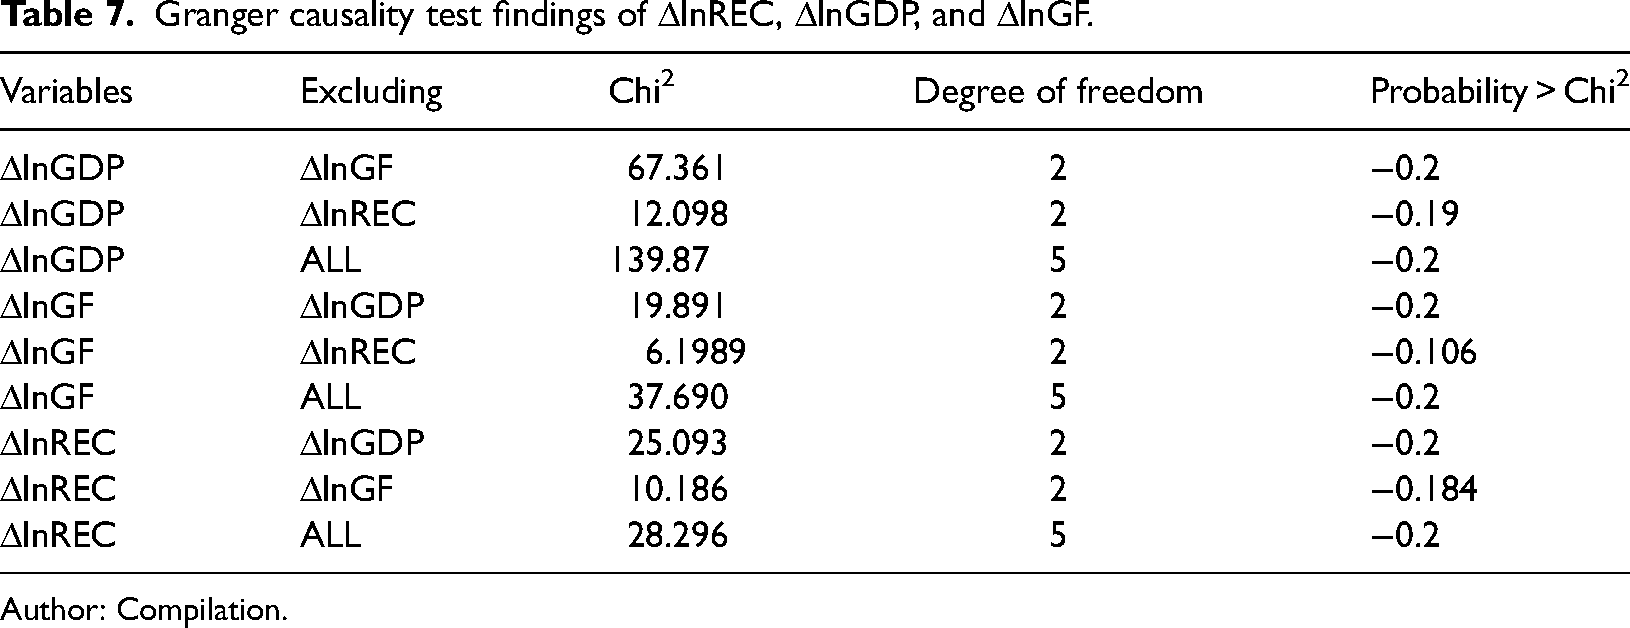
Author: Compilation.
Conclusion and policy implications
We examined the causal correlations among lnGF, lnREC, and lnGDP by adopting the VECM model and Chinese data from 2000 to 2020. We developed an index of green finance to conduct a more thorough investigation and make specific recommendations. The empirical results confirm the significant long-term equality correlations among lnGDP, lnGF, and lnREC. Improvements in lnGF and lnREC levels resulted in a decline in CO2 emissions. Simultaneously, short-run estimates show a decline in green finance and renewable energy consumption, leading to increased CO2 emissions. While short- and long-run, green finance and per capita CO2 emissions have a negative effect on renewable energy consumption. China's green financial policy has significantly impacted carbon mitigation, although its impact was always short and inconsistent. In contrast, its development was based on self-sufficiency and relied on policy support. Finally, as CO2 emissions gradually increase over time, reducing CO2 emissions within a limited timeframe is difficult.
These empirical results have important policy implications for green finance. Our theoretical model proves the following. First, variations in green finance have an adverse effect on CO2 emissions and the renewable energy sector, and that there is a need to improve financial policies along with stability and sustainability, which are key to emission reduction. Green finance confirms the advancement of energy conservation on a wide scale. Second, green finance policies and rating systems are still in their early stages, and practical implementation standards are insufficient for the time being. Financial regulators must accelerate the development of green financial products and enhance financial institutions’ capacity to provide green credit.
In comparison, the central government should strengthen its monitoring of provincial governments to maximize the effectiveness of green finance and support the green industry. Third, additional investment in fundamental research is required in implementing green financial products while mitigating associated risks. Effective short- and long-run policy interventions are necessary to accelerate the development of green finance. China's austerity policy requires that more than 85% of its green banking activities come directly from the private sector to achieve green development. Consequently, more beneficial policies should be implemented externally, resulting in a boom in private sector green finance.
Policy and implications
Green finance for renewable energy industries should be increased. In general, renewable energy consumption in China is determined by economic conditions. This energy is costlier than that derived from fossil fuels.18,58,89,90 We found that using renewable energy has a beneficial effect and helps the economy grow. However, this finding demonstrates that reducing energy consumption (fossil energy) has a detrimental effect on economic growth. The long-run cointegration indicates that renewable energy consumption (hydropower, solar energy, wind energy, geothermal energy, and bioenergy—biofuel and biomass) can effectively reduce carbon emissions.28,57 The results highlight the importance of public initiatives, such as various service schemes required to enable climate finance products or services, rebates for investing in clean energy sectors, green energy investment criteria, and the formation of businesses for wind and solar power to widen China's power generation base.91,92 Besides the relevance of financing for green sources and advancement in low-interest loans, financing regulations and lowering the credit approval period will also reduce the dependency on nonrenewable sources and limit the long-run environmental degradation owing to carbon emissions. 80
Sci-tech innovation can promote renewable energy by improving green credit and green investment. 93 The mechanism test results show that small- and medium-sized board markets can considerably expand the number of renewable energy businesses as their primary business. Thus, renewable energy growth can be improved by sci-tech innovation, and green finance can be endorsed by increased green credit and green investment. To this end, the eastern, central, and western regions have increased their support for renewable energy and emphasized the systematic, holistic, and coordinated development of sci-tech innovation and renewable energy across the country's various states and regions. We must continue to advocate financial support for organizational development. Additionally, there is an urgent need to unleash the sci-tech innovation mechanism to effectively promote sci-tech innovation implementation and progress, and support renewable energy.51,89 However, the securities economy must be strengthened to support small- and medium-sized enterprises, and project interest requirements should be lowered. While green businesses are enumerated, the quantity and percentage of funds raised to complement liquid assets or return borrowed funds ought to be reasonably comforted with regard to evaluating and approving business securities disbursement.
Governments, agencies, and organizations should enhance the emissions trading market and apply a carbon emission approval framework. Governments must improve their management of pollutant emission permits and work with large businesses to reduce CO2 emissions. 94 Climate regulators must anticipate the issue of fines and unauthorized pollution by polluting industries. Governments must combine additional penalties and legal sanctions to bolster heavy industries’ environmental audits. 91 Stakeholders with various interests are urged to work together to boost investors’ confidence in market demand and transactions. Not only is the lack of demand for carbon subsidies a problem for China, but it is also a significant factor behind low prices in major global carbon markets. The promotion of financial capital and industry contraction has reduced the urgency of emissions reduction in the world's major carbon markets.95,96 Simultaneously, allowance, which is both a fixed and excessive demand weakness, is exacerbated by supply.96,97 Therefore, professional financial institutions must participate in the carbon market, develop diverse investor bases, reduce entry barriers for investment firms and individuals, and increase investor volumes. Carbon finance innovations, such as collocation, are also required to boost market demand, gradually expand the industry, and increase the number of emission control companies. However, the government must ensure that quotas are allocated fairly. In addition to ensuring uniformity in CO2 emissions, the validity period of the government-issued free allowance must be determined. Market repurchases establish a country-led market regulatory mechanism to address overallocation and price risks caused by recessions and other factors.
Future research direction
Future studies can be conducted from the following perspectives. First, the threshold model could be used to investigate the correlation between variables and identify the breaking points. Second, the influence mechanisms of green finance and green growth can be studied. Third, future studies can compare the results by applying the model with additional control variables to different time series.
Footnotes
Declaration of conflicting interests
The authors declared no potential conflicts of interest with respect to the research, authorship, and/or publication of this article.
Funding
The authors received no financial support for the research, authorship, and/or publication of this article.