
Abstract
Non-renewable energy fosters economic growth, whilst simultaneously it serves as the primary source of carbon dioxide (CO2) emissions. Using data from the world's three major carbon emitters over the period 1980–2020, this paper adopts the non-linear autoregressive distributed lag (NARDL) approach to explore the dynamic nexus between energy consumption, economic growth and CO2 emissions. The results reveal that energy consumption matters for economic growth. From a short-term perspective, an increase in oil consumption positively impacts economic growth in the United States and India, whereas a negative shock solely affects China's economic growth. Regarding coal consumption, a positive shock only affects the US's economic growth, while China and India are more likely to be affected by a negative consumption shock. In the long run, the nexus between oil consumption and economic growth exhibits a similar asymmetric pattern in China and the United States. Concerning the effect of coal consumption on economic growth, only negative shocks count for China and positive shocks for the United States. The findings also identify various patterns of energy consumption on CO2 emissions. An increase in oil consumption, whether from a short- or long-run perspective, increases CO2 emissions in all three countries, while a decrease in oil consumption only mitigates CO2 emissions in China and the United States. There are more complicated patterns to the role of coal consumption in CO2 emissions. The results vary significantly from country to country; however, energy consumption has generally promoted economic growth as well as resulted in environmental issues that cannot be disregarded.
Introduction
The balance between economic expansion and environmental sustainability has emerged as a critical global concern in recent years. The rapid economic growth driven by science and technology has significantly improved people's living standards. However, people are also facing unprecedented ecological issues, including the desertification of grasslands, the depletion of the ozone layer and the excessive release of greenhouse gases.1,2 These gases not only deteriorate environmental quality but also endanger human physical and mental health. As such, they are widely recognized as a major global hazard. According to the Statistical Review of World Energy (2022) released by British Petroleum (BP), in the year 2020, the countries of China, the United States and India emitted 9.97, 4.42 and 2.28 billion tons of carbon dioxide (CO2), respectively. The sum of CO2 emissions from the three countries accounts for 52% of the total global carbon emissions. 3 Major countries which significantly contribute to carbon emissions should undertake the responsibility for the mitigation. In this sense, it is significant to take the top three emitting countries as research samples. Since energy consumption has always been closely related to economic growth and environmental degradation, this paper aims to investigate the relationship between energy consumption, economic growth and CO2 emissions.
This study is mainly associated with two strands of literature. The first strand is concerning the nexus between energy consumption and economic growth; the second strand is on the relationship between energy consumption and CO2 emissions. Regarding the effect of energy consumption on economic growth, four viewpoints have been developed in the existing literature: promotion, inhibition, neutrality and non-linearity. Some empirical studies documented a promoting effect of energy consumption on economic growth. For instance, Wolde-Rufael 4 argued that nuclear energy consumption exerts a positive and statistically significant role in India’s economic growth. Wang and Lee 5 argued that clean energy consumption has a positive effect on economic growth in China. Alper and Oguz 6 found that renewable resources have contributed to economic growth in new European Union member states. Using a panel data set of 16 sub-Saharan African countries for an empirical study, Adams et al. 7 provided evidence on the feedback relationship between energy consumption and growth. Alshehry and Belloumi 8 confirmed the hypothesis of energy-led growth in Saudi Arabia. Similar results have been reported in a number of studies.4,9–13 Contrary to the promotion effect, some studies have documented an inhibition effect. For instance, Chandio et al. 14 argued that industrial oil consumption is found to exert a negative effect on the long-term economic growth in Pakistan, whilst demonstrating a statistically significant and positive impact on short-term economic growth. Using a panel of 23 emerging economies, Acheampong et al. 15 argued that economic, social and political globalization interacts with energy consumption to hinder economic growth. Moreover, neutrality effects have been reported within the literature. According to Akhmat and Zaman, 16 in most South Asia countries, the causality between energy consumption (whether renewable or commercial) and economic growth tends to support the neutrality hypothesis. Yoo and Ku 17 reported that no significant correlation between the utilization of nuclear energy and economic progress in Argentina and Germany has been observed. In France and Pakistan, a unidirectional causal relationship exists between economic growth and nuclear energy consumption, with no discernible feedback effects. The neutral effect of nuclear energy consumption on economic growth in France and Germany is confirmed. 18
Apart from the three effects mentioned above, a number of studies have reported a non-linear relationship between energy consumption and economic growth. For instance, Chen et al. 19 argued that there is a threshold effect with regard to the role of renewable energy in economic growth in some developing countries. When surpassing the threshold, the effect is positive, whereas when falling below the threshold, a negative effect is observed. However, Saliminezhad and Bahramian 20 argued that beyond an optimal level, clean energy consumption is unlikely to have a significant impact on China's economic growth. Based on a panel quantile regression for a data set compiled from 33 countries, Zhou and Li 21 documented that the relationship between the consumption of renewable energy and economic growth exhibits a W-shaped pattern. In comparison, the relationship between the consumption of renewable energy and emissions follows an inverted N-shaped trend. Furthermore, the relationship between non-renewable energy consumption and emissions takes the form of a root-shaped curve. Doğan et al. 22 adopted the same panel quantile regression technique to study 32 European countries. The authors reported that renewable energy consumption enhances economic growth, while non-renewable energy consumption exerted both a positive and a negative role in different quantiles.
Regarding the second strand, current research is abundant yet the theoretical viewpoints and empirical results are also mixed. A positive correlation between non-renewable energy consumption and CO2 emissions is usually reported. For instance, Jayasinghe and Selvanathan 23 documented that non-renewable energy consumption positively and significantly contributed to CO2 emissions in India. Shafiei and Salim 24 found that fossil energy consumption increases greenhouse gas emissions in Organization for Economic Co-operation and Development (OECD) countries. Rehman et al. 25 argued that fossil energy consumption has significantly increased CO2 emissions in India and China. Primary and fossil fuel energy consumption significantly increases CO2 emissions in some middle-income countries located in South and Southeast Asia. 26 The positive relationship between non-renewable energy consumption and CO2 emissions has been confirmed in a vast literature. 27 However, a number of studies have drawn opposite conclusions. For instance, by decomposing the total changes in CO2 emissions in China into four factors, Sun et al. 28 argued that the steel production effect is the major factor accounting for the increase in CO2 emissions, while the energy consumption effect is found to significantly mitigate CO2 emissions. Using a sample of the top six CO2 emitters, Ortega-Ruiz et al. 29 argued that population expansion constitutes the principal impetus behind the increase of CO2 emissions, whilst energy intensity represents a main factor in mitigating CO2 emissions.
In terms of clean energy or renewable energy, the conclusion often undergoes some changes. Hoang et al. 30 presented a review work that examines the application of advanced renewable energy technologies to reduce CO2 emissions in the maritime sector, which accounts for around 3% of global CO2 emissions. 31 Shafiei and Salim 24 reported that renewable energy can reduce CO2 emissions in OECD countries. Dong et al. 32 documented that nuclear energy and renewable energy consumption significantly reduce CO2 emissions, whereas the mitigating effect of nuclear energy consumption is much smaller than that of renewable energy consumption. Under the environmental Kuznets curve (EKC) framework, 33 Khattak et al. 34 showed that renewable energy consumption reduced CO2 emissions in Russia, India and China, three out of the BRICS (Brazil, Russia India, China and South Africa) countries. Using a sample of seven emerging economies, including China and India, Adedoyin et al. 35 confirmed the mitigating effect of renewable energy use. The mitigation effect of renewable or clean energies is also confirmed by some works.36,37 However, there exists research argues that renewable energy does not improve environmental quality. For instance, Pata 38 argued that renewable energy does not mitigate CO2 emissions in Russia and India. Gao and Zhang 39 showed that total biomass energy consumption cannot reduce CO2 emissions in 13 Asian developing countries.
Most studies have explored the effect of energy consumption on economic growth or CO2 emissions, which identify a unidirectional causal relationship. However, there exists substantial research exploring the causal relationship between energy consumption, economic growth and CO2 emissions, from a two-way causal perspective. Likewise, the outcomes are mixed. To sum up, the findings exhibit patterns of one-way causality,40,41 two-way causality42,43 or mixed results. 44 In terms of methodology, various techniques are adopted to investigate the causal relationship between energy consumption and economic growth. These methods include, for instance, the Dumitrescu-Hurlin panel Granger causality test, 45 the demand and production model, 46 panel cointegration and causality analyses, 47 the exponential decomposition method, 48 the Autoregressive distributed lag model (ARDL) approach and granger causality test, 49 panel dynamic ordinary least square models, 50 the Toda-Yamamoto Granger Causality test, 51 etc.
Several research gaps emerge following a comprehensive review of the existing literature pertaining to this topic. First, most of the extant research focuses on total energy consumption, whereas specific energy types may affect economic growth and environmental quality differently. This kind of aggregation analysis is likely to impact the precision of policy efforts pertaining to specific energy types. Thus, this paper analyzes the relationship between the consumption of specific energy types (oil and coal), economic growth and CO2 emissions. Second, the current works concerning energy consumption, economic growth and CO2 emissions mainly focus on examining whether there is a one-way or two-way causal relationship between variables. That is, most of them are based on qualitative methods without establishing a specific quantitative relationship between variables. Instead, this paper aims to examine the quantitative relationship between the consumption of specific energy types and economic growth and CO2 emissions in three major emitting countries, thus conducive to formulating relevant policies and guidelines. Third, although some studies investigate the quantitative relationship between the variables, most of them are limited to analyzing symmetric relationships between the variables. This paper adds to the literature by using the non-linear autoregressive distributed lag (NARDL) approach to investigate asymmetric relationships between the variables to provide a more reasonable analytical framework for policymakers.
The rest of the paper is structured as follows. The Methods section describes the data and models used. The Results and discussion section describes the empirical analysis. The Conclusions and policy implications section summarizes the main findings and puts forward some policy proposals.
Methods
Data and variables
As a country with a huge population, China is the world's largest energy consumer. Although China is adjusting its economic structure, its energy demand is expected to continue to rise for a few years. In terms of energy types, coal and oil are the primary sources, accounting for 58 and 20% of China's total energy consumption, respectively. 52 The United States is the second largest carbon emitter in the world. With regard to energy sources, oil, natural gas and coal are the primary sources of CO2 emissions. Although oil and natural gas are expected to remain the primary sources of energy consumption by 2050, renewable energy is expected to grow rapidly. 3 As the third largest energy consumer in the world, India's strong economic growth and rapidly expanding population will continue to increase energy demand. From 1990 to 2018, India's primary energy consumption almost tripled. Coal and oil are still the primary sources of energy consumption, accounting for 45 and 26% of India's total energy consumption, respectively. 52 According to the above analysis, coal and oil are the primary energy sources in these countries. Therefore, this paper selects oil and coal consumption as critical variables to examine their influence on economic growth and CO2 emissions.
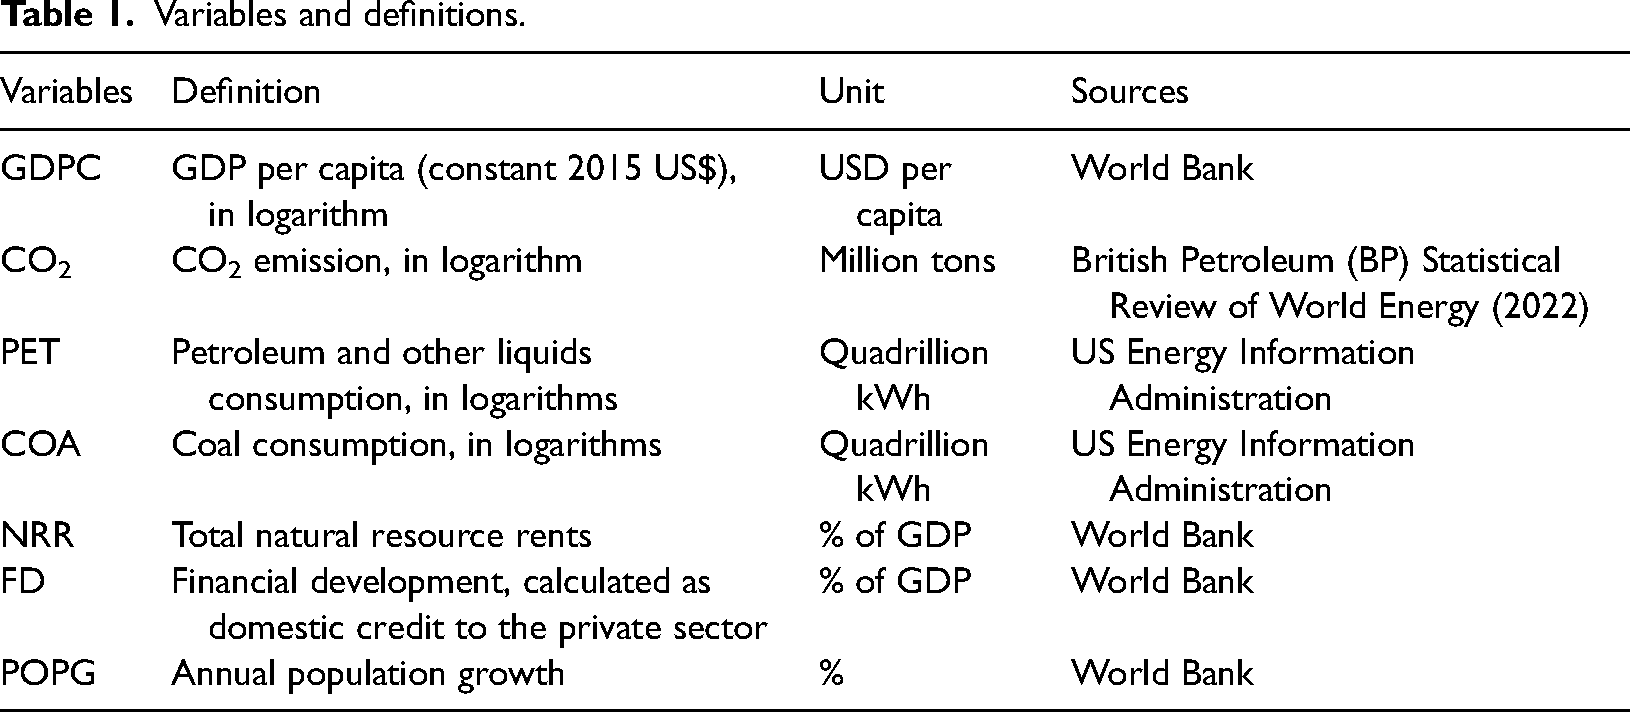
This study utilizes annual data ranging from 1980 to 2020, sourced from the World Development Indicators of the World Bank, BP Statistical Review of World Energy (2022) and the US Energy Information Administration (EIA), to analyze the economic development and environmental quality of China, the United States and India. The dependent variables specified are gross domestic product (GDP) per capita and CO2 emissions, while energy consumption is represented by oil and coal consumption. In addition, control variables such as total natural resource rents, financial development and population growth are also taken into account. The variable, abbreviation, definition and data source are presented in Table 1.
Variables and definitions.
Empirical strategy
The empirical work follows five steps (Figure 1). (i) Conducting unit root tests to check the stationarity of the variables. First, the Augmented Dicky-Fuller (ADF) test 53 and Phillips and Perron (PP) test 54 are adopted to check the stationarity of the variables without accounting for structural breaks. Then, the Zivot–Andrews (ZA) unit root test, 55 which allows structure breaks in both the level and slop of the series, is applied to ensure the reliability of the results. (ii) Implementing the Broock, Dechert and Scheinkman (BDS) test to detect the existence of a non-linear long-term relationship. (iii) Estimating the NARDL model to explore the nexus between the variables in both the short and long term. (iv) Carrying out some post-estimation tests to enhance the credibility of the results. For instance, the Wald test is used to check for asymmetric effects in the short and long run. The cumulative sum (CUSUM) and the cumulative sum of square (CUSUMQ) tests 56 are used to check the model's stability. (v) Describing the cumulative dynamic multiplier effects.

Flowchart of the empirical framework.
Energy has always been closely related to the economic development of various countries and is a crucial factor driving their economic development. However, in recent years, many studies have shown that non-renewable energy has also created serious environmental problems while fostering economic development. This paper concentrates on the relationship between non-renewable energy consumption, economic growth and environmental quality. The relationship among the variables from a long-term perspective is modeled as:


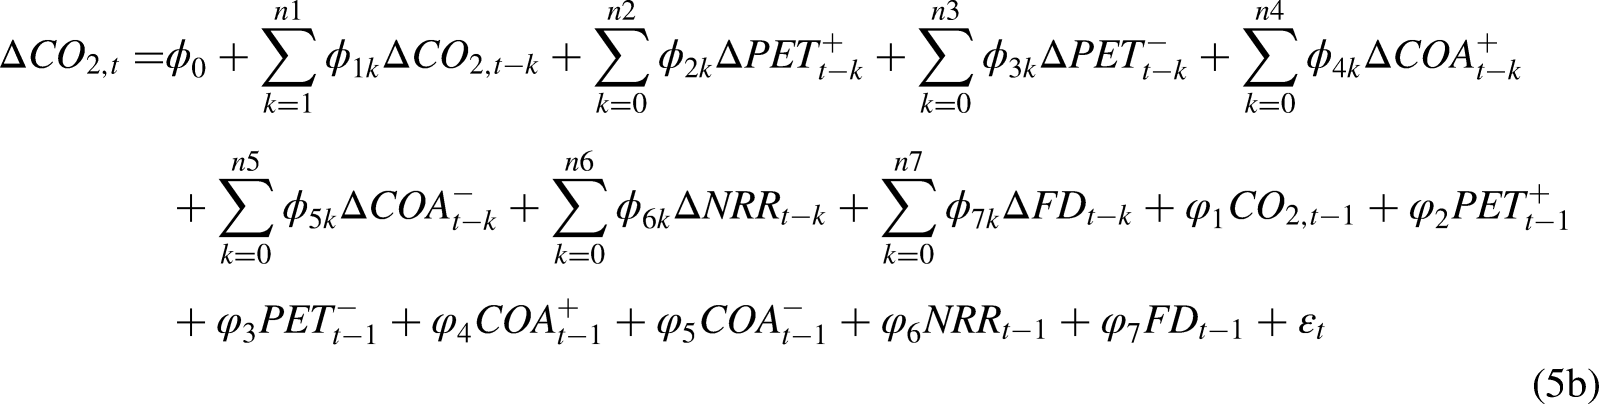
Results and discussion
Unit root test results
This paper first performs the unit root test to examine the stability of variables without considering structural breakpoints. Specifically, the ADF test 53 and the PP test 54 are adopted. The results presented in Table 2 show that the variables in the three panels (China, the United States and India) are stable at I(0) or I(1), consistent with the prerequisite of the NARDL model.
Unit root statistics.
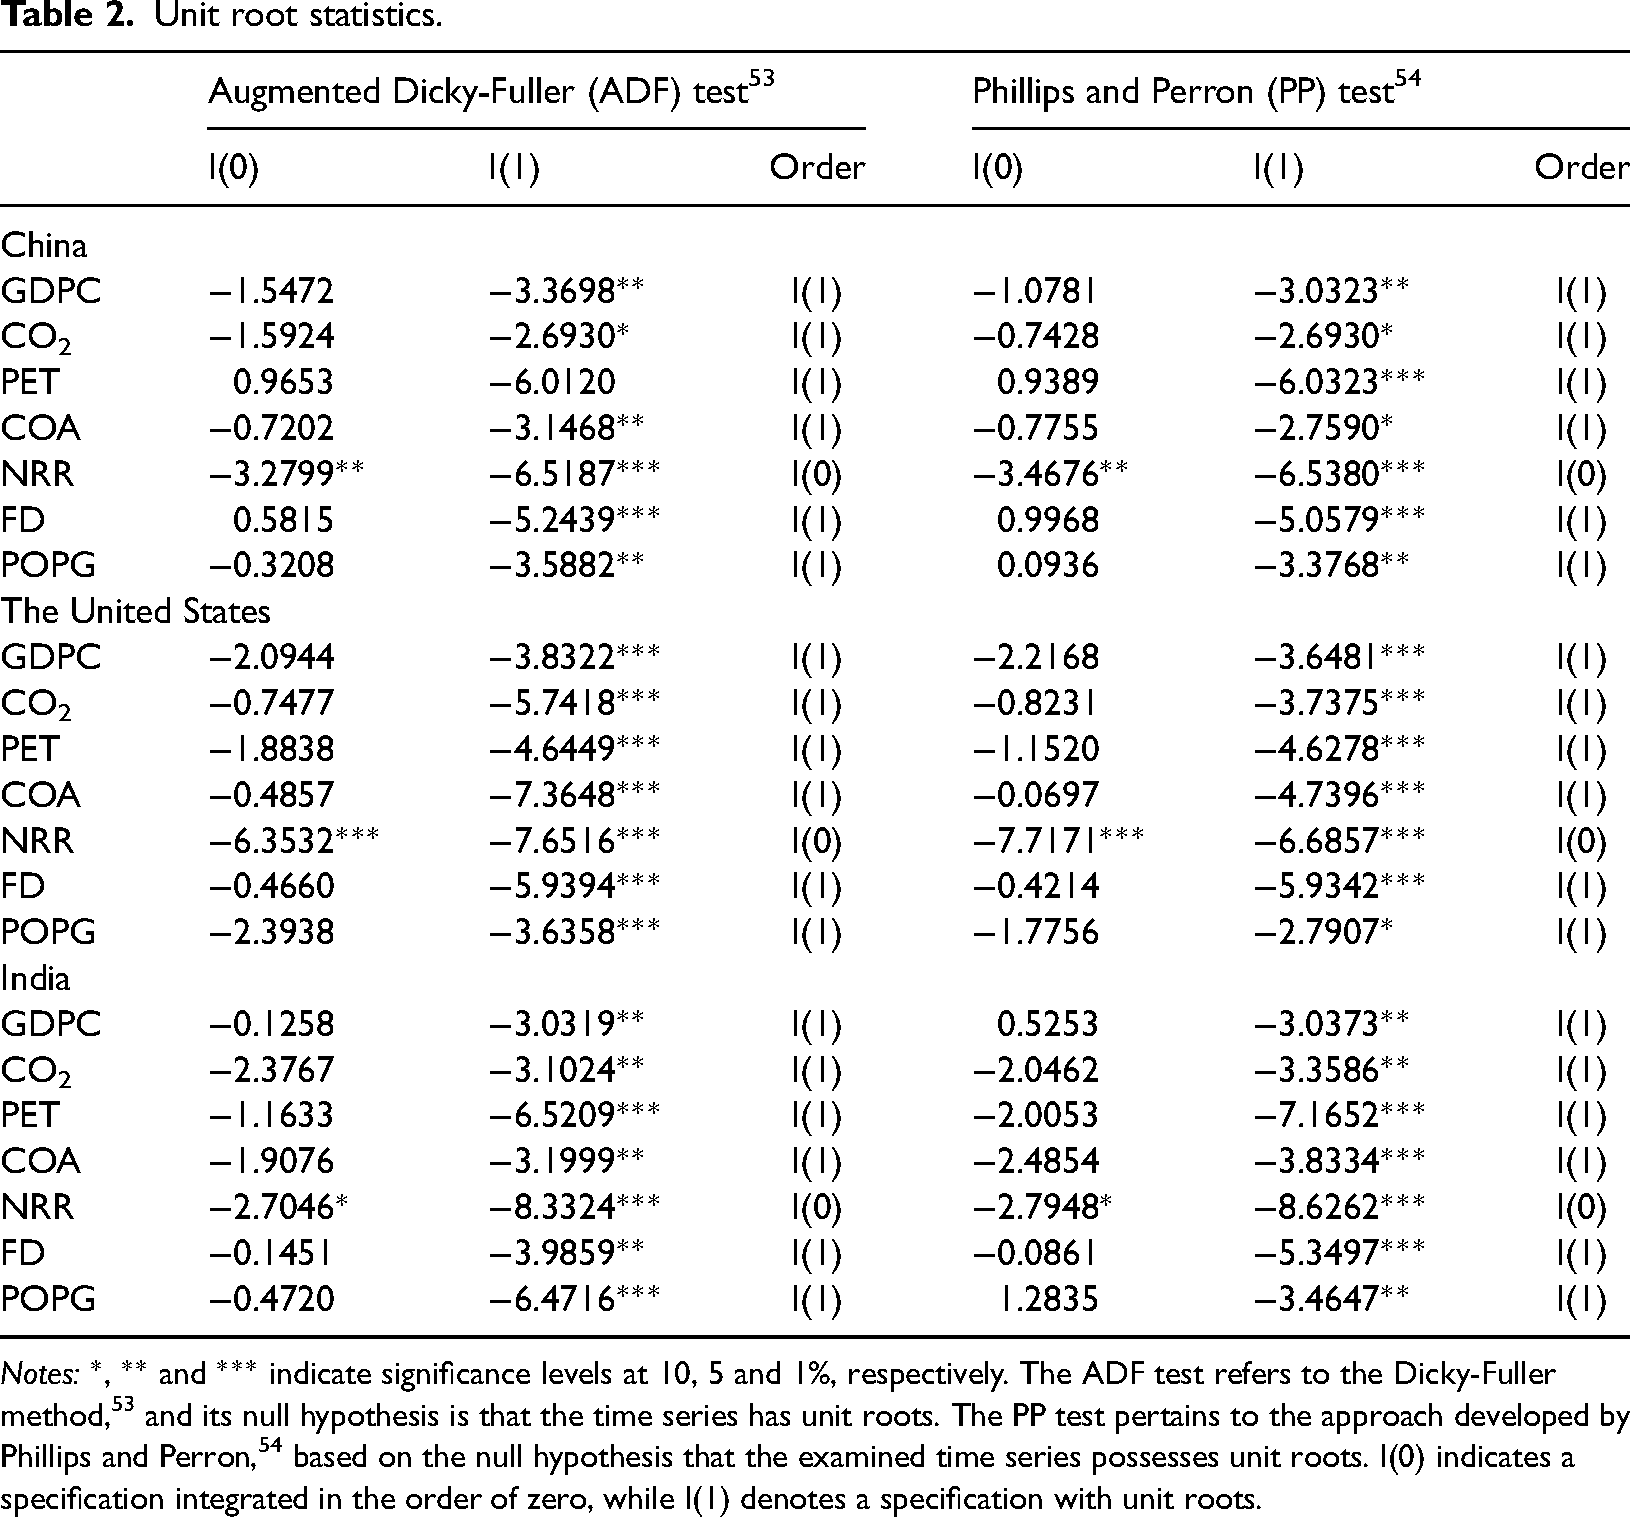
Notes: *, ** and *** indicate significance levels at 10, 5 and 1%, respectively. The ADF test refers to the Dicky-Fuller method, 53 and its null hypothesis is that the time series has unit roots. The PP test pertains to the approach developed by Phillips and Perron, 54 based on the null hypothesis that the examined time series possesses unit roots. I(0) indicates a specification integrated in the order of zero, while I(1) denotes a specification with unit roots.
Structural unit root test
Without accounting for the structural break of variables, the traditional unit root test may lead to incorrect inference. Therefore, this paper applied the ZA structural break trended unit root test to ensure the reliability of the results. 55 The test results in Table 3 are consistent with the traditional unit root test results. Thus, the variables are still stable when the structural breakpoint is considered, which meets the variable stability requirements of the NARDL model.
Zivot–Andrews structural unit root test. 55
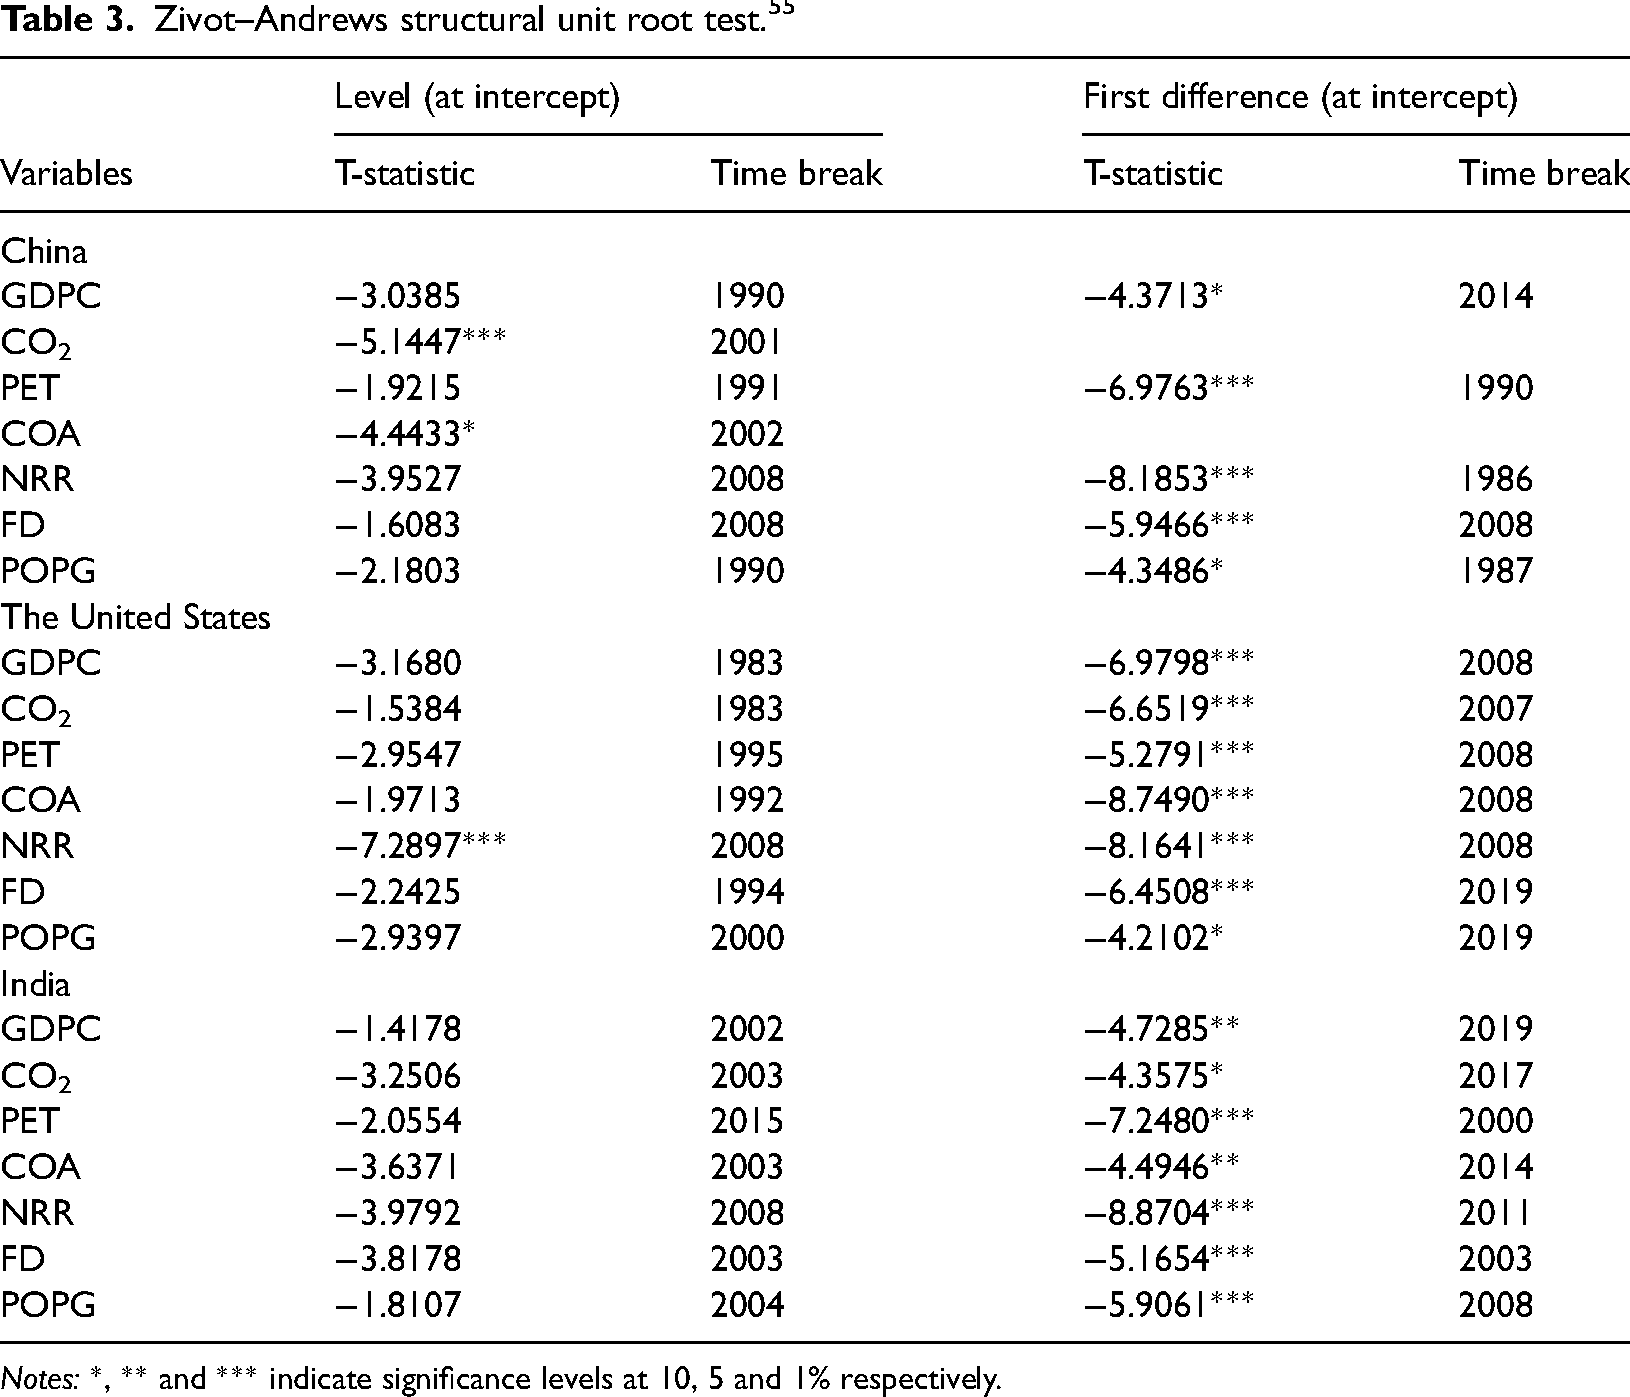
Notes: *, ** and *** indicate significance levels at 10, 5 and 1% respectively.
BDS test results
After testing the stability of the variables, it is still needed to test the existence of a non-linear relationship between the variables. The BDS test, proposed by Broock et al., 63 is initially developed as a non-parametric approach to test independent and identically distributed residuals. It is now widely adopted as a general measure for detecting model misspecification, particularly when employed for the analysis of residuals derived from fitted models. 58 The test results presented in Table 4 reveal that each variable of China, the United States and India significantly rejects the null hypothesis. That is, it is believed that there is a non-linear relationship between the variables.
BDS test for non-linearity results. 63
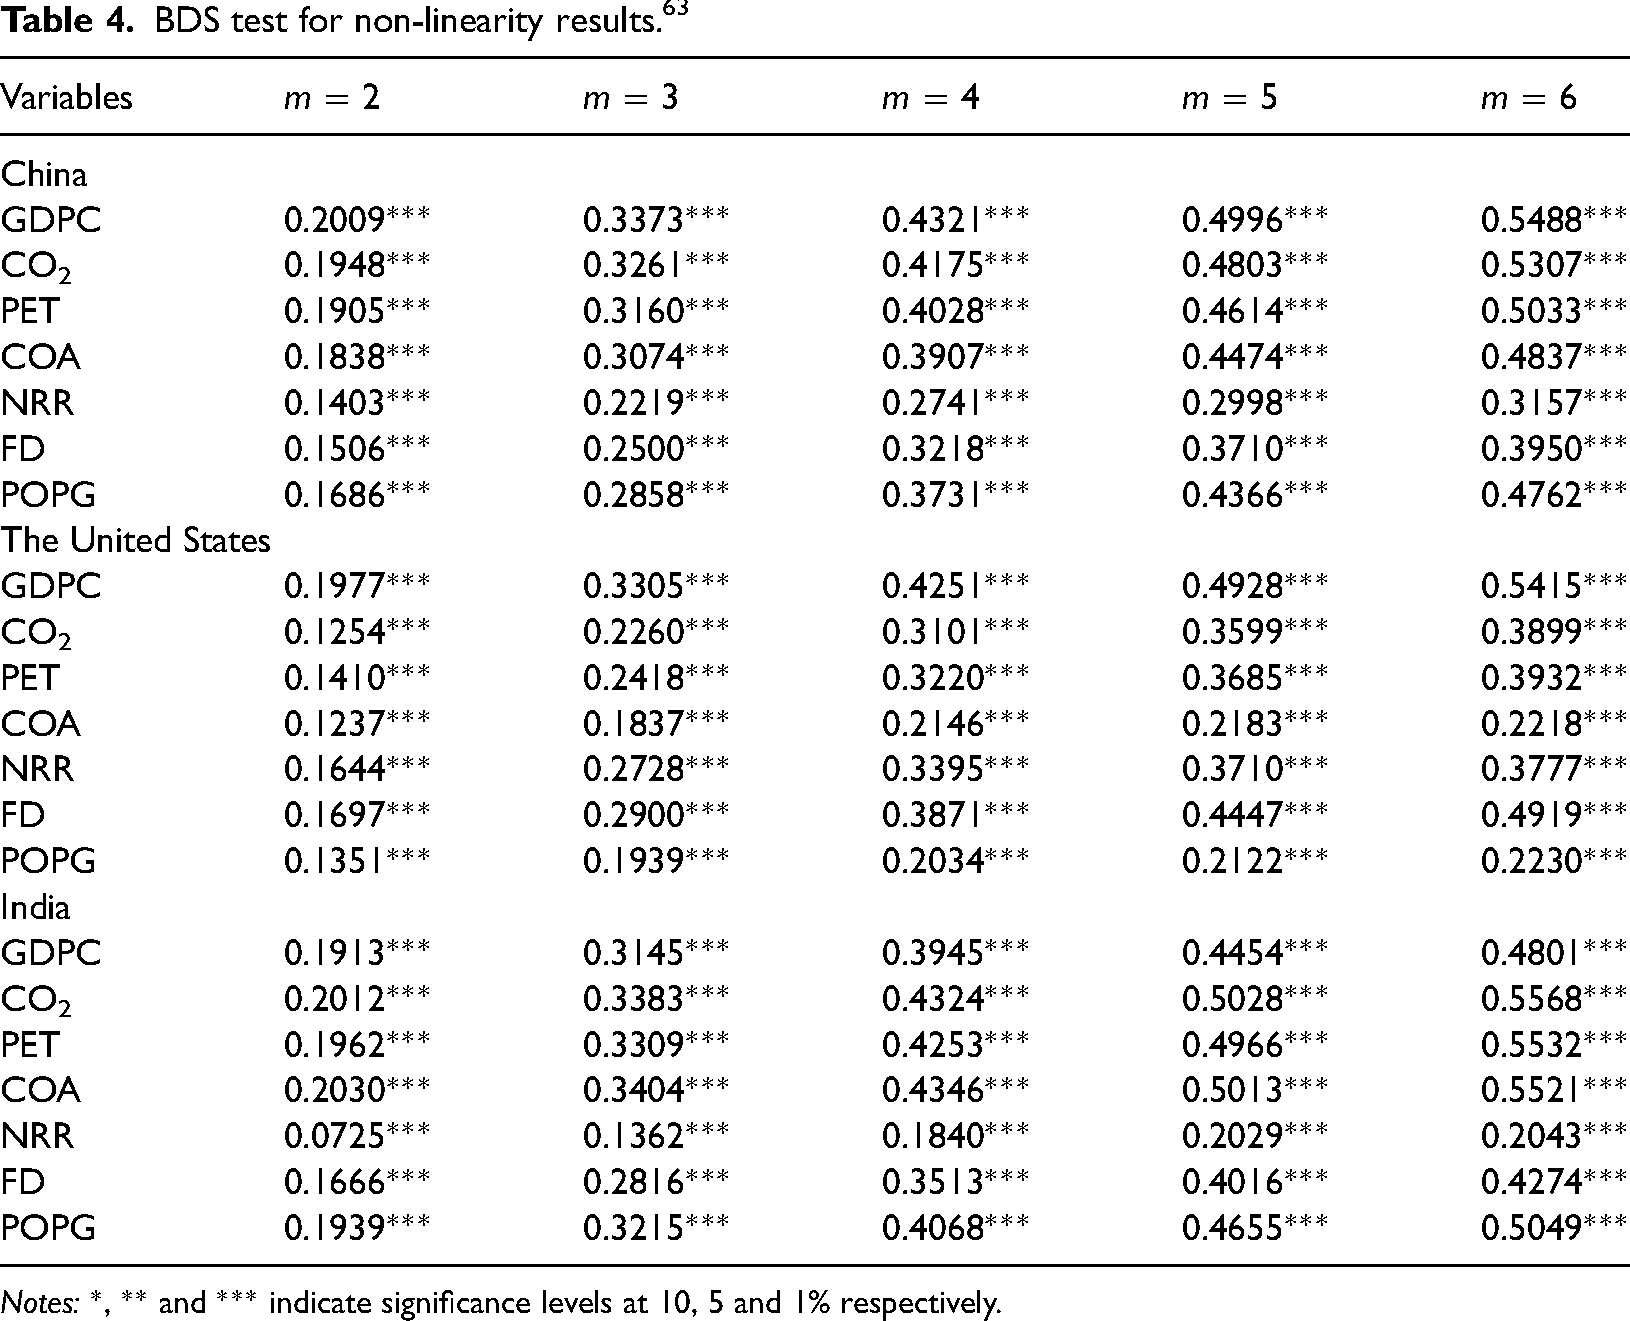
Notes: *, ** and *** indicate significance levels at 10, 5 and 1% respectively.
NARDL estimates for economic growth
After examining the non-linear relationship between the variables from the three countries, this paper continues to estimate the NARDL model. Table 5 presents the asymmetric effects of non-renewable energy consumption on economic growth, which are divided into three panels. Panel A reports the short-term estimated coefficients for the three countries; Panel B reports the long-term estimated coefficients; and Panel C reports a series of correlation tests. According to the results, in the short term, a positive change in oil consumption positively impacts economic growth in China, the United States and India; however, the estimated coefficient is insignificant for China. Specifically, a 10% increase in oil consumption will cause the per capita GDP of the United States and India to increase by 7.003 and 2.591%, respectively. However, a 10% negative change in oil consumption will cause China’s per capita GDP to increase by 13.556%. The short-term asymmetry test of oil consumption shows that only the United States fails to reject the null hypothesis; that is, there is a short-term asymmetry in oil consumption in China and India. There are some differences between the long-term and the short-term results. In the long-term, a positive (negative) change of 10% in oil consumption can increase (decrease) the per capita GDP by 7.869% (22.747%) in China and 11.452% (2.314%) in the United States. Our results are consistent with Saboori and Sulaiman, 64 who applied ARDL and VECM to investigate the EKC of Malaysia and found that increasing energy consumption, such as oil and natural gas, will promote economic growth. The Wald test results also confirm an asymmetry in the long-term changes in oil consumption in China and the United States. Only India fails to reject the null hypothesis; that is, the positive and negative oil consumption changes symmetrically affect per capita GDP in the long run.
NARDL estimates for economic growth.
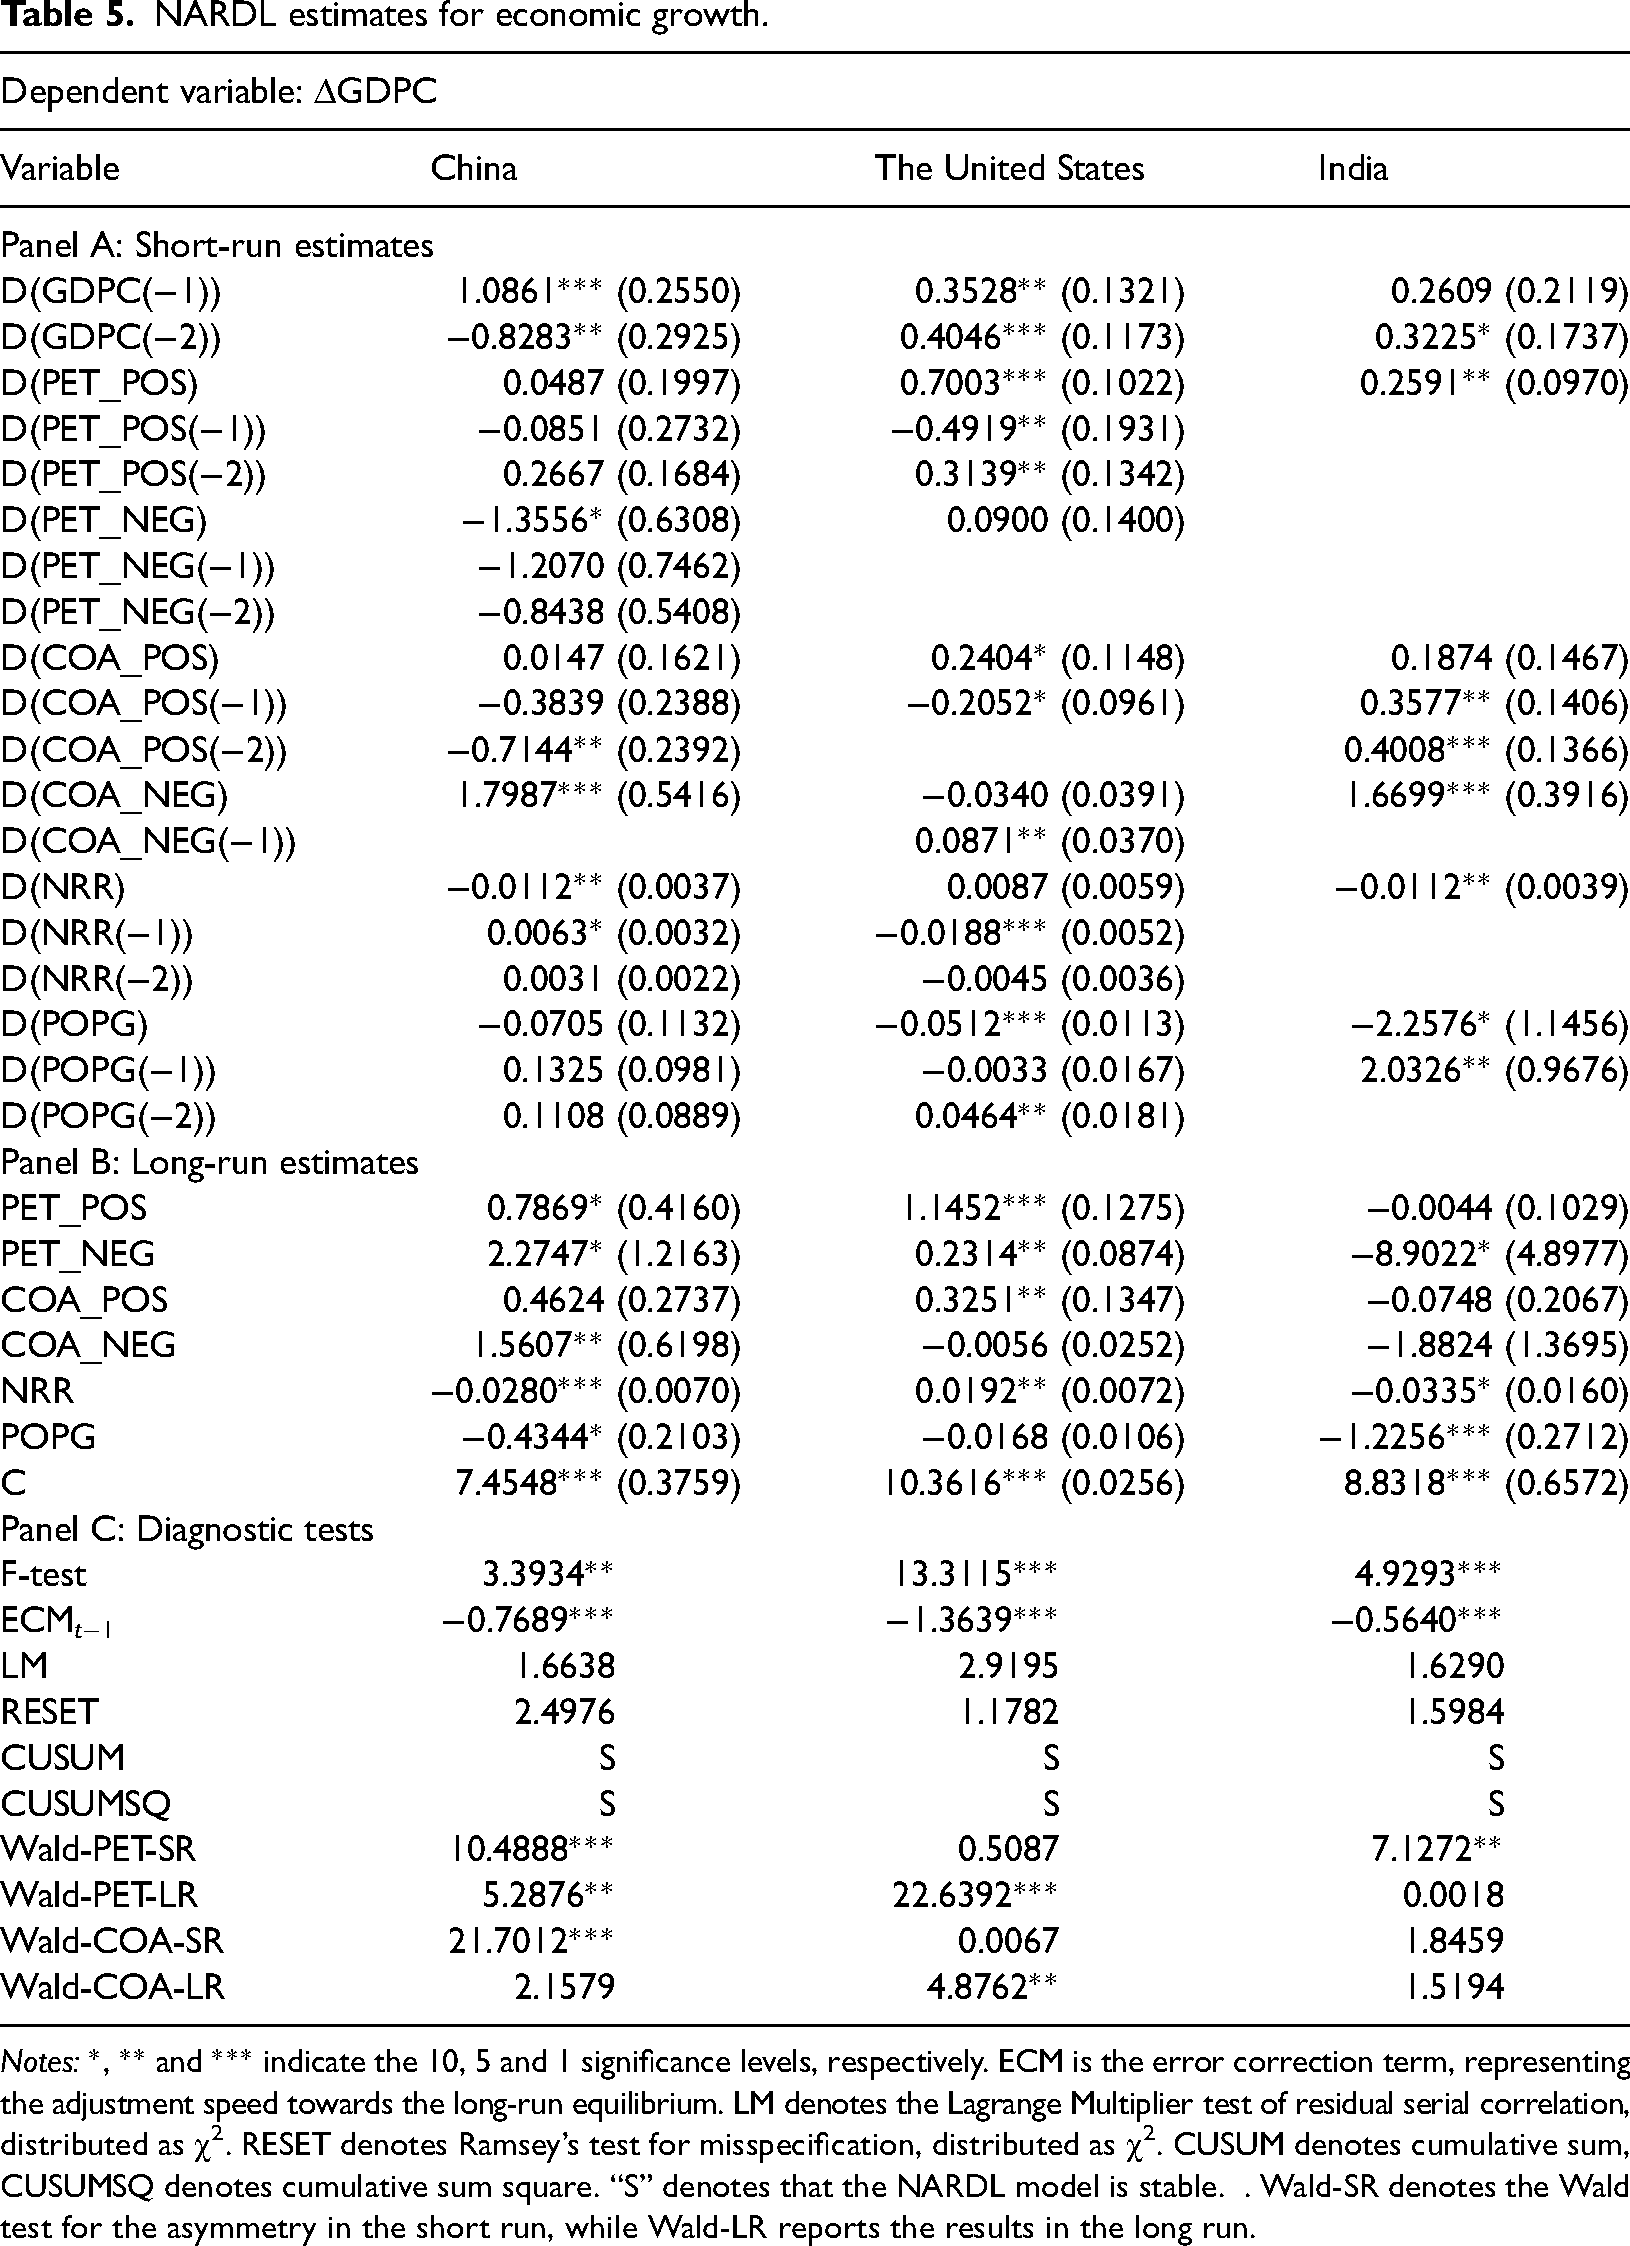
Notes: *, ** and *** indicate the 10, 5 and 1 significance levels, respectively. ECM is the error correction term, representing the adjustment speed towards the long-run equilibrium. LM denotes the Lagrange Multiplier test of residual serial correlation, distributed as χ2. RESET denotes Ramsey’s test for misspecification, distributed as χ2. CUSUM denotes cumulative sum, CUSUMSQ denotes cumulative sum square. “S” denotes that the NARDL model is stable. . Wald-SR denotes the Wald test for the asymmetry in the short run, while Wald-LR reports the results in the long run.
Next, this paper analyzes the impact of coal consumption on the per capita GDP of the three countries. In the short term, a positive change in coal consumption can positively impact economic growth in the three countries; however, only the coefficient for the United States is significant, which is consistent with the long-term estimates. Additionally, the United States' GDP per capita cannot be affected by the negative change in coal consumption in the short term, which is also in line with the long-term results. For China and India, in the short term, a negative change of 10% in coal consumption will reduce the per capita GDP by 17.99 and 16.67%, respectively. However, in the long run, a negative change in coal consumption can only cause the reduction of China’s per capita GDP, and there is little difference between the short- and long-term coefficients. The findings are in line with Saboori and Sulaiman, 64 who examined the factors that influence the economic growth of Malaysia. However, this paper supplements their study by examining the asymmetrical impacts of different sources of energy.
Third, this paper goes ahead to analyze the effect of the control variables. In the short term, a 10% increase in the total natural resource rents will reduce the per capita GDP in both China and India by 0.112%. In the long run, the total natural resource rents have a similar impact in both countries. Thus, the results support the resource curse hypothesis in China and India. For the United States, however, a 10% increase in the total natural resource rents can cause a 0.192% increase in per capita GDP in the long run, which supports the resource welfare hypothesis. In the short term, a 10% increase in the population growth rate causes the per capita GDP in the United States and India to decrease by 0.512 and 22.576%, respectively. It can be seen that India's population growth significantly impacts its per capita GDP. Henceforth, it is prudent for India to increase the per capita GDP by efficaciously curbing the population growth in both the short and long term.
Finally, Panel C presents the relevant test results. The F-test serves to examine the presence of a long-term cointegration relationship among the variables. The outcomes firmly reject the null hypothesis, indicating the existence of a long-term cointegration relationship between the variables in all three countries. The Wald test examines whether there is an asymmetry relationship between variables. The Lagrange Multiplier (LM) test is used to judge whether the model is affected by the residual autocorrelation, while Ramsey's test (RESET) is adopted to test whether the model is correctly specified. Based on the results, it can be concluded that the residual autocorrelation has no impact on the model and it has been correctly specified, regardless of whether China, the United States or India. The CUSUM and cumulative sum square (CUSUMSQ) tests proposed by Brown et al. 56 were used to test whether the model coefficients were stable. The results showed that the coefficients were all stable, indicated with “S” in Table 5.
NARDL estimates for CO2 emissions
Table 6 reports the NARDL estimates of CO2 emissions, which are also divided into Panels A, B and C. Panel A presents the short-term estimation results. First, a positive change in oil consumption can increase CO2 emissions in all three countries. Specifically, a 10% positive change in oil consumption will cause an increase of CO2 emissions in China, the United States and India by 10.81, 28.69 and 2.07%. In the short term, a decrease in oil consumption will only reduce CO2 emissions in China and the United States. Similar conclusions can be drawn from a long-term perspective (Panel B). Consequently, it is suggested that both countries consider reducing their oil consumption and finding alternative clean energy sources to improve the quality of the environment. The Wald test results reveal that the short-term changes in oil consumption are only asymmetric in China, while in the long-term, there is an asymmetry in China and the United States. Shaari et al. 57 applied the ARDL model and found that both natural gas and oil consumption are important factors leading to environmental deterioration in the Organization of Islamic Cooperation countries. However, the authors did not examine the asymmetric influence of oil consumption. Thus, this paper serves as a complement to their research.
NARDL estimates for CO2 emission.
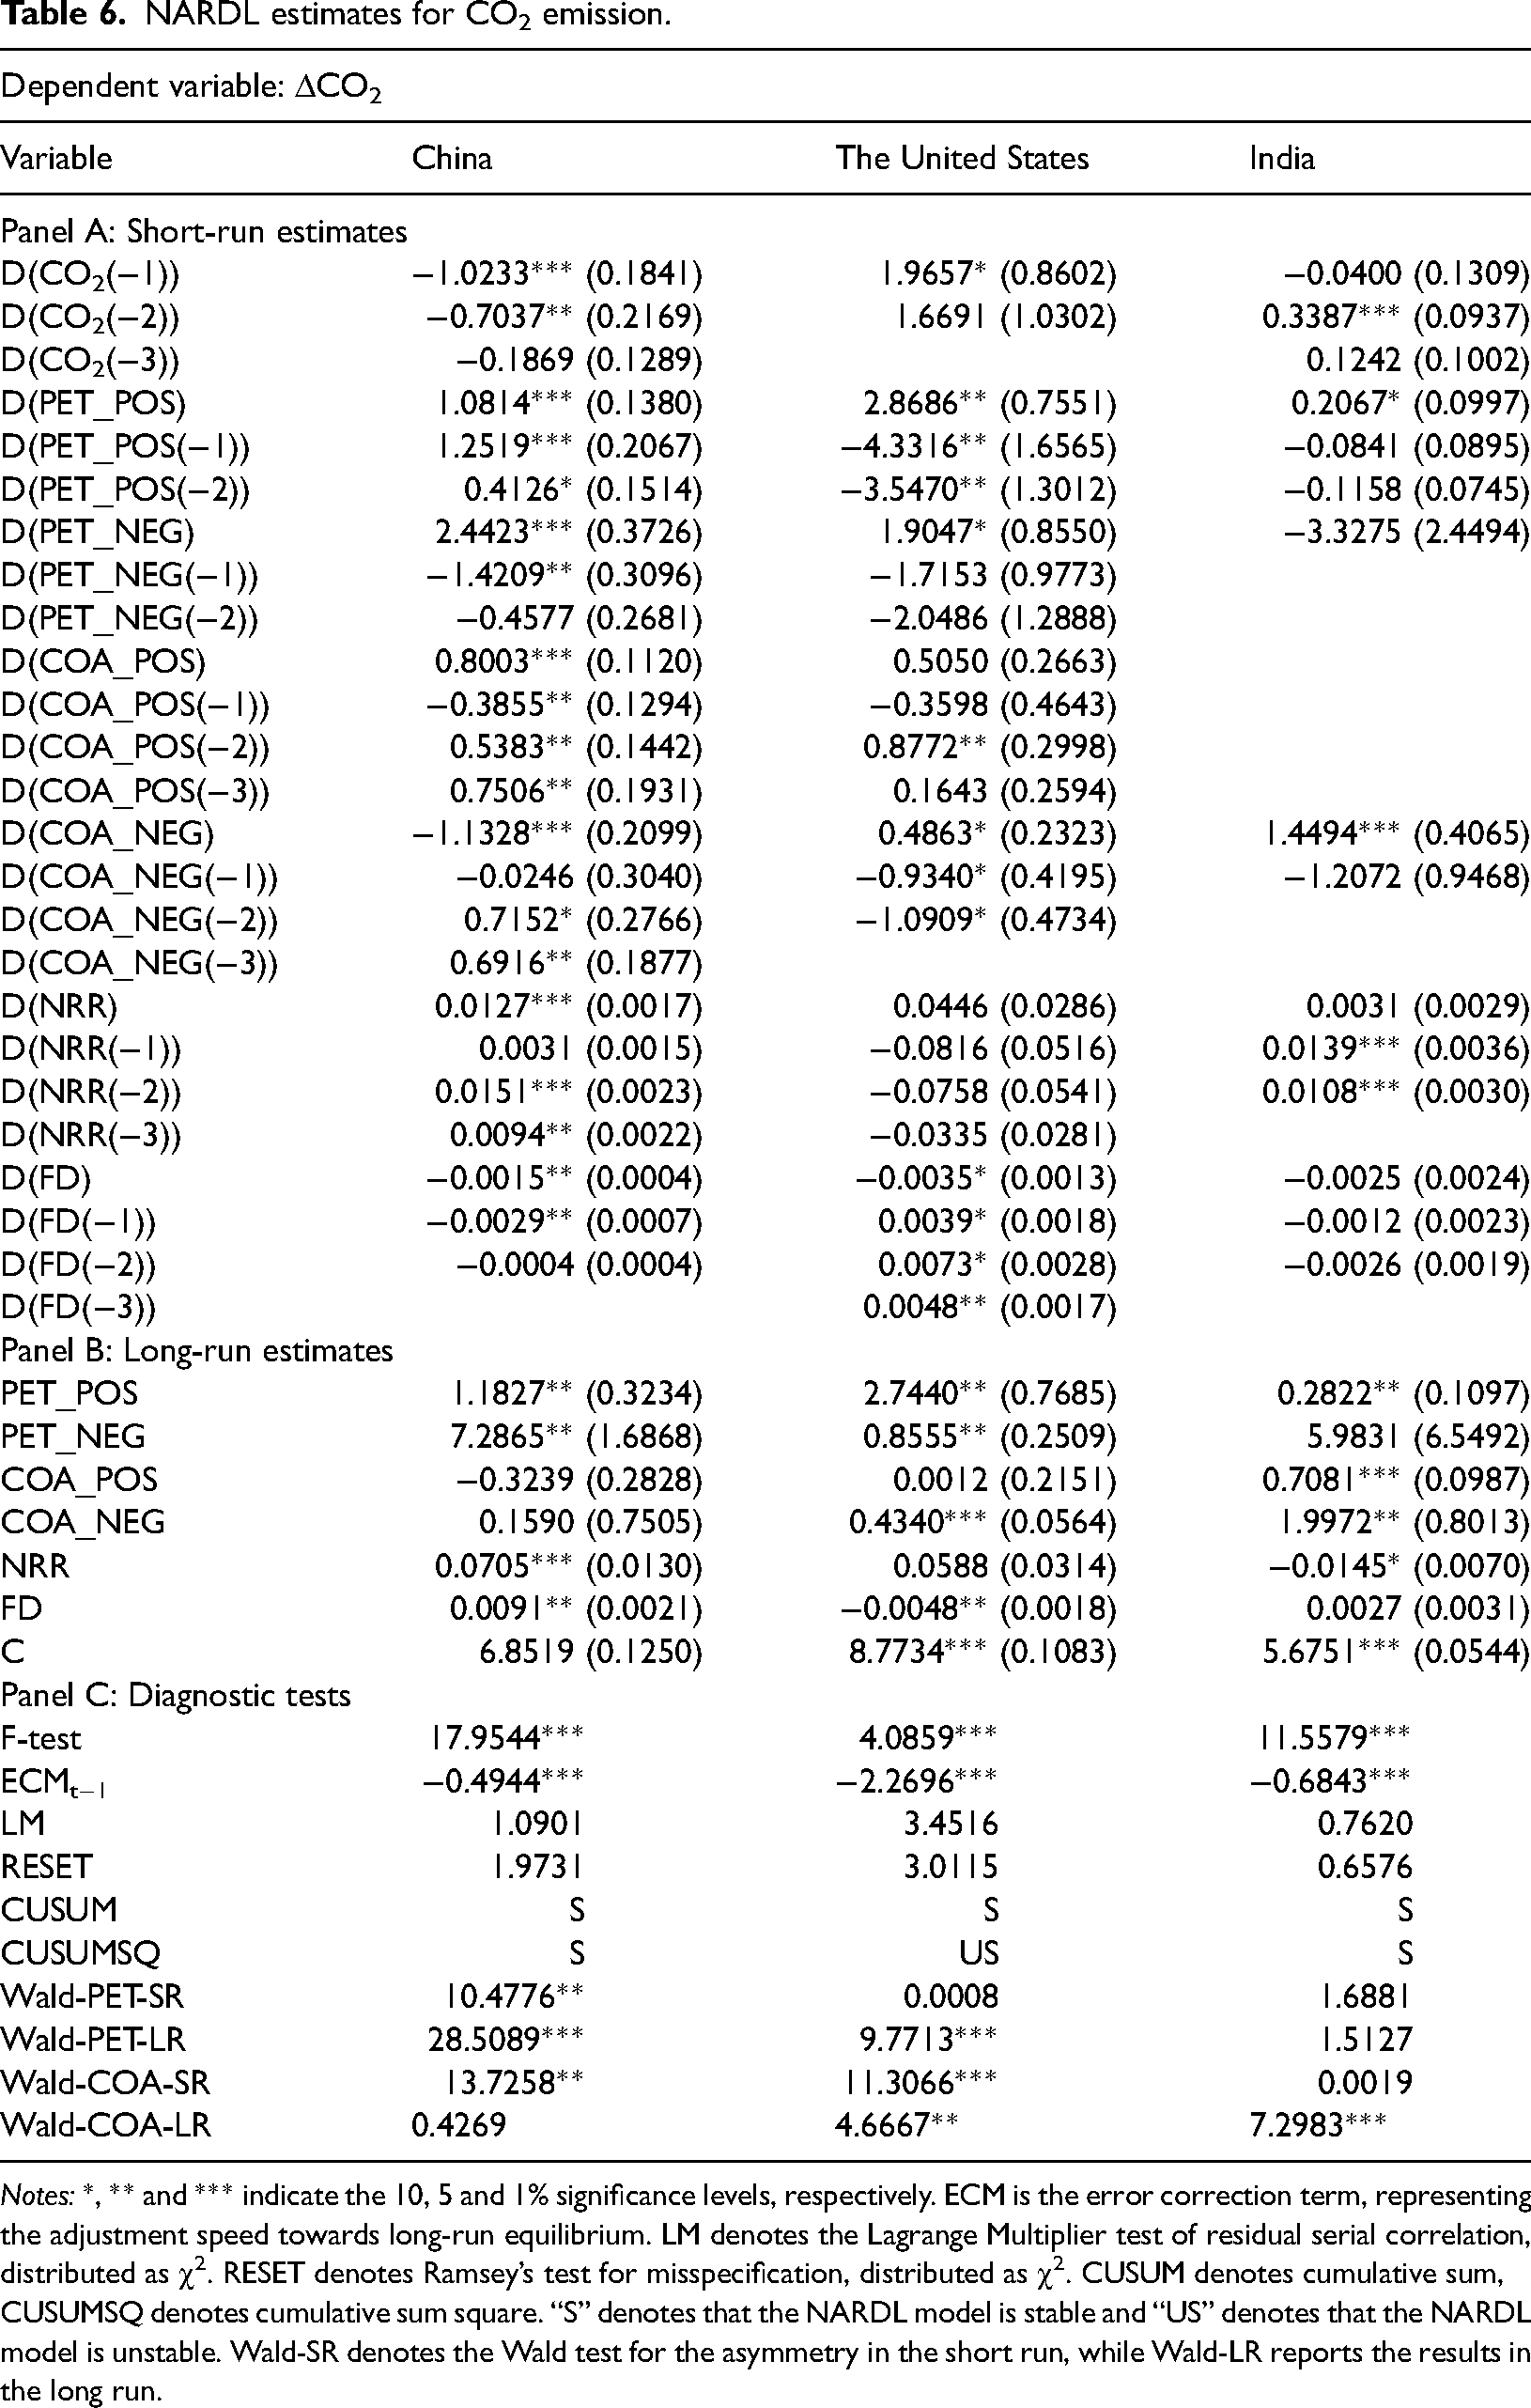
Notes: *, ** and *** indicate the 10, 5 and 1% significance levels, respectively. ECM is the error correction term, representing the adjustment speed towards long-run equilibrium. LM denotes the Lagrange Multiplier test of residual serial correlation, distributed as χ2. RESET denotes Ramsey’s test for misspecification, distributed as χ2. CUSUM denotes cumulative sum, CUSUMSQ denotes cumulative sum square. “S” denotes that the NARDL model is stable and “US” denotes that the NARDL model is unstable. Wald-SR denotes the Wald test for the asymmetry in the short run, while Wald-LR reports the results in the long run.
Then, this paper proceeds to analyze the impact of coal consumption on CO2 emissions. A 10% increase in coal consumption in China in the short term can cause an 8% increase in CO2 emissions. However, this effect is insignificant in the long run. Negative changes in coal consumption in the short term can reduce CO2 emissions in the United States and India. This effect remains in the long run, but the coefficients differ. Specifically, a 10% negative change in coal consumption will reduce the United States and India’s CO2 emissions by 4.34 and 19.99%, respectively. Therefore, it is recommended that both countries consider mitigating CO2 emissions through a reduction in coal consumption, with India, in particular, standing to benefit significantly from such action. The findings resemble Lin et al. 65 who applied the Bootstrap ARDL model to examine the effect of coal consumption on economic growth and CO2 emissions in China and India.
Third, the role of some control variables is analyzed. The coefficients of total natural resource rents in China are positive and significant at the 1% level, in both the short and long run, which indicates that abundant natural resources contribute to CO2 emissions in China. In the United States, there is no significant relationship between the total natural resource rents and CO2 emissions, whether in the long term or the short term. In India, the total natural resource rents have no effects on CO2 emissions in the short run, whereas these rents exert a negative role in CO2 emissions in the long run. In China, the development of the financial sector is found to have a negative effect on CO2 emissions in the short-term, while exhibiting a positive impact on CO2 emissions in the long term. In the United States, financial development helps to reduce CO2 emissions in both the short and long term. In India, the results show that financial development has no impact on CO2 emissions, whether in the short or long term.
Finally, Panel C reports a series of test results. The results of the F-test reveal that there exists a long-term cointegration between variables in all three countries. The Wald test examines whether there is an asymmetry relationship between variables. The results show that the short- and long-term effects of oil and coal consumption are asymmetric in China, whereas only long-term asymmetry is observed in the United States. In India, the null hypothesis of symmetry is accepted both in the long and short run. The LM and RESET test results confirm that the NARDL model was unaffected by residual autocorrection and was properly specified. The CUSUM and CUSUMSQ test results show that the model coefficients are primarily stable.
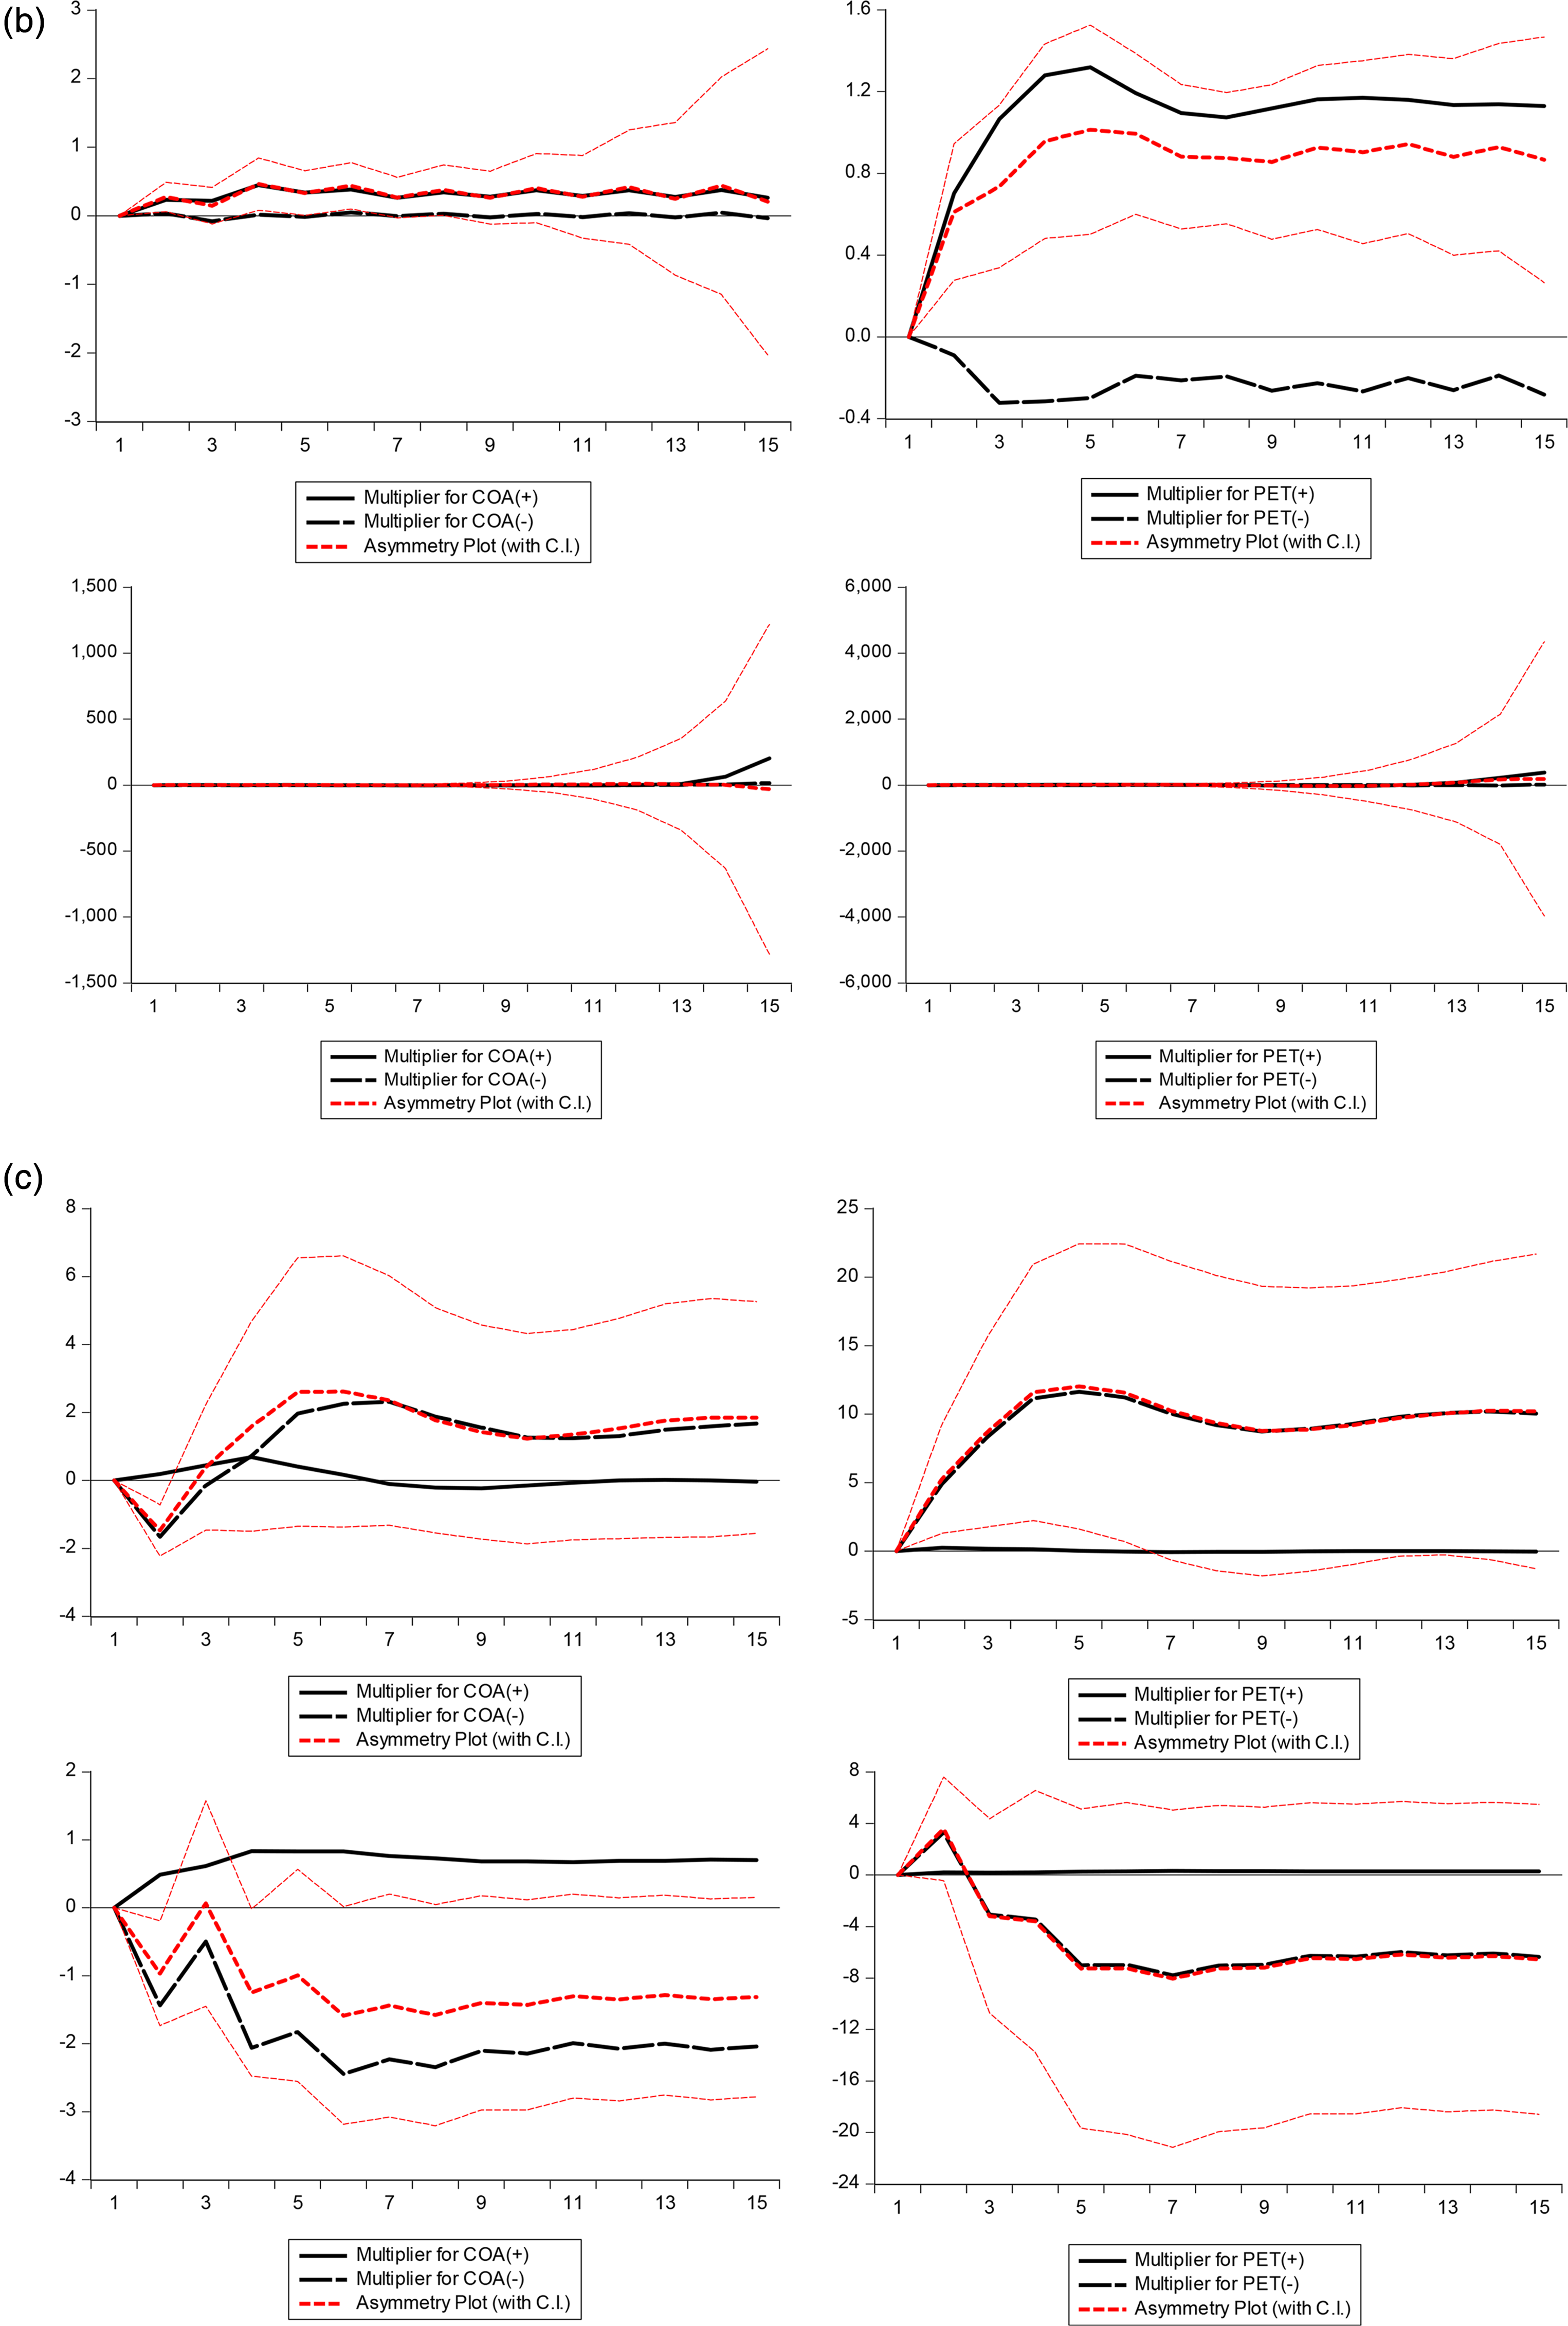
To enhance the clarity of the findings, the study further employs dynamic multiplier effects to evaluate the asymmetric effects of oil and coal consumption shocks on economic growth and CO2 emissions in China, the United States and India. Figures 2(a)–(c) present the asymmetric dynamic multiplier effects in China, the United States and India, respectively. In these figures, the black dotted line represents the adjustment of economic growth and CO2 emissions to the negative shocks of the variables, while the solid black line describes the adjustment of the economic growth and CO2 emissions to positive shocks of the variables. The red thick dotted line represents the difference between the two cases, while the red thin line denotes the 95% confidence band. In each sub-figure, the left panel plots the response of economic growth and CO2 emissions to a one-unit change in coal consumption, respectively, while the right panel depicts the response of economic growth and CO2 emissions to a one-unit change in oil consumption, respectively. It is apparent that the figures corroborate the findings of the above analysis.

(a) Asymmetric dynamic multiplier effects in China, (b) asymmetric dynamic multiplier effects in the United States and (c) asymmetric dynamic multiplier effects in India.
Conclusions and policy implications
Over the last few decades, most countries have been confronted with the problem of insufficient energy and environmental deterioration, but energy consumption continues to increase. It has become an urgent concern for countries worldwide to deliberate on the nexus between energy consumption, economic growth and environmental quality, as well as devise strategies in a manner to achieve a win-win scenario. In this context, this paper examines the effects of oil and coal consumption on economic growth and CO2 emissions, using data from China, the United States and India, the three world's major carbon emitters, from 1980 to 2020. The NARDL approach was applied to analyze and compare the differences between the three countries.
The results show that energy consumption matters for economic growth but exhibits various patterns in the three countries. In general, the effect of oil and coal consumption on economic growth is asymmetric in the short and long terms. From a short-term perspective, an increase in oil consumption significantly and positively impacts economic growth in the United States and India, while a negative shock of oil consumption affects only the economic growth of China. When it comes to coal consumption, a positive shock only affects the United States' economic growth, while economic growth in China and India is more likely to be affected by a negative consumption shock. Oil consumption presents a significant asymmetric impact on the economic growth of China and India, whereas coal consumption only displays a significant asymmetric effect on the economic growth of China. In the long run, the nexus between oil consumption and economic growth exhibits a similar asymmetric pattern in China and the United States. That is, an increase in oil consumption facilitates economic growth, while a negative shock in oil consumption deters economic growth. Moreover, the effects between positive and negative consumption shocks exhibit asymmetric patterns in both countries. With regard to the effect of coal consumption on economic growth, only negative shocks matter for China and positive shocks matter for the United States. In terms of asymmetric effects, only the United States has passed the Wald test.
The results have also identified various patterns of energy consumption on CO2 emissions. An increase in oil consumption, whether from a short- or long-run perspective, increases CO2 emissions in all three countries, while a decrease in oil consumption only mitigates CO2 emissions in China and the United States. For India, reducing oil consumption has nothing to do with CO2 emissions. There are more complicated patterns to the role of coal consumption in CO2 emissions. In the short run, a positive shock in coal consumption only increases CO2 emissions in China, whereas a negative shock in coal consumption in the United States and India has a mitigating effect, with the exception of China. Moreover, a short-term asymmetric effect is only observed in China with regard to the effect of coal consumption. From a long-run perspective, positive and negative coal consumption shocks exhibit asymmetric effects in the United States and India, while no asymmetry is observed in China.
The results vary significantly from country to country; however, energy consumption has generally promoted economic growth as well as resulted in unignorable environmental issues. Several policy implications arise from this paper. First of all, energy efficiency is crucial for the sustainable development goals proposed by the United Nations. Improving energy efficiency and reducing air emissions require the development of an energy-management approach. 66 Thus, this paper proposes a multi-faceted framework that incorporates technological advancements, energy-management practices and consumer behaviour. Specifically, through the development of new technologies, for example, renewable energy sources and energy-efficient appliances, people can find solutions that are both ecological and economical. Energy-management practices involve implementing strategies to reduce waste and increase productivity, for example, installing energy-efficient lighting and heating systems. As well, it is essential to encourage consumers to adopt more energy-saving practices to improve energy efficiency.
Second, more efforts should be made to promote the use of clean energy. Non-renewable energy consumption facilitates economic growth; nevertheless, it is usually associated with some environmental issues. Thus, the fundamental aspect of energy transition centers on the substitution of non-renewable energy sources with clean energy alternatives. On the one hand, energy crises have accelerated the pace of the clean energy transition; on the other hand, the goal of carbon neutrality has fostered the development and utilization of clean energy sources. During the Corona Virus Disease 2019 (COVID-19) pandemic period, energy sustainability has become a significant challenge as well as an opportunity for most countries around the world. 67 In the post-pandemic era, countries are suggested to focus on developing green industries to establish new comparative advantages. For instance, the United States, the European Union, Japan and other countries have proposed green recovery “packages,” gradually increasing the development and utilization of green and clean energy, such as biomass energy, wind energy and solar energy.
Third, clean energy relies heavily on the integration of advanced technologies. In the digital economy era, it is necessary to continuously increase the research and development (R&D) investment in new digital technologies, such as big data, artificial intelligence, smart grid and 5G. Implementation of these technologies can yield a substantial improvement in the utilization of clean energy sources within power generation and distribution infrastructures. In this regard, it is imperative that countries proactively develop technology-sharing networks. This entails a concerted effort to not only make significant strides in green and clean technologies but also to provide technical assistance and building programs to countries or regions lacking in clean energy resources. Through this collaborative approach, a novel global framework for clean energy governance can be established, one that is characterized by reasonableness, inclusiveness, fairness and justice. For instance, China has recently established a series of regional energy cooperation platforms with some countries along the Belt and Road Initiative.
Finally, despite the degree of comprehensiveness, this paper has some potential limitations. For instance, in terms of time-frequency, annual data may obscure some critical information in energy consumption fluctuations. Future studies may utilize quarterly or monthly data with higher frequency for analysis. Regarding research methods, the NARDL model is essentially a zero-value threshold. Further research can be improved by setting a more authentic and credible threshold value. With respect to research directions, in light of global environmental degradation and economic revitalization, renewable energy has emerged as a salient and pressing issue. Hence, subsequent research may examine the potential impacts of various factors within the framework of the ongoing energy transition. Relevant topics include but are not limited to energy price volatility, advancements in environmental conservation and clean industry, the utilization of clean energy sources in maritime transportation and the facilitation of electricity through 5G technology.
Footnotes
Acknowledgements
The authors gratefully acknowledge financial support from National Office for Philosophy and Social Sciences. This work was supported by the National Social Science Fund of China, grant number 21BJL015.
Declaration of conflicting interests
The author(s) declared no potential conflicts of interest with respect to the research, authorship and/or publication of this article.
Funding
The author(s) disclosed receipt of the following financial support for the research, authorship and/or publication of this article: This work was supported by the National Social Science Fund of China (grant number 20BJY016).