



Abstract
This study looks at the impact of green economy activities on marine mineral conservation, emphasizing the critical significance of circular processes in building a sustainable blue economy. The research assesses the long-term viability of European blue economies using six indicators, including the value provided by the extraction of petroleum and natural gas and support activities for mining and quarrying projects. Municipal trash generation per capita and the amount of biowaste in recycling are used to determine circular effectiveness. According to the findings, a robust green economy performance is critical for increasing the sustainability of Europe's blue economy between 2012 and 2019. The link between the green and blue economies is nonlinear, with positive benefits shown when the green economy exceeds a particular threshold. Furthermore, the study validates these findings by investigating the impact of the green economy on ocean energy and marine minerals. These empirical findings have important significances for European authorities and policymakers aiming to effectively implement green programs in order to advance toward a sustainable blue economy and preserve marine mineral levels.
Introduction
Worldwide population is expected to exceed 9 billion people by 2050, will need nutrient-rich food.1,2 Across the world, aquaculture accounts for 47% of seafood production, and its operations are becoming more intensive.3–5 There are serious worries over limited resources (such as water, space, and food) and environmental effects as stocking densities and feed additions (such as wastewater and solid waste) increase.6–9 Insufficient management can result in hypoxic events, eutrophication, algal blooms, and water acidification10,11 if nutrients (such as phosphorus and nitrogen) and solid organic matter are released into the environment improperly. 12 Pathogenic bacterial and virus concentrations in water systems can rise due to organic material discharge.13,14 Excessive antibiotic usage in aquaculture has also been related to decreased productivity, 15 as well as the fast development of resistant infections.16,17
The implementation of a smarter resource management strategy4,18 and a reduction in aquaculture waste19,20 are required to sustainably increase aquaculture and provide a steady supply of seafood without damaging ecosystems. As a result, there is a growing global interest in and understanding of the value of available resources, particularly fertilizer and waste recycling, can promote a circular economy (CE) in aquaculture.4,6,21 In 2012, the European Commission suggested a marine and coastal green economic plan industries as part of its Blue Growth initiative. Mehta et al. 22 and Smárason et al. 23 both report that redirecting wastewater effluents and byproducts into aquaculture systems can lead to significant improvements in aquaculture production.
As an example of a strategic policy method, we can consider the UN's extensive sustainable development goals (SDGs), which provide an exciting and aspirational plan. In order to make a breakthrough the key is creating innovative systems that incorporate bottom-up innovation beyond the reach of national authorities. The basic idea is that large-scale societal concerns should be broken into individual, manageable efforts with clearly stated aims. Undergoing a transition from an accessible, composite, and specific approach capable of producing a limited amount of comprehensive research and changes, the economies need a method that emphasizes the importance of understanding a wide variety of viable answer concepts from the beginning of program execution. According to researchers, identifying practical, concrete creative opportunities inside firms’ operational settings is the issue.
Policies aiming at adopting a CE (green economy) improve the performance of the blue economy (BE), according to our findings. This study looks at three variables: the conventional the new blue economy (NBE), BE, and the CE. A detailed description of these ideas is provided in this paper, followed by a review of the relevant literature in order to better understand how they are related to one another and how they are applied. The NBE is a relatively recent idea in the development literature and it is constantly evolving. Nonetheless, there is widespread agreement regarding the critical components of the fundamental indicators that can be used to determine its presence in a country. Several emerging technologies are included in these categories, such as ICT. Sustainable development is the common thread that runs through BE, NBE, and CE. This paper aims to determine the link between these ideas. Prior to examining the role of the CE in promoting the BE, it is essential to examine the role of the CE in supporting the BE. The utilization and leveraging of the maritime domain's resources help the CE to promote the BE in a way that benefits sustainability.
In recent international policymaking regarding BE, the UN SDGs have played an important role. SDG 14, in particular, to protect and sustainably exploit marine resources for long-term development, emphasizes the global significance of the oceans. 4 In its response, the EU highlights the need to maintain and enhance ecosystem services and marine biodiversity while also fostering blue development and jobs in a sustainable manner. Biotechnology, offshore renewable energy, marine life resources (such as fishing), shipbuilding and repair, resources in the sea that are not alive (such as petroleum and natural gas), maritime transit, and coastal tourism are all part of the European BE.
BE has grown in importance as a study issue in recent years, thanks to organizations such as the UN and the EU. However, there is still uncertainty about which adjustments need to be done and how they might be accomplished, 24 despite the fact that both companies and governments require reform. While the sustainability transition is identified eco-innovation, as a fundamental engine of change is also important in driving change. According to Carrillo et al., 25 products, processes, marketing, and organizational advantages are all examples of how innovation may manifest itself. Essentially, the European Commission has recognized sustainability as a required component of attaining environmental advantages such as increased efficiency in resource consumption as well as more advantage business models and technology. 26 Transitioning to a CE has been referred to as a “catalyst” in policy. 27
While several studies have recognized the importance of the CE for BEs, the present literature lacks comprehensive insights into how the CE may actively assist a pro-BE transformation. Rather, it focuses on the relationship between CE and BE in the context of sustainable transitions. This study seeks to address that void by giving the first theoretical framework that investigates the relationship between a country's CE and BE performance. Europe's circularity is measured using two distinct metrics: (i) individual waste generation (kilograms per person) or total municipal waste generated, and (ii) waste recycling rates, excluding critical mineral waste, and waste recycling effectiveness, as measured by the proportion of biowaste. The article evaluates the efficiency of the BE process using numerous metrics.
Six indicators are used to assess the performance of European BEs: value added at factor prices, natural gas and crude oil extraction assistance activities, operations in gravel and sand pits, salt extraction, other mining and quarrying firms support actions, and clay and kaolin mining. Various approaches and practical procedures are used to assess a sample of European nations from 2012 to 2020. This database was selected because it offers a complete set of BE measures not present in other locations, and it correctly depicts the variability of BE implementation when compared to other obsolete measurements.
This study is the first complete empirical examination of the link between circularity efforts and the functioning of BEs. One important feature of this study is its empirical methodology. We use the PCSE (panel-corrected standard errors) model to investigate the relationship between circularity and BE performance while taking cross-sectional dependency (CD) and stationarity into account. Unlike prior research that frequently neglected CD in dynamic panel data, we address this problem to prevent potentially misleading and biased conclusions. To increase the robustness of our findings, we use the FGLS (feasible generalized least squares) model to account for heteroscedasticity. In addition, we use the PMG estimator in combination with the ARDL (autoregressive distributed lag) approach to examine both long-term and short-term impacts. The PMG-ARDL technique enables us to combine country-specific and time-fixed effects, which adds legitimacy to our study findings.
In order to understand the dynamics of such a transformation, it is imperative to conduct research of a broader scope, supported by a dynamic business model and public policies that welcome BE. With greater in-depth knowledge of the CE, actors and institutions can adjust and calibrate their BE efforts. A new generation of corporate players will emerge to rethink their company models in a sustainable manner with the help of this study from the beginning. Policies that consider CE, its relationship with BE, and how it affects education must consider uncertainty and feedback loops. Based on a thematically oriented examination of the literature, the paper proposes the concept of “clean congruence” to link BE and CE.
The remainder of the paper is organized as follows. Following an examination of the literature, hypotheses are developed in the next section. Section “Empirical methodology” presents an examination of the model, data, and estimating approach. The empirical findings and their consequences are discussed in the section “Empirical results,” and the last section examines the policy ramifications of the research findings.
Review of literature and development of hypothesis
A review of critical concepts
The blue economy
The notion of the “BE” was originally suggested during the 2012 United Nations Conference on Sustainable Development in Rio de Janeiro, according to Smith-Godfrey. 28 Its core tenet was to separate environmental degradation from economic success, resulting in universal acceptance. One critical goal was to administer marine regions in a sustainable and conservation-oriented way, with a focus on reducing greenhouse gas emissions through sustainable consumption and replenishment methods. The importance of the oceans in providing food for both human and animal populations made them a critical component in attaining sustainability.
According to Smith-Godfrey, 28 the concept of the “BE” was suggested for the first time at the 2012 United Nations Conference on Sustainable Development in Rio de Janeiro. Its core idea was to divorce environmental deterioration from economic success, which resulted in widespread acceptance. One major objective was to manage marine regions in a sustainable and conservation-minded manner, with an emphasis on lowering greenhouse gas emissions through sustainable consumption and replenishing techniques. Because of the importance of the seas in providing food for both human and animal populations, they have become an essential component in achieving sustainability.
An innovative approach to the blue economy
An NBE arises when economic operations match with the potential of ocean ecosystems to sustain long-term economic pursuits, according to the Economist Intelligence Unit (EIU). The emphasis of this argument is on the economic effects of NBEs, with ocean resilience serving as the final litmus test. However, in order to adhere to research criteria, this strategy must also include population well-being, the location of water-related activities, and technology improvements.
NBE is defined by Geange et al. 29 as the confluence of economic, climatological, and technological elements that enable mankind to harness the seas in novel ways. They stress the economic element of NBE as well as the critical roles of humans and technology in accomplishing economic objectives. Geange et al.'s definition, on the other hand, ignores the crucial problem of ocean preservation, as well as the importance of ocean-related activities in assuring human well-being and enjoyment. As a result, the preceding definition is modified in this study, with the word “NBE” referring to an economic system based on the sea or ocean. It combines a refined set of traditional maritime practices and goals with technology that promotes Improves ocean-related and ocean-based activities, economic growth, ocean sustainability, and human well-being. This revised definition incorporates the fundamental properties of NBEs that are the subject of this research.
Circular economy
CEs have been viewed differently by different civilizations throughout history. A core feature of a CE is its potential to increase human well-being and safeguard health, and strengthen a country's worldwide status by utilizing renewable resources. A CE's primary purpose is to achieve long-term economic growth. However, researchers disagree on the precise meaning of a CE. According to Youmatter, 30 the Ellen MacArthur Foundation sees the CE economy as a way to transform growth by emphasizing societal benefits above economic advantages. The emphasis goes beyond waste management, stressing the progressive decoupling of economic activity from resource use in order to improve resource efficiency. While this strategy is comprehensive, it overlooks human well-being and health security, both of which are critical components of attaining sustainable development. As a result, the Ellen MacArthur Foundation's definition was deemed insufficient for the project's aims.
A CE is defined according to the World Economic Forum as a restorative or regenerative industrial system. 30 The emphasis is on restoration, the utilization of renewable energy sources, and the abolition of toxic medications in end-of-life care. The initiative intends to improve material and system design in order to reduce the requirement for reuse and return to the biosphere. The CE is based on the pillars of reusability, sustainability, health security, and human well-being. This definition, offered by the World Economic Forum, is broad and logical, making it the best fit for the current study.
Conditions under which green initiatives promote blue performance
Institutional theory is regarded as a critical theoretical framework for comprehending the quest of environmental sustainability. According to Suchman, 31 organizations strive towards environmental innovation by following a system of rules, principles, and norms that improve operational accuracy. According to Mellahi et al. 32 and Parida and Wang, 33 a country's chances of building a green economy can be increased by executing efforts that generate the required preconditions for a BE. These methods broaden nations’ chances to adopt or improve BE practices. Furthermore, enterprises involved in the green economy can use cutting-edge technology and resources to promote ocean and marine ecosystem sustainability.34,35 The institutional theory also emphasizes that when a national plan acquires popularity, it can obtain symbolic meaning and legitimacy.
Existing research has looked into the effects of green efforts on company and financial success, as well as national development. However, the findings range among locations and remain inconclusive. Green initiative supporters say that these voluntary mechanisms assist businesses solve environmental concerns while also improving their public image. 36 According to Delmas and Montiel, 37 corporations seek certification to acquire credibility, financial and environmental assurances, and operational competency improvements. Dowell et al. 38 found that implementing green initiatives had a favorable influence on market-based value, as measured by the Tobin's Q ratio. Wahba 39 discovered a similar favorable influence on market valuation. Prior research has also looked into the financial benefits of green projects. Lo et al. 40 and Chen et al. 41 reported financial advantages as a result of green initiative implementation. Flammer 42 presents evidence that investors prefer governments that take pro-environmental measures.
In contrast, several research have found that green programs have minimal or negative influence on corporate performance. Aarts and Vos, 43 for example, discovered no significant association between green announcements of initiatives and business success in New Zealand. Similarly, Lee et al. 44 revealed that green programs had a detrimental influence on the performance of Taiwanese enterprises. Green initiative announcements, according to Caón-de-Francia and Garcés-Ayerbe, 45 result in lower share prices and poorer shareholder wealth. In terms of financial performance, while enterprises with higher financial success were more inclined to adopt green policies and project a green image to the public, green efforts had no impact on their financial results. 46 Furthermore, academics have discovered that the consequences of green initiative announcements varied dramatically between areas. Green efforts often have a favorable influence on business performance in well-developed nations, but not in underdeveloped countries. 47
Further empirical studies
Following a study of the literature, two types of BEs were identified: traditional BEs, which include the marine, ocean, and coastal economies, and the NBE, which blends traditional methods with contemporary innovations for ocean sustainability. Numerous papers have investigated the NBE, and many have studied both the CE and the NBE. Among those who have examined this issue are Carpenter et al., 48 Hotaling, 49 and Khajuria et al. 50 Chang et al. 51 also evaluated more relevant research papers.
Hotaling 49 analyzes qualitative data using a descriptive approach, new insights into the BE and its future development potential as well as sustainable practices for future generations. The research emphasizes the importance of big data, vital skill sets, and educational preparation for students and graduates in reaping the benefits of the NBE. The study underlines that in order for African countries to achieve regional development, they must capitalize on the economic potential and possibilities provided by their coastal neighbors. Case studies on themes such as weather forecasting, commercial fishing, data security, and sustainability are given. The author underscores the importance of economic expansion and the need to meet educational standards for the labor force. Based on the findings, the NBE program has the potential to drive economic growth and development in African coastal nations, given their significant economic potential. The report primarily focuses on the NBE in Africa and does not discuss the CE or mention Europe.
Khajuria et al. 50 used qualitative research methods to investigate a variety of topics, including new ideas, sophisticated tools, management approaches, and practical implementations. The study aims to provide further insight into how the CE may help achieve the SDGs. A CE strategy, according to the findings, would efficiently minimize waste while conserving the value of resources and commodities. To achieve sustainability, the government should enact legislation and programs based on the concepts of reducing, reusing, and recycling (the 3R initiatives), as well as encourage public–private collaborations. Khajuria et al., 50 on the other hand, did not see the CE as a primary driving force in their research.
According to Carpenter et al., 48 maritime education, maritime spatial planning, maritime transportation, and maritime training all have tremendous potential for facilitating sustainable marine domain development. The report also underlines the necessity of greening the BE and small-scale, sustainable fishing. An explanatory method is applied to develop a model for successful ocean governance beyond 2030. The research underscores the challenges created by unsolved ocean governance concerns at both the regional and global levels, as well as continuous attempts to build a governance framework that takes industry demands into account. 48 Such study might help the European Union and the 2030 Agenda for Sustainable Development at various regional and national levels. It should be noted, however, that the authors disregarded the essential importance of port-related operations in the maritime industry.
In their exploratory study, Chang et al. 51 focus exclusively on China's blue economic zone. To support their conclusions, the researchers use a combination of quantitative and qualitative data. A descriptive technique is used to highlight the differences between the NBE and conventional maritime economies, where the former includes firms tied to the ocean and the latter does not. The study also looks at the NBE's standards for sustainable development. However, the study found no link between ocean governance and the CE.
Humayun and Zafar 52 did a qualitative exploratory research to define the BE as nations that rely on seas and oceans for economic growth and impact. The study takes into account the geographical characteristics, resources, and historical relevance of maritime activities. Communities and marine attitudes impact the BE's sea power requirements. Shipping, ports, seafaring, ship construction and breaking, marine infrastructure, fishing, recycling, the offshore resources, seafood industry, and coastal tourism are all seen as major enablers for Pakistani BE, with significant economic potential. However, the research focuses exclusively on maritime power and national income via the BE, with no clear mention of ocean sustainability or incorporation of CE concepts.
Both the CE and the NBE are examined from distinct angles in the reviewed literature. NBEs clearly differ from classic BEs, just as linear economies differ from CEs. The writers of the publications that have been reviewed have made major contributions to the disciplines of CE and NBE. None of these publications, however, particularly address the implementation of NBE initiatives through port operations as a method of transitioning Europe from a linear to a CE. This research seeks to fill these gaps by investigating European port operations and providing options for incorporating NBE initiatives into the establishment of a CE. A solid theoretical framework will be supplied in order to complete this evaluation.
Europe’s blue economy
The survey of literature examines the NBE and the CE from many angles. NBEs clearly vary from classic BEs in the same way that linear economies differ from CEs. The writers of the papers under consideration have made major contributions to the disciplines of CE and NBE. However, none of these studies focuses especially on implementing NBE efforts through port operations as a method of transforming Europe's economy from linear to circular. This research seeks to fill these gaps by investigating European port operations and offering options for incorporating NBE activities into the construction of a CE. To support this inquiry, a solid theoretical foundation will be supplied. 53
Siddi 54 highlights that, in order to realize its full potential, a BE must be incorporated alongside the European Green Deal. Because ecosystems are interrelated, a holistic approach is required, as each facet has a direct influence on the well-being of others. The European Commission (2021) recognizes that a sustainable BE may greatly contribute to attaining the goals of the European Green Deal. Existing operations should be made more environmentally friendly in order to minimize carbon emissions, and carbon-neutral projects should be strengthened. Through the BE, the EU may attain carbon neutrality by promoting offshore renewable energy and maritime mobility.
This study aims to emphasize the significance of ports in the growth of the European BE and their importance in its expansion. Ports should aggressively incorporate renewable and low-carbon fuels into their power generation systems, in addition to traditional transshipment and logistics. CEs may be extremely advantageous in areas such as waste management, transshipment, waste management in the shipping and port industries, and the use of closed-loop technologies. This increased duty should result in better living and working circumstances for operators and the surrounding community (Please provide relevant citations for the sources given in the original text).
The importance of a circular economy to the blue economy
The European Union (EU) recognizes the CE as a supporter of the BE. In 2020, the European Parliament prioritized the transition to a CE and created rules for long-term investment in several EU industries, with a heavy emphasis on environmental goals. Climate change mitigation and adaptation, water and marine resource management that is sustainable, pollution prevention and control, and biodiversity conservation were among the goals. The European Commission (2020) highlights the connection between circularity and reduced greenhouse gas emissions. The CE's fundamental goal is to integrate business cycles in order to improve resource efficiency, decrease pollution and waste, and safeguard the long-term value of goods and services (European Commission, 2022). This study aims to investigate the relevance of the BE to the CE by evaluating the management of primary resources at various levels in the value chain of BE sectors.
The European Union's activities for procuring, using, and exploring raw resources are identical with those stated by the European Parliament (2008). Circularity might help with raw material sustainability, which is at the heart of many projects. This reduces the environmental impact of supply networks along the EU value chain and allows for greater outcomes with less resources.
We present the following possibilities based on our discussion:
Hypothesis H1: Green economy initiatives help European countries to enhance their blue economy’s performance.
Hypothesis H2: Green economy initiatives hinder European countries from pursuing their blue economy’s performance.
Hypothesis H3: There is a nonlinear relationship between the performance of green and blue economies.
Hypothesis H3 implies that the positive effects of green initiatives only appear if the green economy performance reaches a certain level. Otherwise, a pursuit of the green economy may negatively impact the success of achieving a BE.
Empirical methodology
Theoretical background on the drivers of the performance of the blue economy
Our research focuses on the European Union's economy. From 2009 through 2020, each variable utilized in this analysis was accessible on a yearly basis. The scale of BEs is impacted by a variety of circumstances, and knowing what drives their size is critical. Investments, according to traditional macroeconomic theory, have a considerable impact in determining production. Gross capital creation might represent a country's level of investment. Increased gross capital formation should, in theory, result in increased production. Previous empirical tourism research, such as that of Zaman et al., 55 have emphasized the significance of gross capital formation. Furthermore, Ding and Knight 56 have stressed the influence of GDP on agricultural output, as proven by Gulati and Bathla. 57
As a result, while computing the BE output indicator, the gross capital creation inside the BE acts as an explanatory factor. Increased investment is likely to result in increased BE output. Power consumption is often seen as an important measure infrastructure availability in a country, and there is a definite correlation the relationship between power use and economic performance. Notably, the shipbuilding industry and numerous BE operations, such as fisheries post-harvest processing, rely considerably on electricity. Using electricity as an explanatory variable allows us to identify the drivers of blue economic activity. Vu 58 looked at how information and communication technology (ICT) affects economic growth. Furthermore, research on the favorable impact of ICT has been conducted in the BE sectors of fishing and tourism. 59 Bhattacharya and Dash 60 count the phone subscribers per 100 people to assess the impact of ICT. Given the productivity-enhancing nature of ICT, we anticipate that these variables will positively contribute to the BE's growth.
The BE idea should encourage sustainable ocean-based activities. The independent variable of CO2 emissions per person links environmental quality in island countries to blue economic activity. CO2 absorption in the oceans causes chemical changes known as “acidification” as a result of increasing atmospheric CO2 levels. McMullen and Jabbour 61 show that persistent ocean acidification harms marine animals and their food webs, eventually destroying entire ecosystems. This is referred to as an additional effect of CO2 on the oceans. Over the last century, a reduction in pH in the worldwide surface ocean has been recorded, correlating with rising CO2 levels in the atmosphere. Negative influence on tourism and indirect impact on fisheries productivity may be caused by CO2 from human activity. 62
As an explanatory variable, we also included trade openness, which is a proportion of the total of imports and exports of GDP. A number of theoretical studies have discovered a link between trade liberalization and economic development. Grossman and Helpman 63 shown that trade openness may boost economic growth through increasing resource allocation efficiency, total factor productivity, as well as access to commodities and services. A trade-open economy, on the other hand, can result in poorer economic growth, higher inflation, and lower exchange rates.64,65 The influence of free trade policies on economic growth is still debated, and the amount of trade openness differs among nations.66,67
Due to the possible detrimental impact of growing CO2 emissions on fisheries, Bhattacharya and Dash. 60 In their second computation based on literature data, they included per-person greenhouse gas emissions as an independent variable. Similarly, ICTs have a significant influence on a variety of economic activities, including fishing. It is anticipated that ICT would improve fisheries production by giving fishermen with mobile phones provide enhanced market and pricing information. Mobile phones have been shown to improve the economic results and productivity of fisherman. 68 Various strategies, such as the SDS-SEA and the Regional Ocean of the Pacific Islands, for sustainable management of ocean resources contribute to international cooperation and the long-term use of fishery resources. Therefore, it is expected that these steps for long-term ocean management would result in increased fish output. The crisis dummy variable, on the other hand, has a negative influence on the BE as it signals a drop in demand.
Currency appreciation and depreciation are likely to affect international travel expenses, impacting international travel frequency. This signifies that the exchange rate has a positive coefficient. A nominal or effective exchange rate might be utilized depending on the circumstances. The effective exchange rate is less usually employed to gauge a country's currency's direction. This is due to the fact that a currency may appreciate when compared to another currency of one country while declining when compared to the currency of another. Exchange rate variations make forecasting visitor arrivals difficult. To adequately capture the impact on tourism demand, the nominal exchange rate should be included as a component. When the value of a currency declines in relation to other currencies, it increases tourism demand by cutting local expenditures. The volatility-driven uncertainty, which the nominal exchange rate truly represents, has a greater effect on potential visitors.
In comparison to domestic pricing, destination prices have a significant impact on travel decisions. The consumer price index (CPI) is a tool that helps households calculate the price of consumer products and services. To generate a relative pricing index, the CPI of Each Pacific island country's CPI may be compared to the global CPI (Indonesia's CPI relative to the global CPI). As connection improves and relative import prices from the home country decline, domestic items may become less expensive than international goods. This might result in an increase or decline in international tourists the price of local items.
Empirical model specification
The model used to explore the relationship between circularity performance (CE) and BE performance (BEP) is as follows:

Blue economy sustainability (BES)
Six indicators are used to assess the long-term success of BEs in European regions: the increased value at the expense of crude petroleum extraction (BES_ECP); extracting natural gas (BES_ENG); promoting natural gas and petroleum production (BES_SPG); salt extraction (BES_ES); encouraging the production of natural gas and petroleum BES_OGS); and mining and quarrying support activities (BES_SQM). In the period 2009–2020, these variables were derived from the statistics of the Organization for Economic Cooperation and Development.
Circularity performance (CIR)
According to Nham and Ha, 69 this study employs two metrics to analyze several characteristics of circularity. The first metric, CE_MW, indicates municipal trash in kilos per capita or total municipal garbage. The second metric, CIR_RB, indicates the percentage of biowaste recycled. For the period 2012–2019, data for these variables were gathered from European Statistics (Eurostat).
Control variables
According to empirical data analysis, explanatory factors should be included. Trade share (TS) and economic growth (EG) are included as explanatory variables. Similarly, following Shahbaz et al., 70 Bu et al., 71 Sun et al.,72,73 and Bhattacharya and Dash, 60 we've also added Under our theoretical model, the proportion of net FDI inflows (FDI). Studies have shown that the degree of trade openness (TS) affects the performance of business enterprises. Many studies have found a positive relationship between trade openness and BE performance, including Cooke, 64 Erhardt, 74 Bhattacharya and Dash, 60 Abe et al., 75 and Grossman and Helpman. 63
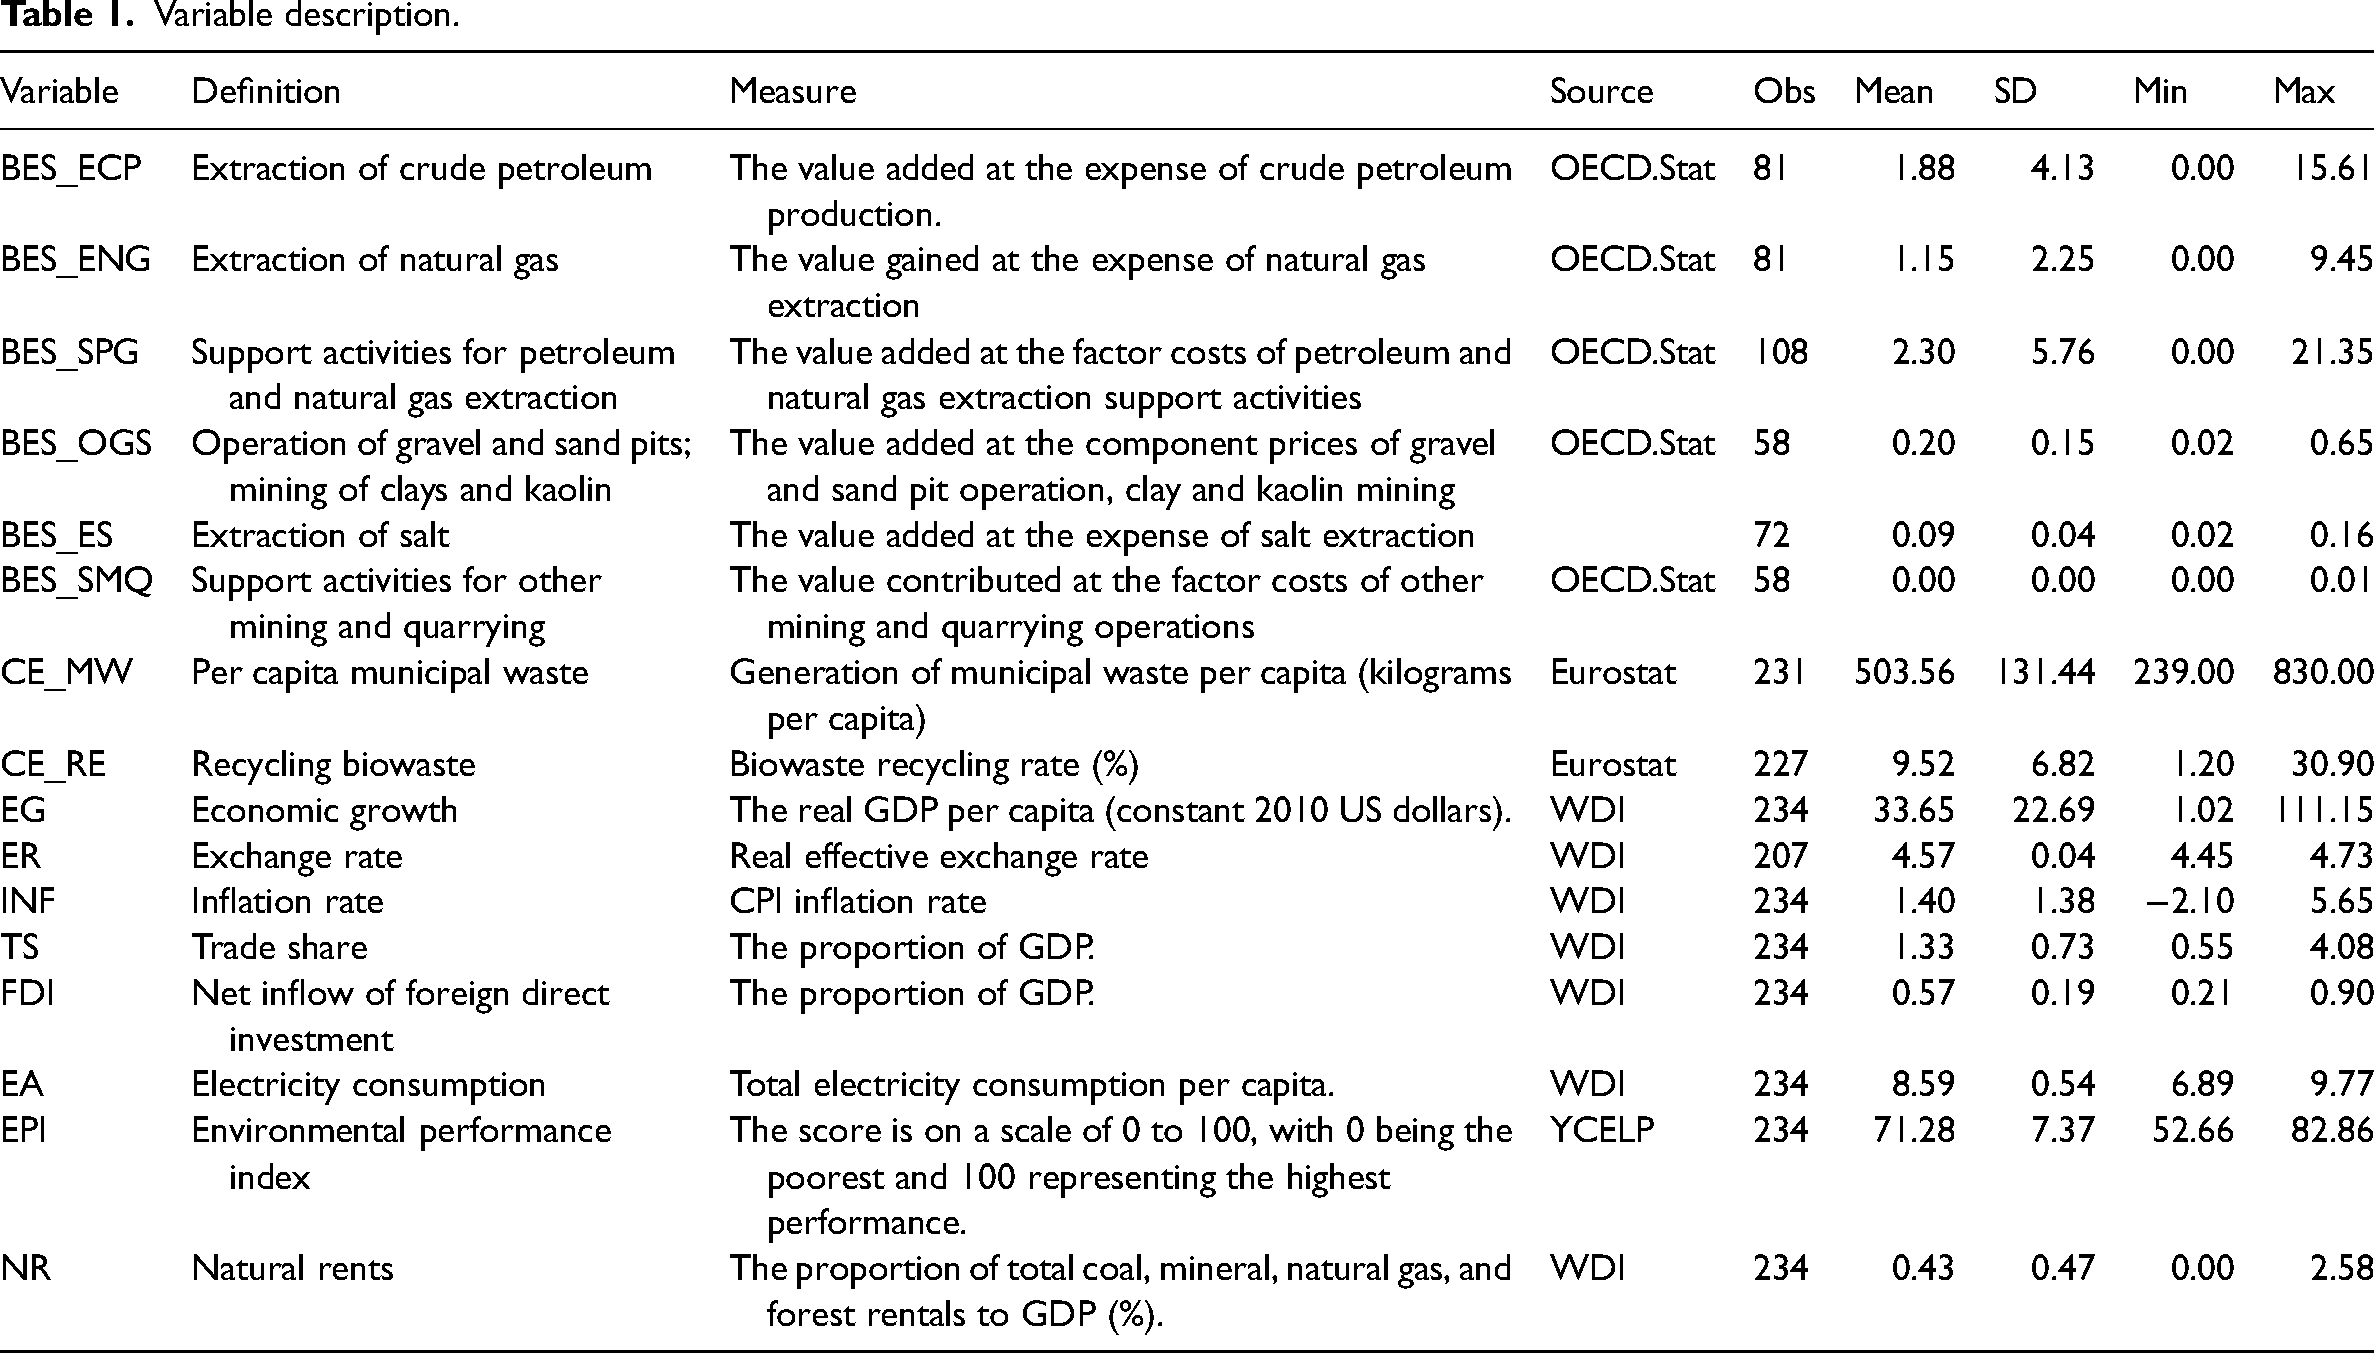
Furthermore, Bhattacharya and Dash 60 examine the effect of fluctuations in the CPI on the inflation rate (INF) and the exchange rate (ER). Le and Nguyen 76 investigate the implications of natural rents (NR). Based on Huo et al., 77 we have added environmental performance index (EPI) and the energy consumption (EC). The Indicators of World Development (WDI) provide access to these variables. We selected 10 European countries from 2012 to 2019 after removing any countries where observations are absent. The included variables are described in greater detail in Table 1. A correlation matrix for all variables is shown in Table 2.
Variable description.
Correlation coefficients.

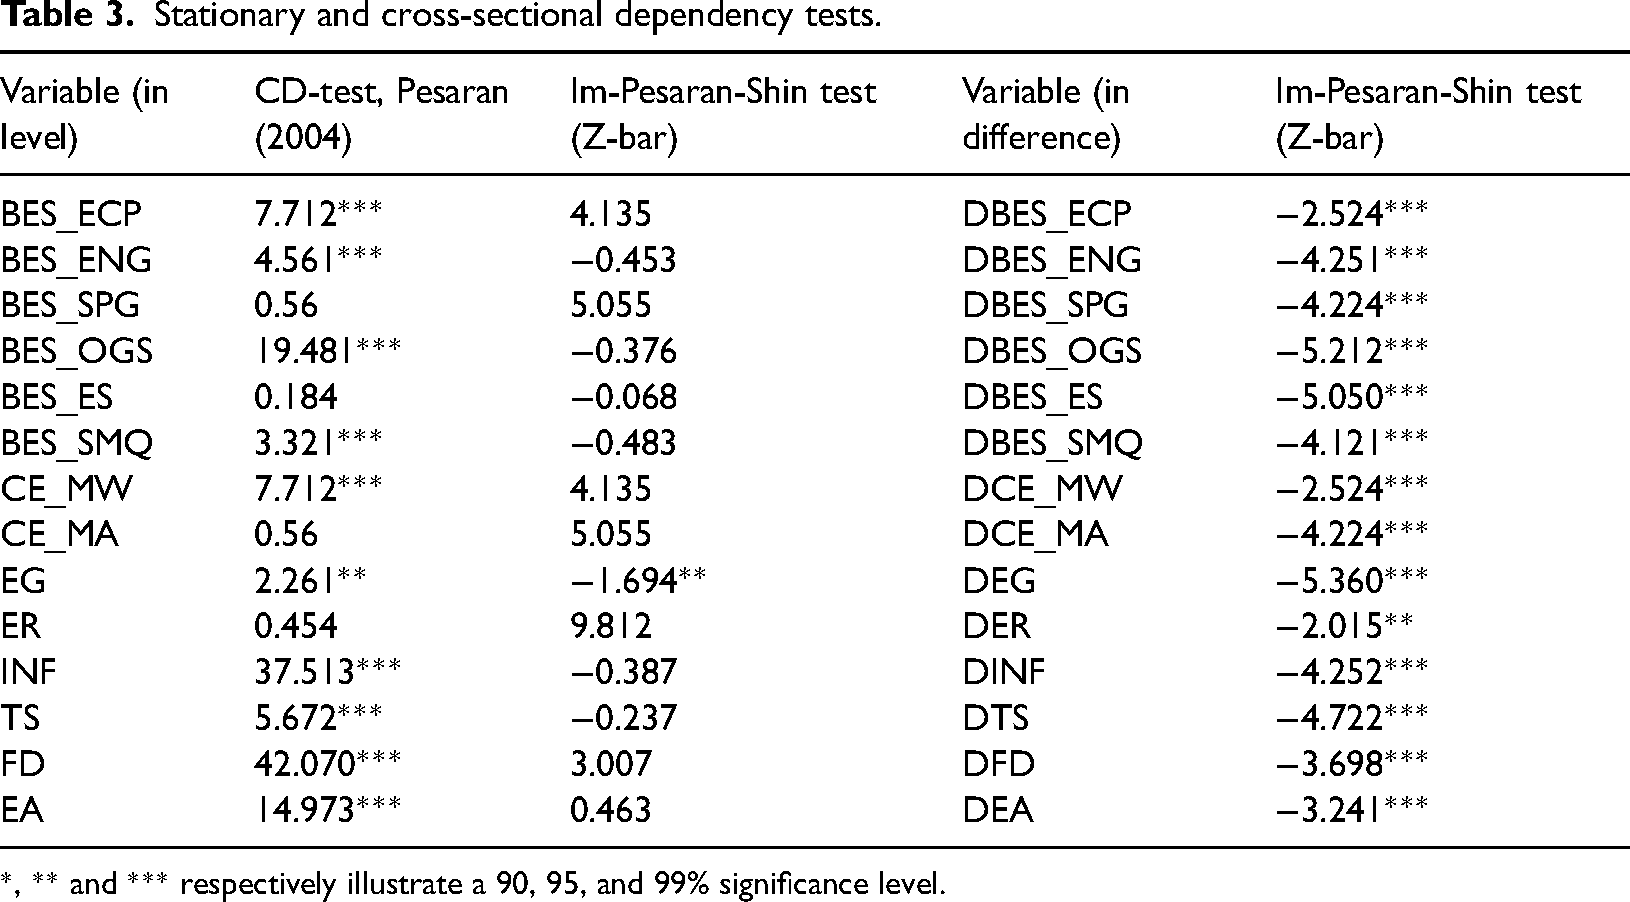
To validate the data, CD might be employed. Im et al.'s 78 Im-Pesaran-Shin unit root test is used to evaluate data stationarity in order to identify CD, and Pesaran 79 provided the appropriate test for this purpose. Table 3 shows the results in accordance with Ha,80,81 Beck and Katz, 82 and Ha and Thanh. 83 In addition to demonstrating the presence of CDs and the first-difference variables’ stationarity, we adopted a PCSE model. As seen in Equation (1), all explanatory variables are subjected to a one-period lag. To eliminate the endogeneity associated with marine minerals and economic complexity. As a precautionary measure, to handle the heterogeneity issue raised by Equation (1), we replicate our estimations using the FGLS model as in Ha84,85 and Gala et al. 86
Stationary and cross-sectional dependency tests.
*, ** and *** respectively illustrate a 90, 95, and 99% significance level.
Empirical results
Complications associated with marine minerals and the economy
Circularity performance (CE) and marine minerals are examined in linear and nonlinear relationships. By using the PCSE estimate and the FGLS estimate, we primarily focus on the effect of circularity performance on marine minerals, which is measured by six variables: the increased value at the expense of salt extraction (BES ES); crude petroleum extraction (BES ECP); extraction of natural gas (BES ENG); natural gas and petroleum extraction support activities (BES SPG); operations of sand pit and gravel, kaolin and clay mining (BES OGS);. Table 4 summarizes the results. Both the FGLS and PCSE estimate yield similar conclusions. CE has a considerable and negative influence on the first four variables while having minimal or no effect on extraction of salt and other mining operations and quarrying support activities. These findings show that circularity helps to reduce marine mineral exploitation. Our findings provide empirical evidence to support our Hypothesis H2. Ahmed et al. 87 investigated the direct and indirect effects of circularity performance on environmental sustainability via the channel of economic growth. Based on long-run empirical results, CE reduces footprint and the negative environmental impacts of economic growth. According to Khan et al. 88 circularity degrades environmental quality by increasing the ecological footprint (including the carbon footprint in ocean-related sectors). However, renewable energy lowers ecological pollution by lowering ecological footprints. There has yet to be an empirical study that investigates the link between circularity and BE performance. Our research is the first to give empirical evidence for this relationship. Our empirical findings are vital in terms of policy implications for the path toward sustainable growth. Our findings suggest that the goal of the green economy and BE are complementary, not substitutes. The usage of financial, physical, intellectual, and technical resources for the pursuit of the green economy does not hinder the goal of BE implementation. Rather, initiatives that promote a country's green economy performance will create preconditions that help it to develop a BE.
Linear influences of circularity performance on marine minerals.

Standard errors in parentheses.
*p < 0.1.
**p < 0.05.
***p < 0.01.
With regard to the control factors, it is worth noting that none of these variables impacts the support activities of other mining and quarrying ventures. Furthermore, economic expansion has a detrimental impact on some elements of marine minerals, such as crude petroleum exploitation and support operations for petroleum and natural gas production. However, it has little to no impact on the other measures of BE. On the other hand, the exchange rate data reveal a substantial and positive association with BES ECP and BES SPG, while they have no impact on the other. Following that, natural gas extraction is the sole indicator that is impacted by the inflation rate, with a rise in the inflation rate connected with an increase in natural gas extraction.
Meanwhile, trade share has an intriguing pattern in that it encourages several areas of marine minerals but has no substantial influence on salt extraction. With the indicator value below the 10% level, trade share appears to limit crude petroleum extraction. Moving on to net FD inflow, the table of results reveals that the majority of the coefficients are positive, but only BES SPG and BES OGS are significant. There is a negative link between EA and all the measures of marine minerals, particularly the extraction of natural gas, the support operations for petroleum, and salt extraction. In terms of marine mineral indicators, the EPI is associated with crude oil extraction. However, other than that, it does not appear to be affected by the other factors. As a final potential factor, natural rents have a positive and significant impact on crude oil extraction, supporting oil and gas extraction activities, operating gravel pits and sand pits, and mining clays and kaolin, but they have a significant negative impact on natural gas extraction.
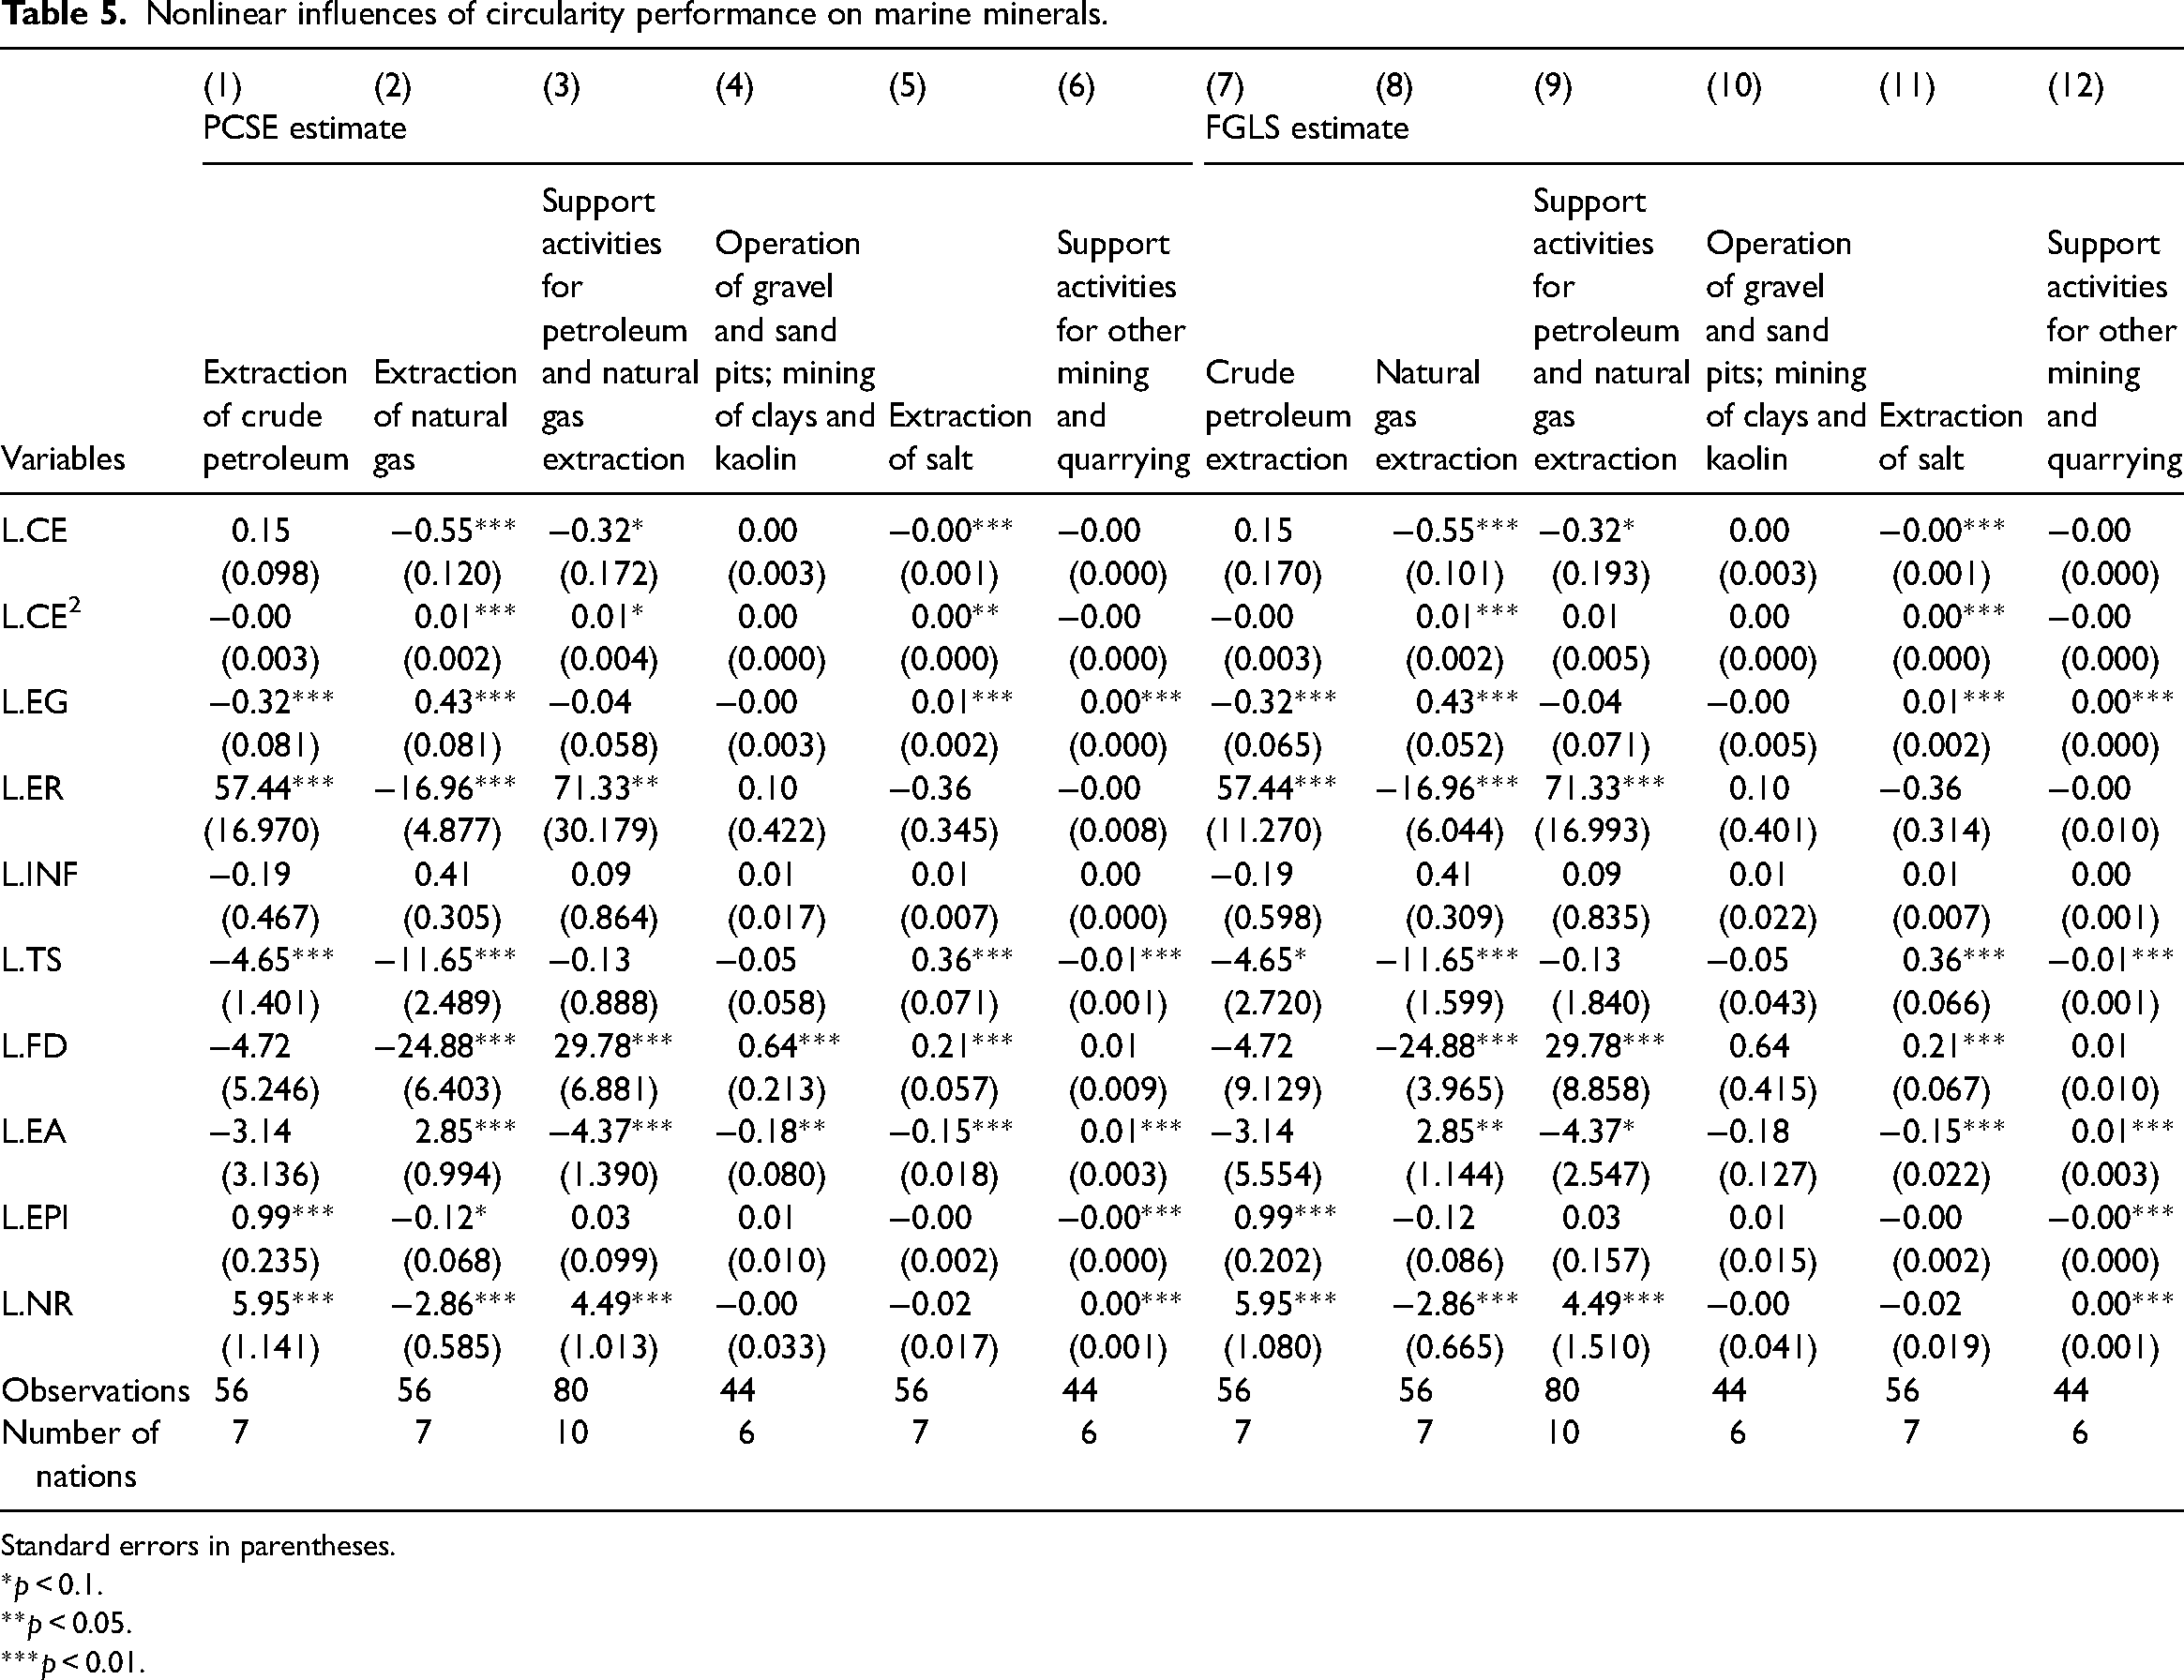
This section examines whether circularity performance has a nonlinear effect on marine minerals. On an upward curve, Table 5 shows the effect of natural gas production, gravel, and sand mining, clay and kaolin mining, and salt extraction. Based on these findings, we can say that CE values, when they reach a certain level, positively impact operations of sand pit and gravel, natural gas extraction, and clay and kaolin mining. Notably, the marginal impacts of natural gas extraction support activities, crude petroleum extraction, petroleum, and other quarrying and mining support activities follow a downward-sloping pattern. Marine minerals have a nonlinear relationship with CE. An illustration of these findings can be found in Figure 1. Our findings support Hypothesis H3, suggesting that CE initiatives only have a positive effect when CE performance reaches a certain level.
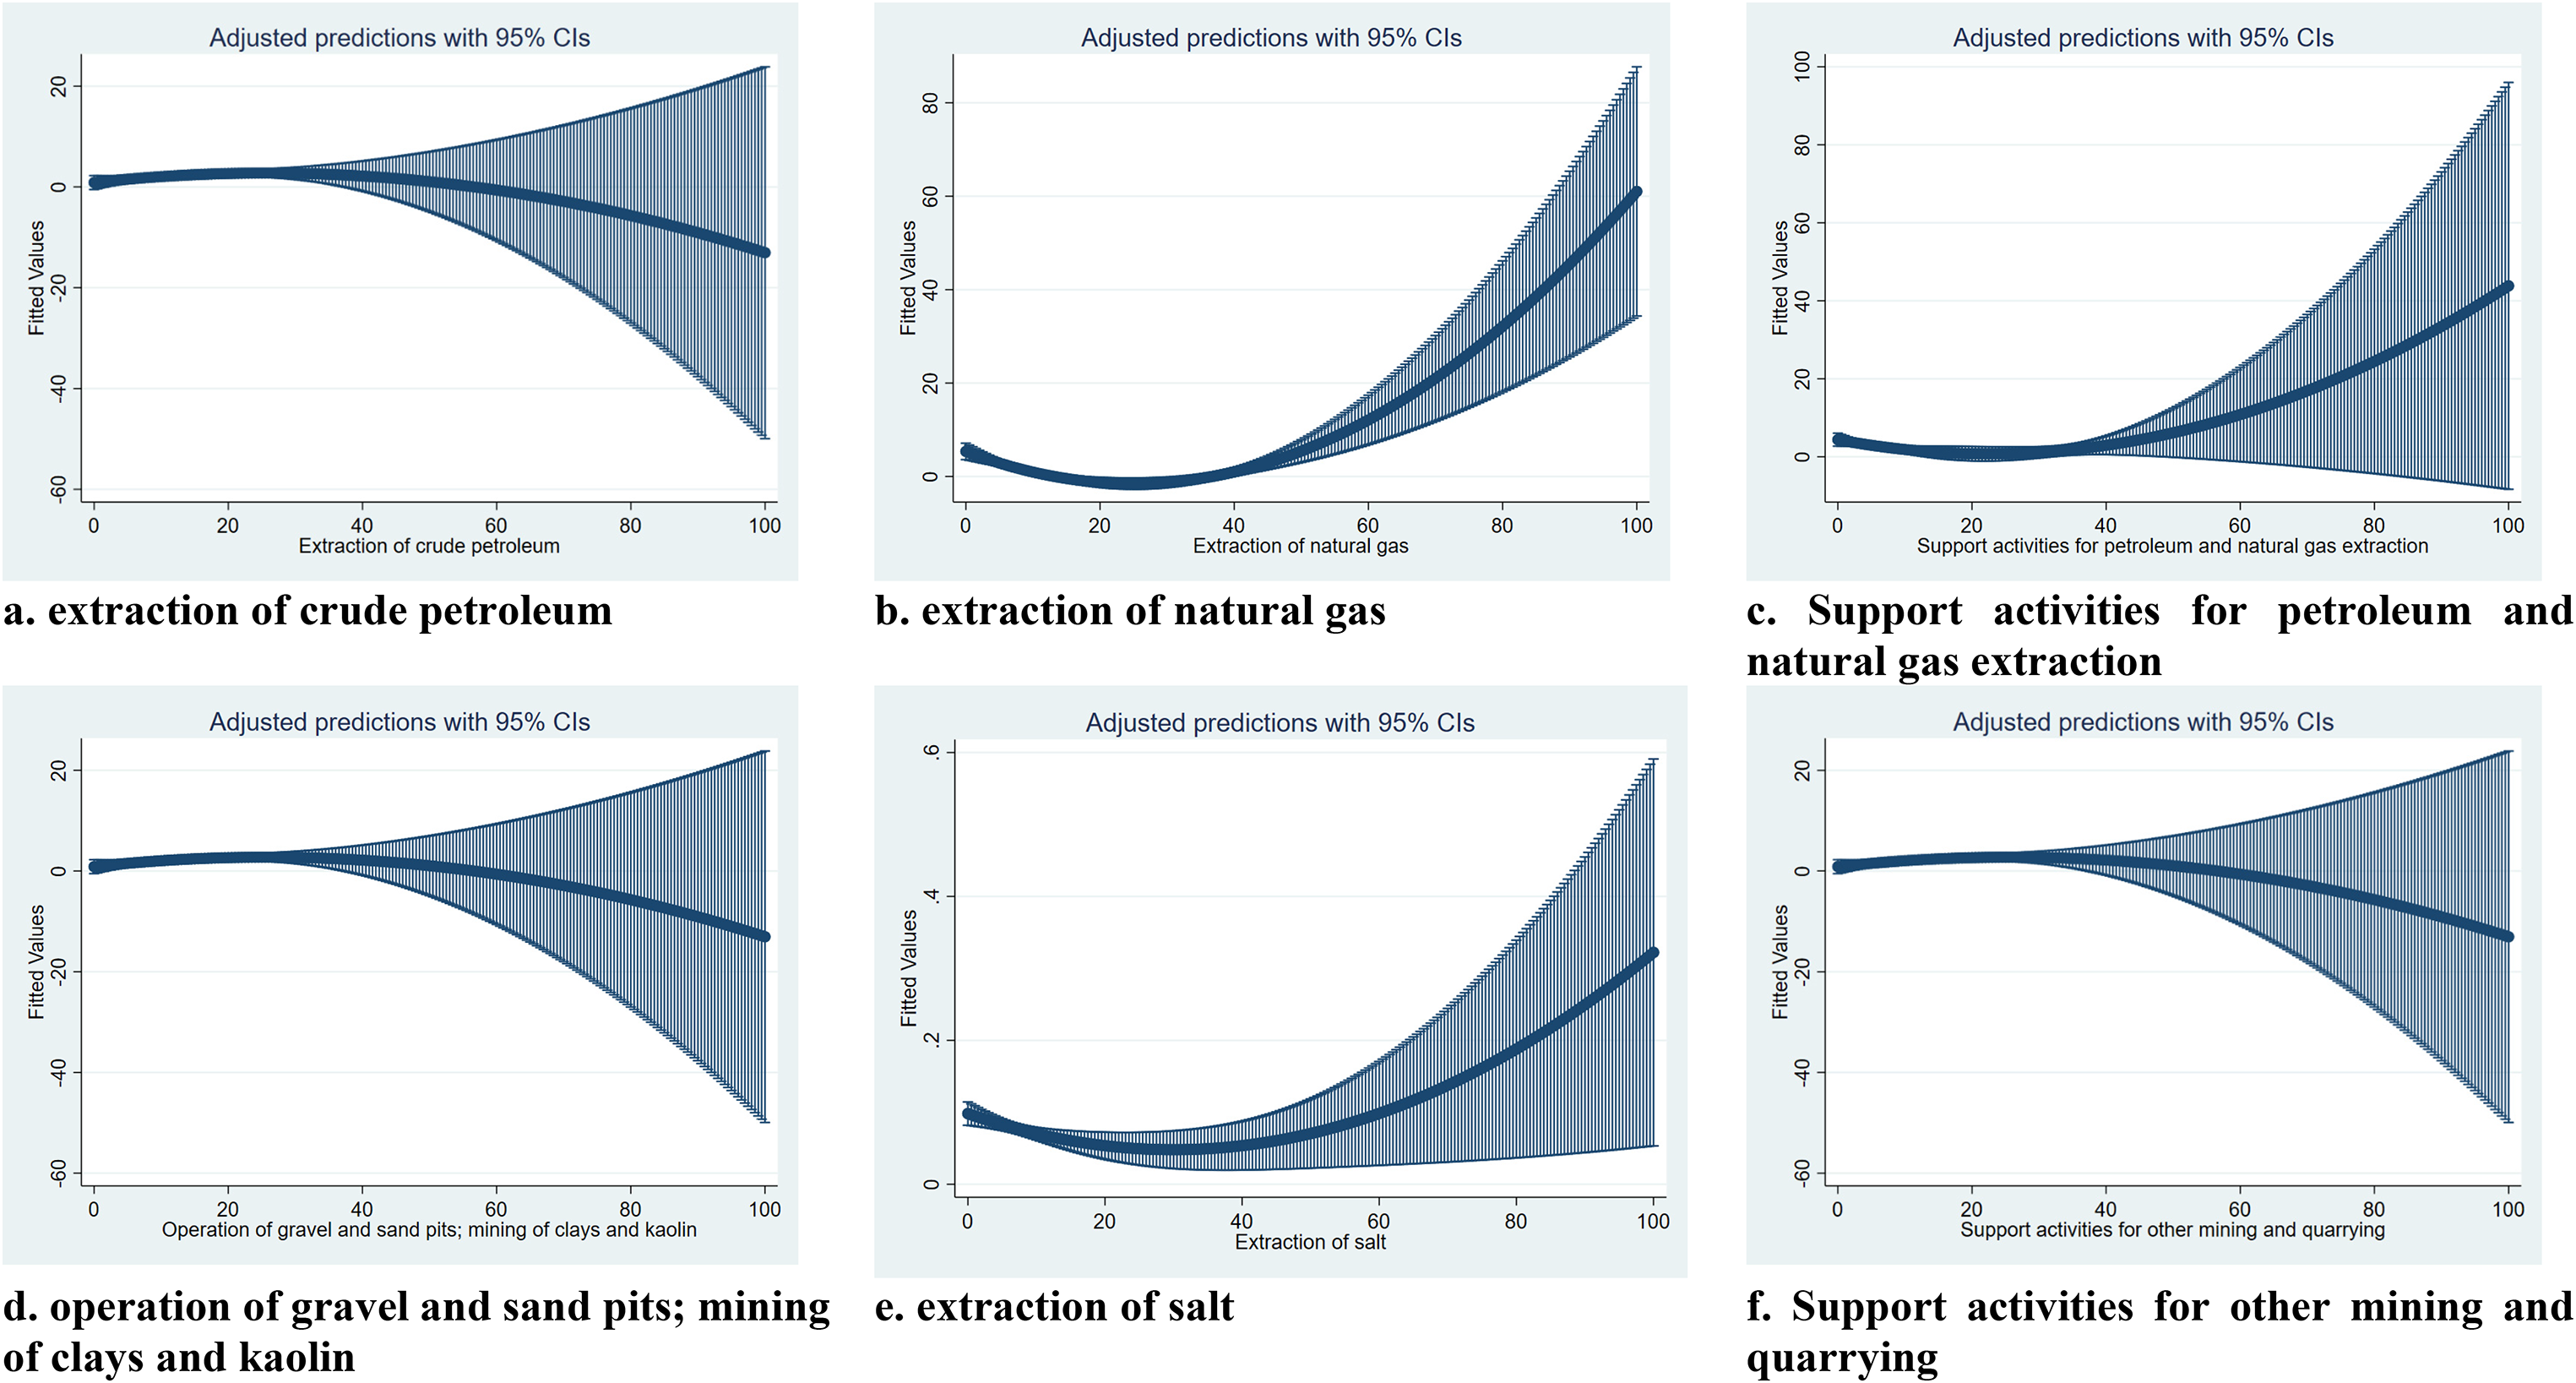
Predictive margin of circularity performance on marine minerals.
Nonlinear influences of circularity performance on marine minerals.
Standard errors in parentheses.
*p < 0.1.
**p < 0.05.
***p < 0.01.
Robustness checks
Circularity performance and ocean energy
We do a robustness test to confirm our prior findings in the following step. We investigate the impact of circularity performance on two components of ocean energy, namely ocean electricity transmission and generation. Table A.2 displays the results. Circularity performance is 1% connected to ocean power production but statistically negligible for ocean energy transfer. In other words, Hypothesis H3 still holds. Only economic expansion has a statistically significant effect on both the transmission and generation of ocean power, but at different magnitudes. Economic growth is mainly connected to the transmission of maritime power, but economic growth is adversely related to ocean energy generation. As for the transmission and production of ocean electricity, the inflation rate and the EPI do not show statistical significance. Figure A.1 displays our empirical findings.
In most cases, the independent variables are statistically significant for the transmission and production of ocean electricity differ at different levels of significance. Specific factors affecting ocean electricity transmissions, such as exchange rates, foreign direct investment, and electricity consumption, are statistically significant at 1% and 10%, respectively. There is a positive relationship between the exchange rate, foreign direct investment, and electricity consumption. Ocean electricity production is, however, not statistically significant when such variables are considered. Meanwhile, the trade share and natural rent coefficients are statistically significant for ocean power generation, at 1% and 5%, respectively. Trade share harms ocean power production, but natural rents benefit it. According to the findings, economic growth is the only variable that can explain the transmission and production of ocean power, and the factors accounting for the transmission and production of ocean resources are distinct.
Circularity performance has a nonlinear marginal effect on the transmission and production of electricity, as shown in Figure A.1. Table A.2 shows that the coefficients of the significant variables for the transmission and production of electricity are both convex, supporting the magnitude of the coefficient for transmission.
Robustness checks: alternative measures of circularity performance
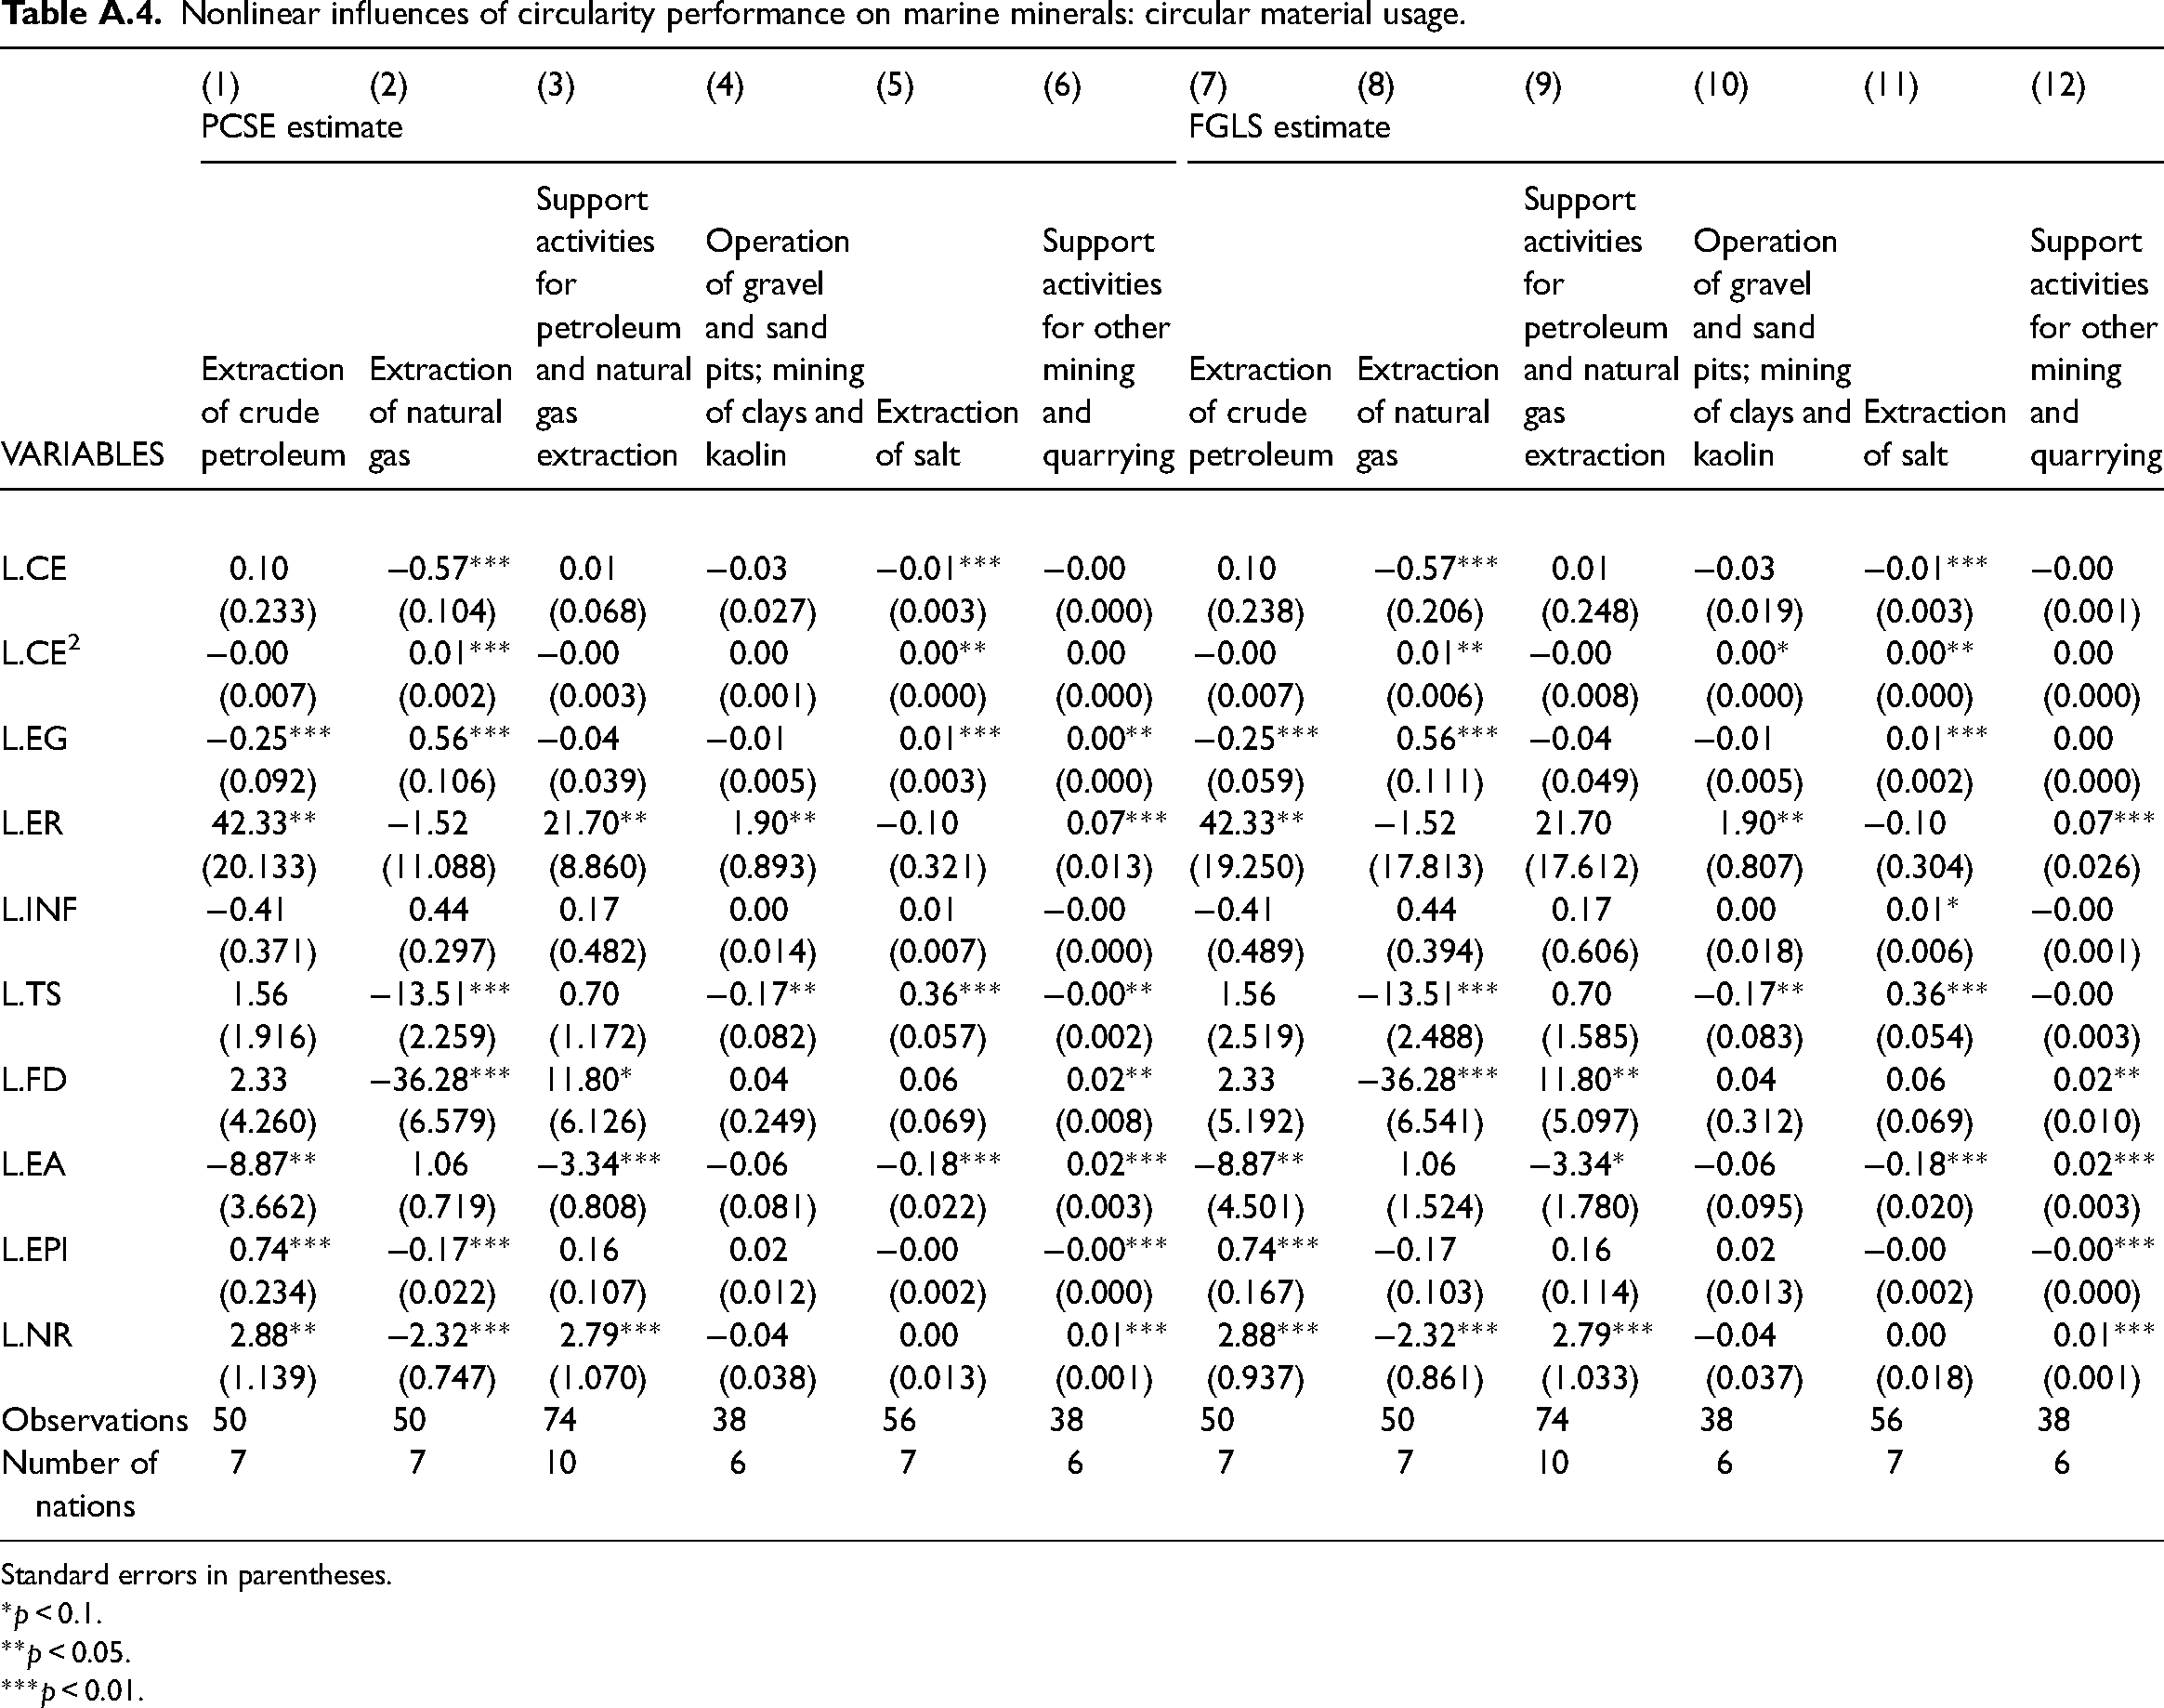
We employ different measurements of circularity performance in this section, such as the linear and nonlinear effect of circularity performance on marine minerals. PCSE and FGLS estimates are used for six dependent variables: natural gas extraction, support operations of petroleum and natural gas extraction, extraction of crude petroleum, operation of sand pit and gravel, salt extraction, kaolin and clay mining, and other support activities for quarrying and mining. Tables A.3 and A.4 show the results for the linear influences and nonlinear impacts, respectively.
It is important to note that for the estimation of linear influences, the coefficients on the independent variables are identical for the PCSE and FGLS estimations, but some variables have statistically significant differences. A 1% statistical significance level is observed for circularity performance in the PCSE estimation for crude petroleum extraction, but this is not observed in the FGLS estimation. For crude petroleum extraction, the PCSE and FGLS estimates both indicate statistically significant coefficients for FDI at 10%. PCSE estimates show the statistically significant effects of exchange rates on natural gas extraction and support activities, but FGLS estimates show no significant effects. Both PCSE and FGLS estimates find that the coefficient on the inflation rate is not statistically significant across any of the six dependent variables, implying that the inflation rate is empirically irrelevant for explaining the effects of circularity on marine minerals. A statistical significance is found for circularity performance, exchange rate, and electricity consumption across almost all six dependent variables, which indicates that these variables are empirically significant to the impact of circularity performance on marine resources. Across the six dependent variables, the coefficient of circularity performance is negative, meaning that a higher circularity score is associated with a lower usage of marine minerals. In contrast, the coefficients associated with the exchange rate are positive, suggesting that the exchange rate negatively impacts marine resource utilization.
The coefficients’ signatures on the remaining variables show the extent of the effects on each marine resource utilization activity. Economic growth favors natural gas extraction the most, followed by extraction of salt and support operations for other mining and quarrying activities, but it hampers crude petroleum extraction. The trade share demonstrates a negative relationship with gravel, natural gas extraction, and sand pit operation, kaolin and clay mining, and support operations for other quarrying and mining, but it favors salt extraction. Activities to support the exploitation of petroleum and natural gas, extraction of crude petroleum, and mining and quarrying activities benefit from FDI, but natural gas extraction is considerably discouraged. With a negative coefficient for electricity consumption on crude oil extraction, natural gas and petroleum extraction support operations, and salt extraction, these variables are negatively affected, except for assisting with other quarrying and activities, whose coefficient is positive but small. It is empirically relevant that the EPI and natural rents positively correlate with natural gas extraction. There is a positive correlation between natural rents and crude petroleum extraction, oil and gas extraction support activities, and quarrying and mining support operations, but a significant negative correlation with natural gas extraction.
Furthermore, the results show that the effects of the independent variables on the operations of mining of clays and kaolin, gravel and sand pits, aiding in other mining and quarrying operations are relatively small. For the three remaining activities, the coefficients on the significant variables are relatively high, implying the profound influence of such variables on marine resource usage.
The model is enhanced with squared terms for nonlinear relationships. Both PCES and FGLS provide similar results. As with the linear influences estimation, the magnitude of the effects of the independent variables on the dependent variables remains unchanged. Except for the inflation rate and salt extraction, all the variables are statistically insignificant using the FGLS estimate. The coefficients for gravel pit operation, kaolin and clay mining, extraction of salt, and support activities for other quarrying and mining remain low, consistent with the linear effect estimation. Despite slight changes in coefficients, the magnitude of the coefficients for the remaining three activities remains the same.
Conclusions
A study of the relationship between circularity performance and marine minerals is presented in this article. For data from 2012 to 2019, six different measures were employed to assess the performance of marine minerals in the European region, including added value at factor costs operation of sand pits and gravel, clay and kaolin mining; extraction of natural gas; for crude petroleum extraction; natural gas and petroleum support operations; salt extraction; and other mining and quarrying support activities. Between 2012 and 2019, enhancing BE performance in Europe will require high levels of green economy performance. Therefore, green economy performance has positive effects when it reaches a certain point. The effects of ocean energy and marine minerals on the performance of the green economy are also examined as a robustness check.
The findings of this study and those of several earlier publications emphasize the relevance of circularity performance to marine minerals from a policy standpoint. In order to make a sustainable lifestyle possible, politicians should develop a policy that encourages both producers and consumers to protect the environment, as well as innovation that is both clean and environmentally friendly. An intelligent “industrial policy for the environment” would consider employment, trade, and the impact of the environment on production and consumption. Regulatory and policy development is the primary responsibility of government agencies. Because they adequately represent neither the current stakeholders nor the future generations, the government must act as a referee or arbitrator.
According to our findings, European countries should stimulate the growth of green projects by establishing clear policy objectives and requirements. At the same time, they should provide industry the freedom to attain these objectives through a variety of approaches. Pursuing environmentally friendly techniques, particularly in the protection of marine mineral resources, entails major dangers since it necessitates enormous financial resources and modern technology. These hazards may prevent governments from regularly accomplishing this goal. New entrants and technology must play a critical role in addressing environmental concerns. Revenue management, Budgeting, debt, accounting, purchasing processes, capital planning, investment, and financial management should all be included in a complete collection of green and ecological sustainability rules. Nonetheless, the precise green policies will range greatly due to the various sizes and circumstances of each jurisdiction. As a result, it is critical for these countries to have a long-term strategy and be prepared to accept and handle risks and repercussions. Furthermore, our findings emphasize the need of emphasizing the development of a green economy as a fundamental priority in their strategies for protecting the ecological system.
There are two significant limitations to our findings to consider. For starters, our investigation was limited to archival data from Europe. However, it is crucial to recognize that green economy activities are critical to boosting BE performance in poor nations where environmental deterioration is a major concern. Unfortunately, there are no surveys in emerging nations that follow strict rules for gathering data on the green economy and BE performance. Second, the impact of green economy measures on BE performance may be impacted by factors other than those we investigated. For example, government program efficiency, levels of financial development, and economic complexity (knowledge spillover) may all play key roles. Further study may be performed to acquire a better understanding of these new channels and their impact on BE performance and the promotion of green economy initiatives. Further data sources may be investigated in future studies to gain insightful understand green economy activities in developing nations, as well as the role of transmission channels in explaining this link.
Footnotes
Contributions
Le Thanh Ha was equally contributed to all stages of preparing, drafting, writing and revising this review article. All authors listed have made a substantial, direct, and intellectual contribution to the work during different preparation stages. All authors read, revised and approved the final version of this manuscript.
Declaration of conflicting interests
The author declared no potential conflicts of interest with respect to the research, authorship, and/or publication of this article.
Funding
The authors disclosed receipt of the following financial support for the research, authorship, and/or publication of this article: This paper was supported by National Economics University.

Data availability statement
Data available on request due to privacy/ethical restrictions.
Appendix
Nonlinear influences of circularity performance on marine minerals: circular material usage.
| (1) | (2) | (3) | (4) | (5) | (6) | (7) | (8) | (9) | (10) | (11) | (12) | |
|---|---|---|---|---|---|---|---|---|---|---|---|---|
| PCSE estimate | FGLS estimate | |||||||||||
| VARIABLES | Extraction of crude petroleum | Extraction of natural gas | Support activities for petroleum and natural gas extraction | Operation of gravel and sand pits; mining of clays and kaolin | Extraction of salt | Support activities for other mining and quarrying | Extraction of crude petroleum | Extraction of natural gas | Support activities for petroleum and natural gas extraction | Operation of gravel and sand pits; mining of clays and kaolin | Extraction of salt | Support activities for other mining and quarrying |
| L.CE | 0.10 | −0.57*** | 0.01 | −0.03 | −0.01*** | −0.00 | 0.10 | −0.57*** | 0.01 | −0.03 | −0.01*** | −0.00 |
| (0.233) | (0.104) | (0.068) | (0.027) | (0.003) | (0.000) | (0.238) | (0.206) | (0.248) | (0.019) | (0.003) | (0.001) | |
| L.CE2 | −0.00 | 0.01*** | −0.00 | 0.00 | 0.00** | 0.00 | −0.00 | 0.01** | −0.00 | 0.00* | 0.00** | 0.00 |
| (0.007) | (0.002) | (0.003) | (0.001) | (0.000) | (0.000) | (0.007) | (0.006) | (0.008) | (0.000) | (0.000) | (0.000) | |
| L.EG | −0.25*** | 0.56*** | −0.04 | −0.01 | 0.01*** | 0.00** | −0.25*** | 0.56*** | −0.04 | −0.01 | 0.01*** | 0.00 |
| (0.092) | (0.106) | (0.039) | (0.005) | (0.003) | (0.000) | (0.059) | (0.111) | (0.049) | (0.005) | (0.002) | (0.000) | |
| L.ER | 42.33** | −1.52 | 21.70** | 1.90** | −0.10 | 0.07*** | 42.33** | −1.52 | 21.70 | 1.90** | −0.10 | 0.07*** |
| (20.133) | (11.088) | (8.860) | (0.893) | (0.321) | (0.013) | (19.250) | (17.813) | (17.612) | (0.807) | (0.304) | (0.026) | |
| L.INF | −0.41 | 0.44 | 0.17 | 0.00 | 0.01 | −0.00 | −0.41 | 0.44 | 0.17 | 0.00 | 0.01* | −0.00 |
| (0.371) | (0.297) | (0.482) | (0.014) | (0.007) | (0.000) | (0.489) | (0.394) | (0.606) | (0.018) | (0.006) | (0.001) | |
| L.TS | 1.56 | −13.51*** | 0.70 | −0.17** | 0.36*** | −0.00** | 1.56 | −13.51*** | 0.70 | −0.17** | 0.36*** | −0.00 |
| (1.916) | (2.259) | (1.172) | (0.082) | (0.057) | (0.002) | (2.519) | (2.488) | (1.585) | (0.083) | (0.054) | (0.003) | |
| L.FD | 2.33 | −36.28*** | 11.80* | 0.04 | 0.06 | 0.02** | 2.33 | −36.28*** | 11.80** | 0.04 | 0.06 | 0.02** |
| (4.260) | (6.579) | (6.126) | (0.249) | (0.069) | (0.008) | (5.192) | (6.541) | (5.097) | (0.312) | (0.069) | (0.010) | |
| L.EA | −8.87** | 1.06 | −3.34*** | −0.06 | −0.18*** | 0.02*** | −8.87** | 1.06 | −3.34* | −0.06 | −0.18*** | 0.02*** |
| (3.662) | (0.719) | (0.808) | (0.081) | (0.022) | (0.003) | (4.501) | (1.524) | (1.780) | (0.095) | (0.020) | (0.003) | |
| L.EPI | 0.74*** | −0.17*** | 0.16 | 0.02 | −0.00 | −0.00*** | 0.74*** | −0.17 | 0.16 | 0.02 | −0.00 | −0.00*** |
| (0.234) | (0.022) | (0.107) | (0.012) | (0.002) | (0.000) | (0.167) | (0.103) | (0.114) | (0.013) | (0.002) | (0.000) | |
| L.NR | 2.88** | −2.32*** | 2.79*** | −0.04 | 0.00 | 0.01*** | 2.88*** | −2.32*** | 2.79*** | −0.04 | 0.00 | 0.01*** |
| (1.139) | (0.747) | (1.070) | (0.038) | (0.013) | (0.001) | (0.937) | (0.861) | (1.033) | (0.037) | (0.018) | (0.001) | |
| Observations | 50 | 50 | 74 | 38 | 56 | 38 | 50 | 50 | 74 | 38 | 56 | 38 |
| Number of nations | 7 | 7 | 10 | 6 | 7 | 6 | 7 | 7 | 10 | 6 | 7 | 6 |
Standard errors in parentheses.
*p < 0.1.
**p < 0.05.
***p < 0.01.