



Abstract
Amidst the rising carbon emissions posing significant challenges for the global environment, there exists an inadequate recognition of the profound implications associated with foreign investment, trade openness, and energy consumption in South Africa. This study investigates the dynamic relationship among foreign investment, trade, energy, and the interactive effect of foreign investment and trade openness on environmental pollution in South Africa using time series data from 1990 to 2020. The results from the Johansen cointegration analysis and vector error correction model confirm a sustained long-term relationship among foreign investment, trade, energy, and CO2 emissions. This suggests that any deviations from CO2 emissions equilibrium would gradually self-adjust autonomously. This study reveals the long-run positive effects of trade openness and energy consumption on environmental pollution, while foreign investment exhibits a persistent negative impact on environmental pollution in the long run. Economic growth reduces CO2 emissions, while population growth and inflation are detrimental to the environment in the long run. The interaction between foreign investment and trade reduces environmental pollution in the short and long run. The Granger causality tests show a two-way causal relationship between population growth and CO2 emissions and a one-way causal connection among other variables, enlightening the linkage among these critical factors. The study offers several policy suggestions including environmentally friendly trade practices, investing in energy efficiency and transition, and promoting sustainable foreign investment in South Africa to achieve long-term economic sustainability while curbing environmental impact.
Introduction
In the past few decades, South Africa’s economy has grown and developed significantly, positioning it as one of Africa’s top economies.1,2 The concomitant expansion of industries, urbanization, and increased energy demand has been pivotal in catapulting South Africa onto the global stage. As its economy surges forward, the linkages of various factors such as foreign investment, international trade, energy consumption, and environmental concerns have come under scrutiny. This study endeavors to unravel the complex combination of these elements and assess their implications for South Africa’s environmental sustainability.
Foreign investment, international trade, use of energy, and CO2 output nexuses are important within the framework of sustainable development. South Africa, endowed with abundant natural resources, attracts significant foreign direct investment (FDI) into various sectors such as mining, manufacturing, and renewable energy projects.3,4 This influx of foreign capital holds the promise of economic growth, employment generation, and technological advancement. 5 It also raises concerns about environmental degradation, given the energy-intensive nature of some industries. 6 Globalization and international trade have significantly shaped South Africa’s economic landscape. The country is an active participant in international trade, importing and exporting a diverse range of goods. 7 This engagement in global trade has been instrumental in driving economic growth, yet it also raises questions about the associated carbon footprint, as higher trade volumes often entail increased energy consumption and transportation emissions.
The urgency of addressing climate change and reducing CO2 emissions is a global concern. As the Intergovernmental Panel on Climate Change (IPCC) has strongly emphasized and various international agreements, including the Paris Agreement, nations worldwide are dedicated to mitigating the negative implications of global warming.8,9 South Africa, as a signatory to these accords, recognizes the need to align its economic growth with environmentally sustainable practices. 10 South Africa’s energy landscape is marked by dependency on nonrenewable sources of energy, primarily coal, to produce power.11,12 While this has fueled economic expansion, it has also led to the nation being one of Africa’s leading emitters of carbon dioxide emissions. 13 Kamyab et al. 14 assert that the effect of energy consumption on CO2 emissions is shaped by both the availability of renewable energy sources and the efficiency of energy usage (EU). Striking a balance among energy security, development, and CO2 output reduction is one of the central challenges facing the nation. South Africa serves as a pertinent case study due to its unique socioeconomic context. It is an emerging economy with significant foreign investment, active participation in global trade, and a heavy reliance on fossil fuels for energy.10,11,15 The amalgamation of these factors makes it a microcosm of problems that numerous SSA nations encounter in balancing economic growth and sustainability. According to Aydin and Degirmenci, 16 EU nations can act as a benchmark by setting standards that attract environmentally friendly foreign investments employing the Environmental Kuznets Curve (EKC) hypothesis. Similarly, South Africa can serve as a model for SSA and other emerging economies.
The study addresses the pressing need for evidence-based insights into the trade-offs between economic development, driven by foreign investment and international trade, and the environmental consequences of increased energy consumption and CO2 emissions. South Africa's experience can offer valuable lessons for other SSA countries grappling with similar trade-offs. South Africa, like other SSA nations, is dedicated to accomplishing the United Nations Sustainable Development Goals (SDGs). Affordable and green energy is one of these global objectives (SDG 7), along with climate action (SDG 13).17,18 By understanding the relationship among foreign investment, trade, EU, and CO2 output, the research adds to the knowledge base necessary for achieving these goals. This study significantly advances our understanding of the relationship between foreign investment, trade, energy consumption, and their impact on environmental pollution in South Africa. It investigates whether increased trade interacts with foreign investment to exacerbate or alleviate environmental pollution. The findings contribute to policy discussions on balancing economic growth with environmental sustainability and provide both theoretical insights and practical policy recommendations for achieving sustainable development.
Undoubtedly, despite the growing body of research examining the relationships between foreign investment, trade, energy consumption, and environmental pollution, the findings remain ambiguous, and the South African economy has received limited attention. Most studies focus on one or two of these variables, often using panel data, and have produced inconsistent results.19–21 To better understand the relationship between foreign investment, trade, energy consumption, and environmental pollution, this study will use South Africa as a case study. The selection of South Africa is influenced by three key factors: (a) South Africa is a major economy in Africa, attracting substantial foreign investment and trade, both of which are crucial for its economic development and sustainable policy formulation; (b) the country’s reliance on coal for energy results in high CO2 emissions, making it essential to study the impact of foreign investment, trade, and energy consumption on environmental pollution to address climate change and promote sustainable energy; and (c) insights from South Africa's experience can inform other emerging countries facing similar challenges, particularly in SSA, aiding in the global pursuit of sustainable economic growth while mitigating environmental impacts.
This study aims to bridge the aforementioned research gaps, making a significant contribution to the existing body of literature in multiple ways. It offers comprehensive insights into how foreign investment, trade, and energy consumption influence CO2 emissions, serving as a key indicator of environmental pollution. Beyond examining the direct impacts of foreign investment, trade, and energy consumption, this research unveils the moderating role of trade in the nexus between foreign investment and environmental pollution. This aspect facilitates an assessment of whether the level of trade moderates the influence of foreign investment on environmental degradation. Besides employing a methodology that accounts for long-term effects and addresses endogeneity concerns, the study delves into the causal relationships among foreign investment, trade, energy consumption, and environmental pollution. The study utilizes a time series causality technique that considers potential endogeneity, tackles cointegration issues, addresses nonstationary time series data, and incorporates error correction terms (ECTs). This comprehensive approach enables the analysis of both short-term dynamics and long-term equilibrium relationships among the variables, surpassing the limitations of traditional Granger causality methods. By adopting such a rigorous methodology, this study ensures that the causality tests are unbiased, valid, and reliable.
The study is organized as follows: Literature review section of the study focuses on doing a comprehensive analysis of the existing empirical research. Moving on to Data, model and methodology section, the data and applied methods are precisely presented. Results and discussion section accurately details the empirical results and the key findings. Lastly, the study culminates in the last section, offering conclusions, policy recommendations, and directions for subsequent investigations.
Literature review
This segment delivers a concise overview of theoretical frameworks, encompassing discussions on the EKC hypothesis, the pollution haven hypothesis, the trade–environment nexus theory, and the United Nations Sustainable Development Goals (SDGs). It also encapsulates past empirical research exploring the interconnections between foreign investment, trade openness, energy consumption, and CO2 output.
Theoretical frameworks
The EKC hypothesis proposes a relationship between economic development and environmental degradation, characterized by an inverted U-shape. 22 In the initial stages of a country’s development, environmental degradation tends to increase, but beyond a certain income threshold, it starts to decline. This suggests that economic growth may have both positive and negative impacts on CO2 emissions. 22 As South Africa experiences economic growth driven by foreign investment and trade openness, the question arises: does the trajectory of CO2 emissions align with the expected inverted U-shape?. 23 The pollution haven hypothesis asserts that FDI might flow to countries with lenient environmental regulations, potentially leading to increased pollution. This hypothesis implies that foreign investment could influence CO2 emissions, contributing either to environmental improvement or degradation. 24 The trade–environment nexus suggests that international trade, by affecting production and consumption patterns, has implications for the environment. 25 The Porter Hypothesis suggests that trade can drive environmental improvements through innovation. 26 Trade openness may impact CO2 emissions by changing production efficiency and composition. This study investigates how South Africa’s trade openness influences CO2 emissions, considering the nature of traded goods, their environmental impact, and whether trade encourages sustainable production practices.27,28 The relationship between foreign investment, trade, and energy consumption in South Africa holds significance for the country’s progress toward sustainable and low-carbon development, aligning with the United Nations SDGs, particularly Goal 13 (Climate Action). The study’s findings can offer insights for policies and actions aimed at achieving SDGs related to climate change mitigation, considering the broader implications for South Africa’s sustainable development agenda. 29
Empirical review
This section examines the connections among foreign investment, trade openness, energy consumption, and CO2 output. The association between these pivotal factors encapsulates the complex dynamics that emerge as nations strive to meet the dual objectives of economic prosperity and environmental sustainability. This review navigates the extensive body of literature that has explored these relationships, a concise synthesis of key findings and insights are presented while also identifying gaps that motivate the need for further empirical examination in South Africa.
Foreign investment and CO2 emissions nexus
In modern times, foreign investment has emerged as a significant key catalyst for economic expansion in numerous nations.30,31 Scholars have sought to understand its implications for CO2 emissions, with some studies highlighting the potential for FDI to reduce emissions through the introduction of cleaner technologies and practices.32–35 The effects of FDI on China’s efforts to reduce emissions were investigated by Lin et al.. 36 In their study, they employed spatial Durbin economic models that included two-way fixed effects, which they conducted between 2004 and 2015. A significant discovery emerged from the research results: FDI was crucial in achieving countrywide emission reductions. CO2 output in manufacturing sectors characterized by high levels of capital investment, advanced technology usage, and labor-intensive operations were found to be reduced as a result of FDI in another study by Yi et al.. 37 Zhang et al. 38 explored the exciting field of foreign investment behavior under environmental laws, illuminating its potential to lessen China’s carbon footprint in terms of both quantity and intensity. In contrast, Gyamfi 39 found that FDI contributed anywhere from 0.0156% to 0.186% to the rise in consumption-based CO2 outflow in many SSA nations. In a study Zubair et al., 40 they investigated Nigeria to see if economic indicators, including gross domestic product (GDP), trade openness, FDI, and capital, all participate in the nation’s initiatives to cut carbon emissions. The researchers looked at data from 1980 to 2018 using cutting-edge methods, including bounds testing for Autoregressive Distributed lag (ARDL) and enhanced Vector Autoregressive (VAR) models. Their findings showed that lower emissions of carbon dioxide in Nigeria followed increases in FDI.
In contrast, some studies caution against the environmental consequences associated with certain FDI-driven industries.34,41,42 Jafri et al. 43 shifted their attention to the asymmetrical influences of FDI and remittances on CO2 output in China from 1981 to 2019. Employing the nonlinear ARDL method, they discovered something else: FDI has a beneficial impact on carbon dioxide emissions. Based on their analysis, Wang et al. 44 determined that FDI was a contributing factor to China’s current stage of emissions growth. Abdul-Mumuni et al. 45 provided a unique viewpoint by analyzing the unequal effects of FDI on carbon emissions in 41 randomly chosen countries in sub-Saharan Africa between 1996 and 2018. Using the panel nonlinear ARDL method, their research concluded that an uptick in FDI led to higher carbon emissions over time, while a decrease in FDI led to lower emissions. Similarly, Apergis et al. 46 examined the influence of FDI on carbon emissions in the Brazil, Russia, India, China and South Africa (BRICS) nations from 1993–2012. Eleven organisation for economic co-operation and development (OECD) nations’ bilateral FDI flows were used. Their findings showed that FDI from the European Union helped BRICS countries cut their carbon output.
Trade openness and CO2 emissions nexus
Some studies, such as those conducted by Sun et al., 47 Wang and Zhang 48 and Asongu and Odhiambo, 32 suggest that trade openness and emissions have a positive connection. Udeagha and Ngepah 49 nevertheless reexamined this interaction. As far back as 1960, they looked at data on South Africa's trade openness and environmental quality to project how it would change by 2020. Using a novel dynamic ARDL technique, their research revealed that while reduced trade barriers seemed to benefit the environment at first, they had a detrimental effect over time. Tachie et al. 50 examined the impact of developed nations’ trade liberalization policies, using 18 European Union (EU) economies as their sample. They employed two techniques, the mean group (MG) and the augmented mean group (AMG). Based on their findings, freer trade between EU nations and the other eight countries increased the region’s CO2 output. Similar research was undertaken by Wang and Zhang, 48 who investigated the disparate impacts of trade liberalization on CO2 output across 182 nations from 1990 to 2015. Based on their findings, it seemed that trade liberalization caused a rise in carbon outflow in developing nations. Wenlong et al. 51 explored trade liberalization’s effect on ecological sustainability in ten selected Asian economies. Their research showed how freer commerce might be harmful to the environment. Human resources, trade liberalization, and ecological well-being were all investigated by Haseeb et al.. 52 They examined data from BRICS nations (Russia, Brazil, India, China, and South Africa) between 1998 and 2018. According to their research, which used the Driscoll-Kraay (DK) and Dumitrescu-Hurlin (DH) causality methods, a 1% rise in the trade may result in a CO2 output rise of 0.3731% and 0.2384%. The study by Halliru et al. 53 demonstrated that trade openness negatively impacts environmental performance in low-emission countries based on six West African nations. Utilizing panel quantile regression analysis, the research also refuted the EKC hypothesis in these countries. Wang et al. 54 examined the effects of trade openness and trade diversification on carbon emissions using data from OECD and G20 countries spanning from 1997 to 2019. Their study concluded that increased trade openness correlates with a rise in carbon emissions. Likewise, Wang et al. 55 revealed that trade openness generally leads to an increase in CO2 emissions but the mitigating effect of trade openness on carbon emissions is significant only in countries with weak decoupling after reaching EKC turning points. This conclusion was drawn from an analysis of data from 208 countries over the period from 1990 to 2018, employing the generalized method of moments and fully modified ordinary least squares (FMOLS) methods.
Nevertheless, there are alternative perspectives. Some researchers suggest that trade openness can enhance environmental quality through technology transfer and efficient production processes. 56 Wang and Zhang 48 used data from 182 nations spanning the years 1990–2015 to study the results of free trade in countries with high or medium incomes. According to their research, these countries’ lower carbon emissions were a direct result of greater trade openness. Ahakwa et al. 57 examined the relationship between trade liberalization and environmental sustainability in 89 nations that were part of the Belt and Road Initiative (BRI) between 1990 and 2020. Their research proved that freer trade helped increase ecological stability. According to a study by Opoku Marfo et al., 58 the nation’s CO2 output decreased as its trade openness and female population rose. Trade openness helped reduce CO2 outflow in the short run but raised CO2 outflow over time in sub-Saharan African countries, according to research by Ewane and Ewane. 59 To evaluate the influence of liberalization and the quality of institutions on CO2 output in BRICS nations from 1991 to 2019, Chhabra et al. 60 employed the dynamic common correlated effects (DCCE) method. Findings suggested that trade liberalization results in ecological degradation in these countries. According to Hashim et al., 61 emission trading stands out as a market-based strategy aimed at pollution control, offering economic incentives for emission reduction and striving toward achieving net-zero emissions. This spectrum of findings emphasizes the critical importance of considering contextual and sectoral aspects when evaluating the connection between trade liberalization and CO2 emissions.
Energy consumption and CO2 emissions nexus
The correlation between EU and CO2 emissions is a widely explored topic within environmental economics. The heavy use of fossil fuels in South Africa’s power production places it at the forefront of this discussion. Studies have emphasized the potential for energy-efficient technologies and sustainable power sources to mitigate CO2 outflow, reducing the ecological effect of utilizing energy. Musah et al. 62 analyzed energy use and CO2 outflow in North Africa spanning the years 1990–2018. They used the cross-sectional ARDL (CS-ARDL) and the DCCE mean group (DCCEMG) techniques to find that energy use increased CO2 output throughout the region. Khan et al. 63 discovered, in contrast, that rising economic development and energy use both contribute to higher CO2 output in Pakistan over the long term. Adeleye et al. 64 found that decreasing energy use reduced CO2 outflow. Energy use in Ghana has been shown to increase CO2 output in both the long run and the short run by Li et al.. 65 To drill down even further, Ali et al. 66 examined the correlations among renewable energy use, nonrenewable energy use, CO2 outflow, and GDP expansion in developing Asian nations between 1975 and 2020. By employing a panel AMG estimate strategy, they discovered that whereas NREC led to a long-run sizable rise in CO2 outflow, REC resulted in a sizable decrease. Rasheed et al. 67 analyzed the relationship between nonrenewable and RE consumption, gasoline costs, and CO2 output from 1997 to 2017 using 30 EU economies. By employing FMOLS and the DK methods, they concluded that the use of RE sources decreased CO2 output, whereas nonrenewable energy sources increased it. Li et al. 68 uncovered a correlation between energy intensity measured by energy consumption and increasing carbon emissions in the long run. Their research also confirmed the EKC hypothesis. Li, Li, & Wang 69 found that improved energy efficiency significantly reduced CO2 emissions in the transport sector across 30 Chinese provinces between 2005 and 2019. Wang, Zhang, Li, & Sun 70 assert that trade openness helps reduce environmental pollution by effectively promoting artificial intelligence to achieve carbon emission reductions and facilitate energy transitions. The above opposing perspectives highlight the complex nature of the correlation between energy consumption and CO2 emissions.
Literature gaps and contributions
A comprehensive review of the empirical literature highlights a well-established exploration of the linkages between foreign investment, trade openness, energy consumption, and CO2 emissions. However, there remains a dearth of research focusing on the comprehensive combination of these factors concerning environmental pollution, particularly in the realm of time series analyses, leading to conflicting findings. Consequently, there is a pressing need for further research to enrich the limited discourse on foreign investment, trade openness, energy consumption, and environmental pollution, especially within emerging economies. A noticeable gap exists regarding the absence of studies scrutinizing and contrasting outcomes in South Africa. In light of these identified gaps, this study endeavors to provide valuable policy recommendations. The contributions of this research are outlined across three dimensions. This study marks the pioneering attempt in South Africa to amalgamate foreign investment, trade openness, energy consumption, and environmental pollution into a comprehensive analysis. The study also explores the impact of trade openness on the relationship between foreign investment and environmental pollution. The insights garnered from this investigation hold substantial potential for informing policy formulation aimed at mitigating environmental pollution. Should trade openness demonstrate a favorable influence on both foreign investment and environmental pollution, South Africa stands to gain both economically and environmentally. It is pertinent to note that this study differs from the works of Udeagha and Ngepah 21 and Rafindadi and Usman, 7 which solely focuses on assessing the direct effects of these variables on environmental degradation.
Data, model, and methodology
This section details the model specifications, variables, data sources, and estimation techniques employed in this study.
Data
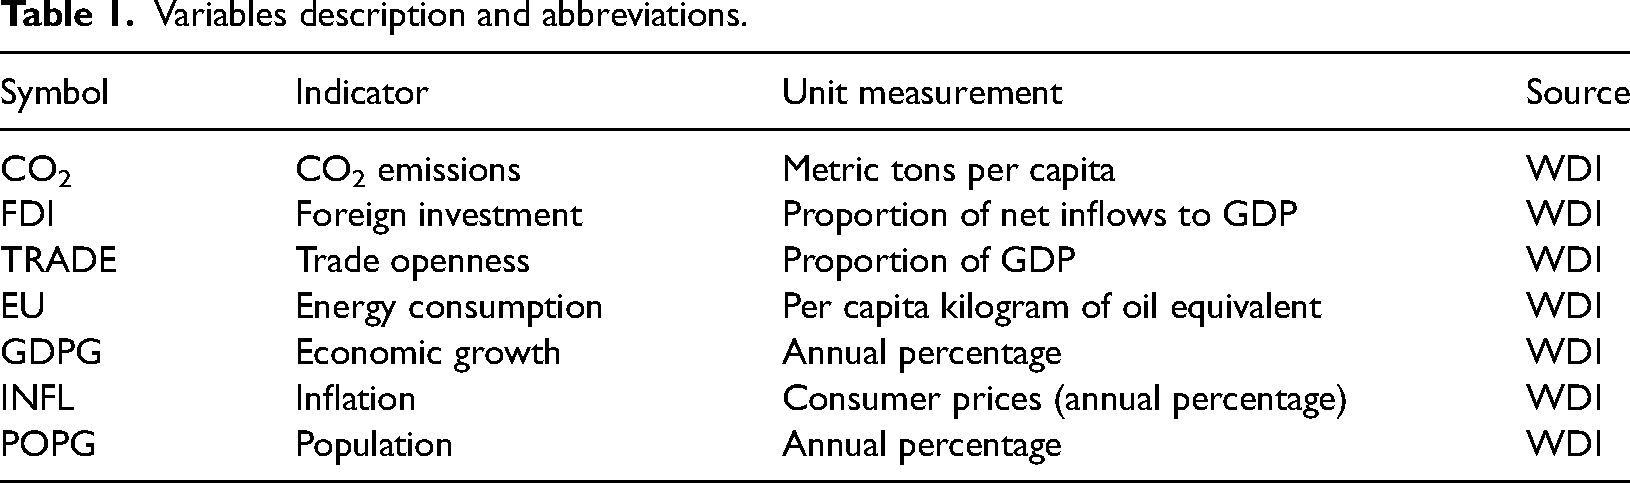
The data presented in the research covers the entire period from 1990 to 2020. The study period was selected based on the availability of data for both dependent and independent variables and also allows for an exploration of significant political, economic, industrial, and policy changes that have occurred in South Africa over the past three decades, providing context for the analysis. The selected variables in this study align with established academic practice and are chosen based on prior literature and theoretical considerations. The dependent variable, carbon dioxide (CO2) emissions, measured as per capita metric tons, is utilized in a manner consistent with Li et al., 65 reflecting its relevance as a key indicator of environmental pollution. FDI is included as an independent variable, measured as net inflows percent of GDP, following the rationale outlined by Apergis et al. 46 and Ekwueme et al. 71 It is expected that FDI will interact with CO2 emissions, potentially influencing environmental outcomes through technology transfer, investment in cleaner production processes, and economic development. Trade openness (TRADE), expressed as a proportion of GDP, is another independent variable considered, drawing from the works of Chhabra et al. 60 and Haseeb et al.. 52 It is anticipated that TRADE may affect CO2 emissions by influencing the volume and nature of trade activities, thereby impacting energy consumption and environmental pollution levels. EU, quantified as kilograms of oil equivalent per capita, is included based on insights from Adeleye et al. 64 and Li et al.. 65 EU is expected to have a direct relationship with CO2 emissions, as higher energy consumption tends to result in increased carbon emissions. Control variables encompass economic growth (GDPG), inflation (INFL), and population (POPG). GDPG, measured as an annual percentage, is included following Ying et al. 72 and Zhang et al., 73 reflecting its potential influence on both economic activity and environmental outcomes. INFL, determined by the annual percentage change in consumer prices, is incorporated based on the works of Sadiq et al. 74 and Zhang et al., 75 considering its impact on economic stability and investment decisions. POPG, measured as an annual percentage of the total population, is included following insights from Cropper and Griffiths, 76 Karim et al., 77 and Shadman et al., 78 recognizing its relevance in demographic dynamics and resource utilization and its impact on the environment. All of the data sources for these variables are derived from the extensive and reputable World Bank’s World Development Indicators (WDI). 79 Table 1 succinctly summarizes these variables and presents their units of measurement for clear reference.
Variables description and abbreviations.
Model
This study aims to examine the connection between foreign investment, trade openness, EU, and CO2 emissions in South Africa. Specifically, CO2 is considered the dependent variable, while foreign investment, trade openness, and EU are considered independent variables. Economic growth, inflation, and population growth constitute the study’s control factors. Based on the theories, increased foreign investment may lead to the adoption of cleaner technologies and environmental standards by firms, reducing CO2 output. Trade openness can affect CO2 output through changes in production methods, transportation, and consumption patterns. Higher energy consumption is typically associated with higher emissions, but improvements in energy efficiency could mitigate this impact. Economic growth can lead to increased industrial activities, potentially raising CO2 outflow. Nevertheless, the environmental Kuznets curve theory suggests that emissions may decrease after a certain level of economic development. Inflation may influence emissions through its impact on economic activities and production, and a higher population may lead to increased demand for resources and energy, potentially impacting CO2 output. It is noteworthy to mention that comparable variable selections can be observed in the research conducted by Li et al..
65
An econometric model for the relationship is expressed as:


Methodology
Establishing long-term equilibrium relationships between variables is a common study goal in the modeling field. Nevertheless, it is imperative to acknowledge that in the immediate period, exogenous disturbances have the potential to displace variables from their long-term equilibrium states. 80 The vector error correction model (VECM) differs from models that only consider long-term equilibrium, as it examines both long-run connections and short-run variances through the use of a correction mechanism. To address concerns related to endogeneity, all variables are treated as endogenous.
Unit root test
To determine if a variable is stable, a unit root test must be conducted. In econometrics, there are several commonly used tests, such as the Dickey-Fuller (DF) test, the augmented Dickey-Fuller (ADF) test, and the Phillips-Perron (PP) test.81,82 Foreign investment, trade openness, energy use, and CO2 outflow are some of the time-varying variables analyzed in this study using the trend-accounting ADF and PP unit root tests. The following regression model forms the basis for the ADF and PP tests:
Lag order determination and cointegration test
Subsequently, a suitable criterion is employed to establish an optimal lag order, after which the number of cointegrations is determined by a cointegration test. Cointegration is a statistical concept that suggests the possibility of achieving stationarity in a time series by combining nonstationary time series linearly. Two commonly used methods for cointegration testing are the Johansen maximum likelihood method and the Engle-Granger cointegration method.
84
This research employs the Johansen cointegration test, a statistical method that not only detects the presence of a cointegration connection but also estimates the precise quantity of cointegration vectors. Engle and Granger
84
have presented a regression formula for cointegration evaluation, which is mathematically written as:
VECM
VECM are created based on previous testing. The Error Correction Model (ECM) was first introduced by Engle and Granger
84
as a complementary approach to the cointegration regression model. The VECM is utilized for two primary reasons: Firstly, the time series data are nonstationary in their original levels but exhibit stationarity in their first-order differences. Secondly, the variables included in the model are found to be cointegrated.
65
VECM is suitable for analyzing nonstationary time series data, allowing for the modeling of long-term relationships among variables that exhibit trends or unit roots.
85
By incorporating cointegration, VECM captures the long-term equilibrium relationships among variables, providing a more comprehensive understanding of the underlying economic dynamics. The inclusion of ECTs ensures that the model accounts for deviations from equilibrium and captures the adjustment process back to long-run equilibrium, enhancing its predictive accuracy.
86
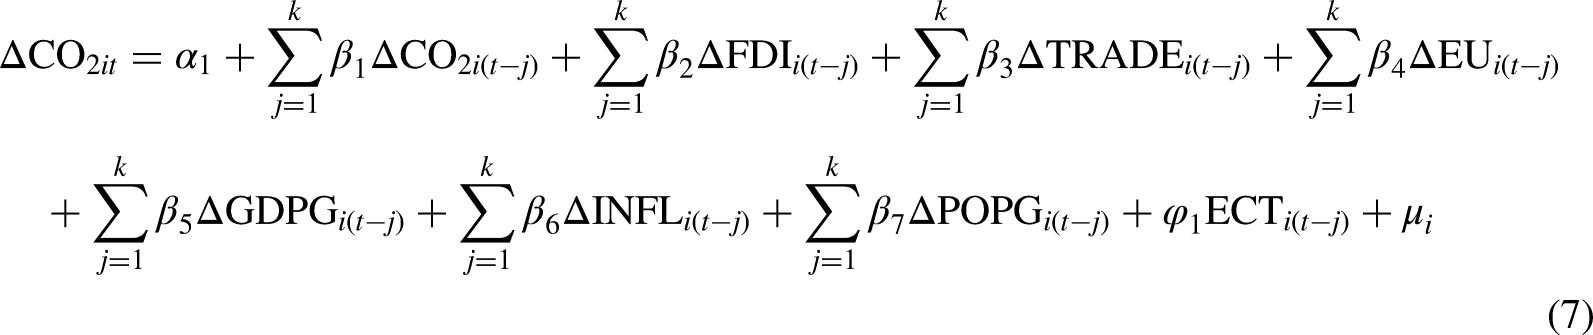
The generic regression equation utilized for estimating the VECM encompasses the following components:

Causality test
This research proceeded to examine causation between the factors, specifically focusing on the relationship between FDI, TRADE, EU, GDPG, INFL, POPG, and CO2. According to Engle and Granger,
84
cointegration occurs when two or more series are integrated of order one (1), signifying the presence of a minimum of one causal connection. To determine causation, both the VEC Granger and the block exogeneity Granger causality tests. One way to use the VECM to find causality is with the Engle-Granger test, which compares the residuals to the variations off the equilibrium parameters. This research used the following formulae to conduct time series Granger causality tests:
Impulse response function (IRF) and variance decomposition (VD)
An IRF estimation can be used to assess the effect of a one-standard-deviation disturbance term on both current and future values of all endogenous variables. VD analysis is conducted to better understand the structural influences leading to shifts in endogenous variables. This study determines the relative significance of individual influences on the endogenous variables of the model. The VECM's thorough analysis can yield benefits in various domains such as foreign investment, trade openness, energy consumption, and CO2 outflow. This all-encompassing approach works exceptionally well for the complex dynamics being examined.
Results and discussion
This section presents the findings of the investigation and delves into a comprehensive discussion of their implications. The findings are organized to provide a clear understanding of the relationships among the variables examined and their implications for theory, policy, and practice.
Descriptive statistics and correlation analysis
Table 2 provides an overview of the summary statistics and correlation analysis for the variables examined in this study. For a more comprehensive view of these indicators in South Africa from 1990 to 2020, Figure 1 illustrates their development and statistical characteristics over time. In Table 2, the mean values for CO2, FDI, TRADE, and EU are 7.11, 1.12, 48.68, and 2586.82. Notably, FDI displays the lowest average among these variables, implying that, on average, South Africa’s FDI is relatively modest compared to other African nations over the study period. The highest and lowest values for FDI, TRADE, and EU are 5.37 and −0.06, 65.98 and 34.32, and 3241.62 and 2121.28. In terms of standard deviation (SD), the figures for CO2, FDI, TRADE, and EU are 0.89, 1.13, 8.17, and 289.07. The correlation matrix in Table 2 elucidates the relationships between these variables. It's evident that some variables exhibit positive correlations while others demonstrate negative ones. Specifically, the dependent variable, CO2, is positively correlated with all variables except INFL and POPG. Contrary, INFL and POPG exhibit negative correlations with all the variables. Figure 1 visually represents these trends over time. CO2 demonstrates fluctuations but generally decreases from 6.25 in 1990 to 6.62 in 2020. FDI also fluctuates but experiences a gradual decline from 0.01 in 1990 to 0.98 in 2020. TRADE shows a gradual increase from 39 in 1990 to 65 in 2008, after which it fluctuates before experiencing a gradual decrease from 2014 to 2020. In contrast, EU depicts a substantial and consistent increase, rising from 2100 in 1992 to 3300 in 2020.
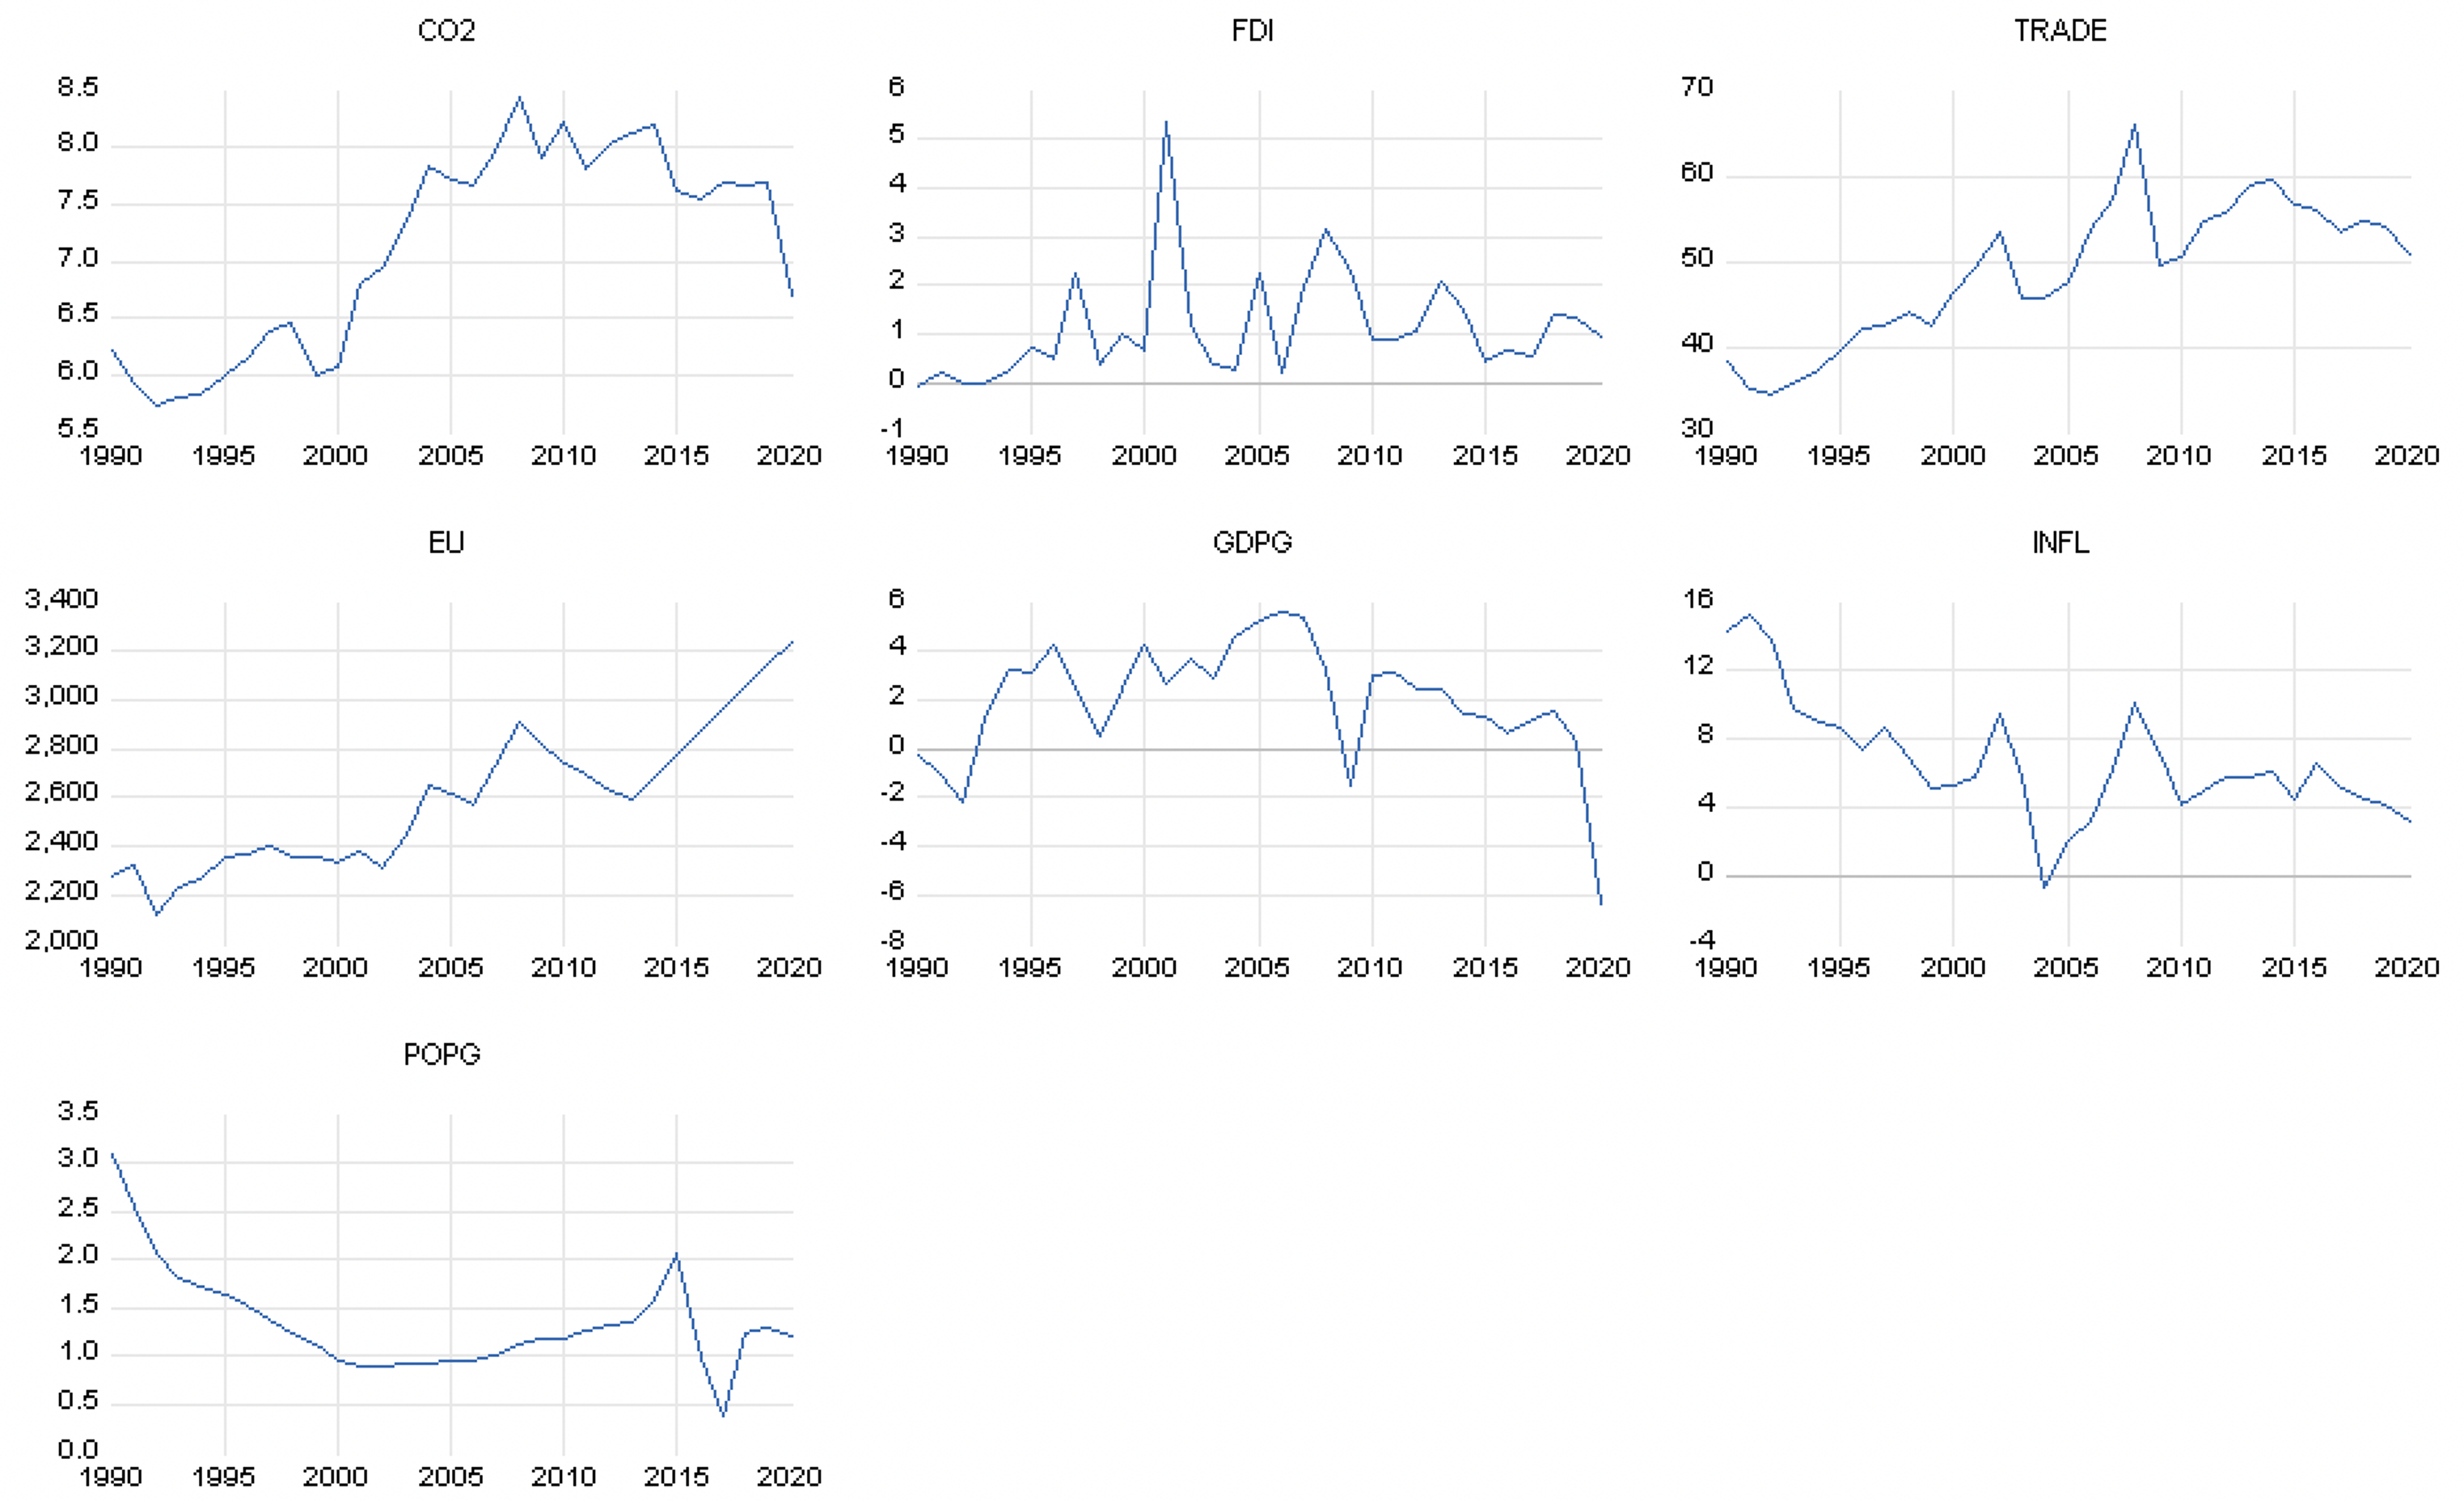
Time-series evolution of variables (1990–2020).
Summary statistics and correlation analysis.

Note: ***, **, and * signifies 1%, 5%, and 10% significance level.
Unit root tests
To ensure that all variables were stationary, unit root tests were conducted. Table 3 displays the outcomes of this analysis. Consistent results were found in both the ADF and PP tests, which took into account the intercept and time trend factors. The vast majority of time series variables, in particular, did not pass the tests at the 10% significance level for level (I [0]). The results demonstrate that, after the first differentiation (I [1]), all variables were stationary. As a result, the first differences of these variables will be used in the study. Subsequently, a cointegration test can be conducted to validate the presence of a long-run connection between the variables. The time series data undergoes further examination utilizing an advanced unit root test, specifically the DF-GLS method, as shown in Table 3. This approach offers distinct advantages as it concurrently addresses autocorrelation and heteroscedasticity, demonstrating superior performance in terms of small-sample size and statistical power compared to the conventional DF test. 87 The findings from this analysis reveal that forest rents, economic growth, natural gas rents, and R&D expenditures exhibit stationarity at the first difference. CO2, FDI, and EU stand out as the sole variables displaying stationarity at the level. The null hypothesis positing stationarity at level (0) for these variables is rejected, prompting acceptance of the alternative hypothesis.
Unit root test results.

Note: *** and ** mean that the null hypothesis was rejected under the statistical significance at 1% and 5% levels.
These unit root tests, however, fail to account for potential structural breaks in the time series, potentially leading to incorrect conclusions when the data exhibit trend stationarity with a structural break. 88 The Zivot and Andrews 83 unit root test is employed in the empirical methodology, as it mitigates unit root bias in the presence of structural breaks. The Zivot and Andrews 83 unit root test results indicate that only foreign investment is stable at the level, i.e., I (0) as shown in Table 4. However, all the other regressors achieve stability after first differencing. The integration order thus necessitates applying cointegration techniques to ascertain the long-term relationships among the regressors.
Zivot-Andrews unit root test results.

Note: *** and ** mean that the null hypothesis was rejected under the statistical significance at 1% and 5% levels.
Johansen cointegration test
The fundamental concept behind the cointegration test lies in establishing a stable, long-term relationship between nonstationary sequences.
89
Before conducting the cointegration test, the lagged differences were calculated. Table 5 displays the outcomes. Except for the AIC criterion, all other criteria (LL, LR, FPE, SC, and HQC) suggested that the variables showed the highest level of significance at the first-order lag. All the variables were assumed to have a first-order lag. After determining the best lag sequence, the data were subjected to cointegration tests to confirm the number of cointegration relations. The findings are summarized in Table 6. The table demonstrates the rejection of the null hypothesis proposing “no cointegration relationship” and the acceptance of the alternative hypothesis. This indicates the existence of at least one cointegration relationship. Both the Trace test and the Max Eigenvalue test indicate the presence of four cointegrating equations with a significance level of 5%. This indicates that a maximum of four variables have a persistent relationship or balance with one another. The null hypothesis suggesting “a maximum of three cointegration relationships” was tested using the Trace statistic, which yielded a value of 44.06439. This number is significantly lower than the critical value of 47.85613 at a 5% significance level. The Max Eigenvalue value was 35.03041, which is noticeably below the 5% critical value of 40.07757 at a 95% confidence level, and the null hypothesis was upheld. To summarize, the outcomes of the Johansen cointegration test conclusively indicate the presence of a stable cointegration relationship among the variables. The equation for long-term cointegration can be formulated as:
Results on VAR lag order selection criteria.

Notes: The endogenous variables are CO2, FDI, TRADE, EU, GDPG, INFL, and POPG; VAR = vector autoregressive; LL = Levin Lin; LR = likelihood ratio; FPE = final prediction error; AIC = Akaike information criterion; SC = Schwarz criterion; HQ = Hannan–Quinn criterion.
Lag order selected by the criterion.
Results on Johansen cointegration test (Lag 1).

Note: * denotes rejection of the null hypothesis at the 0.05 level; ** denotes MacKinnon et al. 90 p-values.
In this equation, FDI, TRADE, EU, INFL, and POPG all exhibit a 1% significance. In equation (8), in the long run, a 1% rise in foreign investment results in a 6.878633% reduction in CO2 output per unit of GDP. Conversely, a 1% rise in TRADE and a 1% increase in EU contribute to 0.455957% and 0.012818% growth in CO2. In essence, these findings reveal a long-run negative equilibrium relationship between CO2 and FDI. This empirical evidence underscores the potential for reducing CO2 output through the infusion of foreign investment, offering valuable support for sustainable environmental practices.
To validate the Johansen cointegration test, the study also utilized the Augmented Engle-Granger test for cointegration to evaluate the long-term cointegration of the variables. 84 The findings indicate that all variables exhibit cointegration and maintain a long-run relationship as shown in Table 7.
Augmented Engle-Granger cointegration test.

Note: ** and * mean that the null hypothesis was rejected under the statistical significance at 5% and 10% levels; Critical values are from MacKinnon. 91
VECM estimates
The VECM estimates presented in both Table 8 are instrumental in assessing the relationships among the variables, both in the long and short term. Based on the insights gained from the VECM estimations, several key observations can be made. The upper section of Table 8 demonstrates that FDI, TRADE, EU, GDPG, INFL, and POPG together explain approximately 57.27% of the variations in CO2 output in the short run. An R2 value of 0.572662 represents this. It is worth mentioning that the statistical tests show a negative and statistically significant ECT (−0.055653) and a significance level of 0.01%. This signifies that deviations from South Africa’s CO2 emission equilibrium will naturally adjust over time, and any disruptions to the system will gradually return to equilibrium, albeit at a relatively low pace of 5%. This relatively slow adjustment rate is of particular significance considering South Africa's substantial reliance on fossil fuel energy. The results illustrate that TRADE and EU both exhibit a significant negative correlation with CO2 in the short run. A 1% rise in EU leads to a 0.001216% reduction in CO2, while a 1% increase in TRADE equates to a 0.057655% CO2 reduction. The negative correlation between trade openness and CO2 may result from South Africa importing cleaner and more energy-efficient technologies and machinery, which can replace older and more carbon-intensive production processes. 92 Participation in international trade often entails compliance with global environmental standards. This can motivate businesses to switch to greener and less carbon-intensive production processes to meet the requirements of export markets. 93 Increased trade openness may encourage industries to adopt more energy-efficient technologies and practices to remain competitive in international markets. Cost reduction is a common goal for businesses, including energy expenses, which can result in lower CO2 output per unit of production.94,95These findings conform with Wang et al., 96 who concluded that importing eco-friendly technologies and utilizing inputs for production that are less energy-intensive is a major way in which trading internationally helps improve the quality of the environment in BRICS countries. Udeagha and Ngepah 21 also found that trade openness decreases CO2 outflow in the short run. Conversely, FDI demonstrates a positive statistical relationship with CO2 output in the short run, indicating that a 1% increase in FDI leads to a 0.220012% rise in CO2 output in the short run. The outcome aligns with the study investigated by Chidiebere-Mark et al., 97 which showed that FDI promotes CO2 output in the short run. Notably, there exists a significant positive relationship between INFL and POPG.
VECM results.

Note: ***, **, and * denote significance levels of 1%, 5%, and 10%.
Looking at the middle section of Table 8, it's apparent that foreign investment (FDI) demonstrates a negative relationship with CO2 emissions, while trade openness and energy consumption exhibit a long-run positive relationship with CO2 output. To be precise, a 1% increase in FDI leads to a 6.878633% decrease in CO2 outflow. Foreign investment may introduce cutting-edge technologies and optimal methodologies that lead to more efficient and cleaner production processes. Multinational corporations, often major sources of FDI, may implement technologies that reduce emissions as part of their global sustainability initiatives. 98 Foreign investment in the energy sector, particularly in renewable energy projects, can contribute to a reduction in CO2 emissions. Investments in wind, solar, and other clean energy sources can help South Africa transition to a lower-carbon energy mix, thereby reducing its overall emissions. Host countries often impose stringent environmental regulations on foreign investors, which can encourage them to adopt cleaner technologies and processes. Complying with these regulations can lead to lower emissions intensity in the long term. 99 If FDI leads to energy efficiency improvements, the carbon intensity of the energy source can offset these gains. The result conforms with a study by Lin et al., 36 which identified FDI's contribution to emission reduction in China. Mahmood 100 also revealed that FDI has negative direct and spillover effects on CO2 outflow.
Conversely, a 1% rise in TRADE is linked to a 0.455957% CO2 reduction, and a 1% rise in EU is connected to a 0.012818% rise in CO2 output. This confirms what Li and Haneklaus 101 found: that G7 nations’ CO2 output rises as trade opens up. Also, Kongkuah et al. 102 discovered a considerable increase in China’s CO2 output due to trade. Ozatac et al. 103 also found that trade and energy consumption increase carbon emissions in Turkey. Boateng et al. 104 revealed in their study that FDI reduces carbon emissions among 182 countries globally, however, institutions must regulate the activities of foreign investors in both low- and high-income nations. Trade openness can lead to an expansion of industries that are energy-intensive or reliant on fossil fuels. Increased trade may result in more production, transportation, and overall energy consumption, leading to higher emissions. 21 Exporting goods or commodities that are energy-intensive or carbon-intensive can drive up CO2 outflow. 105 South Africa's significant dependence on coal for energy production is likely to contribute to elevated levels of CO2 output. Higher emissions can result from a coal-dominated energy mix.49,106
It is worth noting that economic growth exhibits a significant negative relationship, at a 1% significance level, with CO2 emissions. This finding is in agreement with Li et al. 65 and goes against the conclusions drawn by Sikder et al., 107 who concluded that emerging nations’ GDP growth is the primary factor affecting CO2 outflow. GDP increases environmental pollution in the short run and reduces environmental pollution in the long run which confirms the existence EKC theory. Gokmenoglu and Sadeghieh 108 concluded in their study that economic growth significantly reduces environmental degradation in Turkey in the long run. Ozatac et al. 103 confirmed the EKC hypothesis for Turkey from 1960 to 2013, taking into account variables such as energy consumption, trade, urbanization, and financial development. Aydin et al. 109 investigated the validity of the EKC hypothesis for the G7 countries. The findings revealed that while the EKC hypothesis holds for Canada, France, the USA, and the overall panel of G7 nations, it does not hold for Germany, Italy, Japan, and the UK. These outcomes collectively highlight the complex relationship between foreign investment, trade, EU, and CO2 outflow in South Africa. The long-run negative connection between FDI and CO2 implies that proactive environmental regulations, sustainable energy investments, and technological advancements within the FDI sector can lead to environmental benefits. The positive associations between TRADE, EU, and emissions underscore the need for strategies to balance economic growth with sustainability, particularly in trade and energy sectors.
In the second model, the study examines how the relationship between FDI and CO2 emissions is influenced by trade openness, considering that increased trade boosts foreign investment in South Africa. The research investigates whether greater trade amplifies or diminishes the impact of FDI on CO2 emissions, as described in Equation (3). The results are presented in an interactive model. The regression shows positive coefficients for both foreign investment and trade openness, though their impacts vary in magnitude. Holding all other factors constant, a 1% increase in FDI and trade leads to a short-term rise in CO2 emissions by 1.25% and 0.04% at a 10% significance level. Interestingly, an increase in the FDI and trade coefficients predicts a decrease in CO2 emissions in the long run at a 1% significance level. Increased FDI typically brings more industrial activities, which often result in higher energy consumption and emissions. 110 Greater trade openness can boost economic activity and industrial output, leading to higher CO2 emissions. 21 This short-term increase is consistent with the idea that economic growth and industrial expansion initially lead to higher environmental degradation. In the long term, FDI might introduce more advanced and cleaner technologies, improve energy efficiency, and enhance environmental regulations and practices. This technological spillover can mitigate the initial negative environmental impacts, leading to reduced CO2 emissions over time. The study finds negative significant coefficients (−0.0228539 and −0.0027398) for the interaction terms when assessing the moderating effect of trade openness on the FDI-CO2 emissions relationship in the short and long run. The analysis concludes that while increased trade raises CO2 emissions, higher FDI combined with trade openness has a mitigating effect on CO2 emissions, given the negative impact of FDI and the negative coefficient of the interaction term. The interaction term suggests that while trade alone may increase CO2 emissions, its combination with FDI results in a mitigating effect. This can be understood as trade openness facilitating the transfer and adoption of environmentally friendly technologies and practices associated with FDI. When foreign investors bring in advanced technologies and practices, and these are complemented by an open trade environment, the overall impact on CO2 emissions can be reduced.
The research incorporates various diagnostic tests at the bottom part of Table 8, and the test outcomes unequivocally demonstrate the absence of serial correlation within the model. There is no indication of heteroscedasticity, affirming the model's soundness. Figure 2 verifies that the VECM model's stability criterion is met. The eigenvalues of the adjoint matrix are all located within the unit circle, except for one unit root assigned by the VECM. This indicates the model's stability, allowing the study to advance to an impulse response analysis. Figure 3 summarizes the outcomes derived from the long-run linear and interactive VECM results.
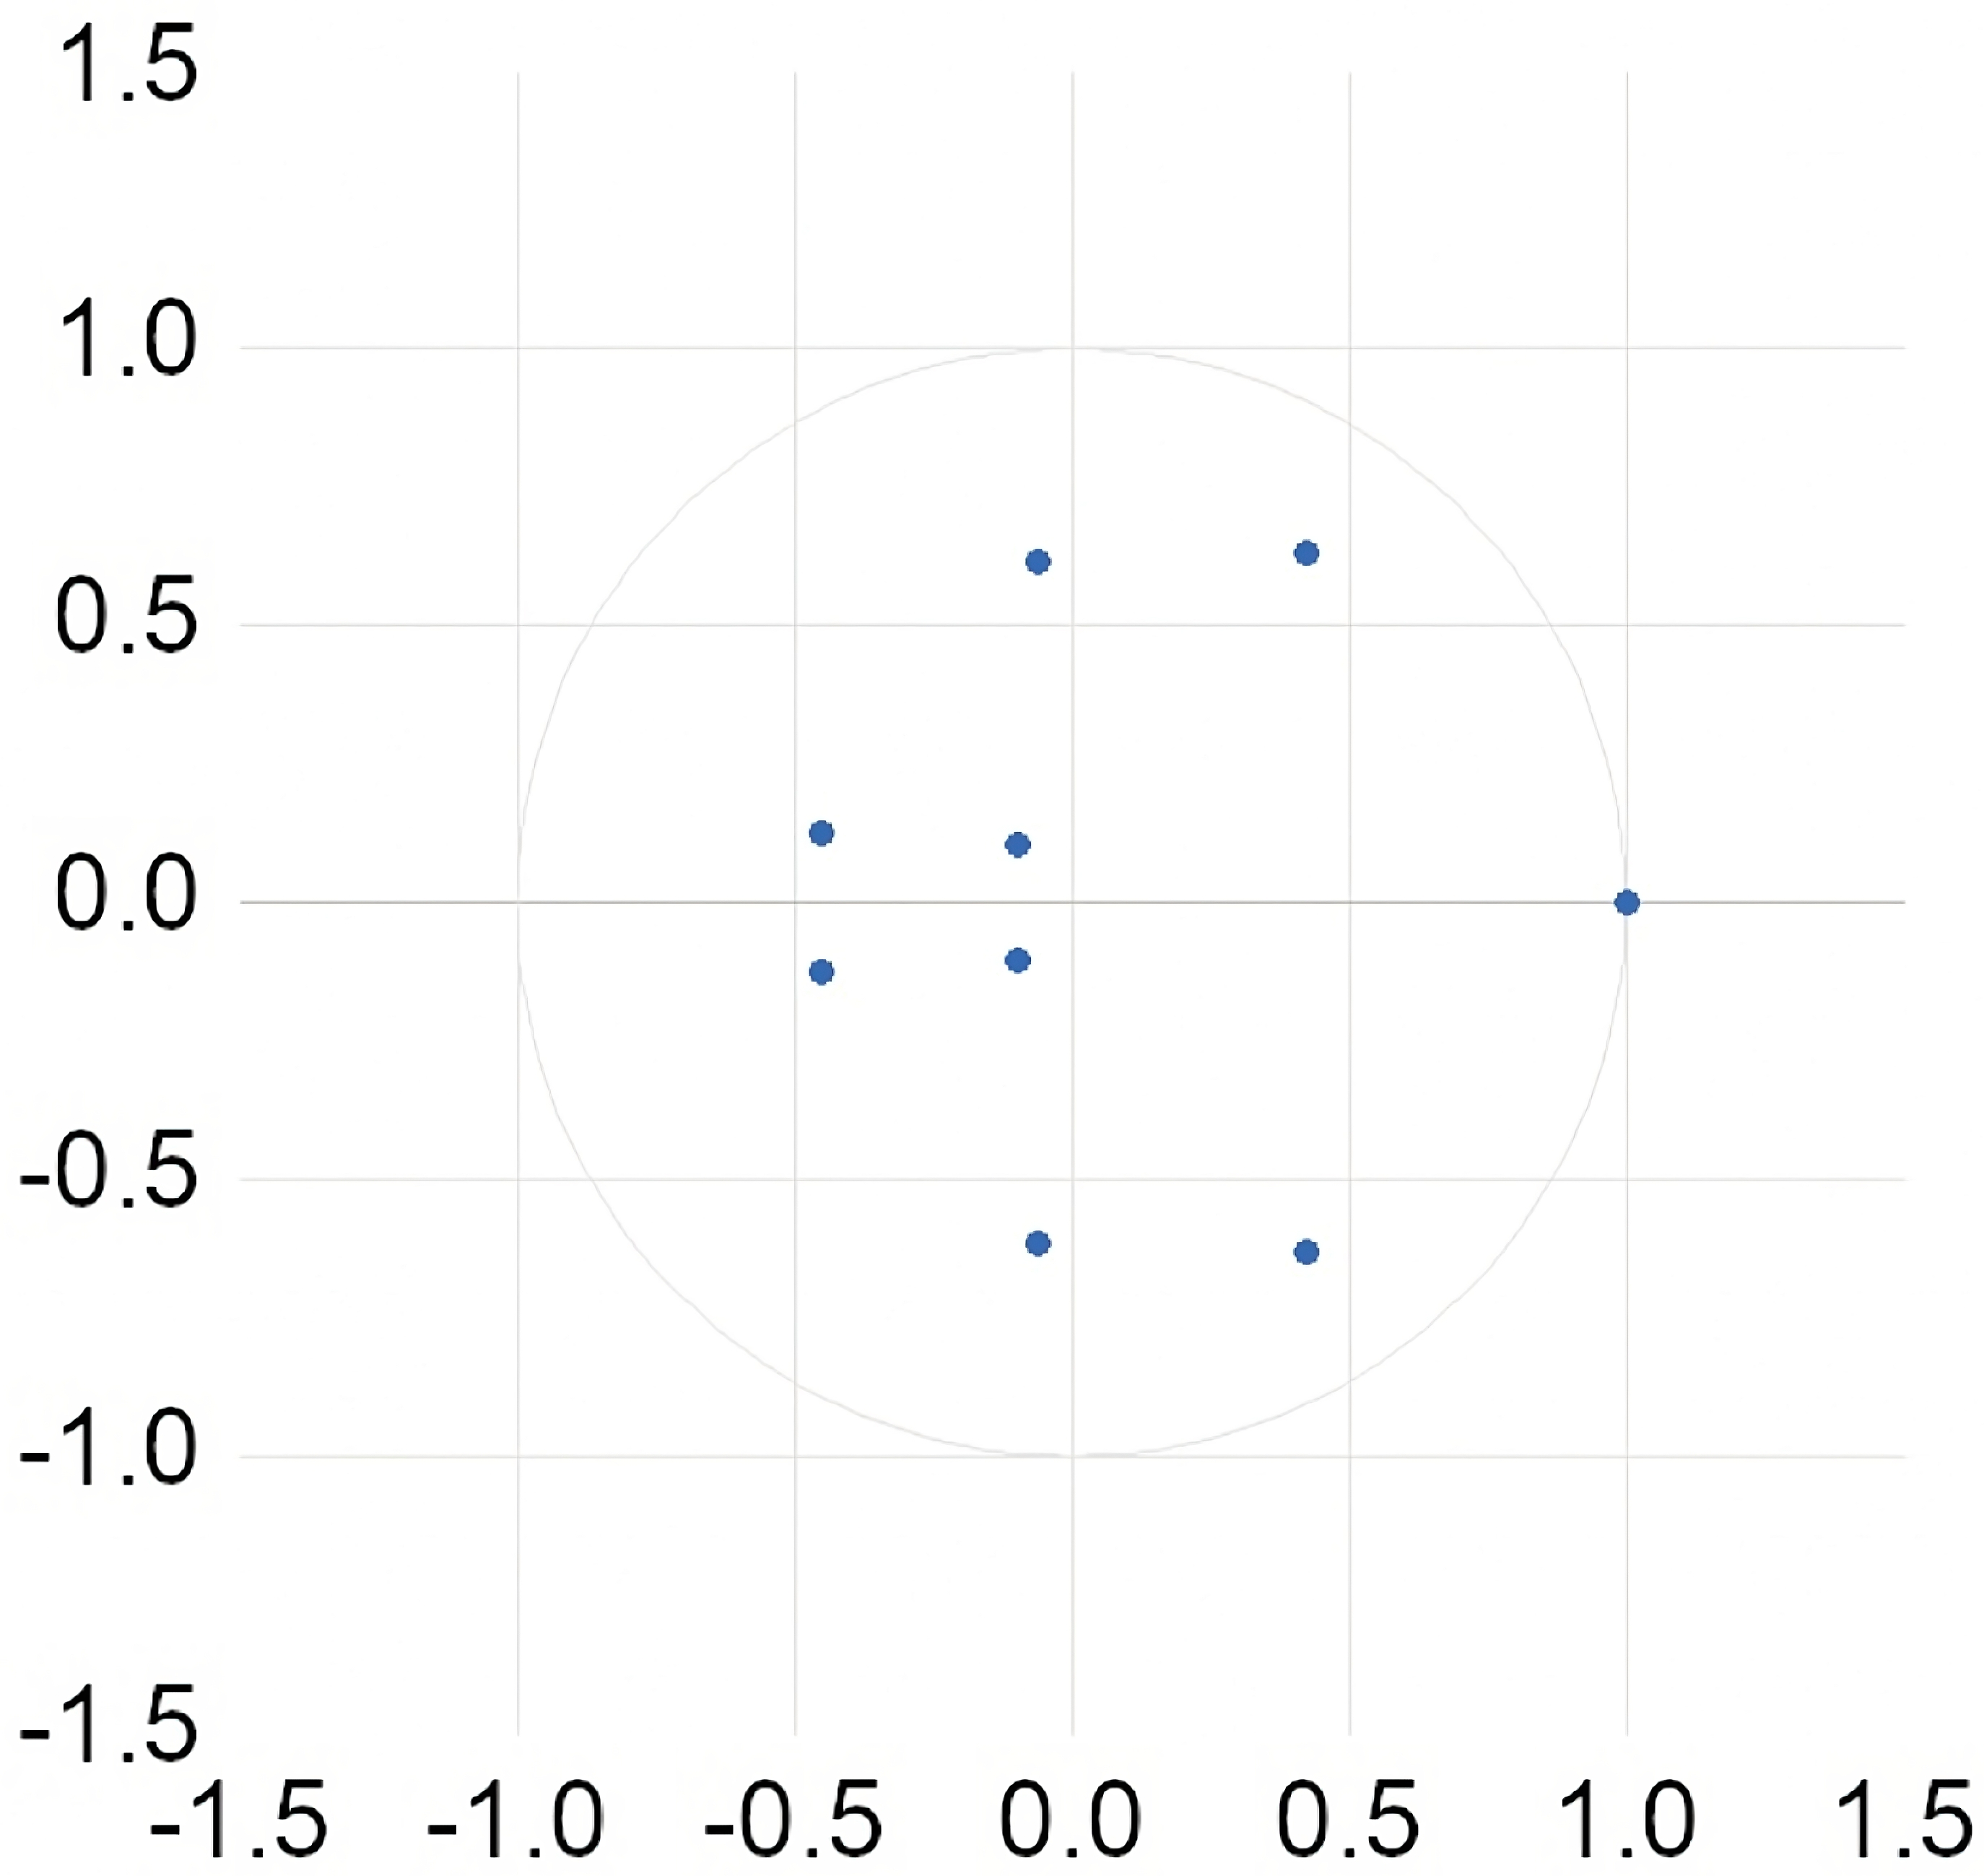
Stability diagram of the VECM.

Summary of the VECM results.
IRF analysis
To ensure the reliability of the results, the study reordered the four main variables, enhancing the robustness of both the IRF and VD analyses. The analysis was conducted over ten phases, which, considering that the variable was measured annually, equates to a decade. The IRF was explored within the variable sequence: CO2, FDI, TRADE, and EU. According to Figure 4, the first row illustrates the impact of FDI, TRADE, and EU on CO2. Notably, FDI exerts a negative effect on CO2, peaking at Phase 3. This finding emphasizes the substantial role FDI played in the long-term reduction of CO2 output. This finding aligns with the notion that FDI may bring in cleaner technologies, promote energy efficiency, and enhance environmental regulations, leading to lower carbon emissions in the host country. 111 The fact that CO2 has a positive effect on itself suggests that inertia, to some extent, influences CO2 levels primarily through historical values. The positive effect of CO2 on itself indicates inertia in CO2 levels, implying that historical CO2 emissions influence current emissions to some extent. As for the impact of the EU on CO2, it appears to be relatively small.

Impulse response relationships between CO2 FDI, TRADE, and EU.
The second row delves into the influence of a one-unit deviation in FDI, CO2, TRADE, and EU on FDI. Here, the study continues to observe a negative effect of FDI. This effect is positive in the first year but turns negative from the second year onwards, suggesting that CO2 emissions influence foreign investment in South Africa. This suggests that CO2 emissions may initially attract foreign investment due to lower environmental standards or cheaper energy sources but could deter investment in the long run due to concerns about environmental sustainability. Interestingly, TRADE exerts a significant influence on the pulse of FDI. In contrast, the EU's effect on FDI is rather minor. This points to persistent energy production and consumption insufficiency in South Africa, necessitating accelerated changes in the energy structure. The self-effect of FDI remains positive. The significant influence of trade openness on FDI suggests the importance of market access and economic integration in attracting foreign investment, while the minor effect of EU highlights the need for South Africa to address energy inefficiency and transition to cleaner sources.
Moving on to the third row, the study explores the effect of a one-unit SD of FDI, CO2, TRADE, and EU on TRADE. The results reveal that fluctuations in CO2 and FDI have both positive and negative effects on TRADE, while the EU negatively influences TRADE. It is worth noting that TRADE exhibits a positive self-effect, although this effect is notably weaker than that of the other variables. The negative influence of the EU on TRADE underscores the challenges posed by energy inefficiency and the need for structural reforms in the energy sector to support sustainable trade growth.
In the fourth row, the study investigates the influence of a one-unit SD of FDI, CO2, TRADE, and EU on the EU. Here, it becomes evident that CO2 and TRADE both have a positive impulse influence on the EU, rising from the first year and declining from the third year onwards. Conversely, FDI negatively affects the EU, with a consistent effect from year two until year ten. The self-effect of the EU remains positive. The effect of CO2 emissions and TRADE on EU highlights the feedback loop between environmental pollution, economic activities, and energy consumption patterns. While CO2 emissions and TRADE positively influence EU in the short term, the negative effect of FDI on EU suggests the importance of promoting energy efficiency and transitioning to cleaner energy sources to mitigate environmental impacts and enhance energy security. 112 This analysis sheds light on the complex relationship of these variables and their effects over time.
VD
The VD process aligns with the order and lag used in the impulse response analysis. In Figure 5, the study presents the VD results for CO2, FDI, EU, and TRADE. These findings provide valuable insights into how these variables contribute to their variances and those of others. Table 9, on the other hand, offers a comprehensive view of the contribution of each variable to the total variance over the first to tenth years of the analysis. Notably, it can be observed that all four variables have a considerable impact on their variance. To assess the relative significance of each variable, the study employs a method that dissects the predicted error variance for every variable into parts that are associated with every part of the system. The study's focus is primarily on the variables of interest: CO2, FDI, EU, and TRADE. The outcomes reveal the extent to which these variables contribute to the overall variance at the tenth period. For CO2, the variance is primarily explained by the variable itself, accounting for approximately 52.95% of the total variance. The dominance of CO2 in explaining its variance, suggests that internal factors, such as local policies, industrial activities, and energy consumption patterns, primarily drive carbon emissions in South Africa.
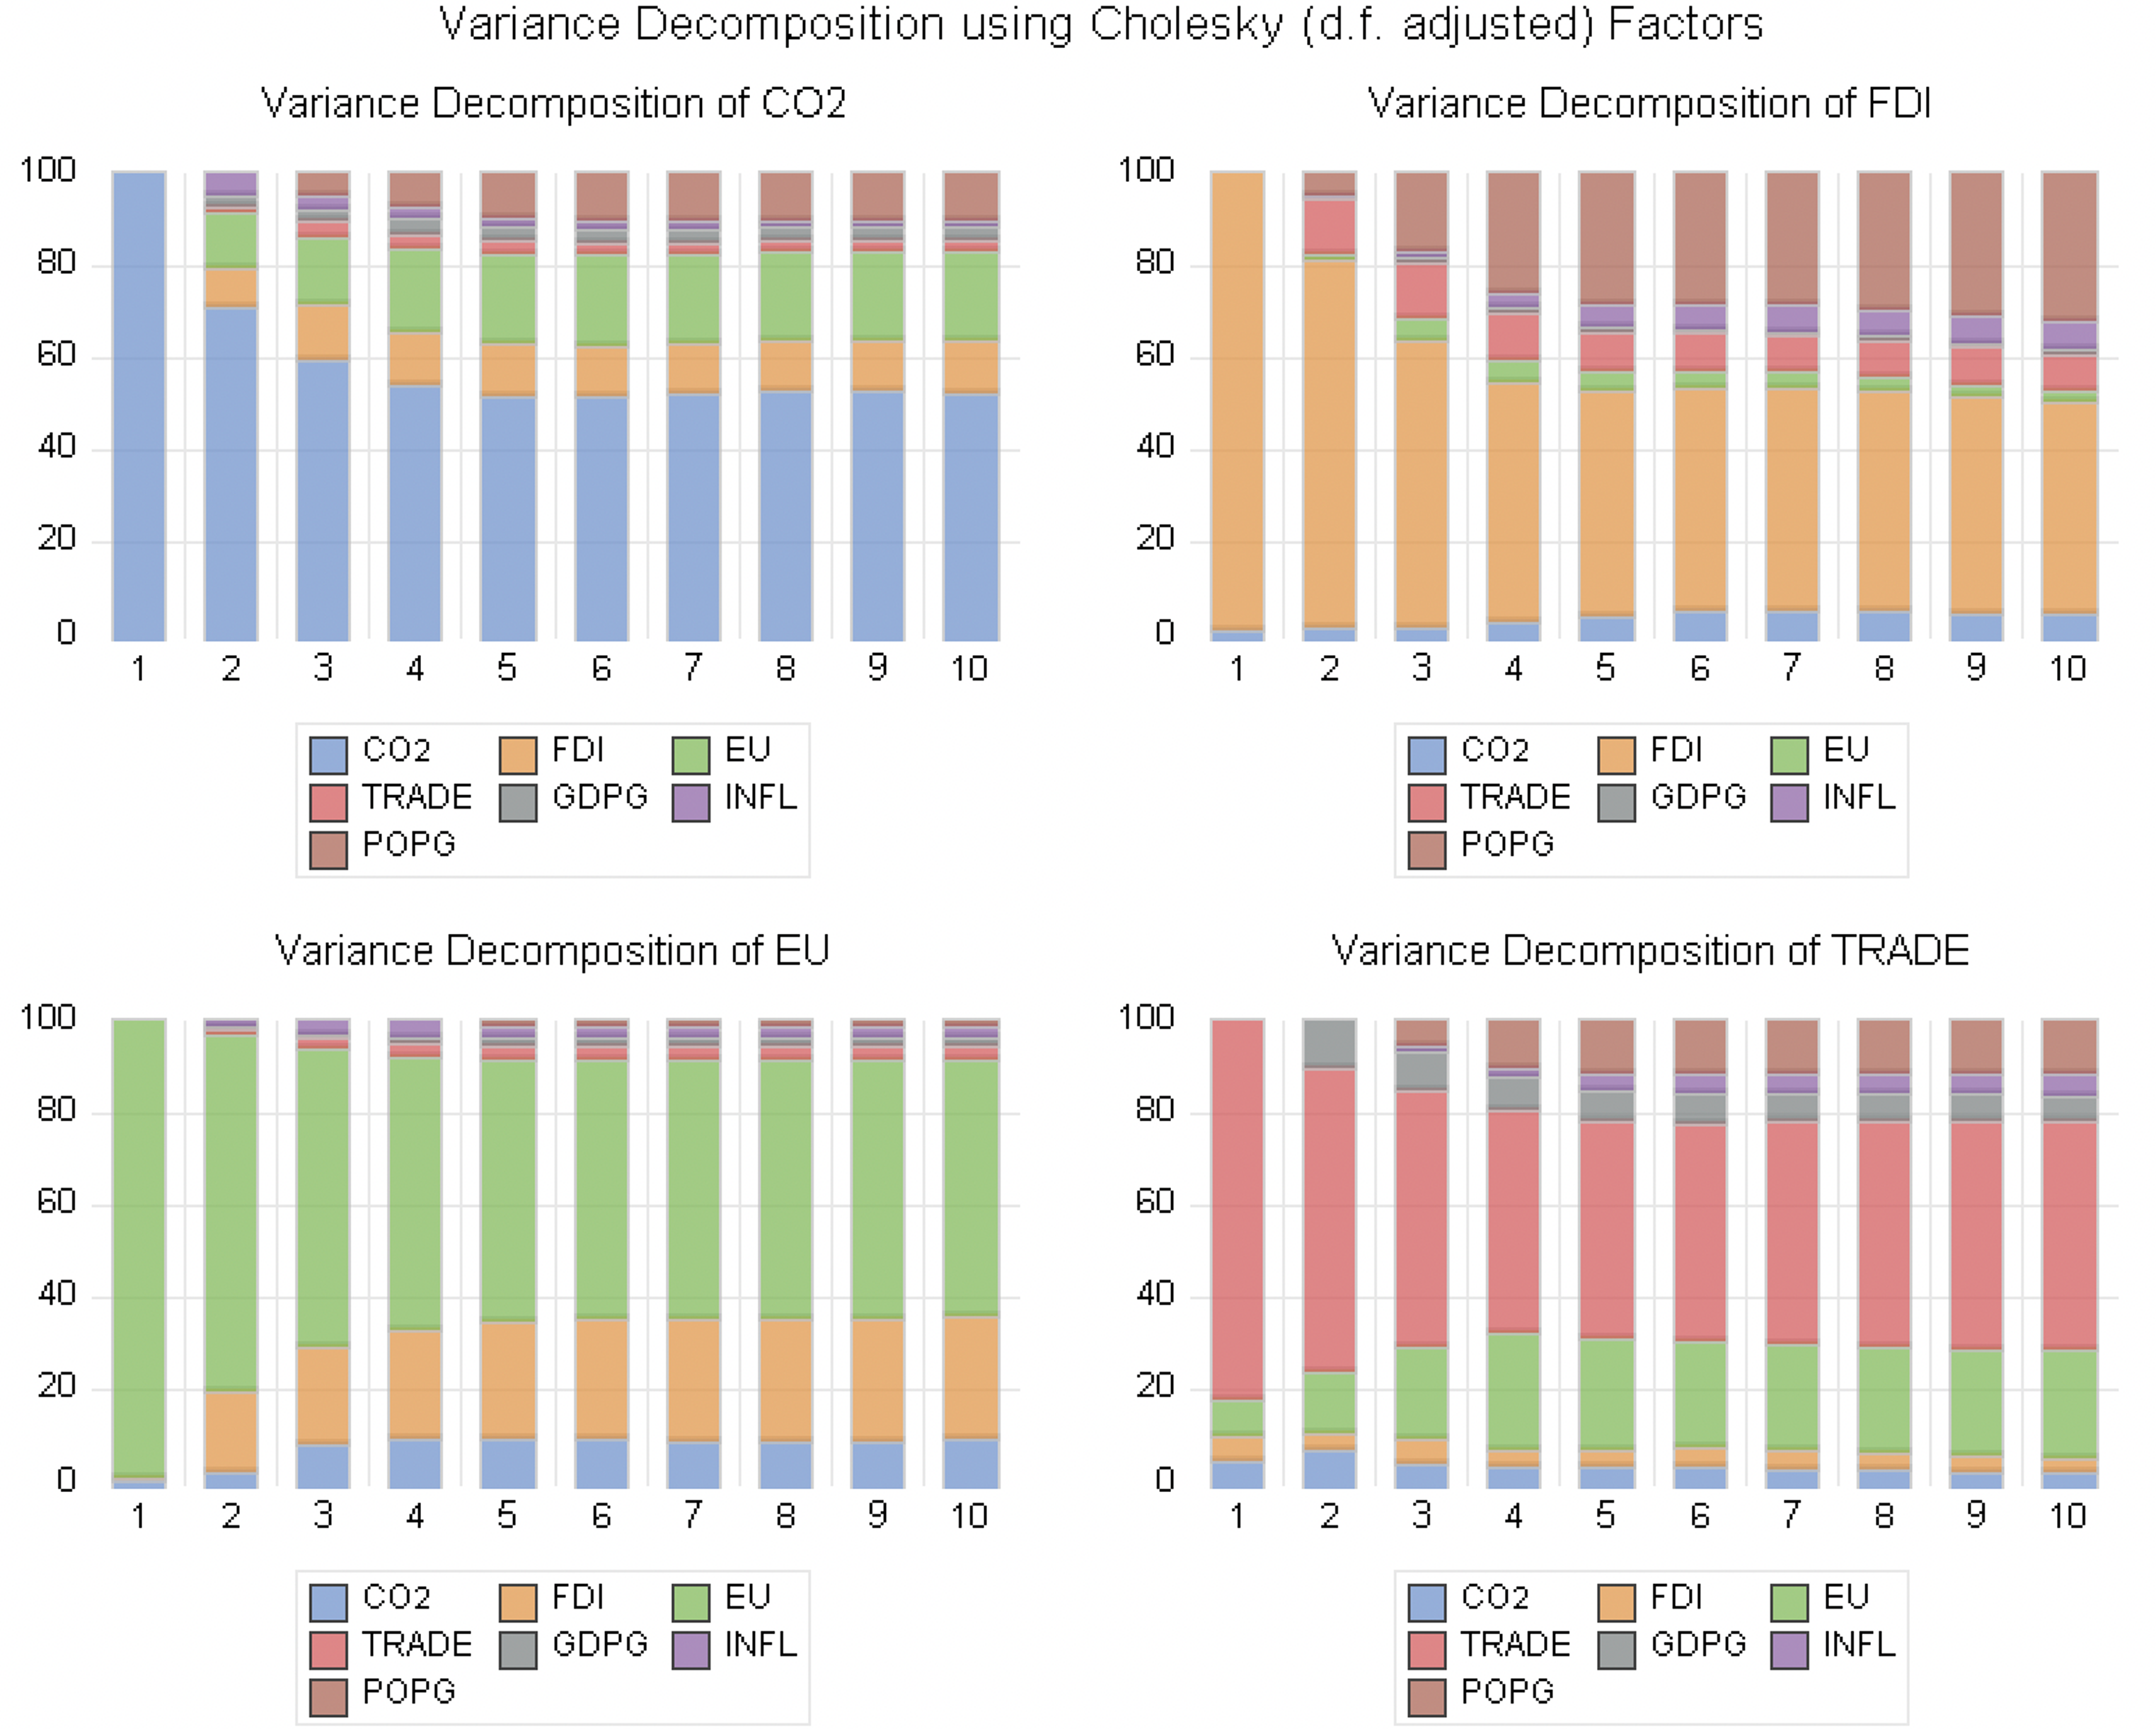
Variance decomposition of CO2, FDI, EU, and TRADE.
Variance decomposition of CO2, FDI, EU, and TRADE.
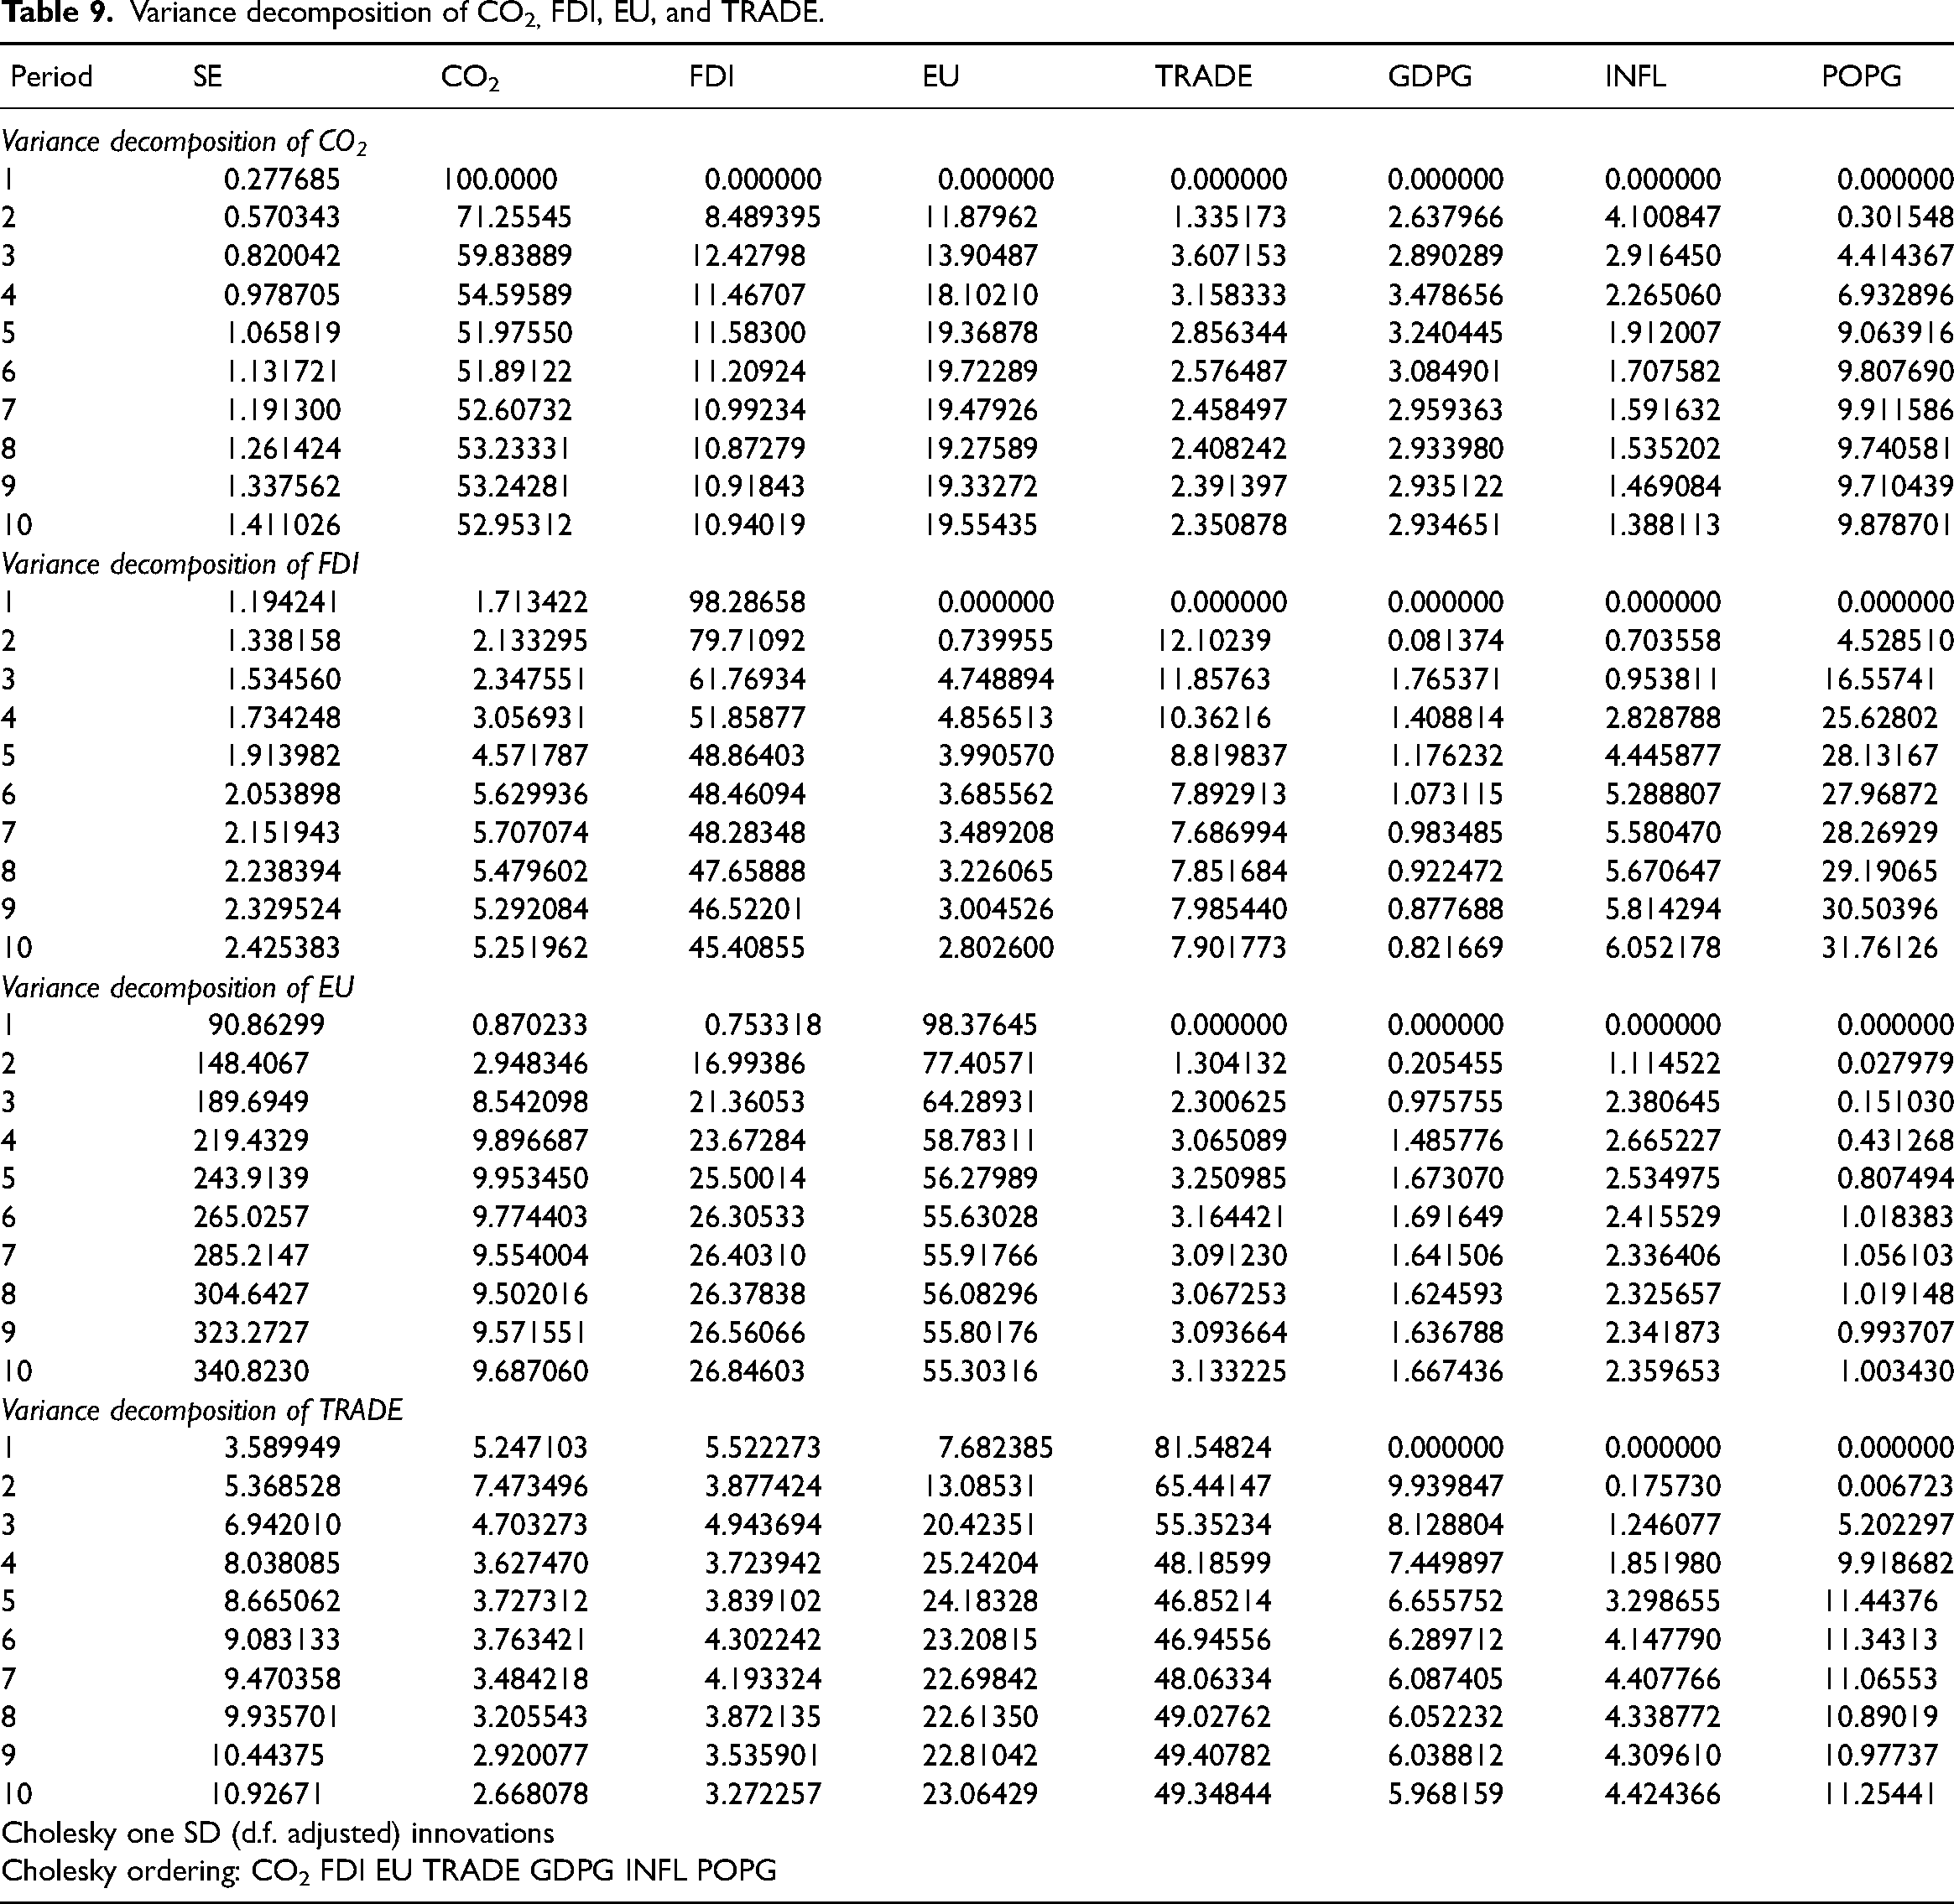
As for FDI, it contributes to roughly 10.94% of its variance, while EU and TRADE explain approximately 19.55% and 2.35% of their respective variances in CO2. Foreign investment, while contributing to its variance by approximately also influences CO2 emissions to some extent, reflecting the potential impact of international capital flows on environmental outcomes. This suggests that FDI may play a role in shaping South Africa's environmental policies, technological advancements, and industrial structure, thereby affecting CO2 emissions. EU and trade openness also exhibit significant contributions to their variances, reflecting their importance in the South African context. EU, accounting for approximately 19.55% of its variance in CO2, highlights the critical role of energy consumption patterns in driving environmental pollution. Meanwhile, TRADE's impact on CO2 emissions, albeit relatively smaller at around 2.35%, underscores the linkages between international trade dynamics and environmental outcomes, suggesting the potential influence of trade policies and market integration on CO2 emissions.
When attention is turned to FDI, it can be found that CO2, FDI, EU, and TRADE elucidate approximately 14.7%, 5.25%, 45.41%, 2.80%, and 7.90% of the variance in the tenth period. Similarly, the study found that EU, CO2, FDI, EU, and TRADE account for approximately 9.50%, 26.38%, 56.08%, and 3.07% of the variation in the EU during the tenth period. Lastly, focusing on TRADE, it was noted that CO2, FDI, EU, and TRADE are responsible for explaining about 2.67%, 3.27%, 23.06%, and 49.35% of the total variance in TRADE at the tenth period. The cross-variable impacts revealed through the VD further emphasize the interconnectedness of these factors. For instance, FDI, EU, and TRADE collectively account for a considerable portion of CO2 variance, indicating the complex interactions among foreign investment, energy consumption, and trade activities in shaping environmental outcomes. These results underscore the dynamic relationship among these variables and their contributions to the changes observed over time.
Granger causality analysis
An effective method for investigating potential causal correlations between economic variables is the Granger causality test. Table 10 clearly summarizes the results of the block exogeneity Granger causality test. There was a resounding rejection of the null hypothesis, which states that the variables are not causally related, in this analysis. This outcome underscores the presence of causal associations, with the influence generally flowing from independent variables to dependent ones. Of particular note, the study identified bidirectional causality between D(CO2) and D(POPG) at levels of significance of 1% and 5%. This could be attributed to population growth driving increased energy consumption and industrial activities, thereby contributing to higher carbon emissions, while environmental degradation, in turn, may affect public health and demographic patterns. A unidirectional causal link is detected from D(FDI), D(TRADE), D(EU), D(INFL), and D(POPG) to D(CO2) (D(FDI), D(TRADE), D(EU), D(INFL), D(POPG) → D(CO2). Similarly, a unidirectional causal influence runs from D(FDI) and D(EU) to D(TRADE) (D(FDI), D(EU) → D(TRADE). Causality is observed from D(EU) and D(INFL) to D(GDPG) (D(EU), D(INFL) → D(GDPG), and from D(TRADE) to D(INFL) (D(TRADE) → D(INFL). This implies that these factors play a role in shaping environmental pollution levels in South Africa. For instance, higher levels of FDI and trade openness may lead to increased industrialization and economic activities, resulting in higher carbon emissions. 113 Similarly, changes in EU and population growth can impact carbon emissions through their influence on energy demand and economic activity. In summary, the Granger causality analysis reveals an intriguing network of causal relationships, marked by bidirectional causality from CO2 to POPG, while other associations remain unidirectional. These findings conform to outcomes of previous research studies. For instance, Wang et al. 114 found that CO2 emissions affected FDI in western and central China, but that there was only a one-way causal relationship between CO2 emissions and trade in eastern China. Similarly, Mitić et al. 115 reported a one-way causality between energy and GDP, suggesting that energy availability affects economic performance. Khobai and Le Roux 116 unveiled unidirectional causal connections within a multifaceted network. Specifically, these researchers found that carbon dioxide emissions, economic growth, and TRADE influenced energy use. Simultaneously, EU, CO2 output, and TRADE exerted their influence on GDP.
VEC granger causality/block exogeneity Wald tests results.

Note: ***, **, and * represent null hypothesis was rejected at 1%, 5%, and 10%; chi-square statistics (p-value).
Robustness analysis
To enhance the robustness of the study's findings, as presented in Table 8, we employed a supplementary estimation method. To be precise, given that the variables are cointegrated, we used a FMOLS technique, and Table 11 shows the results. FMOLS introduced by Phillips, 117 stands out for its resilience against diverse forms of nonstationarity and autocorrelation within the dataset. By addressing serial correlation and heteroscedasticity, it offers precise parameter estimates, rendering it applicable across a broad spectrum of time series analyses. Notably, FMOLS possesses the capability to accommodate both I (0) (stationary) and I (1) (integrated of order 1) variables within the regression model, thereby making it well-suited for the examination of different categories of time series data. 118 It is noteworthy that the FMOLS results closely align with the long-run results shown by the VECM estimation detailed in Table 8. The FMOLS results reaffirm the study’s key assertions, underscoring the substantial negative effect of foreign investment on CO2 outflow in the long run. Simultaneously, they confirm the substantial positive effect of TRADE and the EU on CO2 output in the long term. The interaction between foreign investment and trade also has a reducing effect on environmental pollution, confirming the main VECM regression outcomes. This congruence between the long-run VECM and FMOLS results reinforces the reliability and robustness of the study’s conclusions.
FMOLS—robustness checks results.

Note: ***, **, and * denote significance levels of 1%, 5%, and 10%.
Conclusions, policy implications, and future research directions
Conclusion
This research contributes to the existing body of knowledge by providing comprehensive insights into the impacts of foreign investment, trade openness, energy consumption, and the interactive effects of FDI and trade openness on environmental pollution within the context of South Africa. The study employed data spanning from 1990 to 2020, and its objectives were accomplished by employing cointegration, VECM, and causality test analyses. The results showed a statistically significant long-term relationship among the variables being examined, as shown by the outcomes of the cointegration tests. The results obtained from the cointegration analyses confirm that foreign investment, trade openness, EU, and CO2 outflow are inherently interconnected in the long term. It was also shown that any deviations from the balance of CO2 emissions in South Africa will automatically self-correct, although at a rather slow rate, due to South Africa's significant dependence on fossil fuel energy use. The analysis revealed a significant short-term correlation, indicating that trade openness and energy use harm CO2 output. There was a negative correlation between foreign investment and carbon dioxide emissions, which remained consistent over the long run. The prospective consequences for South Africa are encouraging, as increased foreign investment can result in a decrease in CO2 outflow. The interactive analysis revealed that trade interacts with foreign investment to reduce environmental pollution in the short and long run. The Granger causality test results provide a full depiction of causation within the analyzed series. Significantly, they revealed a reciprocal cause-and-effect relationship, notably linking population growth with CO2 emissions. There was a noticeable unidirectional causal connection among the remaining variables (FDI, TRADE, EU, INFL, POPG → CO2), (FDI, EU → TRADE), (EU, INFL → GDPG), and (TRADE → INFL).
Policy implications
Drawing from empirical findings, a set of policy recommendations emerges, grounded in the complex dynamics among foreign investment, trade, energy, and CO2 emissions within the context of South Africa. The first policy consideration entails promoting sustainable FDI. Encourage environmentally responsible FDI by providing incentives for investments in green technology and sustainable energy. Offer financial rewards and tax benefits to attract FDI that contributes to reducing carbon emissions. Emphasize the long-term benefits of FDI in fostering sustainable development and mitigating CO2 emissions. The second policy implication is about balancing trade and environmental goals. Implement initiatives that prioritize environmentally friendly trade methods while fostering economic growth. Encourage the adoption of greener technology and more efficient modes of transportation in trade activities. Ensure that trade policies align with environmental objectives to mitigate the negative impact of trade on energy use and CO2 emissions. The third policy implication involves investing in energy efficiency and transition. Prioritize energy efficiency and transition to cleaner energy sources through targeted policies and incentives. Promote energy conservation measures and support the development and adoption of sustainable energy technologies. Reduce dependence on nonrenewable energy sources by encouraging investments in renewable energy infrastructure and research. The fourth policy implication entails promoting environmentally friendly trade practices. Develop policies that encourage trade practices aimed at reducing CO2 emissions. Promote the utilization of environmentally sustainable technologies and energy-efficient processes in international trade. Provide support and incentives for businesses to adopt eco-friendly trade practices and reduce their carbon footprint. The fifth policy implication is about monitoring and regulating FDI for sustainability. Strengthen monitoring and regulation of FDI to ensure alignment with sustainability goals. Conduct rigorous environmental impact assessments and impose conditions for FDI approvals to mitigate negative environmental impacts. Enhance regulatory frameworks to promote transparency and accountability in FDI projects, fostering a more sustainable approach to foreign investment.
Limitations and future research directions
There are several promising areas for future research. (1) Expanding the study to include regional or continental levels would offer significant insights into the broader influence of these four variables on the African continent. Regional divisions can be fascinating, as they have the potential to unveil variances and subtleties in the interactions between these variables throughout different regions of the continent. (2) To further explore the dynamic interaction of these variables, it is recommended to utilize advanced analytical techniques and tools including machine learning algorithms. Implementing threshold models can assist in identifying crucial turning points or thresholds within these interactions. Implementing this technique might improve the comprehension of the underlying mechanisms and their consequences. (3) Broadening the scope to include cross-country comparisons, particularly with developed economies, offers a compelling opportunity for investigation. Through conducting such analyses, it becomes feasible to distinguish the benefits and experiences of various countries in effectively managing these variables. By employing a comparative perspective, we may extract useful insights and exemplary methods that can guide policy choices and tactics for achieving both environmental and economic sustainability. (4) Future research direction could involve investigating the role of renewable energy, technological innovations, and government policies as moderators in the relationship between foreign investment and CO2 emissions within the context of South Africa. This exploration could shed light on how increased foreign investment influences CO2 emissions through its impact on renewable energy development and adoption.
Footnotes
Acknowledgments
The completion of this research owes its gratitude to the collaborative endeavors of all participants, the supervisor, our colleagues, and family members. We express our sincere appreciation to everyone for their invaluable contributions.
Data availability
Data for the study can be obtained upon respectable inquiry from the corresponding author.
Declaration of conflicting interests
The authors declared no potential conflicts of interest with respect to the research, authorship, and/or publication of this article.
Funding
The authors received no financial support for the research, authorship, and/or publication of this article.
