



Abstract
The annually laminated record of Lake Belau offers an exceptional opportunity to investigate with high temporal resolution Holocene environmental change, aspects of climate history and human impact on the landscape. A new chronology based on varve counts, 14C-datings and heavy metal history has been established, covering the last 9400 years. Based on multiple varve counting on two core sequences, the easily countable laminated section spans about 7850 varve years (modelled age range c. 9430 to 1630 cal. BP). Not all of the record is of the same quality but approximately 69% of the varves sequence is classified to be of high quality and only c. 5% of low quality. The new chronology suggests dates generally c. 260 years older than previously assumed for the laminated section of the record. The implications for the vegetation and land-use history of the region as well as revised datings for pollen stratigraphical events are discussed. Tephra analysis allowed the identification of several cryptotephra layers. New dates for volcanic eruptions are presented for the Lairg B event (c. 6848 cal. BP, 2s range 6930–6713 cal. BP), the Hekla 4 event (c. 4396 cal. BP, 2s range 4417–4266 cal. BP), and Hekla 3 eruption (c. 3095 cal. BP, 2s range 3120–3068 cal. BP).
Keywords
Introduction
High-resolution well-dated palaeoecological multiproxy records are still scarce in central Europe. These are regarded to provide an ideal basis for detailed reconstructions of climate-, vegetation- and settlement-development especially on larger geographical scales, as they offer the possibility of synchronizing even short-term trends and events with a high level of confidence. Of particular importance here are archives with the possibility of annual resolution, e.g. tree rings, ice cores, varved lake sediments. Here, we report on investigations carried out on the annually laminated sediments of Lake Belau, northern Germany. Most of the sediment record consists of annually laminated deposits. Unfortunately the lamination is interrupted in the upper part of the sequence and thus the varve chronology is floating. Previously the chronology was fixed using pollen stratigraphical information dated in a raised bog in the region (Erlenkeuser, 1998). Here we present a new chronology based on varve counting, 14C-AMS, and Pb dating. The new dating approach avoids uncertainties involved in pollen stratigraphical dating. Furthermore the synthesis of the two independent varve count records provides an improved varve chronology including error estimates.
The new chronology is applied to results of pollen analyses carried out by Wiethold (1998a). This necessitates a brief review of the vegetation and land-use history in Northern Germany. Additionally, the identification of three tephra layers, detected in single varves of the sediment record, provides new age estimates for the Lairg B, Hekla 4 and Hekla 3 eruptions. These are discussed in context of available dates for tephra layers from northwestern Europe as they provide the basis for high-resolution synchronization of palaeorecords in the corresponding area.
The results presented form a fundamental part of ongoing research projects involving multiproxy analyses (i.e. stable isotope, XRF, microfacies analyses of varve structures, alkenones) on the sediments of Lake Belau, as they provide the chronological basis for an integrative interpretation of the compiled data on a wider geographical scale.
Site description and previous studies
Lake Belau is located in the young moraine landscape of the federal state of Schleswig-Holstein, Germany (10°16′E, 54°6′N; Figure 1). It measures 1.15 km2 and has a maximum depth of c. 29 m. The volume of the water body is 10.18 × 10⁶ m3 with an estimated exchange rate of 0.9 years, the water is eutrophic and the lake is nowadays dimictic-holomictic (http://www.umweltdaten.landsh.de/nuis/wafis/seen/seenalle.php). The lake is part of the Schwentine river system, which drains to the north into the Baltic Sea. It consists of a series of medium-sized lakes connected by the river Alte Schwentine. Lake Belau is the third in a row of four lakes and thus has a rather large surface water catchment of 32.86 km2. The lake forms the centre of a region which has been intensely studied by the Kiel University Ecology-Center in the frame of the programme ‘Ecosystem research in the Bornhöved lake-chain area’ (Dilly et al., 1997; Fränzle et al., 2008). A number of proxies from the lake sediments and the surroundings have been previously studied: palynological, geochemical and historical as well as archaeological results are published by Wiethold (1998a, 1999, 2000), Garbe-Schönberg et al. (1998), Lütjens and Wiethold (1999), Wiethold and Lütjens (2001). Studies on Chironomids and the chronology were carried out by Hofmann (1993) and Merkt and Müller (1999). Additional papers on diatoms, carbon isotopes, and on modern sedimentation processes are published (Håkansson et al., 1998) or are available as internal reports (Wiethold, 1998b; Wiethold and Plate, 1994). Investigations on erosion processes in the lake catchment and of near surface lamination by thin slide analyses have been carried out (Dreibrodt, 2005; Dreibrodt and Bork, 2005, 2006).
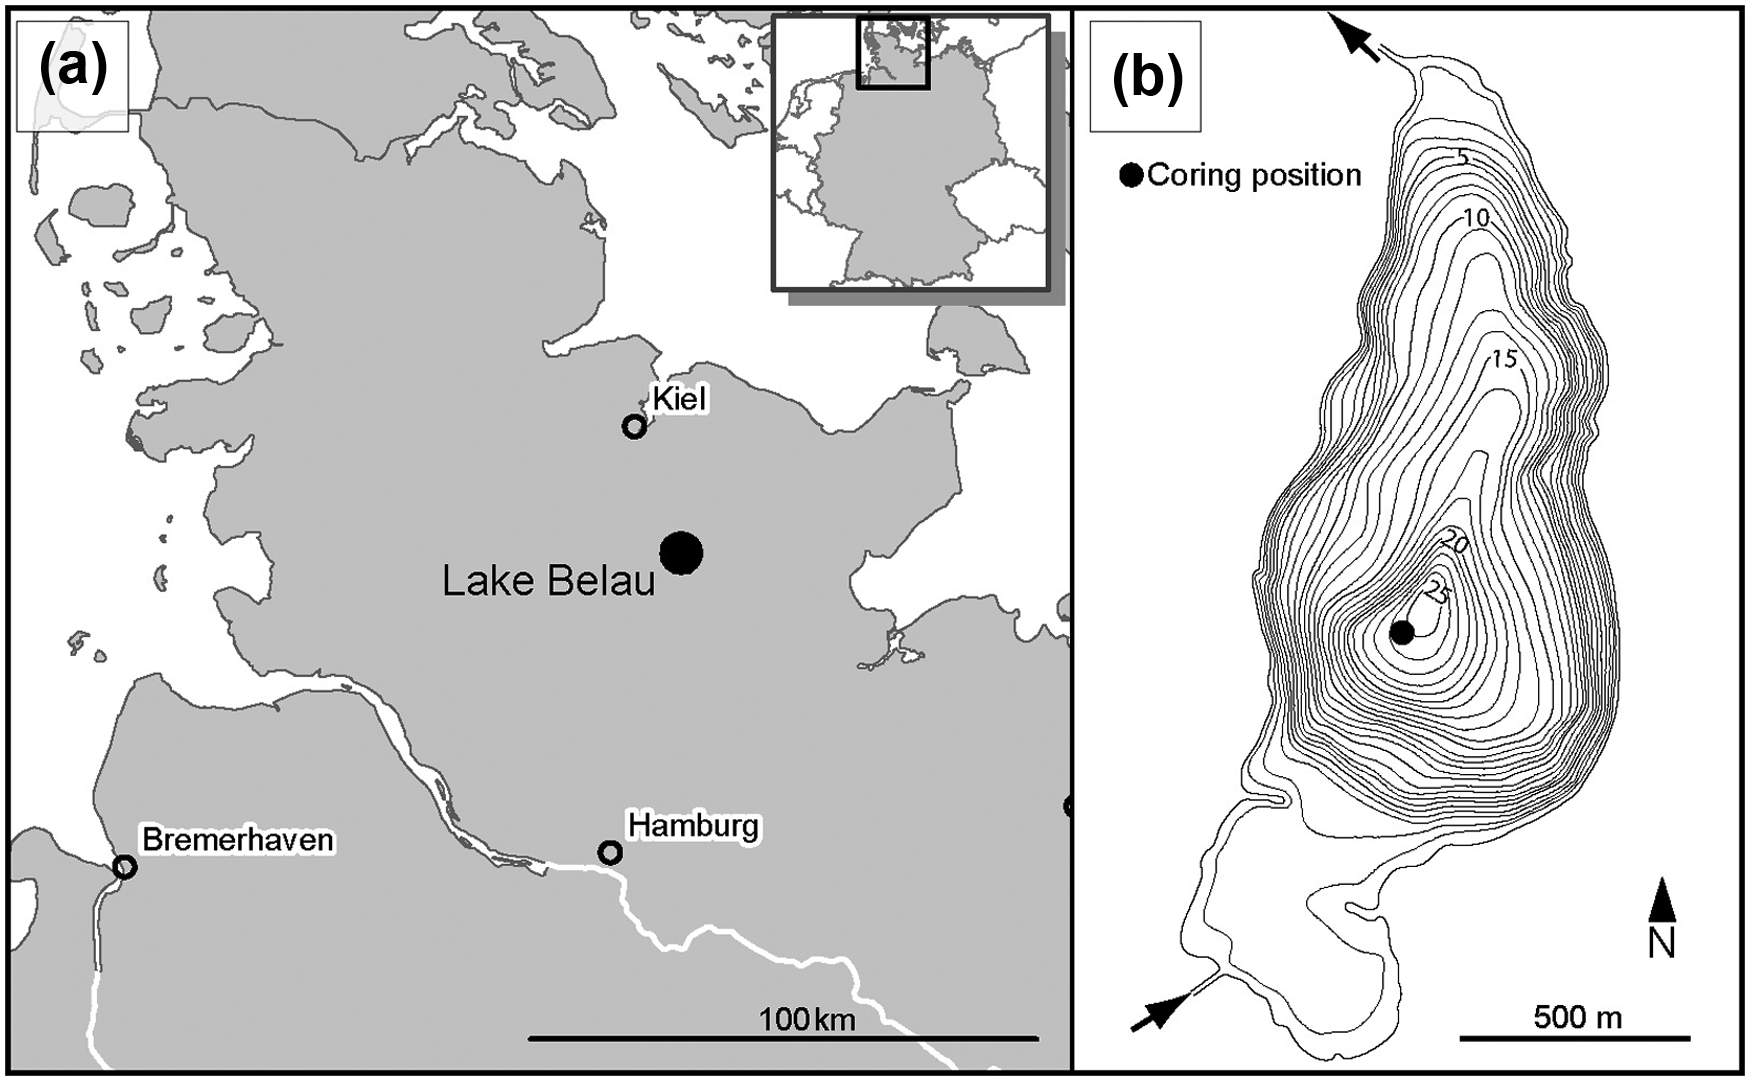
(a) Map showing location of Lake Belau. The inset shows the area of Northern Germany depicted in the large-scale map. (b) Bathymetric map of Lake Belau (depth in m) and coring location.In- and outflow to the lake system are indicated by arrows.
Methods
Coring and stratigraphical connection of the sediment cores
Coring has been carried out twice in the deepest part of the lake. In 1991 five parallel cores (Q300 series) were taken at a water depth of 29 m. In 2002 four parallel cores, were taken at a water depth of 28.3 m (P2002 series). In both cases a Usinger piston-corer was used (Mingram et al., 2007). The cores were taken with overlapping parallel segments of 2 m length each with a diameter of 80 mm in the uppermost 12 m and of 55 mm for the subjacent sediments. Additionally, the shoreline sediments of the shallow southern basin of the lake were investigated.
In order to connect the different core series, stratigraphical marker horizons, distinct layers which could be identified in all parallel cores (Figure 2) were defined. The marker horizons were used to connect parallel cores but also to connect the two core series Q300 and P2002 (Figure 3). In a final step the so-called ‘master scale 2011’, in the following referred to as master scale, was constructed. This composite depth scale represents a continuous record, circumventing gaps between the individual core segments. Based on the master scale it is possible to compare results from the two core series (Q300 and P2002) on a single depth scale (cf. Figure 3). Transformation of depth values to the master scale was done by linear interpolation between the two adjacent marker layers.
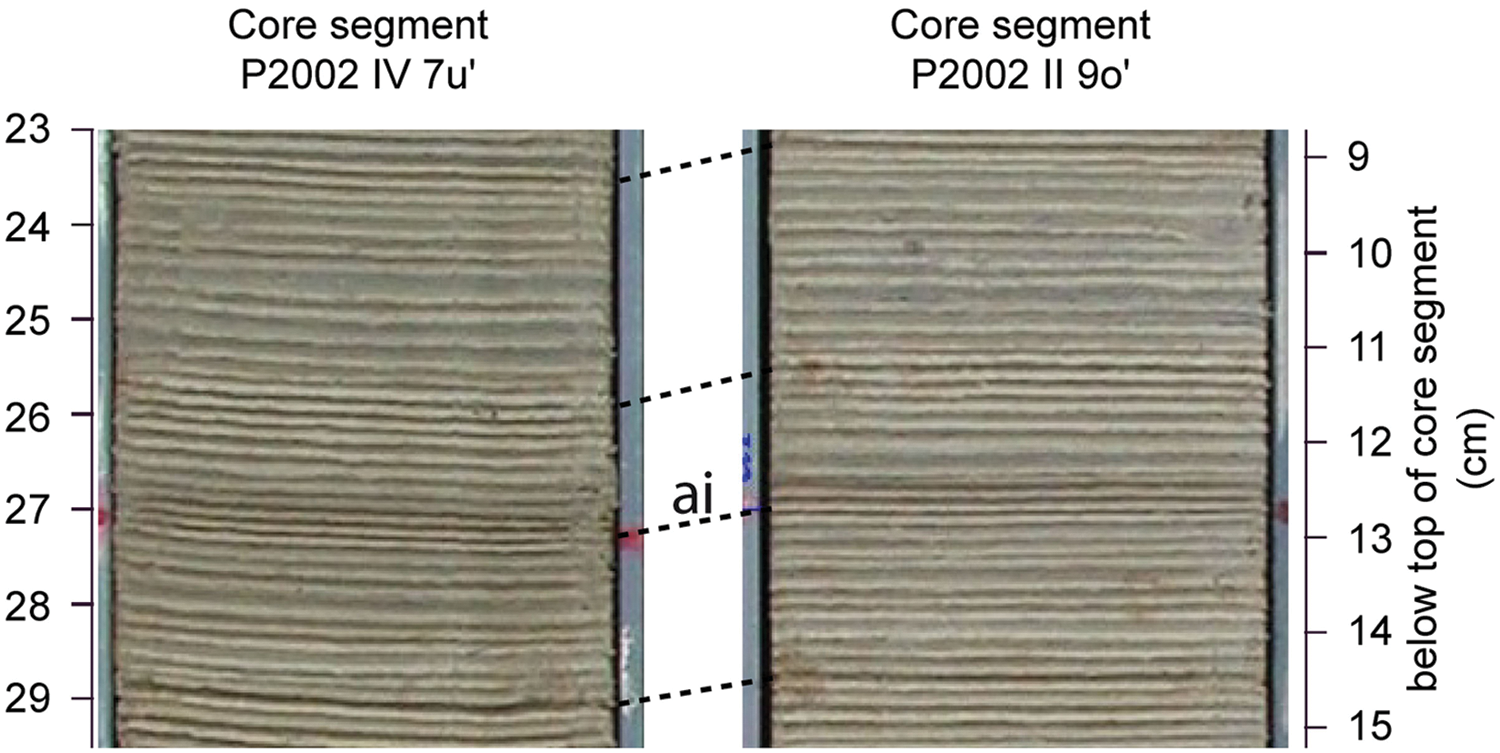
Photos of laminated sediments from two parallel core sections from Lake Belau. Dotted lines indicate correlation based on marker layers identified in both sequences (i.e. marker ai, depth 1785 cm master scale).
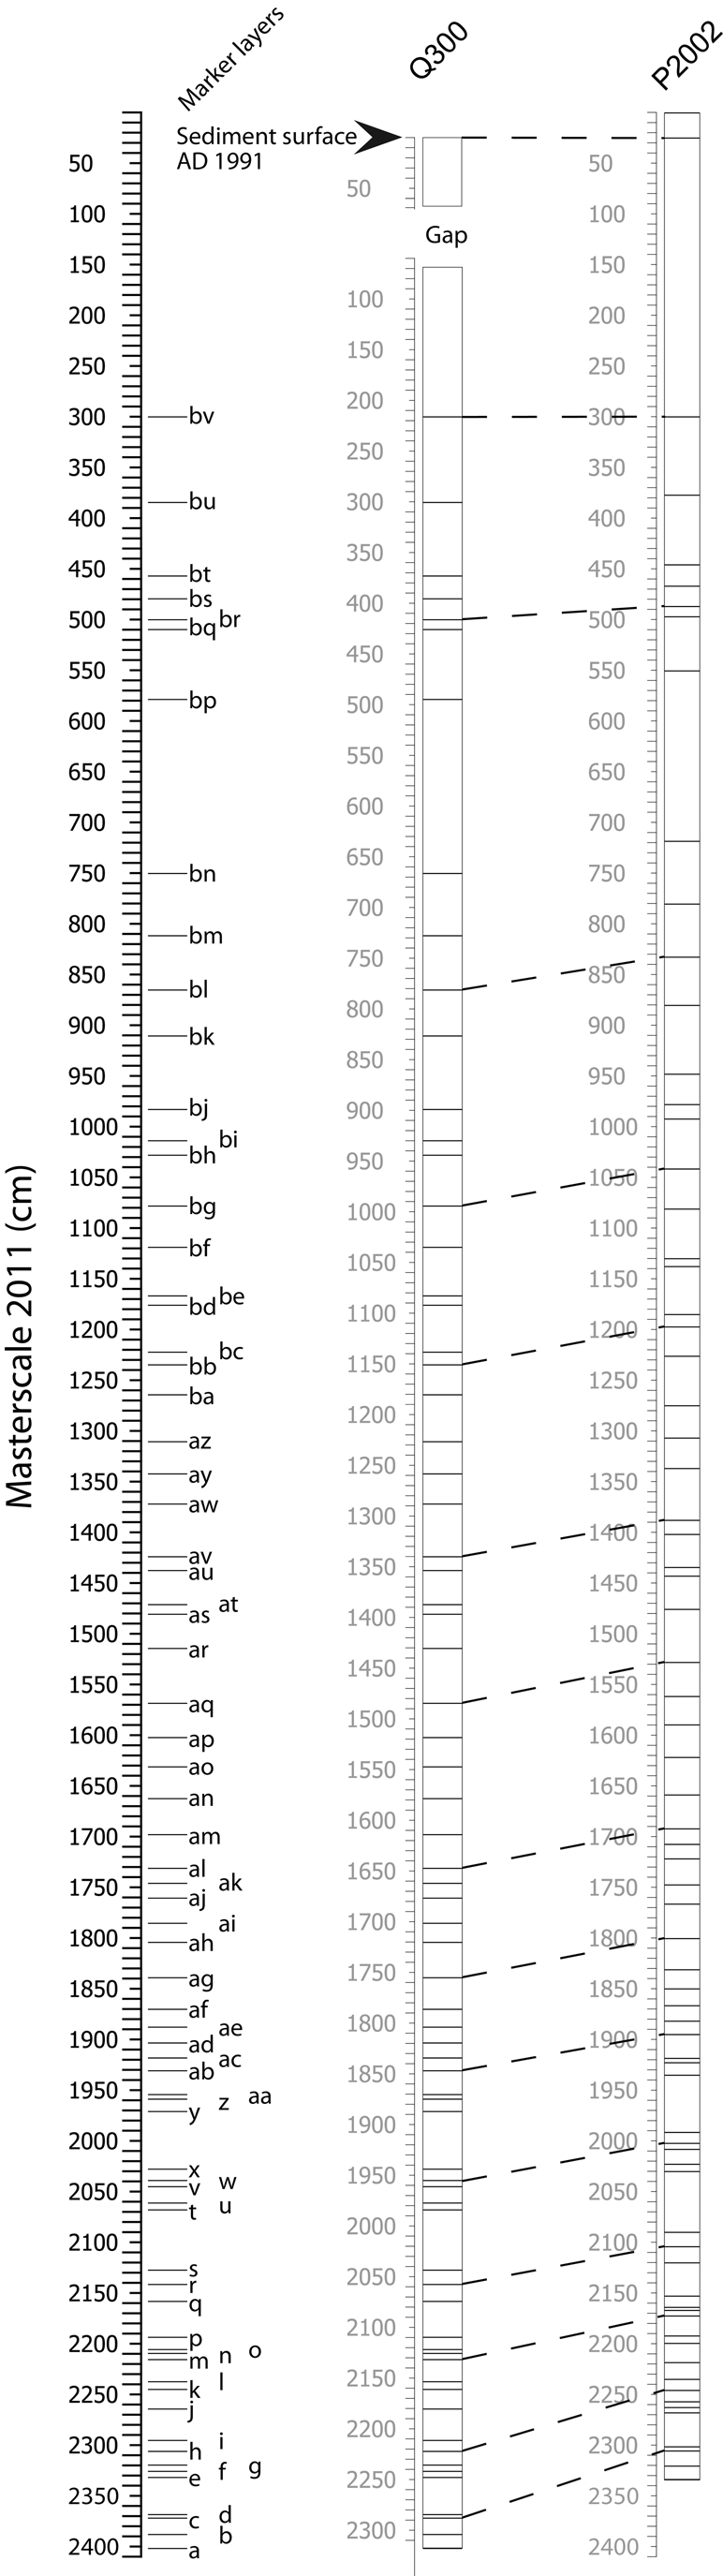
Schematic diagram explaining the stratigraphical connection using marker layers (a to bv) of the core series Q300 and P2002 and construction of the master scale.
Varve counting
Varve counting for the Q300 series was carried out on black and white photos of the sediment record. In the P2002 series varves were counted on the fresh sediment cores and documented on digital photos. In both cases problematic and/or doubtful varve counts were noted. Additionally, the varve thickness was measured on the digital photos using C-DENDRO Software (http://www.cybis.se/forfun/dendro/).
Thin sections
In selected segments sets of overlapping thin sections were produced according to Merkt (1972). Blocks of the wet sediment were taken from the cores, frozen with liquid nitrogen and freeze dried. Subsequently the blocks were embedded in epoxy resin and ground to a thickness of ~20 µm. The varve structure was analysed using polarizing light microscopy at ×25 to ×1000 magnification.
14C-dating
14C-measurements were carried out on macroremains from terrestrial plants (cf. Table 1). For this purpose the surface of the longitudinal cut cores was carefully examined to detect thin dark layers or brown inclusions which, in most cases, represented remains of leaves. The material was carefully removed, washed from sediments, and treated with HCl (5%) to remove carbonates. The samples were submitted to the Kiel Leibniz-Laboratory for Radiometric Dating and Isotope Research for AMS dating.
14C-dates from Lake Belau Samples are from core P2002, only KIA732 from Q300.

Radionuclide measurements
Radiocesium (137Cs) content of the P2002 sequence has been measured to verify the varve chronology of the surface sediments with an independent method. Samples (2 cm layers) suspected through varve chronology to have been deposited around 1963/1964 and 1986 were freeze dried and analysed on a Ge-semiconductor-detector using the 661 keV gamma-line.
In Q300 samples for radionuclide analysis were taken as 4 cm thick segments all along the sediment sequence at mostly 16 cm increments, dried at 70°C, and ground in a porcelain mortar. A short selection was analysed for gamma-rays on a 19% Ge(Li) detector (Bartels, 1992).
210Pb was analyzed in the Q300 sequence via its granddaughter 210Po which was acid-extracted from the ground sediment, deposited onto Ag-disks and alpha-counted in vacuo using silicon surface-barrier detectors (Erlenkeuser and Pederstad, 1984).
Measurements of selected heavy metals (Pb, Zn)
Measurements of Pb and Zn contents were carried out for the uppermost 300 cm of the P2002 core sequence. Dry sediment samples were taken every 8 cm (mixed samples of 2 cm sections). The content of Pb and Zn in the freeze-dried samples was measured on an ICP-OES after digestion in aqua regia according to the instructions of DIN 38414 (1983). The limits of detection were 5 ppm for Pb and 1 ppm for Zn.
Tephra identification
Based on age estimates and the pollen stratigraphic position of known tephra-layers (van den Bogaard and Schmincke, 2002; van den Bogaard et al., 2002) selected sections of the P2002 core sequence were subsampled for tephra analyses. Pinpointing the tephra strata involved iterative focusing through a series of initially 4 cm, then 1 cm thick sediment slices before single varves and seasonal layers were analysed.
Processing of the samples involved treatment with HCl to dissolve carbonates, NaOH (10%) to eliminate diatom silicates, and concentrated H2SO4 and HNO3 to get rid of organic material in the samples. Finally a density separation using Sodiumpolytungstate was applied to separate heavy mineral particles above 2.7 g/cm3 from lighter particles including tephra grains with gas inclusions (cf. Turney, 1998). The lighter fraction was mounted in glycerol-gelatine and subsequently analysed using a light microscope under bright field, ×250 magnification. Cross polarization was used to check critical particles.
To gain material for electron-microprobe analyses the mounted material was redissolved and embedded in synthetic resin. Subsequently polished thin sections were prepared from these slides.
Electron-microprobe (EMP) analyses
The chemical composition of glass shards – major elements, S, Cl and F – was analysed with a Cameca SX-50 electron microprobe at GEOMAR-Helmholtz-Zentrum für Ozeanforschung, Kiel. Analytical conditions were 15 kV accelerating voltage, 6 nA beam current and 20 s of peak counting time, 10 s on background. Analyses were performed with a 5–7 μm electron beam. Pumiceous clasts smaller than 40 μm, where only small edges of glass were polished, required a reduction of the beam diameter to 3 μm, and a beam current as low as 2 nA was used to exclude heating and degassing of the embedding material. The different analytical conditions were performed on Lipari standard (Hunt and Hill, 1996; Kuehn et al., 2011).
Results and interpretation
Stratigraphy and varve counting
The sequences and single cores of the Lake Belau deposits are linked by 64 marker layers (a to bv, Figure 3). In total the master scale comprises a sequence of 2401.4 cm. In this sequence c. 665 cm of early-Holocene deposits are not included. The master scale ends with marker a, the lowermost marker, which lies 2399.9 cm below the sediment surface (relating to sediment surface in the year
For the section 0–299.7 cm, i.e. the sediment surface of the year
Varve counting started at marker a in both the Q300 and P2002 series and ended at marker bm. Above marker bm (master scale 811.3 cm) macroscopic varve counting was regarded to be unreliable owing to the increasingly faint character of the lamination. For the bottom section (marker a to bm) a maximal number of 7930 or 7769 varves were counted for the Q300 or P2002 series, respectively (minimum 7826 or 7674, excluding doubtful varve counts). Generally there is a good agreement of the number of varve years counted between the marker layers (with an average of 120 varve years between adjacent marker layers and an average difference of 3.7 varve years with a standard deviation of 5.7 between the Q300 and P2002 record). The greatest differences (max. 26 varve years) are recorded towards the upper part of the laminated sequence which corresponds with a decrease in varve quality.
Using the two records a minimum and a maximum varve count record (minVCR and maxVCR) was established for the master scale sequence. For this, the higher number of varve years recorded in one of the records for an interval between two adjacent marker layers was always summed up as maxVCR, and in analogy the minVCR was defined. Equal number of varve years (maxVCR = minVCR) were recorded in c. 35% of the cases. Based on these calculations the interval between marker a and bm comprises 7857 (maxVCR) or 7604 (minVCR) varve years, respectively. The difference between maxVCR and minVCR in relation to the maxVCR can be used as a proxy for the varve quality (varve quality index = (maxVCR−minVCR)/maxVCR*100, cf. Figure 8 column on left side) for a given section between two adjacent markers. This is based on the assumption that greater differences between the varve counts of the Q300 and P2002 series correlate with lower varve quality. According to this c. 69% of the varved sequence can be described to be of high quality, i.e. has a varve quality index <3%, and only c. 5% of low quality, varve quality index >10%. Sections with low varve quality concentrate in the uppermost part of the laminated sequence, representing the uppermost c.740 varve years.
Thin section analysis of near-surface sediments
The surface sediment of both series was found preserved in annual lamination.
A year’s sedimentation in the biogenic surface varves comprises three sublaminae which were investigated by thin sections for the P2002 sequence (Figure 4). During the spring season a layer dominated by one or a few centric diatom-species typical for the plankton of mid-latidude lakes was deposited. The spectrum of taxa was dominated by Stephanodiscus spec.; a minority of spring layers contained Cyclotella spec., Asterionella and Fragilaria. Large rhomboedric calcite grains are abundant within these layers. To a lesser degree reworked detrital material from the shore areas is present. During the summer a pronounced and dense calcite grain layer has been deposited. Usually the calcite grains are micritic and show few secondary components. Among them are shells of Phacotus spec. and few diatoms. During the autumn and winter season a layer of mixed reworked material from the shore area and sometimes mono-species diatom layers are included.
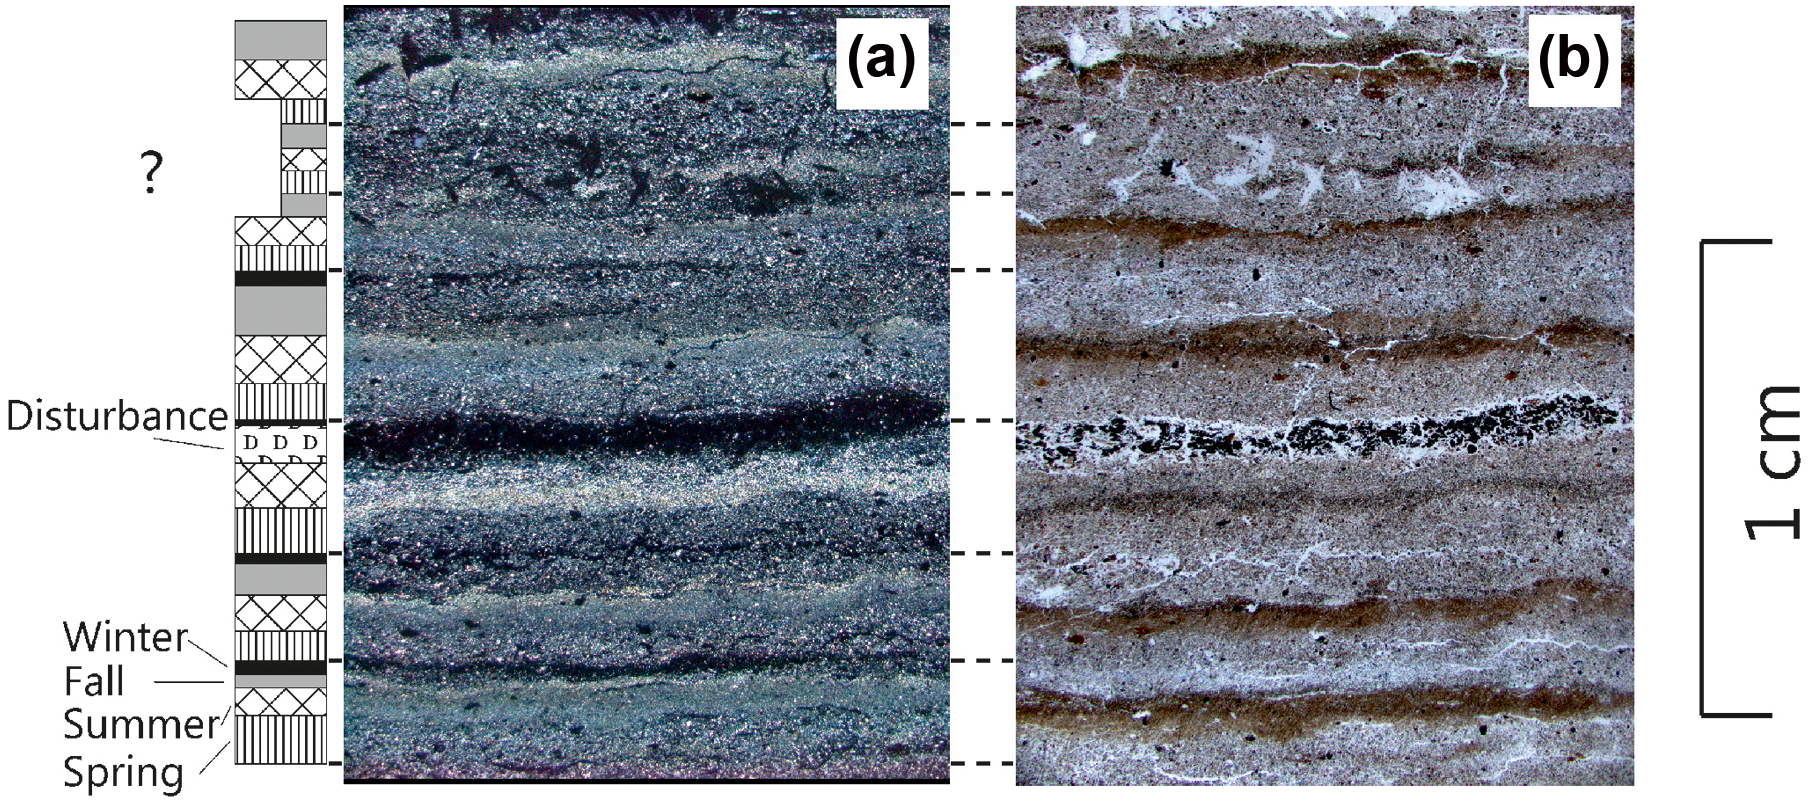
Microphotos of thin sections, (a) unpolarised light, (b) crossed nicols. The sequence in the photo contains the sediment of seven varve years (indicated by dashed horizontal lines). Seasonal sublaminae are indicated on the left. A doubtful varve is marked with a question mark. Visible cracks are artefacts, which developed during thin-section preparation. The large gypsum crystals (cf. black layer in photo (b); labelled as disturbance on left) have formed by particial decomposition of organic matter resulting from aeration of the sediment during storage.
An example for the varve microstructure is given in Figure 4. The light particles in Figure 4(a) are rhomboedric calcite crystals. Micritic (fine-grained) calcite crystals make up the main component of the darker layers in Figure 4(b). Both reflect the deposition of late spring/summer layers. The layers above, respectively below, the calcite-rich layers were formed during autumn and spring and contain planctic diatoms and reworked detrital material.
A varve chronology has been established for the near-surface sediments (Figure 5b). The counted surface sediment sequence spans

Lake Belau, Q300 and P2002 core series: results of near-surface sediments shown on the master depth scale 2011: (a) 137Cs and 210Pb content (Q300). A Constant Initial Concentration and Constant Sedimentation 210Pb dating model is fitted. (b) Thin-slide varve-counts (P2002), (c) 137Cs content (P2002), 1uncalibrated scale, (d) Pb and Zn content (P2002); inserted ages:
Radiocaesium measurements
Radiocaesium from the P2002 series supports and validates the varve counting in the uppermost part of the P2002 section. Following an initial phase of low level 137Cs, probably relating to the 1950s of the 20th century
Also in Q300 the modern character of the upper layers is revealed by 137Cs (Figure 5a). The sediment shows the increasing impact of 137Cs since the mid 1950s in approximately 80–90 cm depth.
210Pb measurements
210Pb reveals the radiodecay of this natural radionuclide with the depositional age towards a background level supported by the natural 238U-family in the mineral fraction of the sediment. The deposition of 210Pb in the deep plane of Lake Belau exhibits some uncomfortable variability, as learned from various short cores from this environment. The variability may be due to the fluctuation of the seasonal to yearly material flux to the deep sediment as well as to redox-related geochemical processes in the basin sediments. A rough age estimate is indicated by the half-amplitude of the excess-210Pb between the surficial (c. 120 Bq/kg) and the supported level (40 Bq/kg). This half-level which was attained after 22 yr (210Pb halflife) in deposits from 1968, must be suspected at depths below 89 cm. Alternatively, a decay curve, presuming a constant initial 210Pb concentration and a constant rate of sediment supply, may be fitted to the data (Figure 5a). The model yields a rate of 2.3 ± 0.3 cm/yr, placing
Measurement of selected heavy metals (Pb and Zn)
The content of Pb and Zn in the upper sediments of P2002 is illustrated in Figure 5d. Between 300 cm and 200 cm the Pb and Zn contents reach values of 6 to 14.5 ppm and 16 to 27 ppm, respectively. Between 200 cm and 65 to 54 cm there is a tendency of rising values in Pb and Zn contents. The maximum values are reached at depths of 64 cm for Zn (91.3 ppm) and 54 cm for Pb (64.6 ppm). Between 64 cm and 34 cm the values of Pb and Zn decrease dramatically, reaching values of 34 ppm (Zn) and 14.8 ppm (Pb) at depths of 34 cm. Whereas the Zn values maintain a more or less constant level (between 27 and 38 ppm) the Pb content decreases further, reaching a value of 9 ppm at the sediment surface of 2002.
As Renberg et al. (2001) point out, the heavy metal content (i.e. lead) in sediments in Europe delivers age information reflecting emissions according to early proto-industrial and early industrial activities (e.g. Erlenkeuser et al., 1974). Even globally the lead emissions after
Therefore the recorded increase of Pb and Zn at c. 200 cm is regarded to reflect the beginning of industrial anthropogenic activities, whereas the steep increase in lead content coincides with the onset of the ‘industrial revolution’ during the 1850s observed at several sites (e.g. Reuer and Weiss, 2002; Shotyk et al., 1998; Smol, 2002). In Schleswig-Holstein the first steam engine was established in 1824 in Neumünster, c. 18 km to the west of Lake Belau. Another source of emission, the iron foundry of Büdelsdorf, 43 km to the northwest, was founded in 1827 (Lorenzen-Schmidt and Pelc, 2006). Thus there might have been very little lead emission before that time.
Two distinct reductions in heavy metal content dating to
14C dating
In total 17 samples have been submitted for radiocarbon dating (Table 1). Apart from two samples, KIA20587 (wood fragment) and KIA22915 (leaf fragment), the dates show no inversion. Nevertheless four dates have been rejected as outliers during the modelling process (see below). According to the age–depth model, all of these samples gave ages which are too old, which might be explained by inclusion of aquatic material or redeposition.
Age–depth modelling
The age–depth curve presented was constructed for the master scale record (Figure 5). As well as data gained from 14C dating, age information is mainly based on varve counts. Additionally an historical date derived from Pb and Zn measurements was used in the modelling process for the youngest section.
Age–depth modelling was carried out using OxCal 4.1 (Bronk Ramsey, 2009) and the IntCal09 calibration curve (Reimer et al., 2009). A V_Sequence model was applied for the lower section between marker a and bm 2401.4–811.3 cm for which varve counts are available (cf. Figure 6). A V_Sequence defines a sequence where the temporal intervals including error estimates between defined events are known, i.e. number of varve years between two marker layers and error estimate on varve counts (Bronk Ramsey, 2008). In addition to six 14C dates available for this section (two 14C dates treated as outliers were not included), the marker layers were defined as events in the model. Gaps in years between the events were defined on the basis of the maxVCR (see above) as the counting technique applied tends to underestimate the number of varves (cf. Lotter and Lemcke, 1999). The difference between the maxVCR and minVCR between two events was used as the error estimate. This is based on the assumption that greater differences between the varve counts of the Q300 and P2002 series correlate with lower varve quality, which in turn results in higher varve count errors estimates in the applied OxCal model.

Age–depth curve for sediments of Lake Belau. Models applied for different sections are indicated by boxes. Absolute age information used in the age–depth models, i.e. calibrated 14C dates and the beginning of industrialisation as indicated by a distinct increase in Pb and Zn in the sediments, are also given. The old chronology of Wiethold (1998a) is shown for comparison.
For the top part from marker bm (811.3 cm) to the sediment surface of
The age–depth model provides modelled median ages and 2σ ranges for each marker layer. Between these horizons the age for a given depth, for example pollen spectra, was calculated by linear interpolation.
Figure 5 gives an overview with a comparison to the former chronology of Wiethold (1998a). For the laminated section our results suggest ages c. 260 yr older than previously assumed. The maximum difference between the old and new chronology is 311 years. For the upper part between marker bm and the sediment surface, comparable ages were modelled (cf. comparison of modelled and historical ages as used by Wiethold (1998a) for pollen stratigraphical events in Table 2).
Comparison of modelled and historical ages for identified historical events in the pollen record of Lake Belau.

AP: arboreal pollen; NAP: non-arboreal pollen; AI: anthropogenic indicators.
↗ Distinct increase in pollen diagram; ⇲ distinct decrease in pollen diagram.
cf. Ibs (1994); bcf. Lammers (1981); ccf. Vollrath (1993).
Tephra analysis
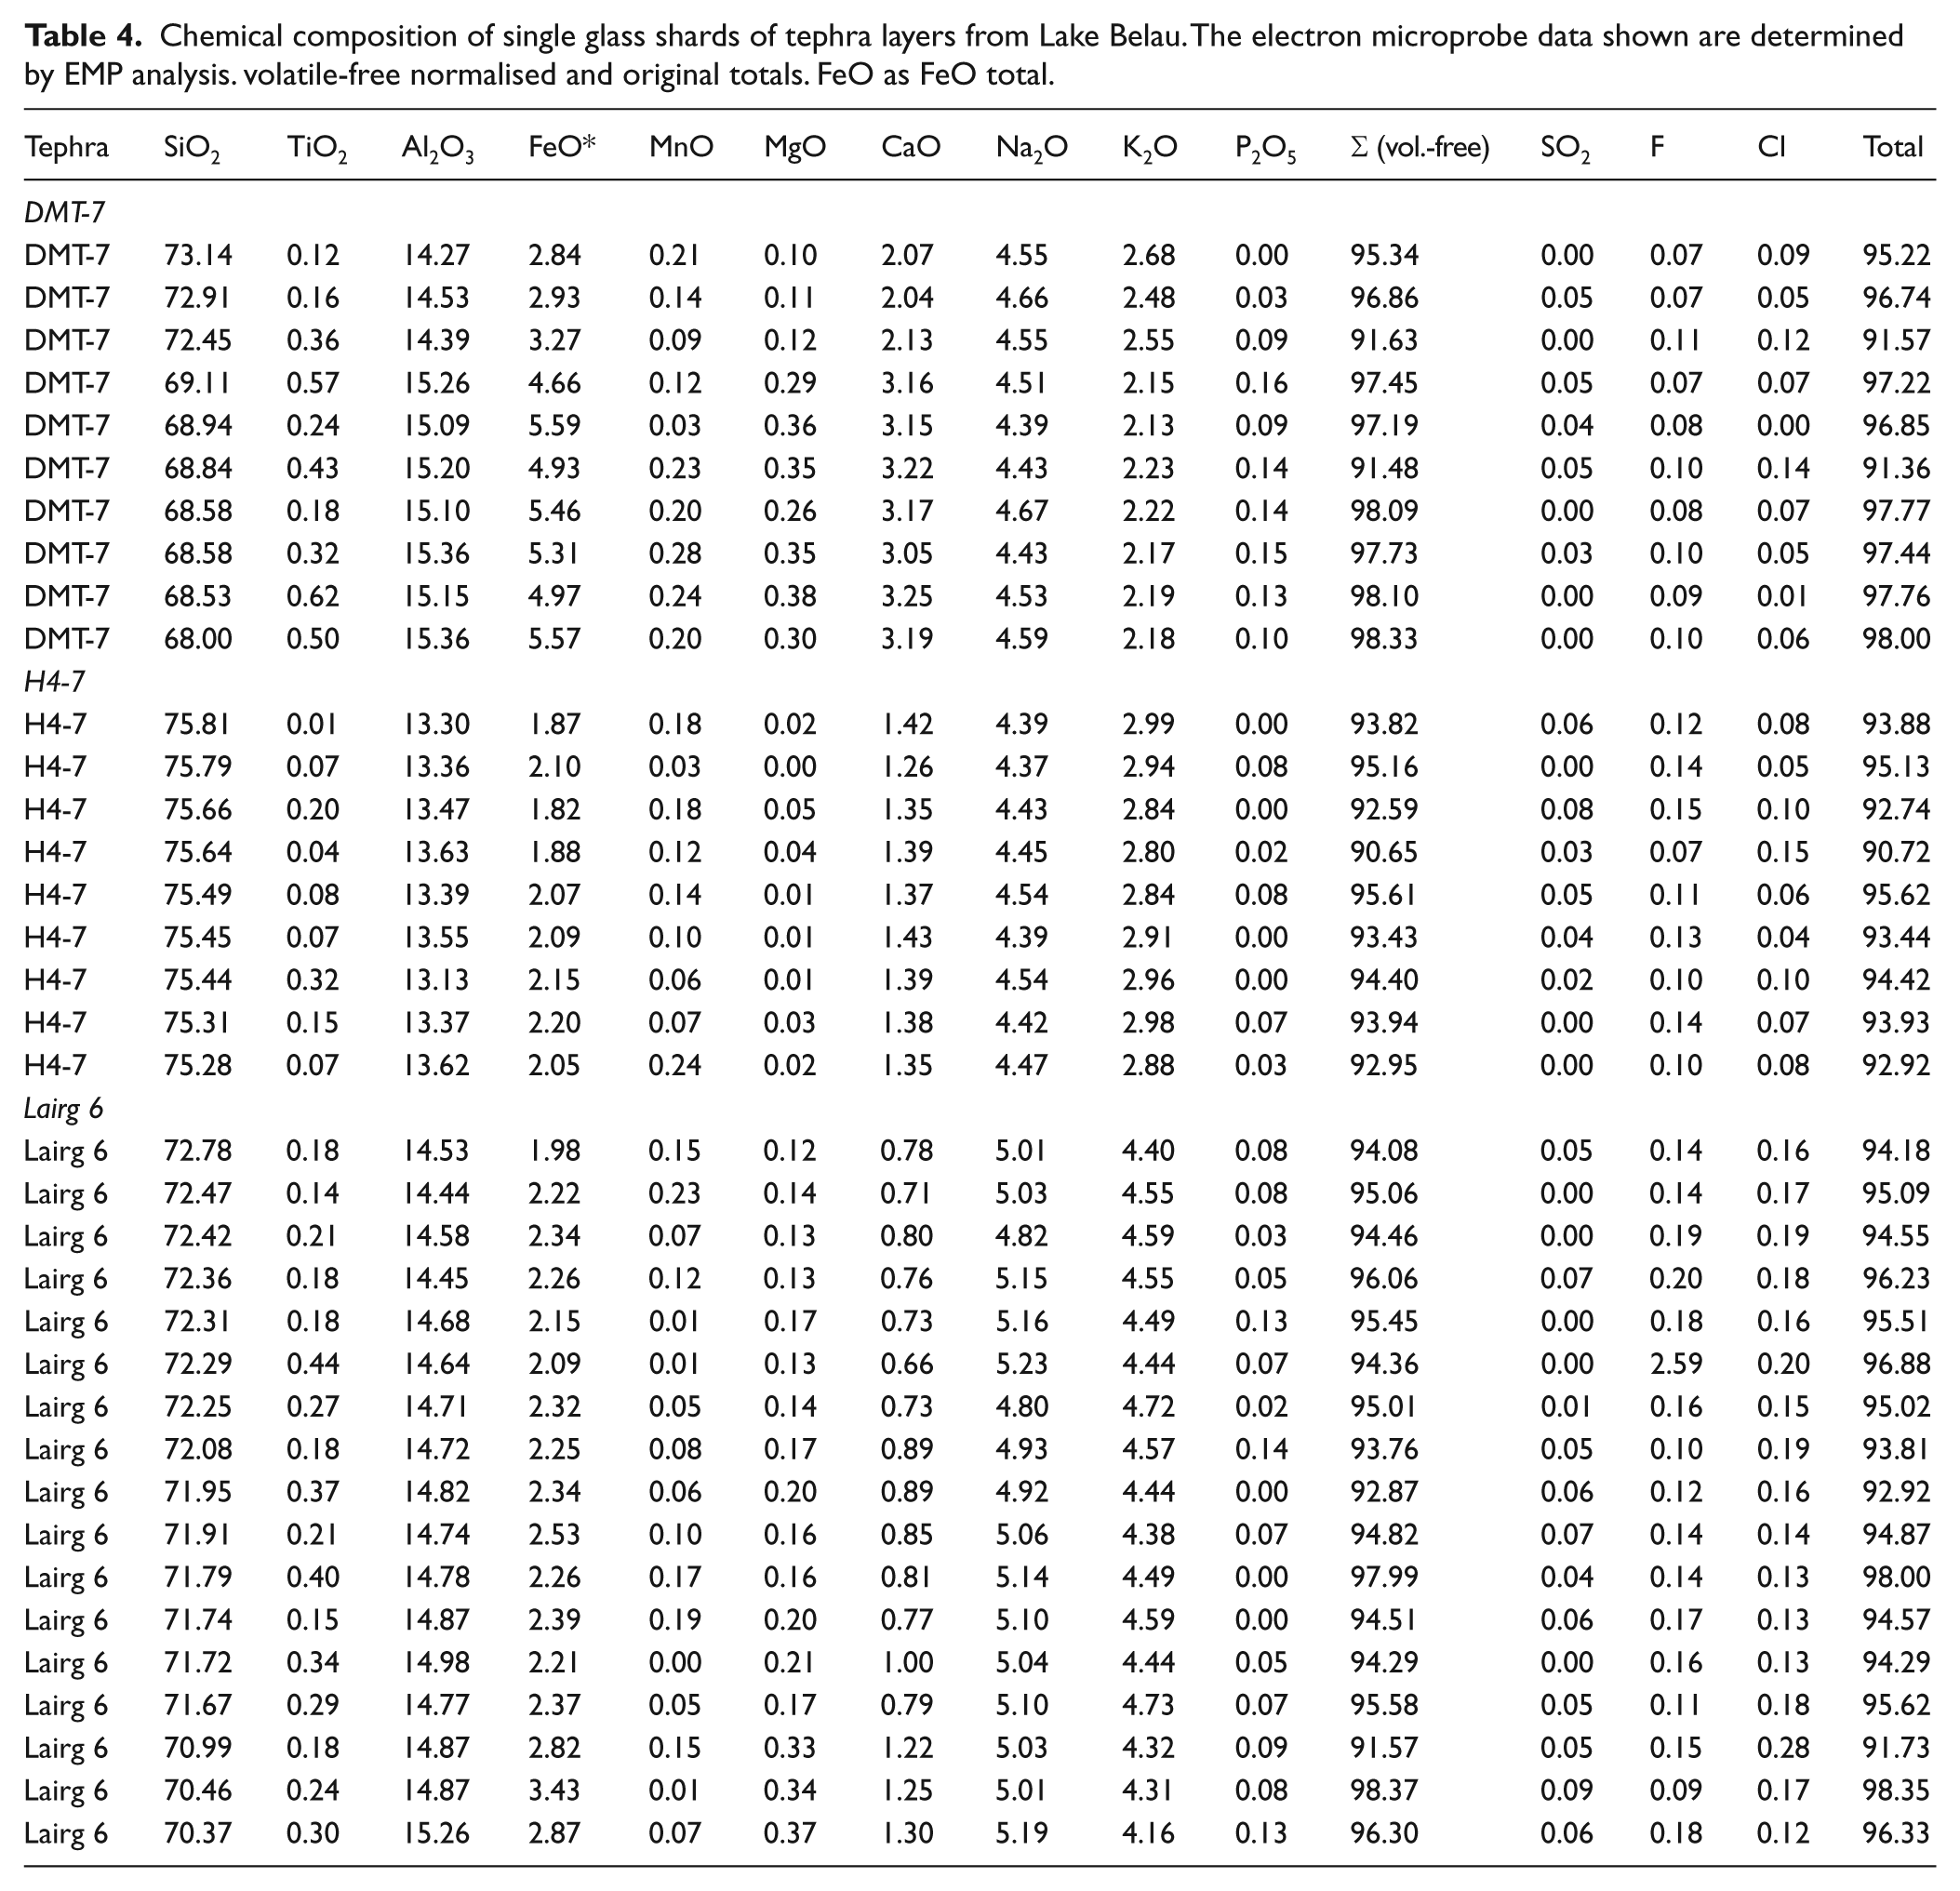
A number of layers were identified that contain volcanic glass shards. Table 3 gives an overview of tephra layers detected in the depth between 1218 and 1986 cm and their dates based on the chronology presented above. Three of them have been analysed by EMP (Table 4) and were identified as Hekla 3, Hekla 4 and Lairg B (Figure 7).
Identified tephra layers and their modelled ages from Lake Belau.

Chemical composition of single glass shards of tephra layers from Lake Belau. The electron microprobe data shown are determined by EMP analysis. volatile-free normalised and original totals. FeO as FeO total.
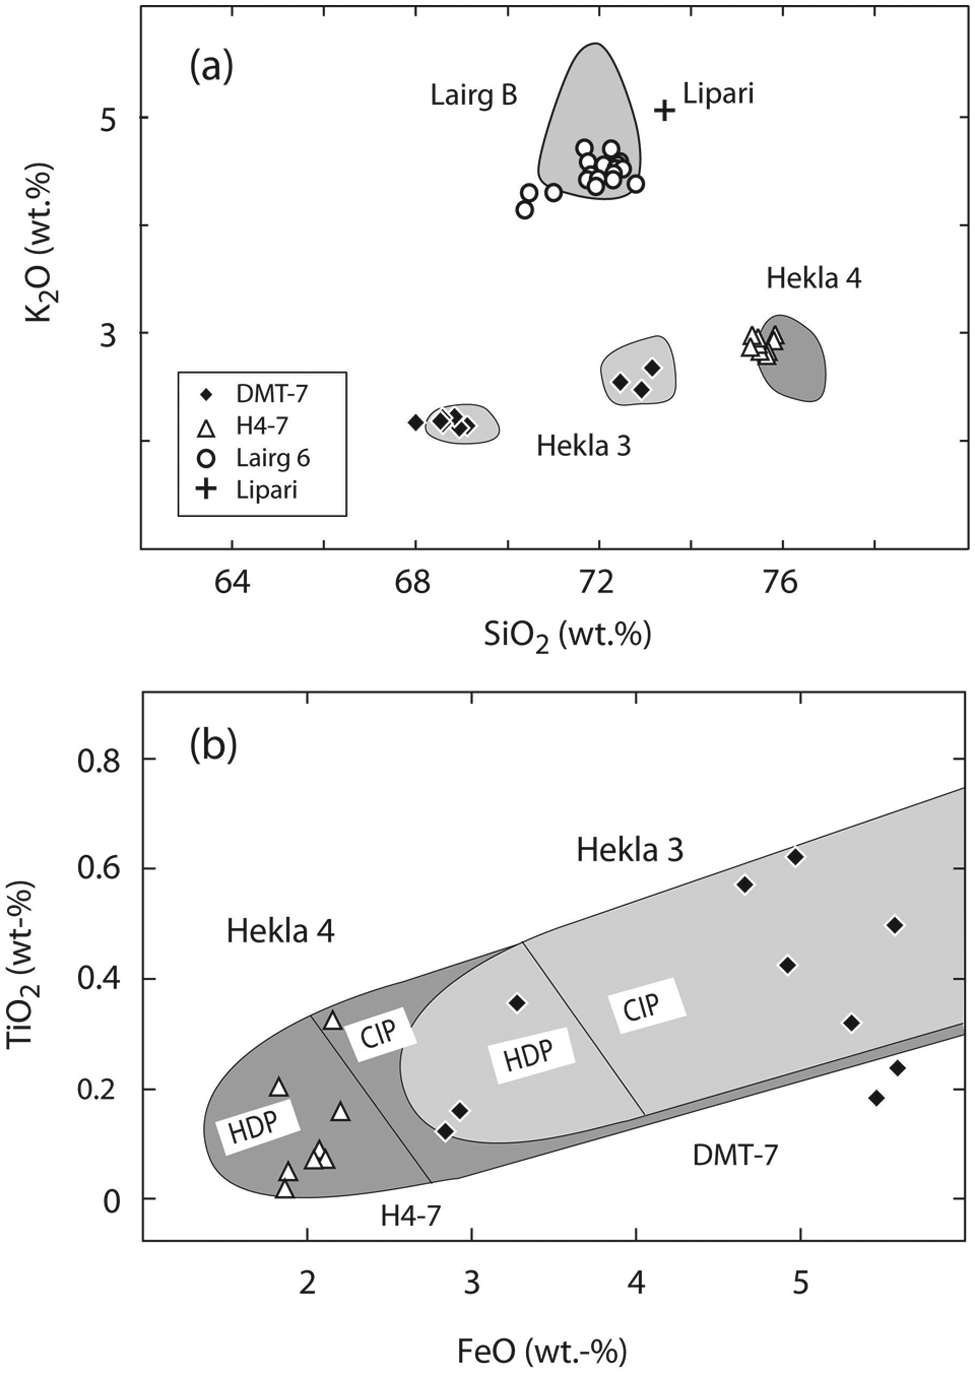
Comparison of the composition of tephra layers from Belauer See. (a) SiO2–K2O variation diagram of glass shards. Fields are defined from Northern German tephra layers (van den Bogaard and Schmincke, 2002). (b) Composition of glass shards compared with fields of glass shard composition from near vent deposits from Hekla 3 and Hekla 4. HDP: highly differentiated Plinian eruptive phases; CIP: compositionally intermediate Plinian eruptive phases (van den Bogaard et al., 1994). All data are plotted volatile free.
The tephra horizon DMT 7 contains glass shards that are colourless, pumiceous to highly vesicular and bubble-wall shaped. Shards are about 50 µm in average. The tephra has a bimodal glass shard suite, comprising rhyodacitic and rhyolithic compositions. The SiO2 contents are 72.9 and 68.5 wt%, K2O are 2.5 and 2.1 wt%, respectively. Based on this and the modelled age it is assumed that DMT 7 represents the Hekla 3 eruption.
The tephra horizon H4-7 consists of colourless tubular pumice and pumiceous and vesicular glass shards. The mean diameter is about 40 µm. The ash layer comprises a glass shard population of homogeous subalkaline rhyolithic composition, with characteristically high SiO2 (75.5 wt%) and low FeO (2.0 wt%) and TiO2 (0.07 wt%) concentrations, and can be distinguished also by other elements. The chemical composition of tephra H4-7 and its associated dates suggest that this tephra layer relates to the Hekla 4 eruption.
The tephra particles of sample Lairg 6 are colourless and vesicular, with a medium grain size of c. 50 µm. The glass shards are compositionally homogeneous, with a distinct potassic subalkaline rhyolitic composition. The shards have SiO2 contents of 72 wt% and high K2O contents (4.5 wt%). Its chemical composition is similar to that of the Lairg B tephra found in Scotland (Dugmore et al., 1995). This tephra layer, i.e. Lairg B, was tentatively correlated to an unknown eruption in the Torfajökull system on Iceland (van den Bogaard and Schmincke, 2002).
The detection of tehpra particles in the annual and seasonal layers of the varves allows a detailed reconstruction of volcanic eruption events.
Hekla 3 (sample DMT 7) shows the highest input values. The first distinct traces of tephra particles with a density of 0.96 particles/mg were detected in the summer and autumn layers of a varve 45 well-countable laminae above marker ba, that has a median age of 3141 cal. BP (2σ range from 3166 to 3113 cal. BP). The highest values occur in the next layer with a density of 4.83 particles /mg. This layer represents the winter and spring deposits of the following year. Just a few glass shards were found in the deposits above these layers, with a maximum density of 0.14 particles/mg, indicating little redeposition or erosion of soil material with tephra particles. Accordingly the fallout event has a median age of 3095 yr BP. The model gives a 2σ range from 3120 to 3068 cal. BP for this eruption of the Hekla volcano.
Hekla 4 (sample H4-7) shows much lower values with a distinct increase from one sample to the next but a longer reverberation. Values increase from 0.01 to 0.30 particles/mg in a varve 50 laminae below marker ar. Both layers, the winter/spring and the summer/autumn layer, have high values that decrease slowly in the next two years. This indicates there is more redeposition of surface material or the event is built up by a series of single eruptions. According to the model age of marker ar (4324 cal. BP) this event dates to 4374 cal. BP with a 2σ range from 4417 to 4266 cal. BP.
Tephra particles of the Lairg B (Lairg 6) eruption show a rapid increase up to values of 0.37 particles/mg in the winter layer of a varve 49 well-countable laminae below marker y. Only low values of 0.04 particles/mg occur in the years thereafter. Marker y dates to 6799 cal. BP (2σ range from 6881 to 6664 cal. BP). Thus this eruption has a model age of 6848 (2σ range from 6930 to 6713 cal. BP).
Discussion
The new results of several dating methods and their integration in a Bayesian deposition model allowed the revision of the previously adopted chronology by Wiethold (1998a). In comparison with the old chronology, our model suggests generally older dates for the lower laminated section (on average 260±28 years older, maximum 311 years, minimum 145 years). In the upper part (above 700 cm master scale) the applied ages are slightly younger (average 19±14 years, maximum 67 years).
In the following the new chronology will be applied to the results of palynological and tephrochronological investigations carried out on the sediments of Lake Belau.
Vegetation and land-use history
The palynological investigations by Wiethold (1998a) provide a detailed record for the mid and late Holocene. An overall number of 540 samples, resulting in an average resolution of 17 years per sample, have been analysed from the Q300 core series. Percentage curves for selected pollen taxa, as well as concentration curves for the freshwater algae Pediastrum and microcharcoal, plotted to the newly established chronology are presented in Figure 8. For a detailed description of the pollen diagram, additional pollen taxa and details regarding pollen preparation and identification it is referred to Wiethold (1998a). Based on the new chronology, revised ages with relatively small uncertainty ranges can be given for important pollen stratigraphical events, generally used to classify the vegetation and land-use history in Northern Germany (cf. Overbeck, 1976 and summarised by Nelle and Dörfler, 2008).
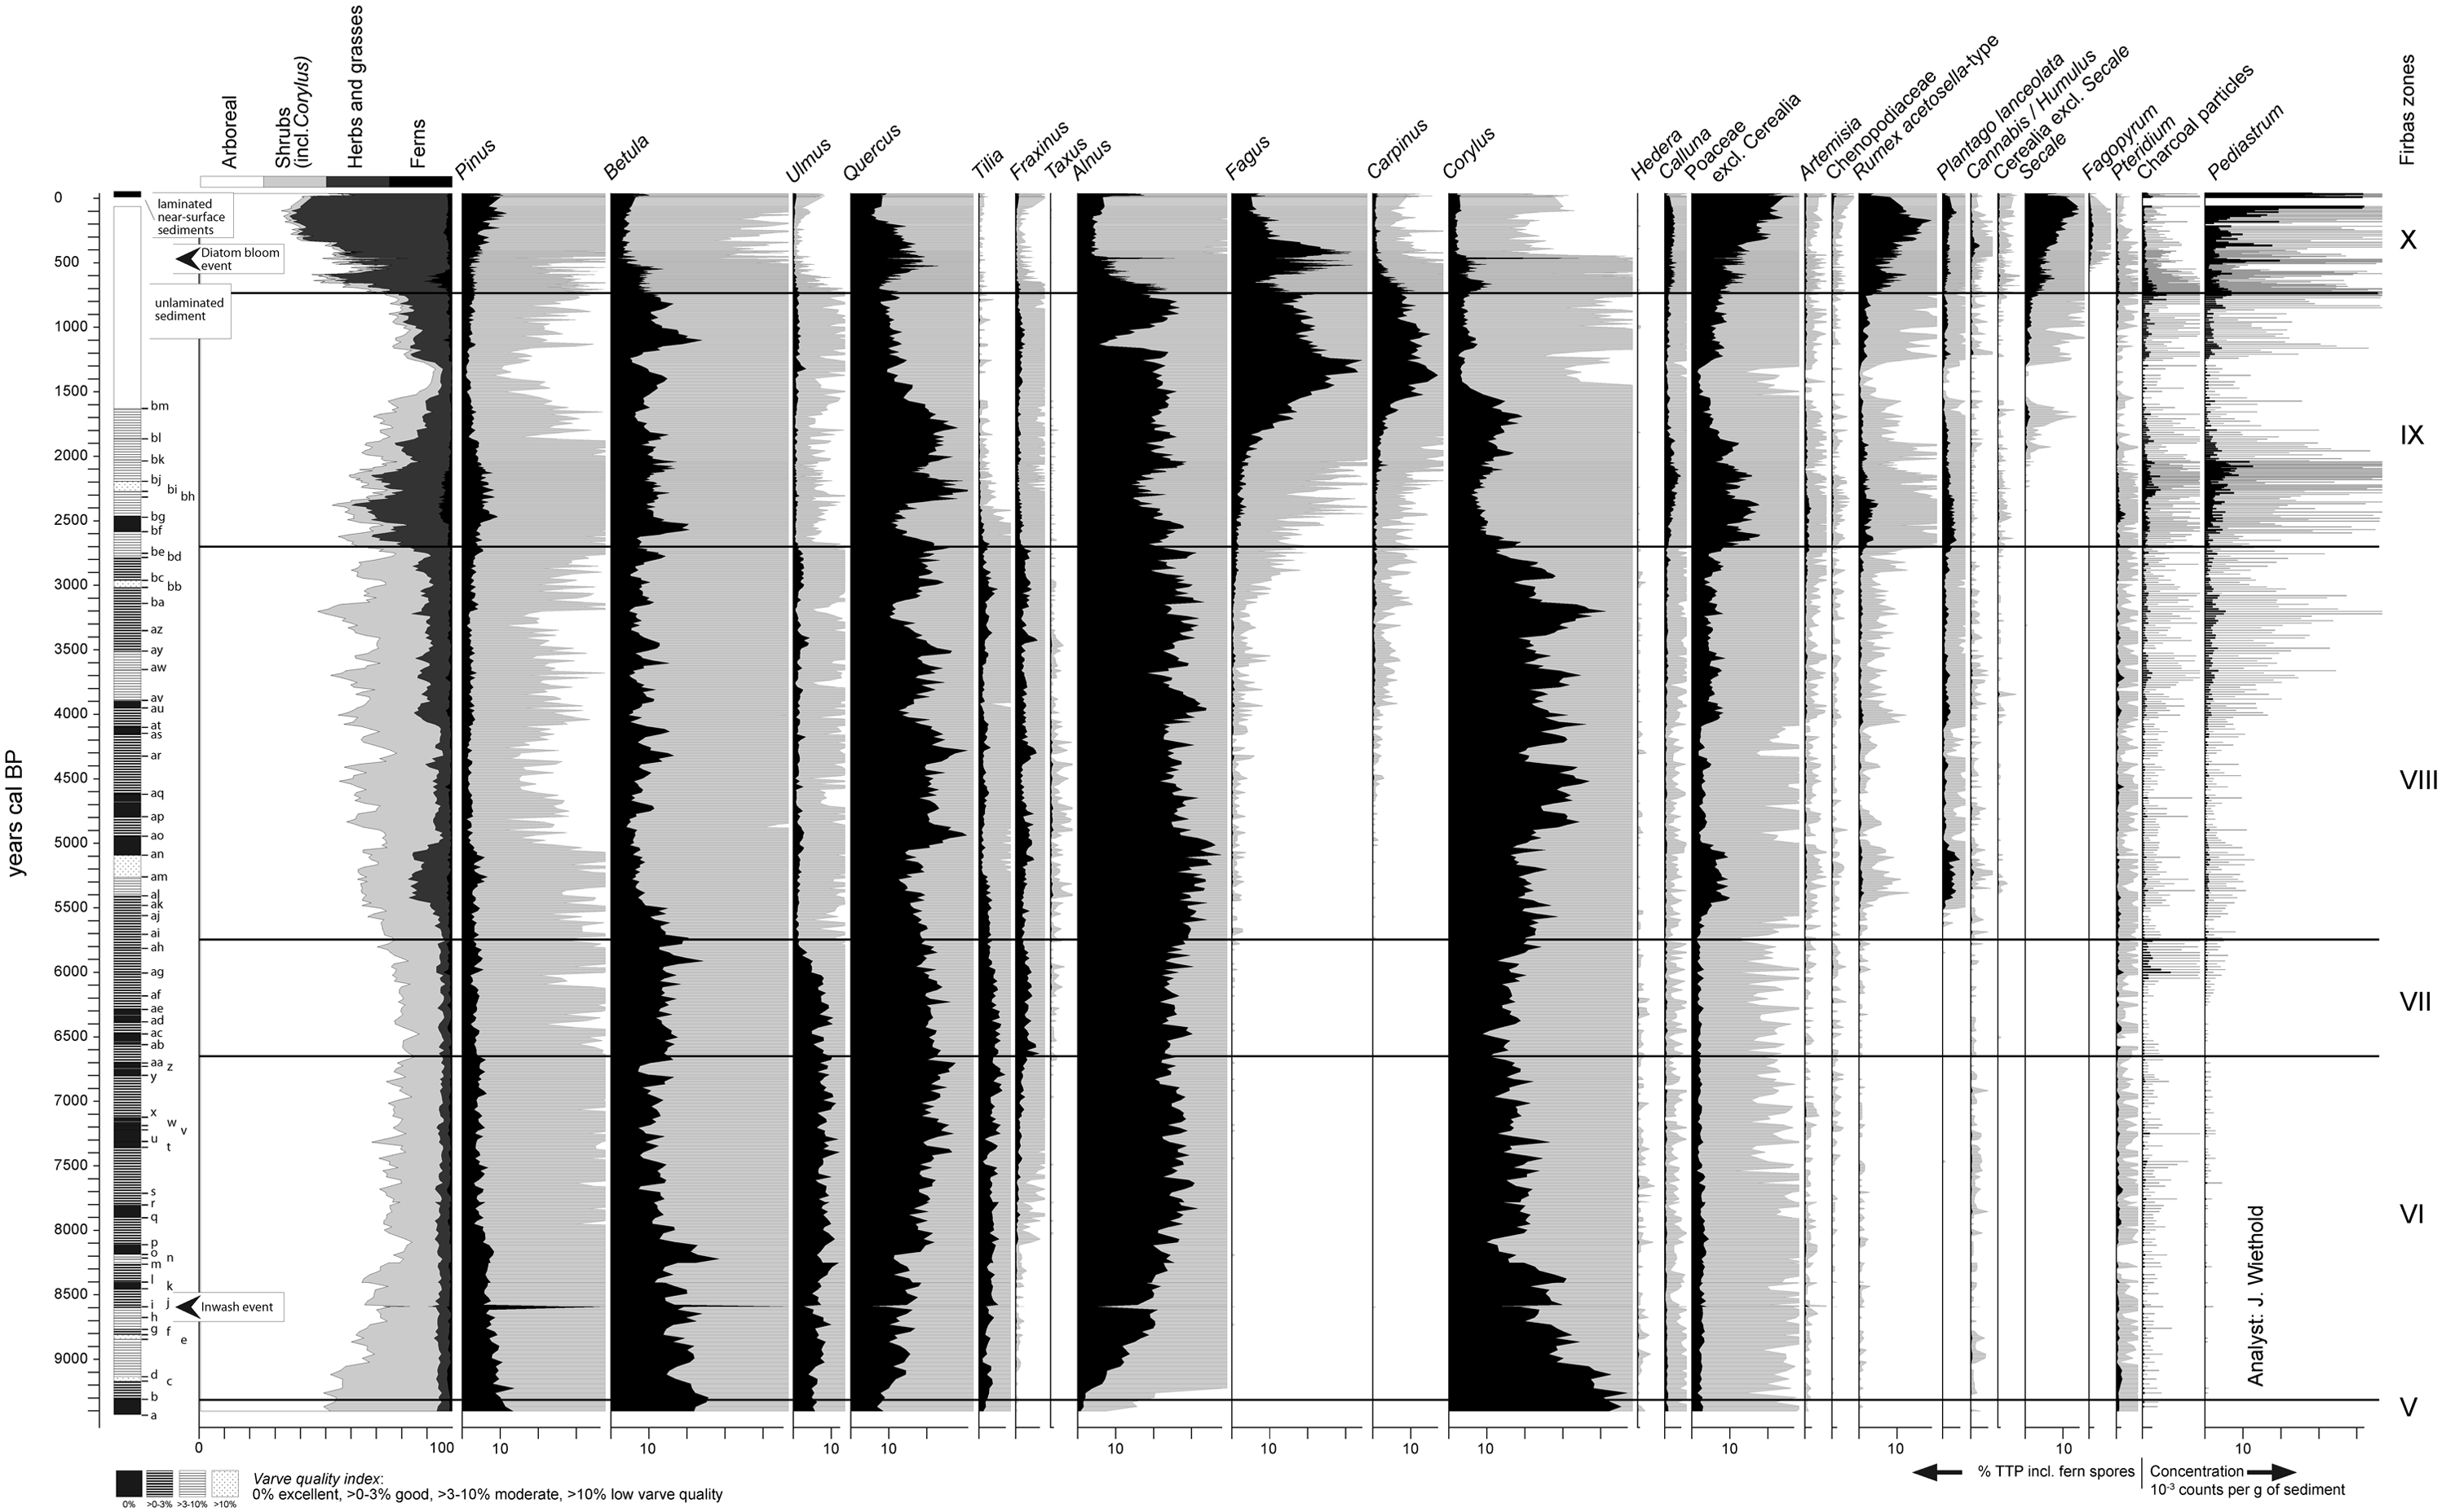
Pollen diagram from Lake Belau for selected taxa. White background curves represent values exaggerated by factor 10. Zonation follows Firbas (1949). Column on left side indicates varve quality on a four-scale grade (excellent, good, moderate, low) based on the varve quality index (see text), an index which reflects the relative difference between the two varve count records for the two core series, Q300 and P2002, from Lake Belau.
According to our results the expansion of Alnus, traditionally marking the beginning of the Atlantic period (zone VI and VII, Firbas, 1949), dates to c. 9300 cal. BP. Spectra relating to the slump layer between markers i and j are characterized by lower Alnus and Quercus values and high Pinus representation. This is interpreted as an inwash event layer, formed c. 8590 cal. BP. A distinct reduction in Corylus, coinciding with increased Betula representation, dates to 8253 cal. BP and lasted for about c. 230 years. This is regarded to reflect the response of the vegetation to the 8.2 ka event (Alley et al., 1997). Evidence for comparable response of the vegetation to the 8.2 ka event is known from Southern Germany, Switzerland, and Central Poland (Tinner and Lotter, 2001). Here the feature is generally characterised by a sudden decline of Corylus. In Switzerland it is also accompanied by a sudden increase in Pinus, Betula and Tilia.
After this perturbation Fraxinus started to expand in the region and reached its maximum expansion at around 6640 cal. BP (beginning of Firbas zone VII). The transition from the Atlantic to the Sub-Boreal period (Firbas zone VII to VIII) is usually defined by the mid-Holocene elm decline. This classical pollen stratigraphical feature is known from most pollen diagrams of Northwest Europe and is generally regarded to reflect the decline of elm populations because of the spread of a phytopathogenic disease at around 5850 cal. BP (cf. Parker et al., 2002; Peglar and Birks, 1993). In Lake Belau this feature spans more than 200 years. The decline starts shortly before 6000 cal. BP, at around c. 5850 cal. BP the elm curve declines further before constant low values are achieved at around 5780 cal. BP. The beginning of the elm decline coincides with increased microcharcoal values which can be interpreted as first clear evidence for human activity. This is based on the assumption that natural fires played no role in the deciduous Atlantic woodlands and might indicate that the elm population declined initially because of human activity, i.e. selective felling and/or pollarding. The further drop in the elm curve in the record of Lake Belau dating to 5850 cal. BP probably reflects the ‘classical elm decline’, i.e. the spread of a disease. Consequently, it is most likely that the pathogenic attack of the elm population was favoured by anthropogenic woodland disturbance. The end of the elm decline, used here to mark the Atlantic–Sub-Boreal transition, corresponds with the empirical boundary of Fagus. From c. 5600 cal. BP onwards classical indicators of human activity, such as Plantago lanceolata, Rumex acetosella-type and increased Poaceae values, are recorded and allow the identification of various periods of land-use intensification and woodland regeneration during the second half of the Holocene. The transition from the Sub-Boreal to the Sub-Atlantic period at around 2700 cal. BP, is marked by a distinct decline in Tilia and Fraxinus and increasing importance of anthropogenic indicators (Poaceae, R. acetosella-type, P. lanceolata). Fagus and Carpinus reach their maximum importance during a phase of woodland regeneration between 1550 and 1250 cal. BP (
With the beginning of the younger part of the Sub-Atlantic (Firbas zone X) at around 740 cal. BP (
Regarding the more recent period, it is noteworthy that according to the new results no pollen data are available for the period between
Tephrochronology
As tephra layers can provide an independent and precise chronological framework for bog and lake sediment records, the identification and precise dating of these layers is of central importance for the palaeoecological research community. Previously published age estimates for prehistorical volcanic eruptions in Northwestern Europe often differ considerably (cf. Figure 9). This is regarded to be, at least partially, the result of comparing records from different archive types and dating quality. In case of peat bogs, it is possible that, at least when bulk material is used for 14C dating, slightly too young age estimates are achieved because of decomposed root material. Furthermore, age estimates for tephra layers based on interpolation between 14C dates not only inherit the general uncertainties involved in 14C dating, but also do not consider possible changes in the sedimentation rate. Age estimates of the highest qualitative standard can be achieved, as in the present study, from laminated sediments. Unfortunately only few tephrochronological studies have been carried out on this type of sediment for central and northern Europe (e.g. Zillén et al., 2002; Zolitschka et al., 1995).
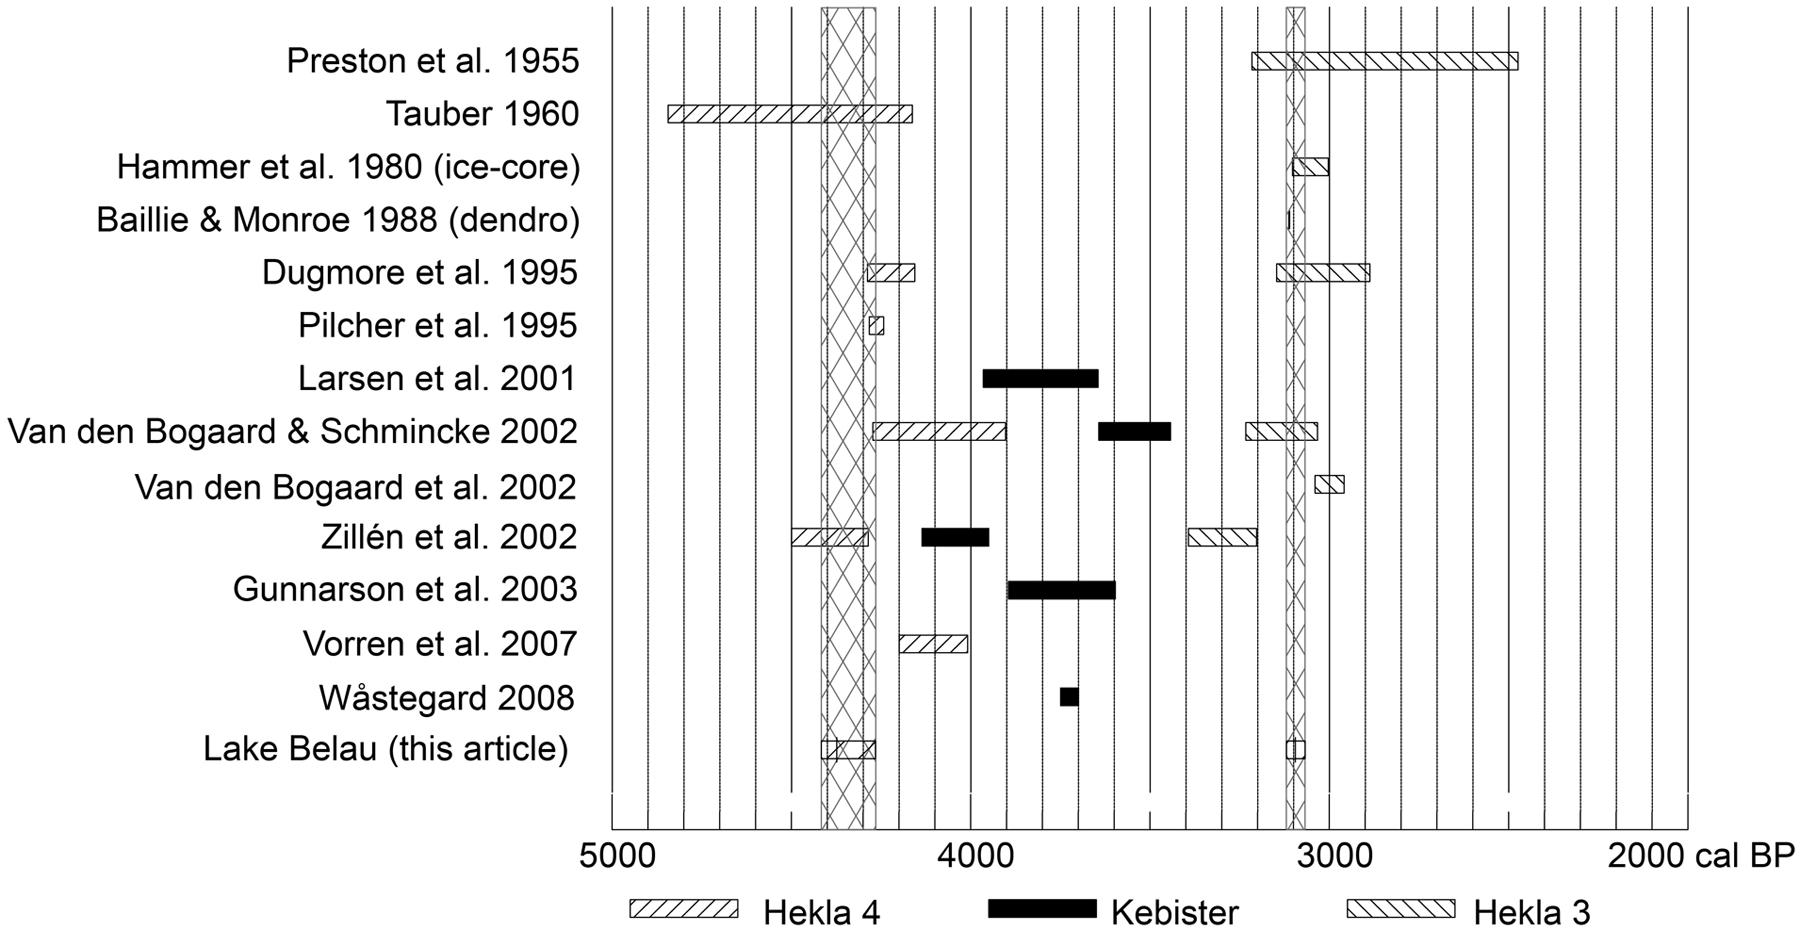
Comparison of dates for tephra layers from Northern Europe. Age ranges given as indicated in original publications. Vertical hatched bars indicate the 2s ranges of tephra layers dated in Lake Belau.
The most abundant tephra layer that may become an anchor for floating chronologies in Northwest Europe is the Hekla 4 eruption. Hekla 4 is one of the most widely distributed tephra layers in Northern Europe. Is has been recorded from several sites in Iceland (Tauber, 1960), Ireland (Pilcher et al., 1995), Scotland (Dugmore et al., 1995), Scandinavia (Vorren et al., 2007; Zillén et al., 2002) and Northern Germany (Van den Bogaard and Schmincke, 2002; Van den Bogaard et al., 2002).
Figure 9 shows datings for Hekla 4, Kebister and Hekla 3 tephra in chronological order of the publication. Thus Figure 9 also provides an overview of the research history of Northern Europe tephra layers. Regarding Hekla 4, Dugmore et al. (1995) used a collection of 14C dates originating from peat directly underlying and covering the tephra layer. Twenty-eight dates from Iceland and seven dates from Scotland were combined, giving an average date of 3826 ± 12 BP for Hekla 4. Calibration of this date with Oxcal 4.1 (Bronk Ramsey, 2008) gives a date of 4285–4153 cal. BP. According to a small plateau the calibrated date is much wider than the combined raw dates. Pilcher et al. (1995) used another approach to get a more precise date. They took a series of dates from the peat sequence of Sluggan Bog, Ireland, and tried to match them to the wiggles of the calibration curve. By this attempt they got a date of 4260 ± 20 cal. BP. Zillén et al. (2002) found the Hekla 4 tephra in two small laminated lakes in central Sweden. According to their age–depth model, based on a combination of varve counts and 14C dates of Lake Furskogstjärnet, they propose a date of 4390 ± 107 cal. BP. The second lake, Lake Mötterudsjärnet, according to figure 2 in Zillén et al. (2002) shows a slightly younger date around 4200 cal BP. In the sediments of Lake Belau Hekla 4 is dated to a median of 4374 cal. BP (2σ: 4417–4266 BP). Thus the new date fits best with the record from the laminated Lake Furskogstjärnet in Sweden, whereas the dates from peat bogs from Scotland, Ireland and Iceland tend to give younger results.
In Lake Poggensee, another recently reinvestigated site 32 km south of Lake Belau, a tephra layer was found at a depth of 1631–1635 cm. This layer is not yet analysed in higher resolution and for its chemistry. According to the time–depth model of the Poggensee it is dated to 4370 ± 150 cal. BP. This is in good agreement with Hekla 4 in Lake Belau but the origin of this volcanic eruption has to be verified by EMP analyses. Ongoing high-resolution pollen studies from Poggensee will allow a comparison with the pollen analytical results for human influence on the landscape development shown below.
Hekla 3 is the best recorded eruption in Northern Germany. In Scotland it is dated by Dugmore et al. (1995) to 2879 ± 34 BP. This gives a range of 3144–2884 cal. BP according to the Oxcal 4.1 calibration. Indirect evidence for the eruption is recorded from a reduction in the growth rate of Irish oaks (Baillie and Munroe, 1988) and from an acidity peak in the Greenland ice-core record (Hammer et al., 1980). If Baillie and Munro (1988) are right, and the reduction in the growth rate of Irish bog-oaks represents the Hekla 3 event, then the date would be 1159
The third tephra layer, which is chemically differentiated from the Hekla eruptions, is identified as Lairg B. According to the age model it dates to a median of 6848 cal. BP (2σ: 6930–6713 cal. BP). A date from peat bogs in Northern Ireland by Pilcher et al. (1996) gives a result of 6728–6564 cal. BP. Again the date that originated from peat gives a younger date than the lake record. Further studies to prove this aberration by comparison of tephra-dated horizons are planed.
Conclusions
The application of several independent methods allowed us to establish a robust chronology for the exceptionally well-laminated sediments of Lake Belau, Northern Germany. As well as AMS datings of terrestrial plant remains, the chronology is based on macroscopic varve counts. In the upper, partially unlaminated section the results of thin slide analyses and industrial heavy metal releases were used as additional age information in the modelling process. Compared with the previously used chronology of Wiethold (1998a), which in terms of absolute ages was only pollen stratigraphically dated, the new chronology suggests ages c. 260 yr older than previously assumed. This has consequences for the interpretation of the pollen record with reference to vegetation history and human impact. The presented new dates for tephra layers Hekla 3 (~3095 BP), Hekla 4 (~4374 BP) and Lairg B (~6848 BP) help to establish well-based age estimates for these volcanic eruptions, which can serve as synchronous marker horizons for the Quaternary and Holocene chronology in northwest Europe. A comparison with available dates from other localities reveals a remaining necessity for further dating of European tephra layers.
Footnotes
Funding
This research was funded by the German Science Foundation.