



Abstract
Time-series of varve properties and geochemistry were established from varved sediments of Lake Woserin (north-eastern Germany) covering the recent period AD 2010–1923 and the mid-Holocene time-window 6400–4950 varve years before present (vyr BP) using microfacies analyses, x-ray fluorescence (µ-XRF) scanning, microscopic varve chronology, and 14C dating. The microscopic varve chronology was compared with a macroscopic varve chronology for the same sediment interval. Calcite layer thickness during the recent period is significantly correlated to increases in local annual precipitation (r = 0.46, p = 0.03) and reduced air-pressure (r = −0.72, p < 0.0001). Meteorologically consistent with enhanced precipitation at Lake Woserin, a composite 500 hPa anomaly map for years with >1 standard deviation calcite layer thickness depicts a negative wave train air-pressure anomaly centered over southern Europe, with north-eastern Germany at its northern frontal zone. Three centennial-scale intervals of thicker calcite layers around the mid-Holocene periods 6200–5900, 5750–5400, and 5300–4950 vyr BP might reflect humid conditions favoring calcite precipitation through the transport of Ca2+ ions into Lake Woserin, synchronous to wetter conditions in Europe. Calcite layer thickness oscillations of about 88 and 208 years resemble the solar Gleissberg and Suess cycles suggesting that the recorded hydroclimate changes in north-eastern Germany are modified by solar influences on synoptic-scale atmospheric circulation. However, parts of the periods of thicker calcite layers around 5750–5400 and 5200 vyr BP also coincide with enhanced human catchment activity at Lake Woserin. Therefore, calcite precipitation during these time-windows might have further been favored by anthropogenic deforestation mobilizing Ca2+ ions and/or lake eutrophication.
Introduction
Although of smaller amplitude than during the last glacial, the contemporary interglacial ‘Holocene’ starting about 11,600 years ago is characterized by substantial climate variations (Denton and Karlen, 1973; Wanner et al., 2008). Similar to today, these climate variations occurred largely in a period of relative warmth and the absence of large ice sheets in the Northern Hemisphere. Therefore, they provide a basis for better understanding natural climate variations and distinguishing them from contemporary climate change (Steig, 1999).
Particularly, the mid-Holocene, including the transition from the so-called Thermal Optimum to the decline of mid- to high-latitude Northern Hemisphere temperatures toward ‘Neoglacial’ conditions around 5500 years ago, is a period of complex climate variability (Magny and Haas, 2004; Renssen et al., 2009). On one hand, paleoclimate records from Europe and the North Atlantic show continental-scale oscillations toward colder and wetter conditions around 5500–5300 yr BP (for details, see Magny and Haas, 2004). On the other hand, further paleoclimate archives from this region recorded a progressive cooling into Neoglaciation commonly associated with reductions in orbital forced Northern Hemisphere summer insolation (for details see: Magny and Haas, 2004). However, a successive reduction in insolation alone cannot explain mid-Holocene climate variations, and a comprehensive understanding of the related variability in space and time as well as the forcing mechanisms is limited because of a shortage of well-resolved paleoclimate records with precise chronologies.
Major aim of this study is a better understanding of mid-Holocene climate variability and its forcing mechanisms in the northern-central European lowlands. Therefore, we investigated the micro-sedimentological (microfacies) and geochemical features of the mid-Holocene annually laminated (varved) sediment record of Lake Woserin (north-eastern Germany) (Figure 1). Integrating both types of data allows a detailed understanding of the depositional mechanisms and, thereby, paleoclimate reconstruction (Brauer et al., 2009; Czymzik et al., 2015). For a more robust interpretation of the mid-Holocene paleoclimate record, the recent varve time-series from Lake Woserin was further compared with meteorological data from the nearby German Weather Service (DWD) stations Schwerin, Rostock, and Angermünde. For examining potential human influences on sedimentation in Lake Woserin, we compared our sedimentological and geochemical time-series with major changes in local anthropogenic land use (recent time-series) and a reconstruction of human catchment activity derived from a pollen record of the same sediment core (mid-Holocene time-series) (Feeser et al., this issue).
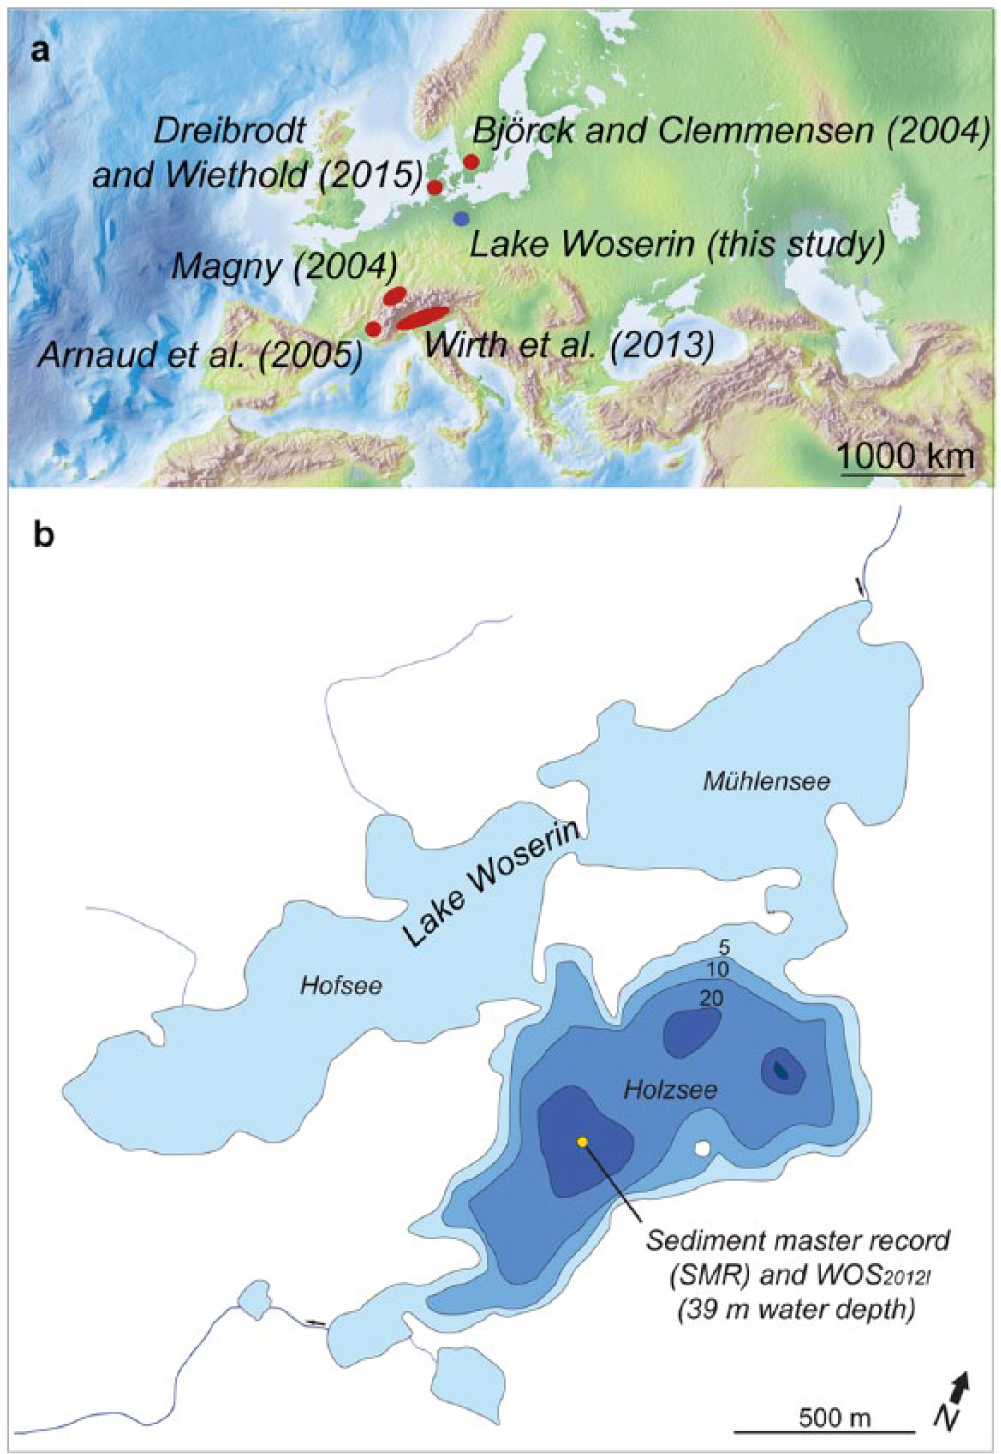
(a) Geographical position of Lake Woserin and location of the discussed paleoclimate records. (b) Map of Lake Woserin with bathymetry of the Holzsee subbasin and coring position of the sediment master record (SMR) and surface sediment core WOS2012I.
Study site
Lake Woserin is located in the Mecklenburg Lake District in north-eastern Germany (53°39′N, 12°01′E), at an elevation of 37.5 m a.s.l. (Figure 1). The dimictic hardwater lake has a surface area of 2.2 km2. A central island and shallow sills with less than 50 cm water depth divide Lake Woserin into the Holzsee, Mühlensee, and Hofsee subbasins (Figure 1) (Dreibrodt et al., 2003). The deepest part of Lake Woserin (39 m) is located in the Holzsee subbasin, which is surrounded by end moraine formations at its eastern and southern shores. Nowadays, Lake Woserin is traversed by the small creek Bresenitz, entering the lake at the north-eastern part of the Mühlensee subbasin and draining the lake in the south-western part of the Holzsee subbasin (Figure 1) (Dreibrodt et al., 2003). The catchment of Lake Woserin has a size of 75.8 km2 and is part of the Pomeranian terminal moraine.
Climate in the Lake Woserin region is characterized by its geographical position at the interface of maritime westerly airflow and continental blocking by high-pressure cells (Kottek et al., 2006). Meteorological data from the DWD stations Schwerin, Rostock, and Angermünde, located in a triangle around Lake Woserin, yield for the 30-year period AD 2010–1981 mean annual temperatures of about 9.1°C and mean annual precipitation sums of about 600 mm, with maxima from July to August.
Methods
Sediment coring and sediment master record
Three overlapping sediment cores (WOS A, B, C) consisting of 2 m segments were retrieved at a distance of a few meters from the deepest part of Lake Woserin in August 2012 using an Usinger piston corer (Figure 1). A continuous sediment master record (SMR) was constructed by visual correlation of macroscopic lithological layers in the overlapping parts of parallel core segments (Feeser et al., this issue). Surface sediment core (WOS2012I) was retrieved from the same coring position to provide a well-preserved sediment–water interface.
Chronology
A varve chronology was established by one investigator conducting two independent and continuous microscopic counts of distinct varves (MiVC) in the 205-cm-thick SMR interval between marker layers AG and AS, constraining the targeted mid-Holocene time-interval (Feeser et al., this issue). For millimeter-scale intervals of reduced varve preservation, which are distributed throughout the studied sediment interval, sedimentation rates were calculated using thickness measurements of adjacent well-preserved varves. The floating MiVC was tied to the absolute time-scale by means of an OxCal V-sequence model based on 14C ages of terrestrial plant macrofossils (Feeser et al., this issue). For a comparison with meteorological data (Czymzik et al., 2010; Kämpf et al., 2014), another varve chronology was constructed for surface sediment core WOS2012I using the same methodological approach.
Microfacies analyses
Microfacies analyses of seasonal to annual varve properties were carried out on overlapping series of large-scale petrographic thin-sections from the Lake Woserin SMR and surface sediment core WOS2012I using a ZEISS Axiolab polarization microscope at 12.5× to 500× magnification under various light and optical conditions. Thickness measurements were performed at 50× magnification for the SMR and 25× magnification for sediment core WOS2012I because of higher annual sedimentation rates. Varves with a second calcite sub-layer were noted. A varve quality index was recorded ranging from 3 (well-preserved varve) to 1 (disturbed varve).
Micro x-ray fluorescence scanning
Major element data for the studied SMR interval were measured from the same impregnated sediment blocks as used for thin-section preparation at 100 µm resolution (i.e. about 13 data points/varve) using an Eagle III XL x-ray fluorescence (µ-XRF) core scanner (Röntgenanalytik Meßtechnik GmbH). The spectrometer was equipped with an Rh low-power x-ray tube and a cooled Si–Li semiconductor detector. To reduce preferential atmospheric absorption of lighter elements, the measurements (35 kV, 300 mA, 60 s dwell time) were performed under vacuum. Continuous element profiles were constructed through correlation of sedimentological and geochemical properties in the overlapping parts of two consecutive sediment blocks. The depth-based µ-XRF data were transferred to the age-scale based on the geochemical features of 50 varve-dated marker layers and are expressed in counts per second (cps). Element data for sediment core WOS2012I were measured from the cleaned surface of a core half. The ITRAX µ-XRF device was running with a Cr–He tube and an energy-dispersive SSD detector and a step size of 200 µm (30 kV, 40 mA, 20 s dwell time). Element data are recorded in counts per measurement.
Wavelet analysis
Wavelet analysis was applied to the calcite layer time-series from the studied SMR interval. This technique decomposes non-stationary time-series into dominant modes of variability and identifies their temporal significance (Torrence and Compo, 1998). The analysis was carried out using the R software for statistical computing working with a Morlet mother wavelet.
Results
Microscopic varve chronologies
The floating MiVC for the studied SMR interval and surface sediment core WOS2012I span 1433 ± 29 and 88 + 1 years, respectively. For irregularly occurring millimeter-sized intervals of reduced varve preservation in the studied SMR interval, annual sedimentation rates were calculated using the mean thickness of the upper and lower well-preserved five varves. Comparing both independent microscopic varve counts for the SMR in 12 intervals between 13 lithological marker layers (ML AG–AS) (Figure 2) reveals counting uncertainties between 1% and 4%, with a mean of 2%. Both independent counts for surface sediment core WOS2012I provided the same amount of varves indicating a robust relative chronology.
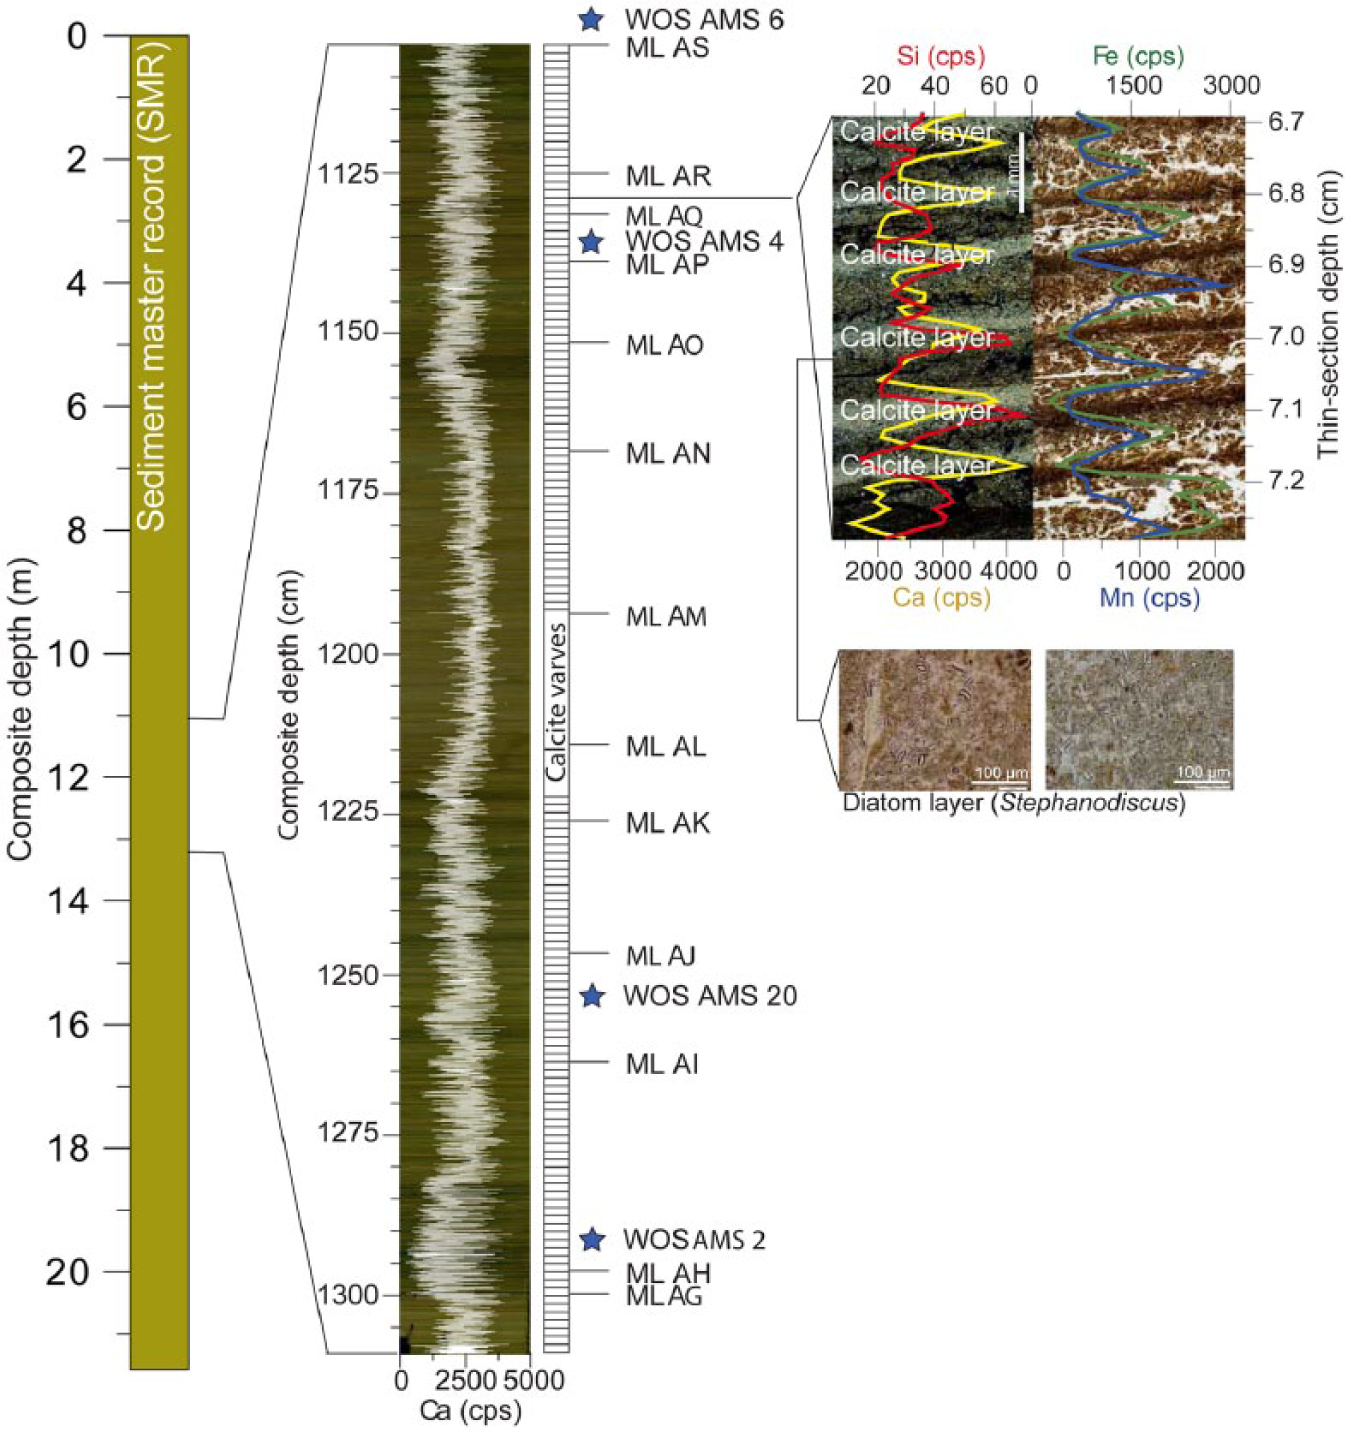
(Left) Length of the complete Lake Woserin sediment master record (SMR) and core photograph of the investigated interval from 11.05 to 13.10 m core depth with positions of lithological marker layers (ML) and samples extracted for AMS 14C dating. The core photograph is overlaid by µ-XRF data of the element Ca. (Right) Micrographs of calcite varves (polarized and plain light) with corresponding µ-XRF data of the elements Ca, Si, Fe, and Mn and micrographs of diatom layers.
Computing an OxCal V-sequence age–depth model based on 12 calibrated AMS 14C ages of terrestrial plant macroremains (Feeser et al., this issue) places the median age of the lithological marker AM, that is, the intermediate marker layer of the here studied SMR interval, to 5585 yr BP (−42/+22 years, 2σ uncertainties). Using this age as a tie point, the varve chronology for the studied SMR interval spans the period 6377–4945 (−35/+58) varve years before present (vyr BP). Considering that lake coring took place in AD 2012 and a slight chronological uncertainty (topmost varve preserved?), the recent varve record from sediment core WOS2012I covers the time-window AD 1923 + 1 (onset of recent varve formation) to 2010 + 1. This absolute dating of sediment core WOS2012I is within errors supported by a varve chronology from a previously dated Lake Woserin surface sediment core confirmed by 137Cs dating, placing the onset of recent varve formation to AD 1922 ± 1 (Dreibrodt et al., 2003).
Varve microfacies and geochemistry
The complete Holocene sediment stratigraphy of the SMR has a thickness of about 21.5 m and is varved for most of the record (Figure 2). This study focuses on the mid-Holocene sediment interval from 11.05 to 13.10 m composite depth (Figure 2). Onset of recent varve formation in surface sediment core WOS2012I occurs at a depth of 43 cm. Both investigated sediment intervals are composed of biochemical calcite varves comprising triplets of diatom, calcite, and organic sub-layers. Diatom layers are located directly below the calcite layers and composed of frustles of planctonic diatoms dominated by the taxon Stephanodiscus and some dispersed calcite crystals. Diatom layers are reflected by positive Si excursions and commonly interpreted as spring layers (Lotter and Lemcke, 1999) (Figure 2). Light calcite layers consist of calcite crystals and are reflected by increased Ca counts (Figure 2). Calcite layer formation in mid-latitude lakes usually takes place from late-spring to summer (Brauer et al., 2008; Brunskill, 1969; Kelts and Hsü, 1978; Lotter and Lemcke, 1999). Darker organic layers are made up of amorphous organic material and silt- to sand-sized plant remains as well as few planktonic and littoral diatoms (Figure 2). All materials are likely redeposited to the profundal of Lake Woserin by wave activity mainly in fall. The interpretation of organic layers as fall layers is supported by corresponding Fe and Mn peaks (Figure 2). In addition to spring, redox-driven precipitation of Fe and Mn can be triggered by O2 replenishment of bottom waters during mixing of the water column in fall (Davison, 1993).
Varve and seasonal layer thickness variations
The mid-Holocene varve record
Thickness measurements for the studied SMR interval have been performed for 1360 of 1433 varves (94.9%). For the remaining 73 varves (5.1%), varve preservation was reduced and sedimentation rates were calculated. Varve thickness varies between 0.5 and 3.1 mm, with a median of 1.3 mm (Figure 3). Varve quality is reduced from 6200 to 6000, 5700 to 5250, and 5050 to 4950 vyr BP (Figure 4). Diatom layers range in thickness from 0.1 to 1.9 mm, with a median of 0.4 mm. During the 156 ± 3 year interval from 6327 to 6172 (+35/−58) vyr BP, no diatom layers are preserved in 141 varves and diatoms depict distinct dissolution features in 15 varves. Shifts from varves with a diatom layer to varves without a diatom layer occur from one year to the next. Median calcite layer thickness of 0.2 mm is about a factor of 2 smaller than median diatom layer thickness. The thinnest calcite layer is 0.1 mm and the thickest calcite layer is 0.7 mm thick. Multi-centennial intervals of increased calcite layer thickness occur from 6200 to 5900, 5750 to 5400, and 5300 to 4950 vyr BP (Figure 3). From 6200 to 5800 vyr BP, calcite layers are frequently characterized by a sub-division into a lower and upper layer (Figure 4). Wavelet analysis indicates calcite layer thickness oscillations of about 88 and 208 years (Figure 5). Fall layer thickness varies between 0.1 and 1.4 mm, with a median thickness of 0.6 mm (Figure 3).

Seasonal to annual varve properties for the investigated part of the Lake Woserin SMR: (a) total varve thickness, (b) diatom layer thickness, (c) calcite layer thickness, (d) organic layer thickness, and (e) occurrence of varves with and without diatom layers.

Comparison of microscopic (MiVC) and macroscopic (MaVC) varve counts in 12 intervals between 13 marker layers: (a) absolute varve counts, (b) absolute differences between MiVC and MaVC, (c) relative differences between MiVC and MaVC, (d) number of ⩾3-year interpolated sections, (e) varve quality index, and (f) occurrence of additional calcite sub-layers.
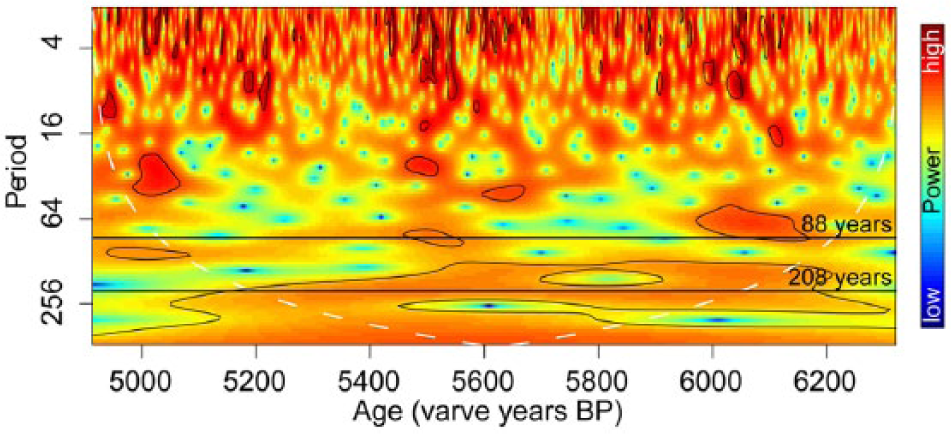
Continuous wavelet spectrum for the calcite layer thickness time-series from the investigated SMR interval of Lake Woserin. Darker colors represent higher spectral power. Contoured areas exceed 95% confidence levels against a red noise spectrum.
The recent varve record
Median, minimum, and maximum sub-layer and varve thicknesses of the 88 varves in surface sediment core WOS2012I are distinctly larger than in the mid-Holocene part of the SMR (Figure 6). Median thickness is 4.6 mm for varves, 2.5 mm for diatom layers, 0.5 mm for calcite layers, and 1 mm for organic layers. All types of layers show a rapid thickness increase during the middle of the 20th century, except for calcite layers (Figure 6).
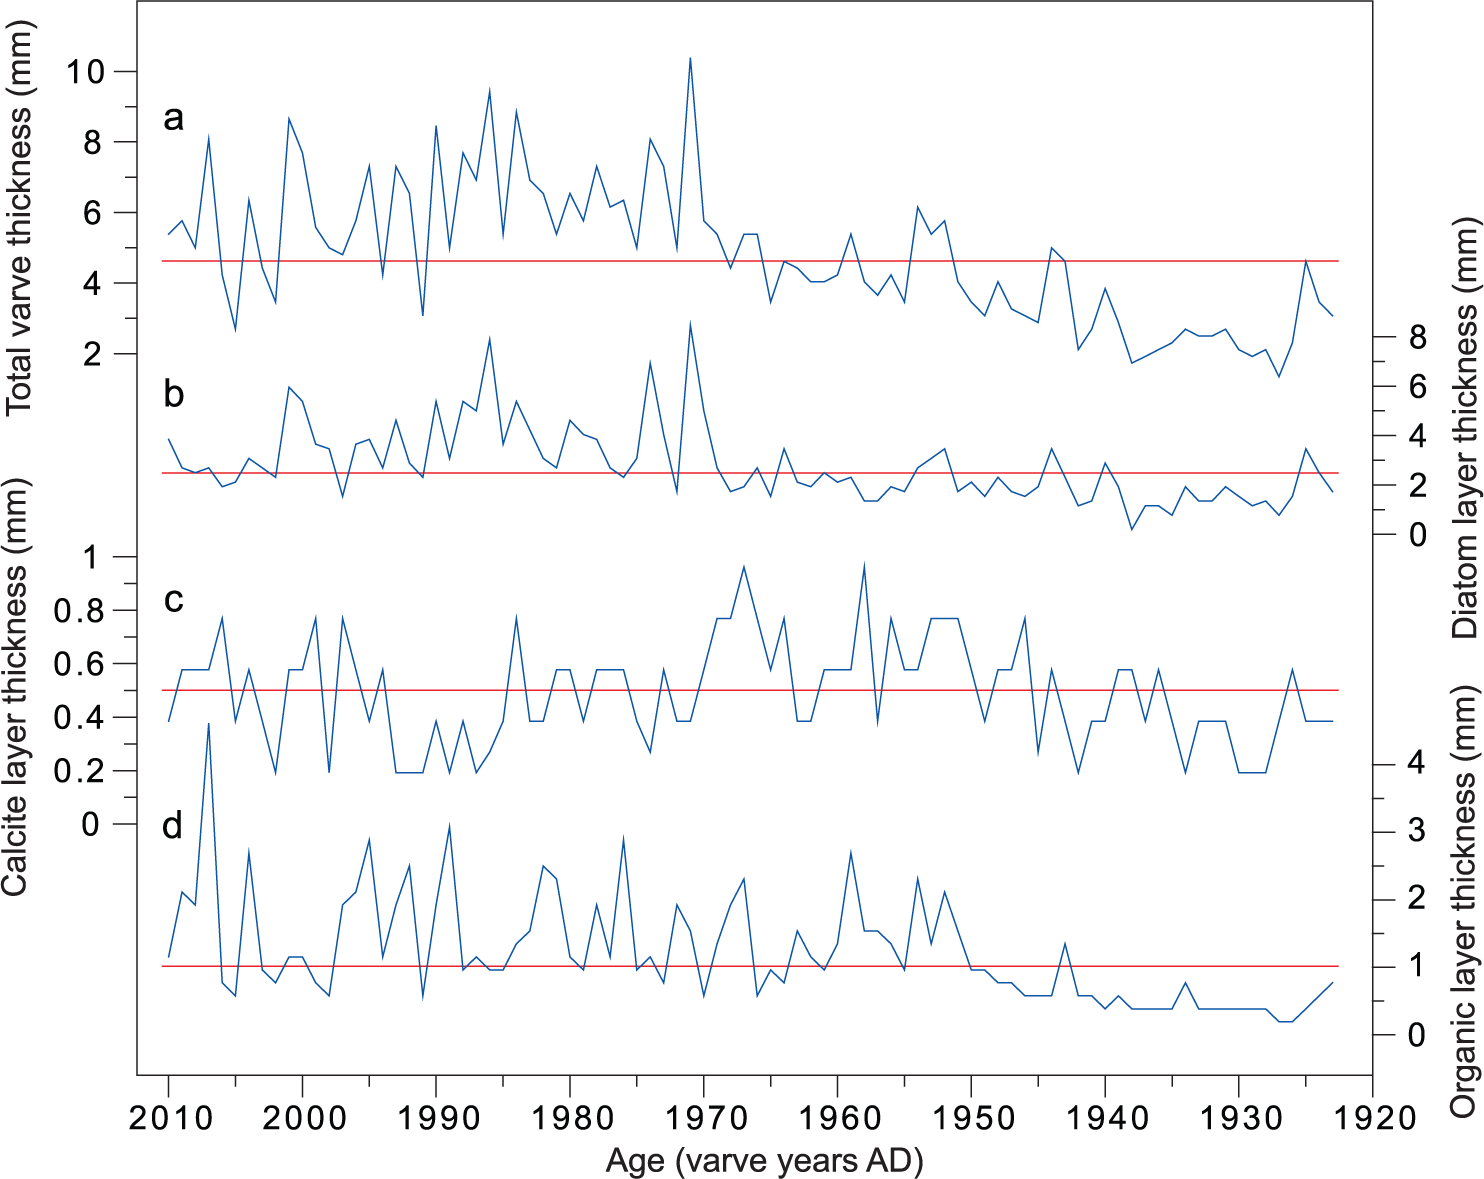
Annual to seasonal layer thickness in surface sediment core WOS2012I: (a) total varve thickness, (b) diatom layer thickness, (c) calcite layer thickness, and (d) organic layer thickness.
Discussion
Comparing the microscopic and macroscopic varve chronologies
Varved lake sediments provide precise chronologies. However, multiple varve chronological approaches exist that all provide their own advantages and disadvantages (Ojala et al., 2012). To search for counting differences and their potential origin, the MiVC was compared with a macroscopic varve chronology (MaVC) constructed within the same 12 varve intervals between 13 marker layers (ML AG–AS) (Figure 2). The MaVC was established by two investigators conducting macroscopic varve counts on core photographs (Feeser et al., this issue). In case of disturbed sediment sections in one core segment, varve counts were performed using a parallel core segment (Feeser et al., this issue).
Comparing varve counts in both types of chronologies indicates that MiVC reveals between 1% and 10% higher counts (mean 5%) in six varve intervals and MaVC reveals between 2% and 8% higher counts (mean 5%) in five varve intervals. In one varve interval, MiVC and MaVC yield identical counts (Figure 4). To search for systematics behind these differences, varve counts in the MiVC and MaVC were compared with the number of disturbed (interpolated) sediment sections ⩾3 years, as seen in the MiVC (Figure 4). Interestingly, all five varve intervals in which MaVC provided higher counts include at least one ⩾3-year interpolated sediment section, and none of the six varve intervals in which MiVC provided higher counts include ⩾3-year interpolated sediment sections (Figure 4). These results suggest that (1) MiVC reveals about 5% more varves in regularly varved sediment intervals and (2) MaVC might tend to overestimate the number of varves in disturbed sediment sections. An explanation for the overestimation of varves in disturbed sediment sections by MaVC could be a slight mixing of seasonal sub-layers caused by water turbulences at the lake floor inducing ‘non-annual’ macroscopic sediment features. Such features can be detected using MiVC and would likely occur on a spatial scale that affects all three sediment cores used for constructing the SMR. An underestimation of varves in disturbed sediment sections by the MiVC is also thinkable. However, considering the objective interpolation procedure (thickness measurements of upper and lower five varves), a systematic underestimation of varves by the MiVC is very unlikely. Comparing the MiVC and MaVC to the occurrence of varves with a second calcite sub-layer and a varve quality index provided no consistent patterns (Figure 4).
Calcite layer deposition in Lake Woserin
Calcite precipitation in mid-latitude lacustrine environments commonly occurs in the epilimnion during late-spring and summer as a result of calcite saturation due to CO2 depletion induced by photosynthesizing algae and increasing water temperatures (Kelts and Hsü, 1978). Additionally, warmer water temperatures directly reduce the solubility of calcite and might cause calcite precipitation after the lake overturning in spring, when cold bottom waters warm in the epilimnion (Brunskill, 1969). In either case, the amount of precipitated calcite is dependent on the availability of Ca2+ ions transported into the lake by surface runoff and/or groundwater-fed sub-aquatic springs (Brunskill, 1969; Kelts and Hsü, 1978). Thereby, Ca2+ transport through sub-aquatic springs might be of particular importance for Lake Woserin because of its position in the Pomeranian terminal moraine comprising large amounts of unconsolidated sediments. In the following, we will first discuss possible indications of climate variations and, then, evaluate potential human signals in the recent and mid-Holocene calcite layer time-series from Lake Woserin.
Climate signals in the recent calcite layer time-series
For a better understanding of calcite precipitation in Lake Woserin, the recent calcite layer thickness time-series was compared with annual, March–May (MAM), and June–August (JJA) precipitation, air-pressure, and temperature composites (averages) from the DWD stations Schwerin (40 km west of Lake Woserin), Rostock (50 km north of Lake Woserin), and Angermünde (150 km southeast of Lake Woserin) for the period AD 2010–1954 (Figure 7). Three weather stations around Lake Woserin were chosen to construct more regional meteorological records. Wind speed composites for the period AD 2010–1954 were calculated using solely data from the stations Schwerin and Rostock since continuous wind speed measurements for that time-window are not available from the station Angermünde. For the period AD 1953–1923, the calcite layer thickness time-series was compared with meteorological data from the station Schwerin alone, due to the limited temporal coverage of the records from Rostock and Angermünde (Figure 7). All datasets were filtered with a 5-year running mean to account for potential slight chronological uncertainties in the calcite layer time-series (see section ‘Microscopic varve chronologies’) and reduce noise. The datasets were linearly detrended to minimize autocorrelation and emphasize sub-decadal variations. The significance of correlations between meteorological observations and calcite layer thickness was estimated using a ‘random phase test’ (Ebisuzaki, 1997). This test is designed for autocorrelated datasets and thus takes into account the effects of the applied 5-year running mean and detrending.
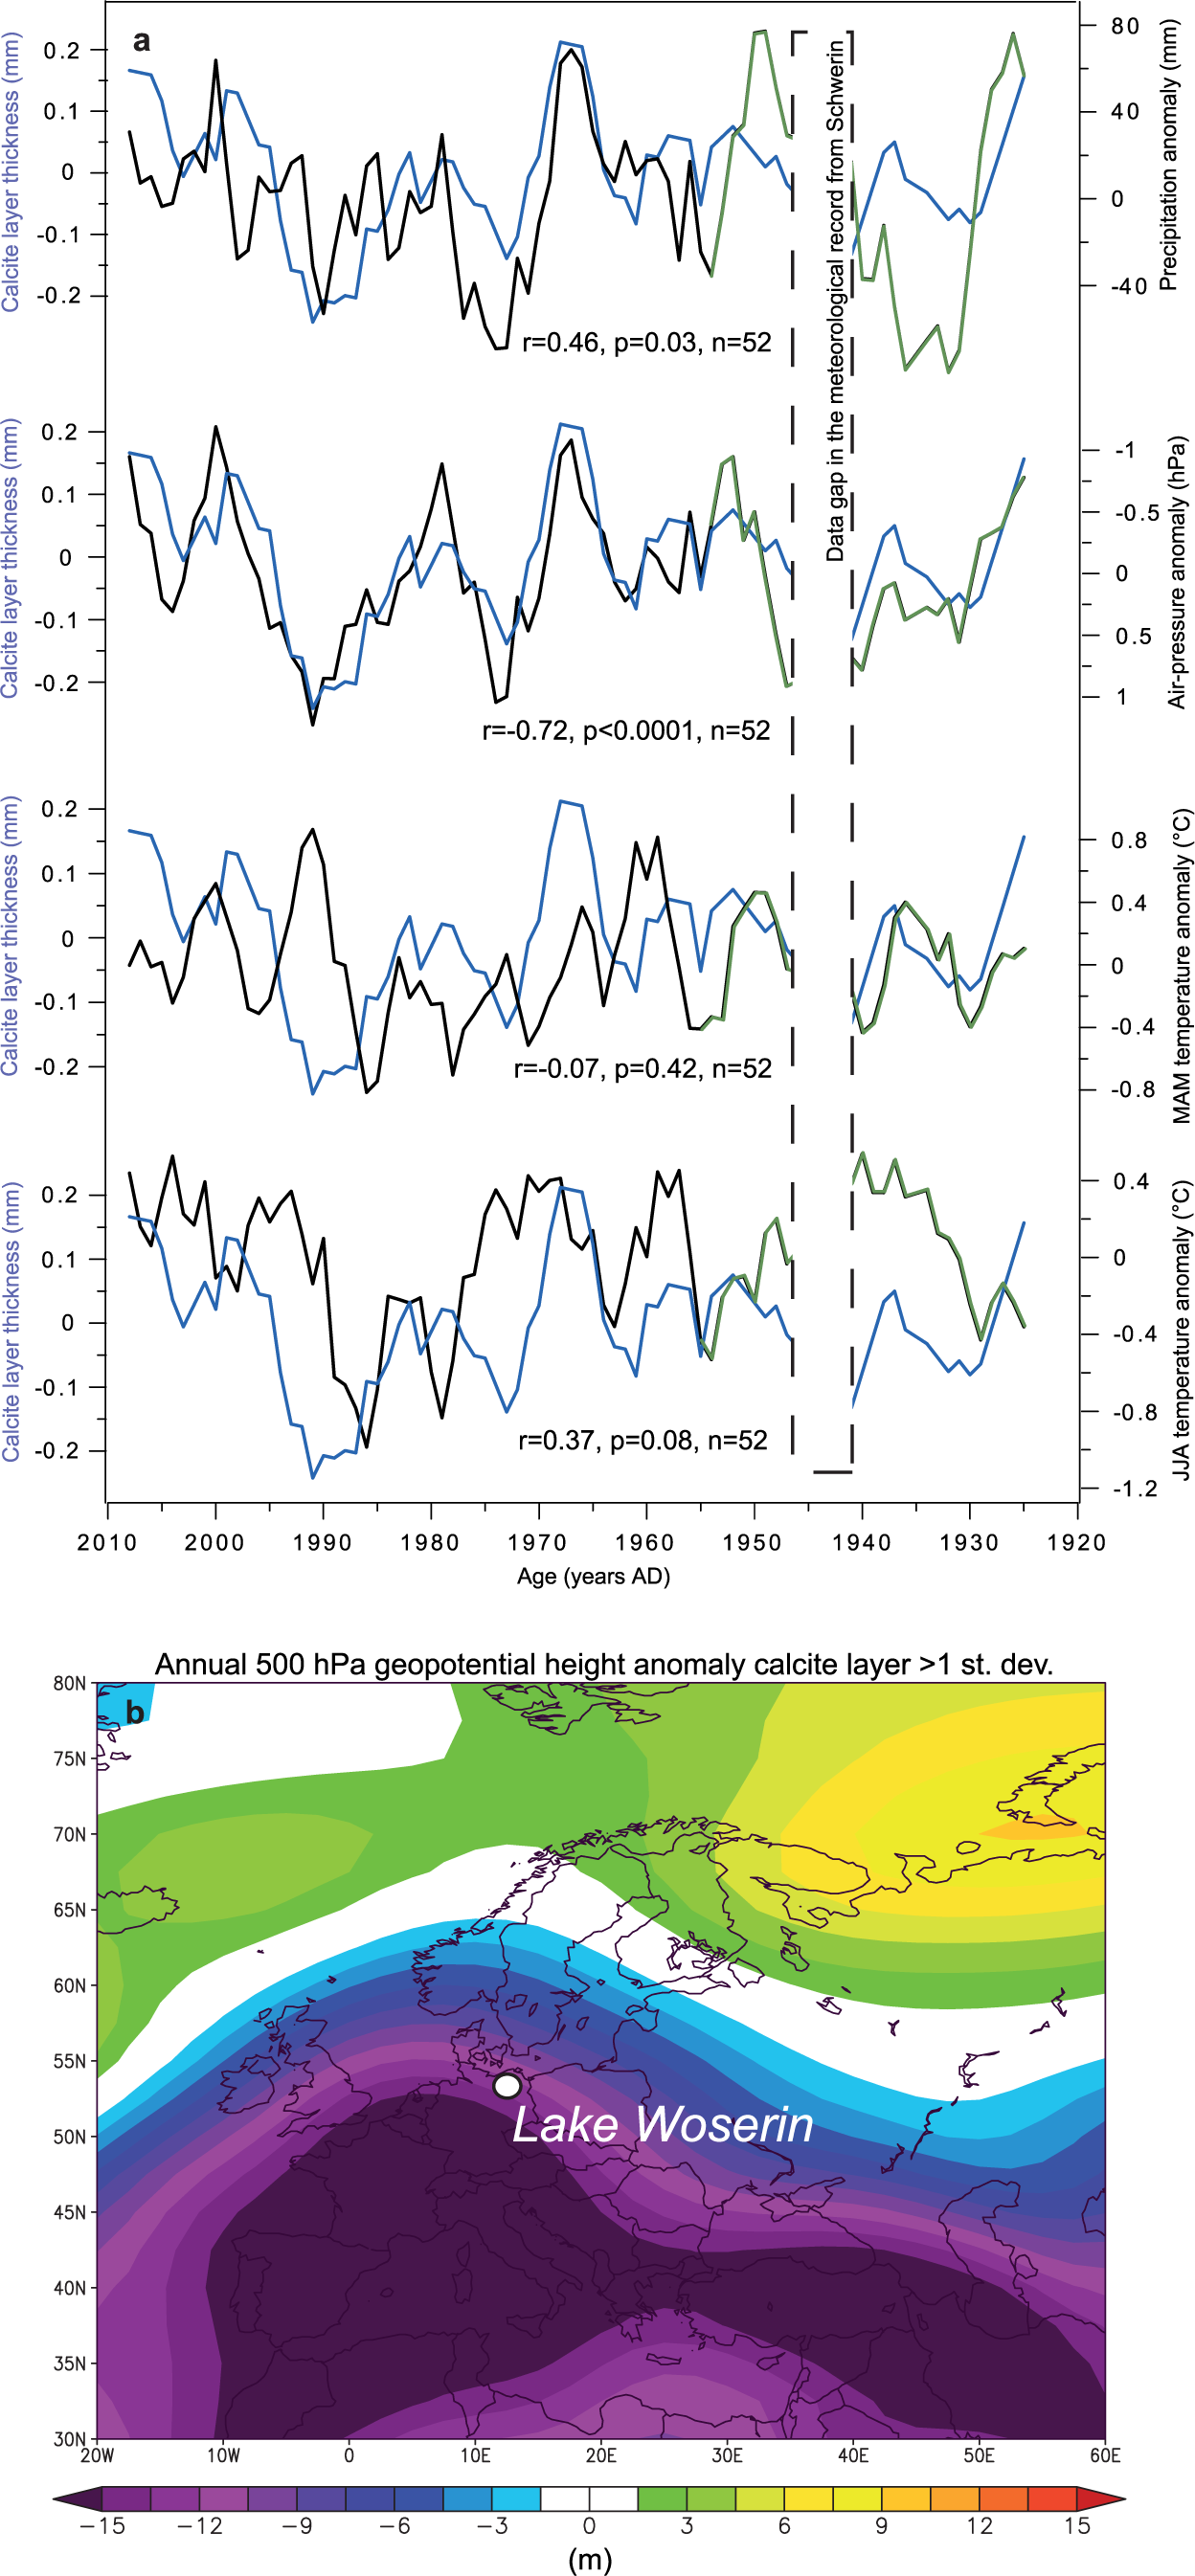
(a) Correlation of calcite layer thickness in surface sediment core WOS2012I with annual precipitation and air-pressure composites as well as MAM and JJA temperature composites from the meteorological stations Schwerin, Rostock, and Angermünde for the period AD 2010–1954 (black lines). The period AD 1953–1923 is covered by precipitation, air-pressure, and temperature data from the station Schwerin alone, due to the longer record (green lines). To reduce the effects of slight chronological uncertainties in the calcite layer time-series and noise, the data were smoothed with a 5-year running mean. To reduce the effects of autocorrelation and emphasize sub-decadal variability, all records were linearly detrended. The p-values were calculated using the random phase test (Ebisuzaki, 1997). (b) 500-hPa height anomaly composite for years during the recent period AD 2010–1923 when calcite layer thickness is above 1 standard deviation. The reference period is AD 2010–1981. The 500-hPa data are from the NCEP/NCAR reanalysis database (Kalnay et al., 1996). From 15 years with >1 standard deviation calcite layer thickness, 14 years were used for calculating the 500-hPa composite map since they were within the temporal range of the NCEP/NCAR reanalysis data.
Calcite layer thickness in recent Lake Woserin sediments is significantly correlated to the annual precipitation (r = 0.46, p = 0.03, n = 52) and air-pressure composites (r = −0.72, p > 0.0001, n = 52) for the period AD 2010–1954. From AD 1953 to 1923, the calcite layer time-series resembles trends in precipitation and air-pressure at the station Schwerin (Figure 7). These correlations suggest that calcite precipitation in Lake Woserin during late-spring and summer might be favored by enhanced annual precipitation related to low air-pressure anomalies increasing the transport and storage of Ca2+ ions in the water body. A correlation between thicker calcite layers and increased precipitation, particularly during summer, was also found for the recent varve record of Lake Baldeggersee in Switzerland (Lotter and Birks, 1997).
Calculating a 500-hPa composite map for years when calcite layer thickness is >1 standard deviation based on NCEP/NCAR reanalysis data (Kalnay et al., 1996) supports this weather scenario for thicker calcite layers (Figure 7). The resulting configuration of atmospheric circulation depicts a distinct wave train low pressure anomaly over southern Europe reaching from the Bay of Biscay over the northern Mediterranean to the Caspian Sea (Figure 7). Lake Woserin’s location at the northern frontal zone of the low pressure anomaly is meteorologically consistent with increased precipitation (Figure 7).
Further correlations between calcite layer thickness and seasonal to annual wind speed and temperature composites are all insignificant (Figure 7, Table 1), except for JJA temperatures (r = 0.37, p = 0.08, n = 52). However, this correlation is weaker than those between calcite layer thickness and annual precipitation and, particularly, air-pressure (Table 1). Therefore, although JJA temperatures might have an effect, the dominant driver of changes in recent calcite layer thickness in Lake Woserin are likely changes in annual precipitation.
Correlations between calcite layer thickness in surface sediment core WOS2012I and annual (ANN), March to May (MAM), and June to August (JJA) precipitation, air-pressure, temperature, and wind speed composites from the meteorological stations Schwerin, Rostock, and Angermünde.
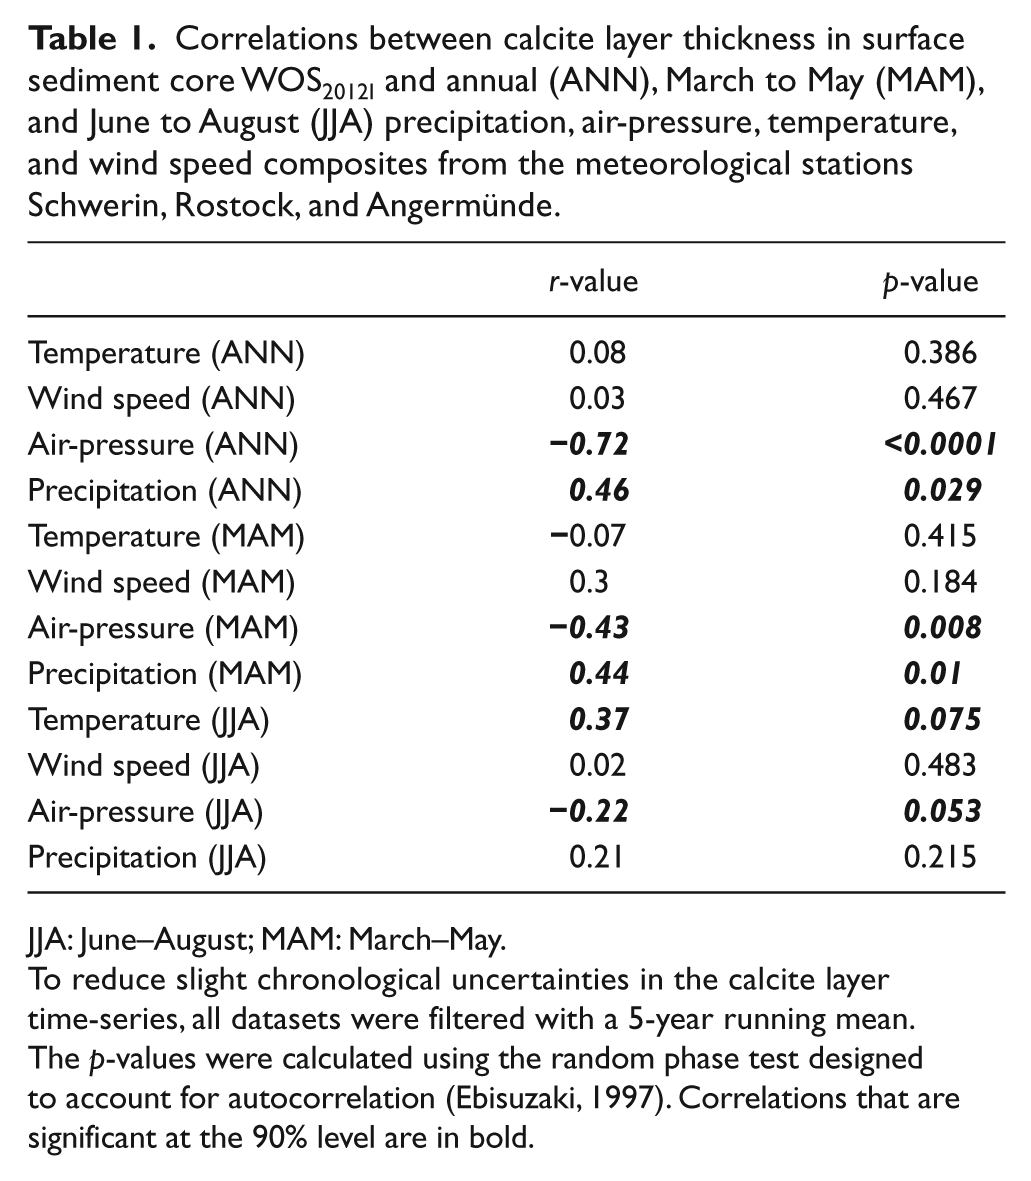
JJA: June–August; MAM: March–May.
To reduce slight chronological uncertainties in the calcite layer time-series, all datasets were filtered with a 5-year running mean. The p-values were calculated using the random phase test designed to account for autocorrelation (Ebisuzaki, 1997). Correlations that are significant at the 90% level are in bold.
Climate signals in the mid-Holocene calcite layer time-series
European climate during the mid-Holocene is expected to vary substantially (Magny and Haas, 2004; Steig, 1999). Most distinctive features of the mid-Holocene Lake Woserin calcite layer record are centennial-scale periods of thicker calcite layers around 6200–5900, 5750–5400, and 5300–4950 vyr BP (Figure 8), which are also reflected by higher Ca counts. The significant statistical link between thicker calcite layers and increased precipitation related to reduced air-pressure during the recent period (Figure 7) allows speculating that also the centennial-scale periods of thicker calcite layers during the mid-Holocene are caused by a higher input of Ca2+ ions during humid climate conditions. A connection between increases in humidity and enhanced calcite precipitation was also proposed for Lake Belau in northern Germany on multi-decadal to centennial time-scales (Dreibrodt and Wiethold, 2015) and for Lake Baldeggersee in Switzerland during recent times (Lotter and Birks, 1997).
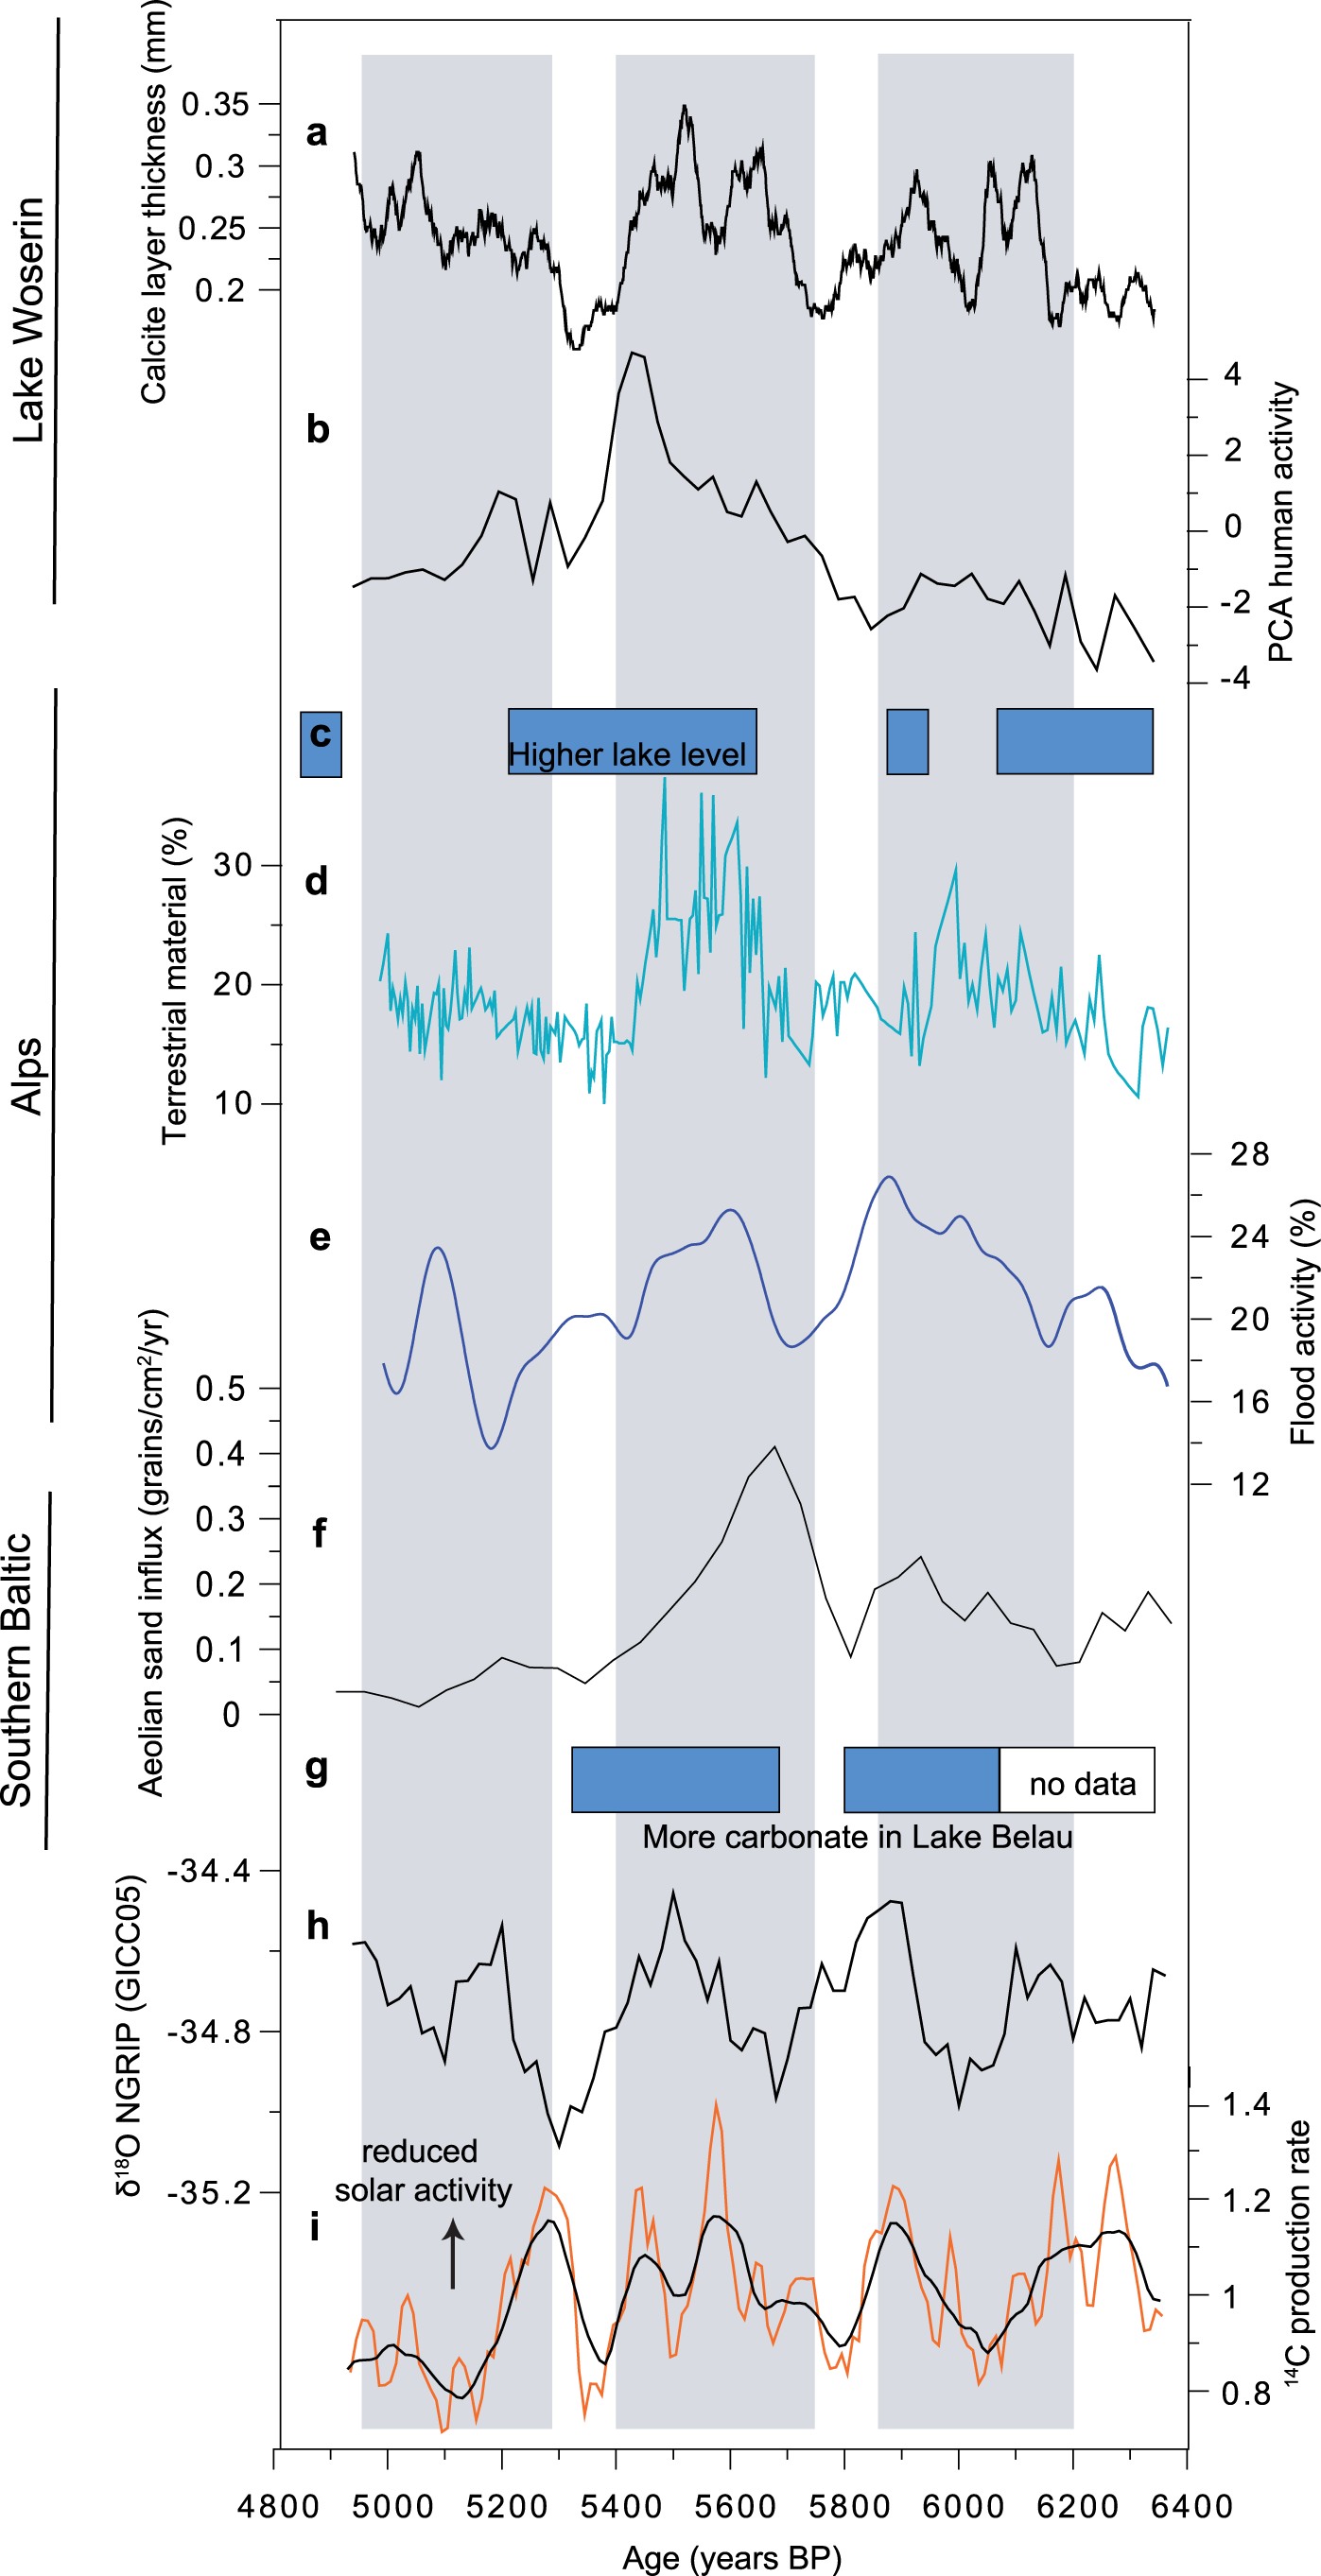
Mid-Holocene proxy records from Lake Woserin and paleoclimate time-series: (a) calcite layer thickness from Lake Woserin filtered using a 31-year running mean, (b) pollen-based reconstruction of human activity in the Lake Woserin catchment from the SMR (Feeser et al., this issue), (c) periods of higher lake levels in the peri-alpine region (Magny, 2004), (d) percentage of terrestrial material in a sediment core from Lac le Bourget (Arnaud et al., 2005), (e) flood activity in the southern Alps (Wirth et al., 2013), (f) aeolian sand influx in a raised bog from south-western Sweden (Björck and Clemmensen, 2004), (g) periods of higher carbonate precipitation in Lake Belau sediments (Dreibrodt and Wiethold, 2015), (h) δ18O in the Greenland NGRIP ice core (Vinther et al., 2006), and (i) 14C production rates reflecting solar activity variations (Muscheler et al., 2007). (e, h and i) The datasets are smoothed to reflect centennial-scale variability as seen in the Lake Woserin calcite layer time-series.
However, in addition to precipitation, calcite deposition in Lake Woserin might be favored by strengthened algae blooms increasing lake water pH through CO2 assimilation (Kelts and Hsü, 1978). Comparing the recent and mid-Holocene calcite layer and diatom layer thickness time-series from Lake Woserin might provide an estimate of this influence. On one hand, periods of thicker calcite layers around 6200–5900 and 5750–5400 vyr BP are accompanied by intervals of thicker diatom layers (Figure 3). On the other hand, thicker calcite layers during the recent period and from 5300 to 4950 vyr BP do not coincide with thicker diatom layers (Figures 3 and 6). Therefore, although diatom blooms might have contributed to the increases in calcite layer thickness from 6200 to 5900 and 5750 to 5400 vyr BP, they do not seem to be necessary to form thicker calcite layers.
Centennial-scale humid periods at Lake Woserin reflected by increases in calcite layer thickness around 6200–5900 and 5750–5400 vyr BP coincide with periods of higher lake levels in the peri-alpine Jura Mountains (Figure 8) (Magny, 2004). Periods of higher lake levels reflect increases in mean annual precipitation as well as intensified mid-latitude cyclones (Magny, 2004), pointing to a wider spatial significance of the recorded climate signal from Lake Woserin. The exceptional length and amplitude of the humid period at Lake Woserin from 5750 to 5400 vyr BP are also present in the lake level record (Magny, 2004). Further indications of more humid climate conditions and intensified mid-latitude cyclones in the alpine region during the humid periods at Lake Woserin around 6200–5900 and 5750–5400 vyr BP are provided by coinciding increases in detrital matter flux in a sediment core from Lac le Bourget reflecting enhanced fluvial activity of River Rhône (Arnaud et al., 2005) and higher flood frequencies recorded as a higher occurrence of detrital layers in lake sediment records from the southern Alps (Wirth et al., 2013) (Figure 8).
A synoptic-scale relevance of the humid periods at Lake Woserin around 6200–5900 and 5750–5400 vyr BP is signified by the further coincidences with periods of increased aeolian sand influx in the Hyltemossen peat bog in southwest Sweden and higher carbonate contents in sediments from Lake Belau in northern Germany (Björck and Clemmensen, 2004; Dreibrodt and Wiethold, 2015) (Figure 8). Both increases in aeolian sand influx and higher carbonate contents are interpreted to reflect a moister climate in the southern Baltic region on multi-decadal to centennial time-scales (Björck and Clemmensen, 2004; Dreibrodt and Wiethold, 2015). Additionally, higher aeolian sand influx in the Hyltemossen bog is related to intensified cyclones (Björck and Clemmensen, 2004).
A spatial differentiation in European hydroclimate seems to occur during the humid period at Lake Woserin around 5300–4950 vyr BP (Figure 8). While climate in the alpine region during that period is characterized by enhanced precipitation and intensified cyclones (Arnaud et al., 2005; Magny, 2004; Wirth et al., 2013), it is dryer and less cyclonic in the southern Baltic (Björck and Clemmensen, 2004; Dreibrodt and Wiethold, 2015) (Figure 8). One potential explanation for this divergent hydroclimate pattern around 5300–4950 vyr BP might be a more southward trajectory of the mid-latitude storm tracks, transporting moisture to the location of Lake Woserin and into the Alps, but limiting transport of moisture to the southern Baltic (Figure 1). The chronological offset of the shorter lake level increase around 4850 yr BP to the humid period at Lake Woserin starting 4950 vyr BP might be explained by chronological uncertainties in both records and/or time-transgressive climate variability (Figure 8).
Furthermore, all three centennial-scale humid periods at Lake Woserin are accompanied by higher δ18O values in the Greenland NGRIP ice core, indicative of warmer temperatures mainly during winter (Vinther et al., 2006) (Figure 8). Modern climate teleconnection patterns are characterized by an atmospheric seesaw. It is wetter in Europe when it is warmer in Greenland (Van Loon and Rogers, 1978). The coincidence between warmer temperatures in Greenland and humid periods at Lake Woserin suggests that a similar teleconnection pattern might have been active during the mid-Holocene. However, while the temperature signal in δ18O from the NGRIP ice core is valid mainly for winter, calcite precipitation in Lake Woserin occurs in late-spring and summer. This apparent contradiction can be reconciled accepting that the thickness of a calcite layer is controlled by the amount of Ca2+ ions transported into Lake Woserin throughout the year. A further modern teleconnection reveals a temperature seesaw between Greenland and Europe (Van Loon and Rogers, 1978). Therefore, it is unlikely that warming in Greenland coincides with warming at Lake Woserin favoring calcite precipitation.
It has been argued that periods of higher lake levels and flood frequency in the Alps as well as storminess in southern Sweden, coinciding with more humid conditions in the Lake Woserin region during the mid-Holocene (Figure 8), could be related to reductions in solar activity (Björck and Clemmensen, 2004; Magny, 2004; Wirth et al., 2013). Although the graphical correlation is ambiguous (Figure 8), wavelet analysis indicates calcite layer thickness oscillations of about 88 and 208 years, resembling the solar Gleissberg and Suess cycles (Stuiver and Braziunas, 1989) (Figure 5). These common oscillations might suggest that the recorded increases in humidity at Lake Woserin are, at least on centennial time-scales, driven by varying solar activity. The underlying physical mechanism could be the so-called Top-Down effect of changes in solar UV irradiation on ozone production, heating, and circulation in the stratosphere. These disturbances are expected to modify tropospheric circulation and the latitudinal position of the mid-latitude cyclones over the North Atlantic and Europe (Haigh, 1996; Ineson et al., 2011).
Human signals in the recent calcite layer time-series
In addition to climate, calcite precipitation in lakes can be favored by anthropogenic eutrophication (Kienel et al., 2013). Besides agriculture, two main factors that might induce trends in anthropogenic eutrophication in Lake Woserin during the recent period are (1) a trout farm in the Hofsee subbasin and (2) the successive connection of the population to sewage plants:
(1) A trout farm that was operated in the Hofsee subbasin of Lake Woserin until the early 1990s likely released nutrients into the water body, potentially favoring eutrophication and consequently calcite precipitation. However, during the early 1990s calcite layer thicknesses were among the thinnest throughout the recent period (Figure 6). Therefore, nutrient input into Lake Woserin by the trout farm likely had no influence on calcite precipitation. The absence of a relation between trout farming and calcite precipitation might be explained by restricted water exchange between the Hofsee and Holzsee subbasins due to the dividing sills.
(2) The percentage of the population that is connected to a sewage plant in the Lake Woserin region increased from 64% in 1990 to 85% in 2008 (Department of Agriculture, Environment and Consumer Protection, Mecklenburg-Vorpommern, 2008). This increasing trend should have caused a consecutive reduction in eutrophication and calcite precipitation in Lake Woserin. However, calcite layer thickness rather increases between 1990 and 2012 (Figure 6). Therefore, the connection of households to sewage plants had no detectable effects on calcite precipitation in Lake Woserin. To conclude, no coincidences between major changes in anthropogenic catchment activity at Lake Woserin and calcite layer thickness suggest that calcite precipitation in Lake Woserin during the recent period is not susceptible to human catchment interferences.
Human signals in the mid-Holocene calcite layer time-series
Comparing the mid-Holocene calcite layer thickness time-series to a pollen-based reconstruction of human catchment activity from the SMR (Feeser et al., this issue) allows evaluating the effects of human activity on calcite precipitation in Lake Woserin during the mid-Holocene. From three centennial-scale periods of thicker calcite layers around 6200–5900, 5750–5400, and 5300–4950 vyr BP, thicker calcite layers around 5750–5400 and 5200 vyr BP (the older part of the period of thicker calcite layers around 5300–4950 vyr BP) coincide with times of enhanced human activity in the Lake Woserin catchment (Figure 8). Therefore, human activity in the Lake Woserin catchment might have contributed to thicker calcite layers around 5750–5400 and 5200 vyr BP. Potential mechanisms for human-induced increases in calcite layer thickness are a higher mobility of Ca2+ ions as a consequence of forest clearances and/or increased biochemical calcite precipitation due to increased nutrient availability. The interpretation of calcite precipitation in Lake Woserin as occasionally influenced by both human activity and climate variability is consistent with the results reported by Feeser et al. (this issue).
Conclusion
Time-series of calcite varves comprising spring diatom, summer calcite, and fall organic sub-layers were established from sediments of Lake Woserin for the recent period AD 2010–1923 and the mid-Holocene time-interval 6400–4950 vyr BP using microfacies analyses, µ-XRF scanning, microscopic varve chronology, and AMS 14C dating.
Comparing the microscopic varve chronology with a varve chronology established by macroscopic varve counts on core photographs yields that (1) microscopic varve counting provides on average 5% more years in sediment intervals with well-preserved varves and (2) macroscopic varve counting provides on average 5% more varves in sediment intervals with ⩾3-year interpolated sediment sections.
Calcite layer thickness during the recent period exhibits significant correlations with local annual precipitation sums and air-pressure. Meteorologically consistent with increased precipitation and reduced air-pressure, a 500-hPa anomaly map for years when calcite layer thickness is >1 standard deviation depicts a distinct negative wave train pressure anomaly over southern Europe with Lake Woserin at its northern frontal zone. Centennial-scale increases in calcite layer thickness during the mid-Holocene around 6200–5900, 5750–5400, and 5300–4950 vyr BP are interpreted to reflect humid periods at Lake Woserin. Humid periods at Lake Woserin around 6200–5900 and 5750–5400 vyr BP coincide with increases in precipitation and intensified cyclones in the alpine region and southern Baltic, pointing to a synoptic-scale relevance of the recorded hydroclimate signal and a strengthened storm track. However, while during the humid period at Lake Woserin around 5300–4950 vyr BP climate remains wetter and more cyclonic in the alpine realm, it is drier and less windy in the southern Baltic. Likely, during that time-interval, the westerly storm tracks were on a more southward trajectory, limiting the transport of moisture to locations North of Lake Woserin. Calcite layer thickness oscillations of about 88 and 208 years resemble the solar Gleissberg and Suess cycles and might suggest that the recorded changes in hydroclimate are influenced by solar variability. In addition, parts of the centennial-scale periods of thicker calcite layers around 5750–5400 and 5200 vyr BP are also synchronous to enhanced human activity in the Lake Woserin catchment. Consequently, thicker calcite layers during these time-windows might have also been favored by anthropogenic forest clearances and/or lake eutrophication. Combining seasonally resolved time-series of varve properties and geochemistry with recent meteorological and documentary records, as well as paleoenvironmental reconstructions, allowed a comprehensive understanding of the complex mechanisms of calcite precipitation during the recent period and mid-Holocene in Lake Woserin.
Footnotes
Acknowledgements
This study is a contribution to the DFG Priority Program 1400 ‘Early Monumentality and Social Differentiation’. We thank C Floors, S Ibens, M dal Corso, V Robin, J Zahrer, and W Dörfler for help during the coring campaign and M Köhler (MK-Factory) for the preparation of thin-sections. Brigitte Richard is acknowledged for measuring µ-XRF data at the GFZ German Research Centre for Geosciences Potsdam. Varve microfacies and geochemistry data files for the investigated Lake Woserin sediment intervals are stored at the PANGAEA data library. The German Weather Service (DWD) is thanked for making their data available to the public.
Funding
M Czymzik was partly financed by the Helmholtz (HGF) ‘Virtual Institute of Integrated Climate and Landscape Evolution Analysis’ (ICLEA) and a German Science Foundation postdoc grant (DFG grant CZ 227/1-1).