



Abstract
Geological studies of past and present sea level rely on valid and robust features marking sea level in geological sections. Present sea-level markers around the upper shoreface to beachface transition are detected in a beach-ridge plain formed in a microtidal regime. These sea-level markers identify specific relative sea levels at the time of formation. Ground-penetrating radar (GPR) data collected across the youngest part of the beach-ridge system of Feddet, Denmark are compared with independent coastal morphological and sedimentological data of the active strand plain and interpreted in relation to sea-level data. The data show consistency between dip values of the present beachface and upper shoreface compared with dip values of interpreted beachface and upper shoreface GPR reflections. A clear change in dip value is observed between beachface and upper shoreface deposits in both data sets. Within few centimetres, this break point coincides with actual sea level and is interpreted to correspond to downlap points observed in the GPR reflection data. Furthermore, our observations may indicate that downlap points of deposits, formed under both relatively high and low water levels, are preserved and may be identified in GPR reflection data. Downlap points identified in GPR data across microtidal beach-ridge systems from other localities can also constitute markers of palaeo-sea level at the time of deposition. Records of these sea-level markers can be used to reconstruct the local relative sea-level history during the Holocene.
Introduction
The relationship between rising sea levels and global warming, whether natural or human-induced, has generated much debate and is one of the complex aspects of climate change. Knowledge of natural changes in past sea levels is essential when trying to interpret present-day observations. This knowledge can also be used to create predictive models that use the relationship between sea levels and temperatures over longer time series, and may be applied to predict possible future changes in sea level.
Through the last decades, different approaches have been used in order to provide us with important information about changes in past sea level during the middle and late Holocene (e.g. Angula et al., 2006; Behre, 2007; Gehrels et al., 2011; Hijma and Cohen, 2012). Some of these studies have focused on deposits in the coastal zone and used various proxies for past sea level, including beach-ridge height, dating of inorganic landforms, base level of ridge crests, and internal architecture of beach-ridge deposits (e.g. Clemmensen et al., 2012a; Hansen et al., 2011; van Heteren et al., 1998b; Wells, 1996).
The preservation potential of the sea-level marker is one of the most crucial aspects when studying past sea-level changes (e.g. Rodriguez and Meyer, 2006). The optimal sea-level marker is protected against erosion or modification after deposition and typically occurs in areas with accretive conditions and high deposition rates.
Beach ridges are such features. They are formed on prograding shorelines and have been used as indicators of Holocene shoreline dynamics, where the heights of the beach ridges above mean sea level are a proxy of palaeo-sea levels (e.g. Bjørnsen et al., 2008; Clemmensen et al., 2012a; Goy et al., 2003; Hansen et al. 2011). However, factors which complicate the use of beach ridges as a record of past sea-level variations have been pointed out (Otvos, 2000). These factors include difficulty in identification of the interface between foreshore and overlying eolian deposits within a given beach ridge, and modification of foreshore sediments through erosive processes (e.g. storm events).
The lowermost parts of beach ridges on prograding coastlines are likely to have a high preservation potential and the internal architecture of the beach-ridge and swale deposits can be mapped using the ground-penetrating radar (GPR) method. This has been demonstrated in several studies (e.g. Clemmensen and Nielsen, 2010; Engels and Roberts, 2005; Fraser et al., 2005; Nielsen and Clemmensen, 2009; van Heteren et al., 1998a). Tamura et al. (2008) studied downlapping reflections, based on GPR data from the Kujukuri strand plain, Japan. These reflections were interpreted as markers showing the transition between the foreshore and the shoreface formed at a depth level of c. 1 m below sea level. Similar downlap-markers were identified by Nielsen and Clemmensen (2009) in GPR sections collected across a recent microtidal beach-ridge system on Anholt, Denmark. Here, downlap points were also interpreted to represent the transition from the beachface to upper shoreface. They found that the downlap point could be interpreted as a marker of actual sea level at the time of deposition in the microtidal regime of Anholt by comparing the level of the downlap point with actual measurements of sea level. This method was later used to identify past sea level in Holocene beach-ridge systems on Anholt (Clemmensen and Nielsen, 2010; Clemmensen et al., 2012b).
In this study, we jointly interpret GPR and topographic data collected across the youngest (< 120 years) beach-ridge deposits formed along microtidal shorelines on the east coast of Feddet, southeast Sjælland, Denmark, in order to provide new constraints on sea-level markers observed in beach-ridge architecture. Calculated seaward dip values of GPR reflectors interpreted as representing beachface and upper shoreface deposits are investigated and compared with independent coastal morphological data and sedimentary structures of the active strand plain. We identify downlap points in the GPR data sections interpreted to mark the transition from the beachface to the upper shoreface and compare the position of the downlap point with marked changes in topography of the active strand plain and sea-level data. Finally, we discuss the applicability and quality of the downlap points as sea level markers.
Study area
Feddet is a large spit located in the southeastern part of Denmark, c. 70 km south-southwest of Copenhagen. It is bounded towards the west by the Præstø Fjord and towards the east by Faxe Bay (part of the western Baltic Sea, Figure 1). The area around Præstø Fjord and Faxe Bay is characterised by microtidal conditions with a mean tidal range of 0.2 m according to the Danish Meteorological Institute (tidal data can be requested from http://www.dmi.dk). However, in addition to tidal effects, variations in sea level do occur on a daily to monthly basis because of changes in meteorological conditions, the passage of storms and seiches in the Baltic Sea. Short-term variations in water level in the study area can reach up to 1 m, especially during the winter months (data can be requested from http://www.dmi.dk).
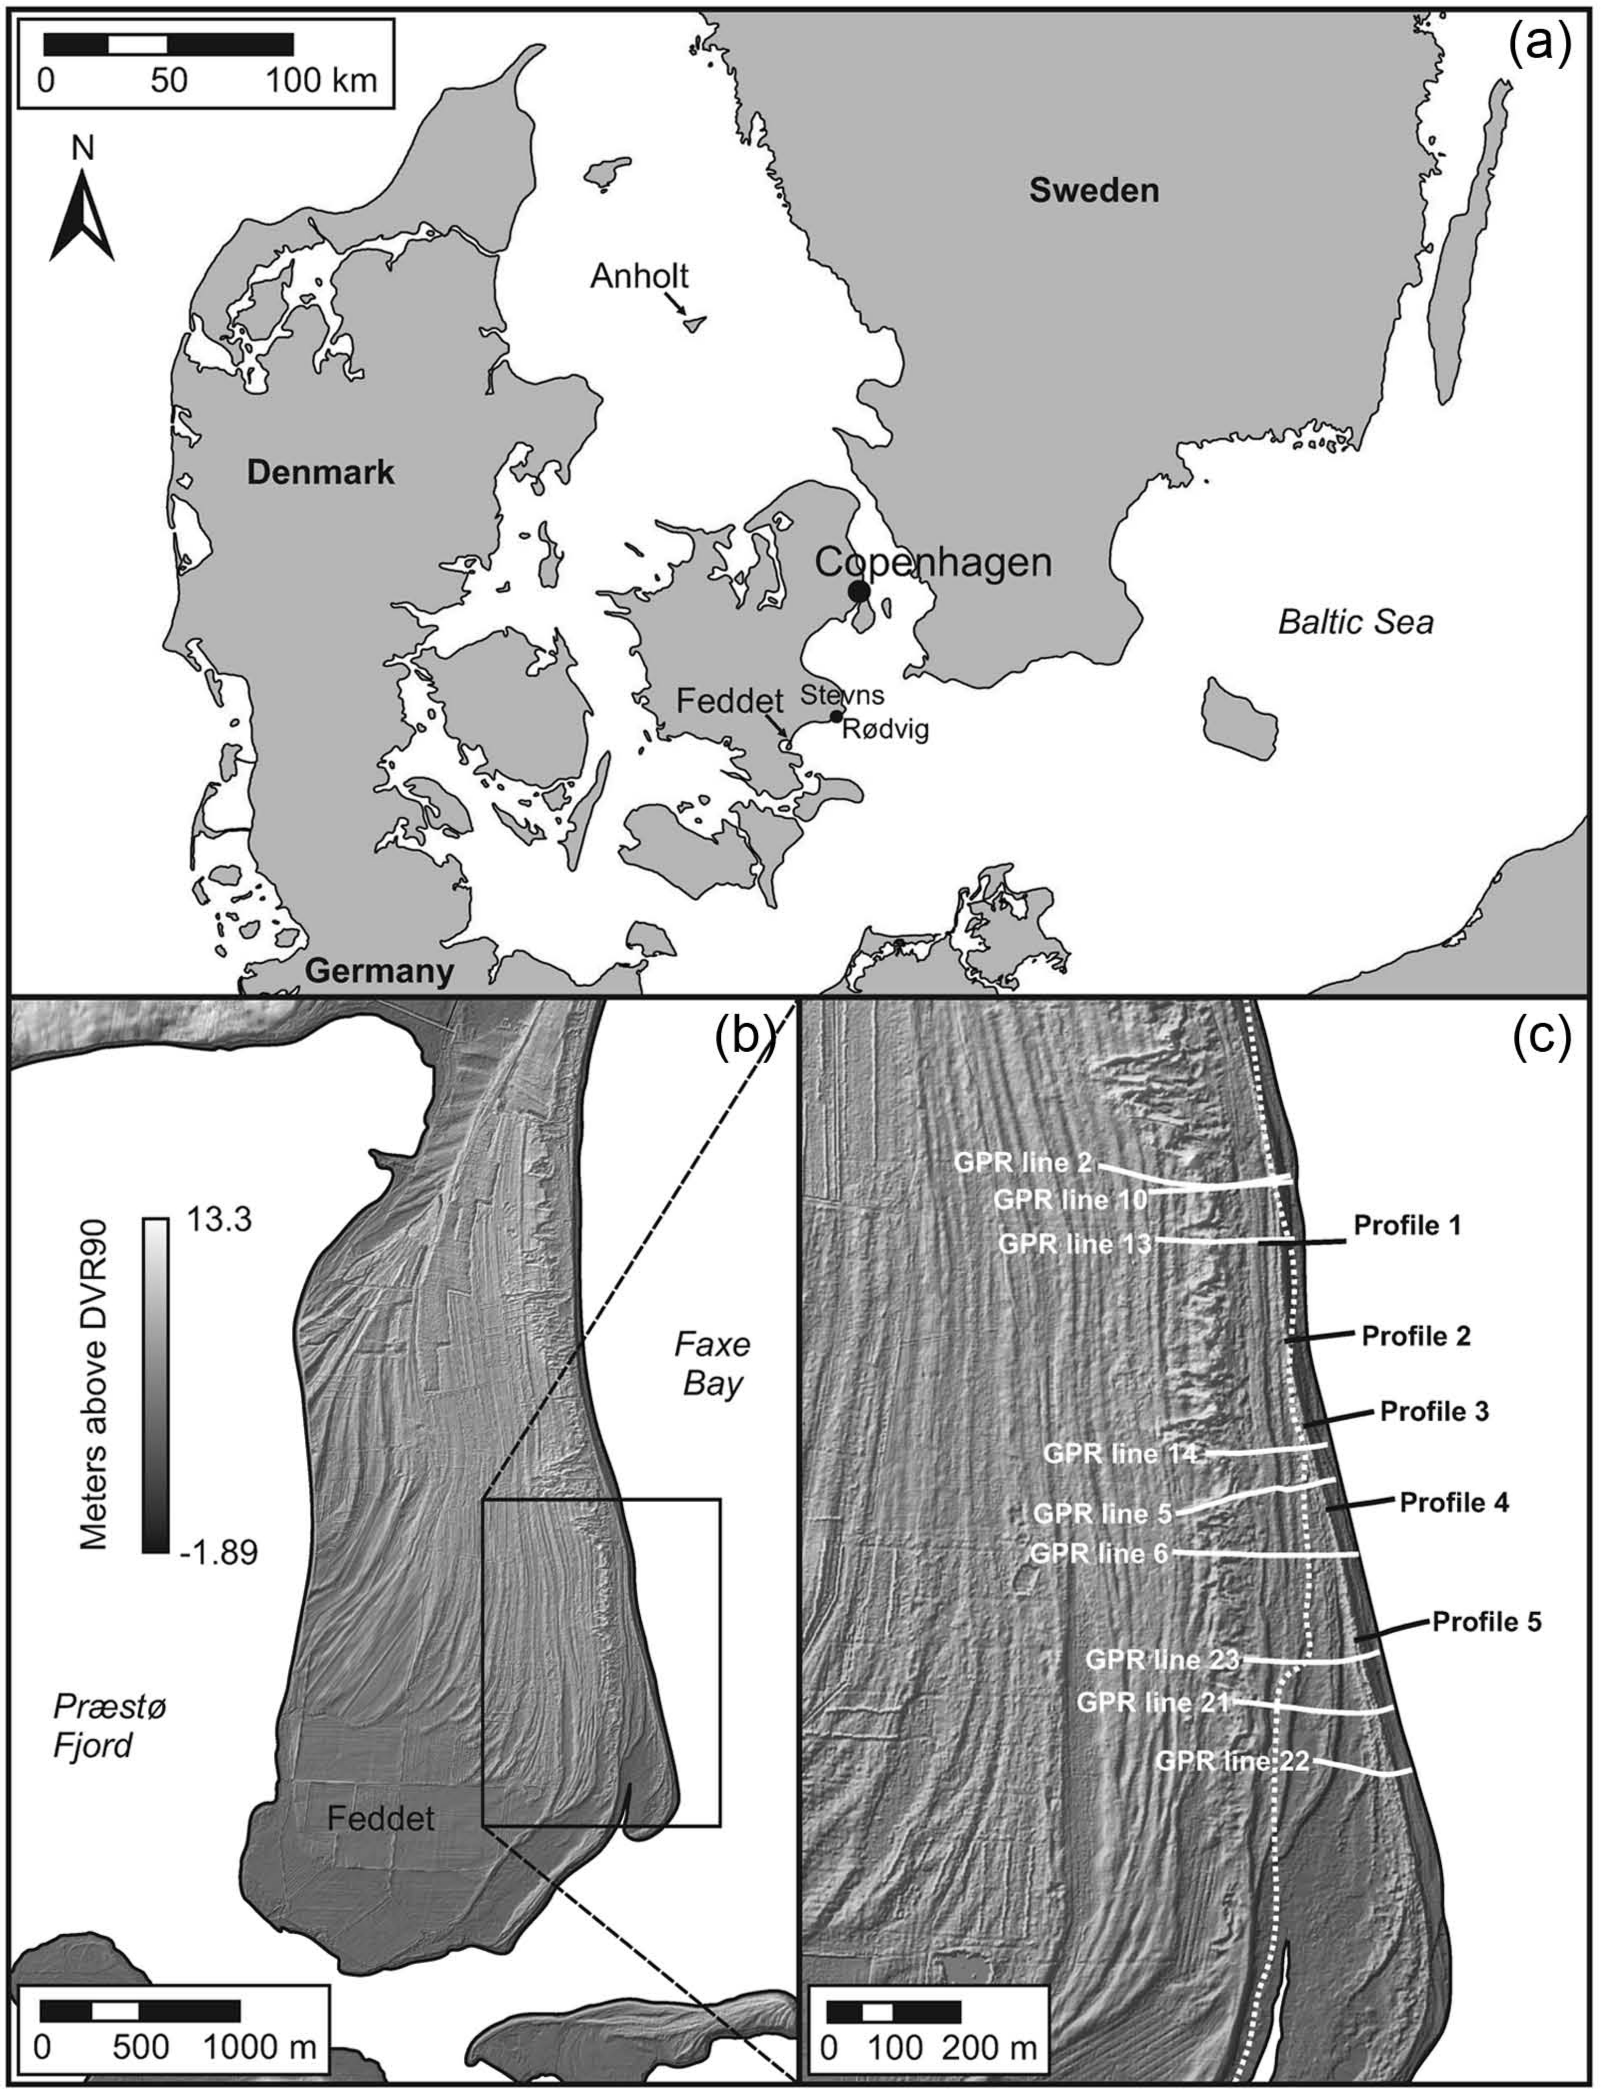
The study area. (a) Feddet is located in the southeastern part of Denmark, c. 70 km south-southwest of Copenhagen (12°5′51″E; 55°9′24″N). (b) Topographic map of Feddet based on digital terrain model. The map clearly shows a distinct and characteristic fan-shaped beach-ridge system. (c) Topographic map of the eastern part of the beach-ridge system investigated in this study. White solid lines indicate positions of collected GPR sections and black solid lines mark the positions of topographic profiles of the active coast. The dotted white line marks the position of the coastline
Detailed topographic measurements based on airborne laser scanning clearly reveal a distinct fan-shaped beach-ridge system (Figure 1). Today the beach-ridge system has a length of c. 5 km and is up to 2 km wide. The oldest beach ridges are mainly composed of coarse-grained material including pebbles, whereas the youngest beach ridges are composed of fine- to medium-grained sand. The sediments forming the beach ridges were transported inland during high water levels and high-energy wave action (Bendixen et al., 2013); beach sediments originate from coastal erosion of the Stevns peninsula north of Feddet and from offshore sediment sources. Trenches dug on top of the beach ridges show that the uppermost part of the ridges consists of well sorted sand probably of aeolian origin.
As part of a larger study in 1949, investigations were conducted on Feddet in order to describe the development of the postglacial vegetation and history of the Præstø Fjord area (Mikkelsen, 1949). In addition, Clemmensen et al. (unpublished data, 2013) recently investigated the morphological impacts of the 1872 storm flood event on the beach-ridge system along the east coast of Feddet. Feddet has undergone progradation towards east during several thousands of years. According to Mikkelsen (1949), Feddet started to form in the early Sub-Atlantic period approximately 2500 years ago. However, new investigations documented by optically stimulated luminescence (OSL) datings indicate that the beach-ridge system is considerably older (Clemmensen et al., unpublished data, 2013). Progradation occurred in response to the combined effects of sediment supply, changing sea level, and isostatic uplift. The orientation of the beach ridges has shifted from a northeast–southwesterly direction to a more north–south orientation. The western ridges are the oldest and when moving towards east, the ridges are successively younger. Comparison of the position of the present-day shoreline with topographical map from
Methods
Coastal topography
A digital terrain model is used to construct a detailed topographic map of the beach-ridge system. The terrain model is based on airborne laser scanning carried out by COWI A/S in early 2007 and has a vertical accuracy of around 0.25 m. Topographic data were extracted and used for topographic corrections of the GPR data sections during processing procedure. Comparison of the topography based on the digital terrain model and measurements of the differential GPS (DGPS) positions along the GPR profiles using a Trimble R8 shows good agreement (average difference of −0.47 cm and SD of 8.8 cm). However, topographic correction of the part of the GPR data sections that are closest to the present shoreline (outermost c. 15 m) is based on the DGPS measurements and not the digital terrain model, as the topography in this dynamic environment appears to have changed significantly since the laser scanning in 2007. Only the most recent beach-ridge deposits (younger than 120 years; based on historic maps) with associated GPR data sections are compared with measurements of recent beachface and upper shoreface topography and beach strata configuration from trench data.
In addition, high-resolution DGPS measurements were acquired along five cross-shore profiles in order to describe the morphology of the active coast and upper shoreface (Figure 1c). The profiles were measured on 5 June 2012. The profiles were traced from approximately 80 m offshore (water depth around 1 m) to 23–55 m inland. Furthermore, a trench was dug parallel to topographic profile 1 for analyses of beach strata of the active part of the beach.
Ground-penetrating radar
GPR reflection data were collected during three separate field excursions in May 2009, September 2011, and February 2012, using shielded 250 MHz Sensors & Software antennae mounted on a skid plate with a distance of 0.38 m between the transmitter and receiver centres. GPR data were acquired along 25 profiles in total. In this study, the focus is on the GPR data collected along nine profiles on the eastern part of Feddet covering the last c. 120 years of beach-ridge deposits (Figure 1). This time interval corresponds to between 10–175 m of the GPR sections based on the historical maps.
We used a record length of 450 ns (May 2009) and 500 ns (September 2011 and February 2012) and a trace spacing of 0.05 m. A total of eight recordings were stacked into a single trace for each recording location for every profile.
The processing of the GPR data sections was carried out using the Ekko_View Deluxe (ver.1 release 3) software package provided by Sensors & Software and subsequently the ProMAX software of Landmark. The processing steps used here are somewhat similar to the ones used by Nielsen and Clemmensen (2009): (1) repositioning of traces (if necessary), (2) regular ‘dewow’-filtering in order to suppress the low-frequency noise (often referred to as ‘wow’) before further processing, (3) gain corrections were made with an automatic gain control algorithm (maximum scaling factor of 500), (4) standard constant-velocity migration, and (5) depth conversion and correction of topography using topographic data extracted from the digital terrain model. The vertical resolution provided by the reflection GPR recordings is on the order of ~0.1 m (cf. Nielsen and Clemmensen, 2009).
In order to perform migration and time–depth conversion, radar wave velocities have to be known. GPR wave velocity is determined by factors such as grain size, porosity, and water saturation (e.g. Neal, 2004; Reynolds, 1997). The radar wave velocities were estimated based on analyses of diffraction hyperbolas in the raw GPR reflection data sections.
Both lateral and vertical variations in velocities were observed along the data sections but often the vertical variations are highest from around 0.06 m/ns to 0.95 m/ns in the uppermost part of the ridges. The vertical variation is likely caused by a change from saturated to unsaturated sediment controlled by the position of the groundwater table (e.g. Reynolds, 1997). Local variations in grain size and porosity may also explain the observed velocity variations and the fact that the GPR data were collected in different years and to different time during the year may also have influenced the radar wave velocity because of annual variations in water content.
For each of the profiles we used a constant velocity for migration and depth conversion, and the value differed between the profiles from 0.06 m/ns to 0.08 m/ns. The combined effects of the uncertainties related to interpretation, numerical effects from the applied filtering algorithms, and the uncertainties of the velocity model give rise to an expected total uncertainty of ~0.25 m with regard to depth positioning of reflection events (see Nielsen and Clemmensen (2009) for a discussion of such error budgets and the correlation properties of the errors).
Sea-level data
Actual measurements of sea levels have been recorded in Rødvig harbour, approximately 20 km northeast of Feddet (Figure 1). The sea level has been measured automatically every 15th minute from 1991 to autumn 2004 after which sampling interval changed to every 10th minute. Gaps lasting from a few hours to months do occur in the time series. The station in Rødvig recorded 50,707 measurements of sea level in total in 2011. They were carried out by the Danish Maritime Safety Administration until September 2011 and now by the Danish Meteorological Institute (data can be requested from http://www.dmi.dk).
Results
Description and interpretation of coastal topographic data and sea-level measurements
Topographic data have been collected along five cross-shore profiles through the active part of the coast (Figures 1 and 2). The five topographic profiles cross the upper shoreface and the beach and include the frontal dune ridge. The separation between the upper shoreface and the beach is at X=0 and equals to the position of the shoreline at the time of recording (Figure 2). The subtidal part of the profiles reaches until 75 and 83 m offshore. The mean sea level gradually decreased from 0.13 to 0.045 m above mean sea level (i.e. DVR90 = Danish Vertical Reference 1990, Danish Geodata Agency) during recording.
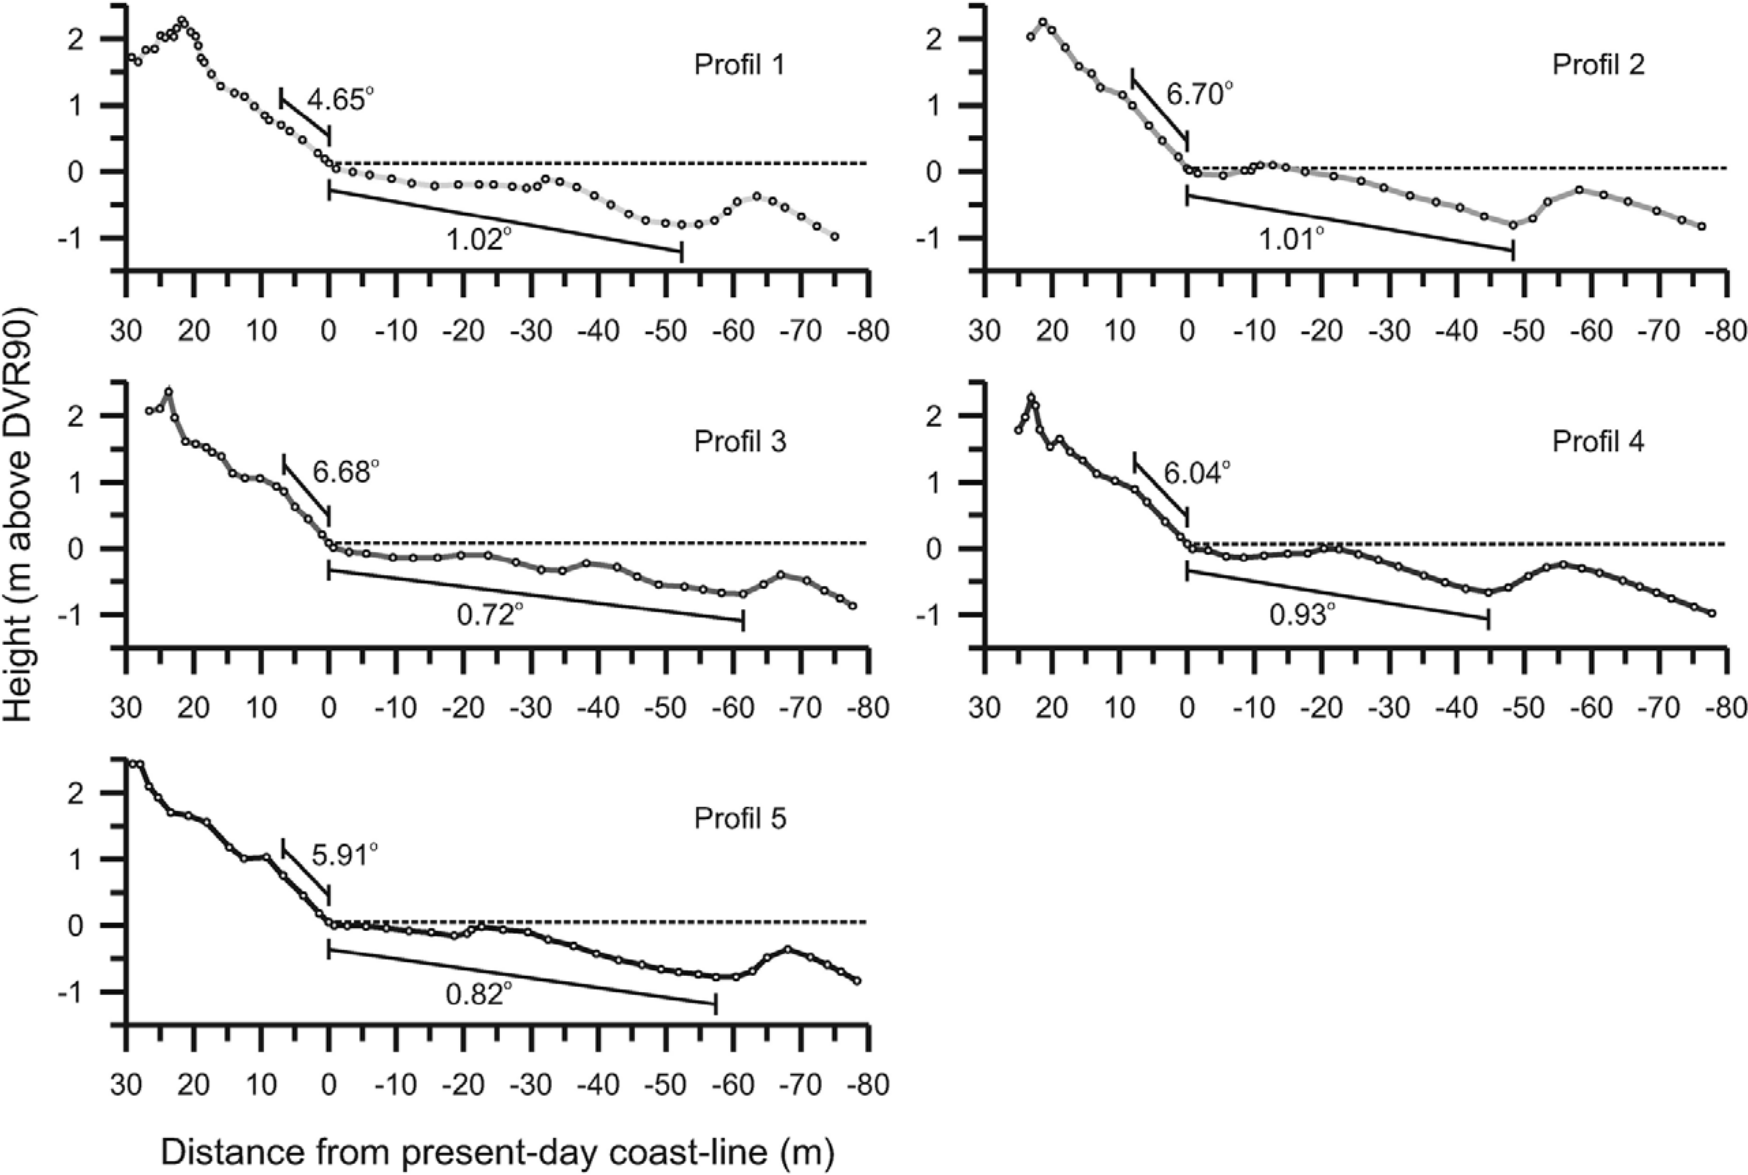
Topographic measurements along five cross-shore profiles on the east coast of Feddet (for positioning of the individual profiles see Figure 1). Topographic data were acquired using a Trimble R8. Measurements were carried out on 5 June 2012. White dots indicate sampling interval. Horizontal axes represent distance (m) to the shoreline at the time of recording. Vertical axes represent height (m) above reference value (DVR90). Dashed black lines indicate sea level at the time of recording. The overall slope of the beachface and upper shoreface have been calculated based on data points values as shown by the black line segments.
An intertidal and a subtidal bar can be recognized in the upper shoreface, although they are more evident in some profiles than in others (Figure 2). The overall slope of the upper shoreface is described by a single dip value, despite the spatial variation along the sea bed, including the landward-dipping side of the intertidal and subtidal bars. We chose to base the calculation of this dip value on two data points: at X=0 and at the deepest data point located between the two bars (equals X-values between −45 m and −61 m). The overall seaward slope of the upper shoreface for the five profiles are calculated to vary between 0.8° and 1.0° with an average around 0.9° (Figure 2 and Table 1).
Dip values (presented as maximum, minimum, and average values) of beachface and upper shoreface deposits based on interpreted GPR reflections (beachface: 71 measurements, upper shoreface: 60 measurements) and topographic profiles across the active part of the strand plain.
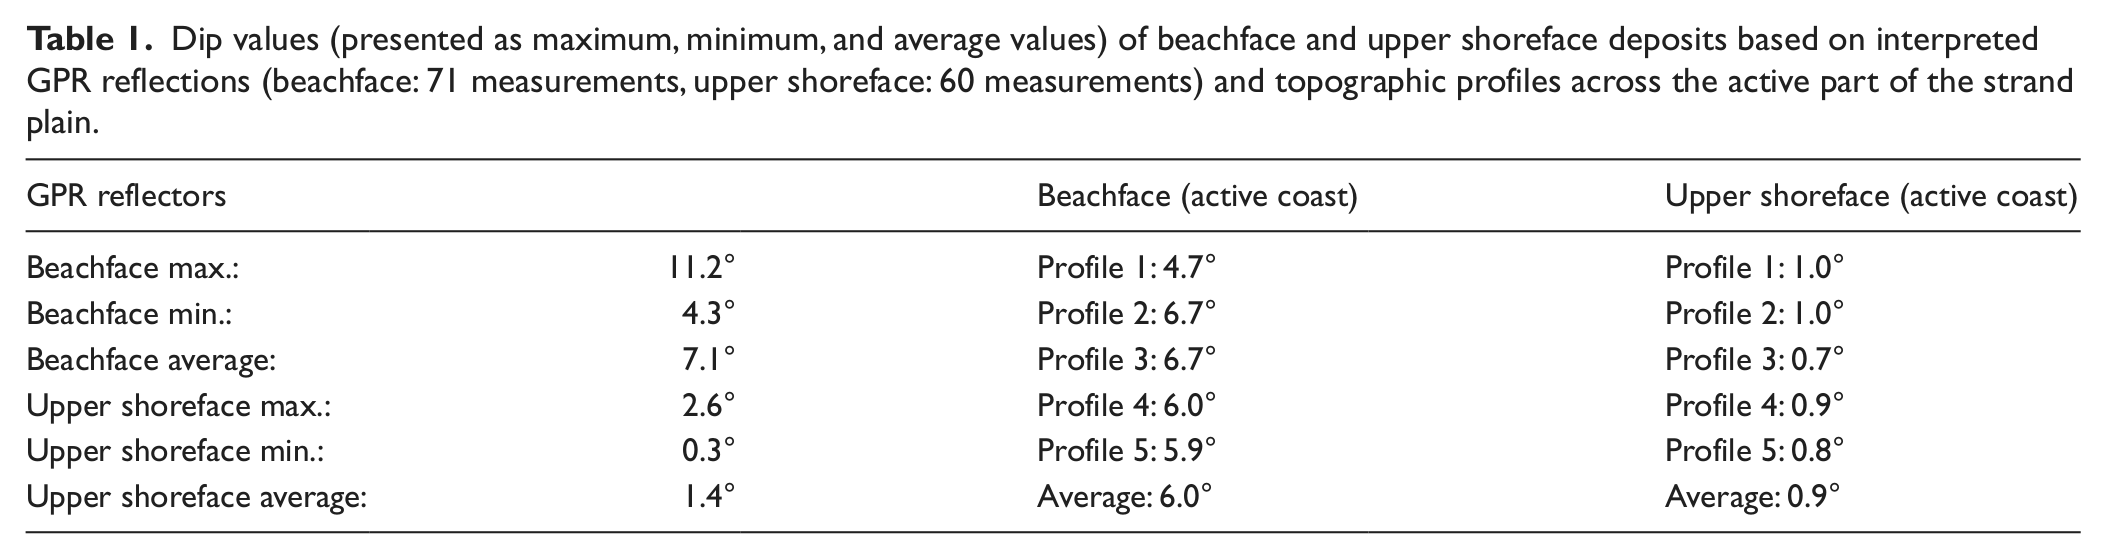
Along the beach no incipient berm morphology can be clearly recognized, but 22–30 m inland from the shoreline a mature berm is developed and its inner part is draped with a shallow cover of aeolian material (Bendixen et al., 2013). Similarly, the overall slope of the beachface is estimated based on the gradient of the lower and seaward part of the beach, which is also the part exhibiting the steepest gradient. This part corresponds to horizontal distances between the data points from 6.7 to 8.1 m (Figure 2). The seaward slope of the beachface for the five profiles varies between 4.7 and 6.7° with an average slope around 6.0° (Figure 2 and Table 1). In addition, dip values of seaward-dipping beach strata, approximately 15–30 cm below beach surface, were measured in a test trench on the beach parallel to topographic profile 1. In total, 23 dip values were measured ranging from 2.5° to 8.6° with an average of 4.6° (Bendixen et al., 2013).
Variation of the topography along the active coast during a period of three years has been described by Bendixen et al. (2013). The topographic measurements along the five profiles presented in Figures 2 and 3 only represent the morphology of the coast at time of tracing.

Comparison of coastal topography and sea-level measurements. The five curves represent topography across the active part of the coast, as presented in Figure 2. Dashed black line indicates average sea level (0.09 m) during time of recording on 5 June 2012. Histogram shows the distribution of 50,707 sea-level values measured from January to December 2011 by the Danish Maritime Safety Administration and the Danish Meteorological Institute at the station located in Rødvig harbour (20 km northeast of Feddet).
The histogram in Figure 3 shows the distribution of all measured water-level values from the period January–December 2011 at Rødvig station (Figure 1). The average measured water-level value for 2011 is 0.08 m above DVR90 and the minimum and maximum values are −1.53 and 1.23 m above DVR90, respectively. The sea level on 5 June 2012 (on average 0.09 m above DVR90; dashed line in Figure 3) was close to the average value of 0.08 m above DVR90 for the year 2011.
Description and interpretation of GPR data sections
The observations made for the GPR data sections from Feddet resemble observations made in the GPR sections from Anholt described by Clemmensen and Nielsen (2010) and Clemmensen et al. (2012a).
Examples (GPR lines 2 and 6) of the general internal architecture of the eastern part of the beach-ridge system on Feddet are presented in Figure 4, where selected reflections are marked by thick black lines. GPR lines 2 and 6 are both initiated at the present-day shoreline and run perpendicular to the coastline (Figure 1). The first 30 m of GPR line 2 (< 120 years) crosses the active beach, consisting of a beachface, a poorly developed berm, and a frontal beach/dune ridge. The part of GPR line 6 presented in figure 4 (from 45–75 m from present-day shoreline; < 120 years) crosses a beach ridge, a swale, and an additional beach ridge. Although no deep cores were taken, exposed ridges on the west coast of Feddet show examples of the internal sedimentary composition of the ridges. As the beach-ridge system is preferentially composed of water saturated sandy and gravel-rich units the GPR reflection events are most likely caused by variations in sediment grain size and associated changes in porosity. The GPR data sections have been divided into three separate radar facies (RF1, RF2, and RF3) based on different reflection characteristics (cf. Clemmensen and Nielsen, 2010). The top of RF1 is the ground surface. RF1 is characterised by eastward-/seaward-dipping reflections with dips ranging between 4.3° and 11.2° (on average around 7.1°, see Table 1). Inland-dipping and horizontal reflections only occur rarely in RF1. In general the east-/seaward-dipping reflections appear to downlap onto the upper reflections of RF2. The dipping reflectors of RF1 are interpreted as representing beachface deposits formed under swash- and backwash processes (cf. Clemmensen and Nielsen, 2010; Clemmensen et al., 2012a). The uppermost c. 0.5 m of RF1 is characterised by relatively strong and continuous reflections running mainly parallel with the ground surface. This top part of RF1 may be interpreted as representing aeolian cap deposits. Test trenches dug in the beach ridges show that the top 0.5–0.7 m most likely is of aeolian origin.
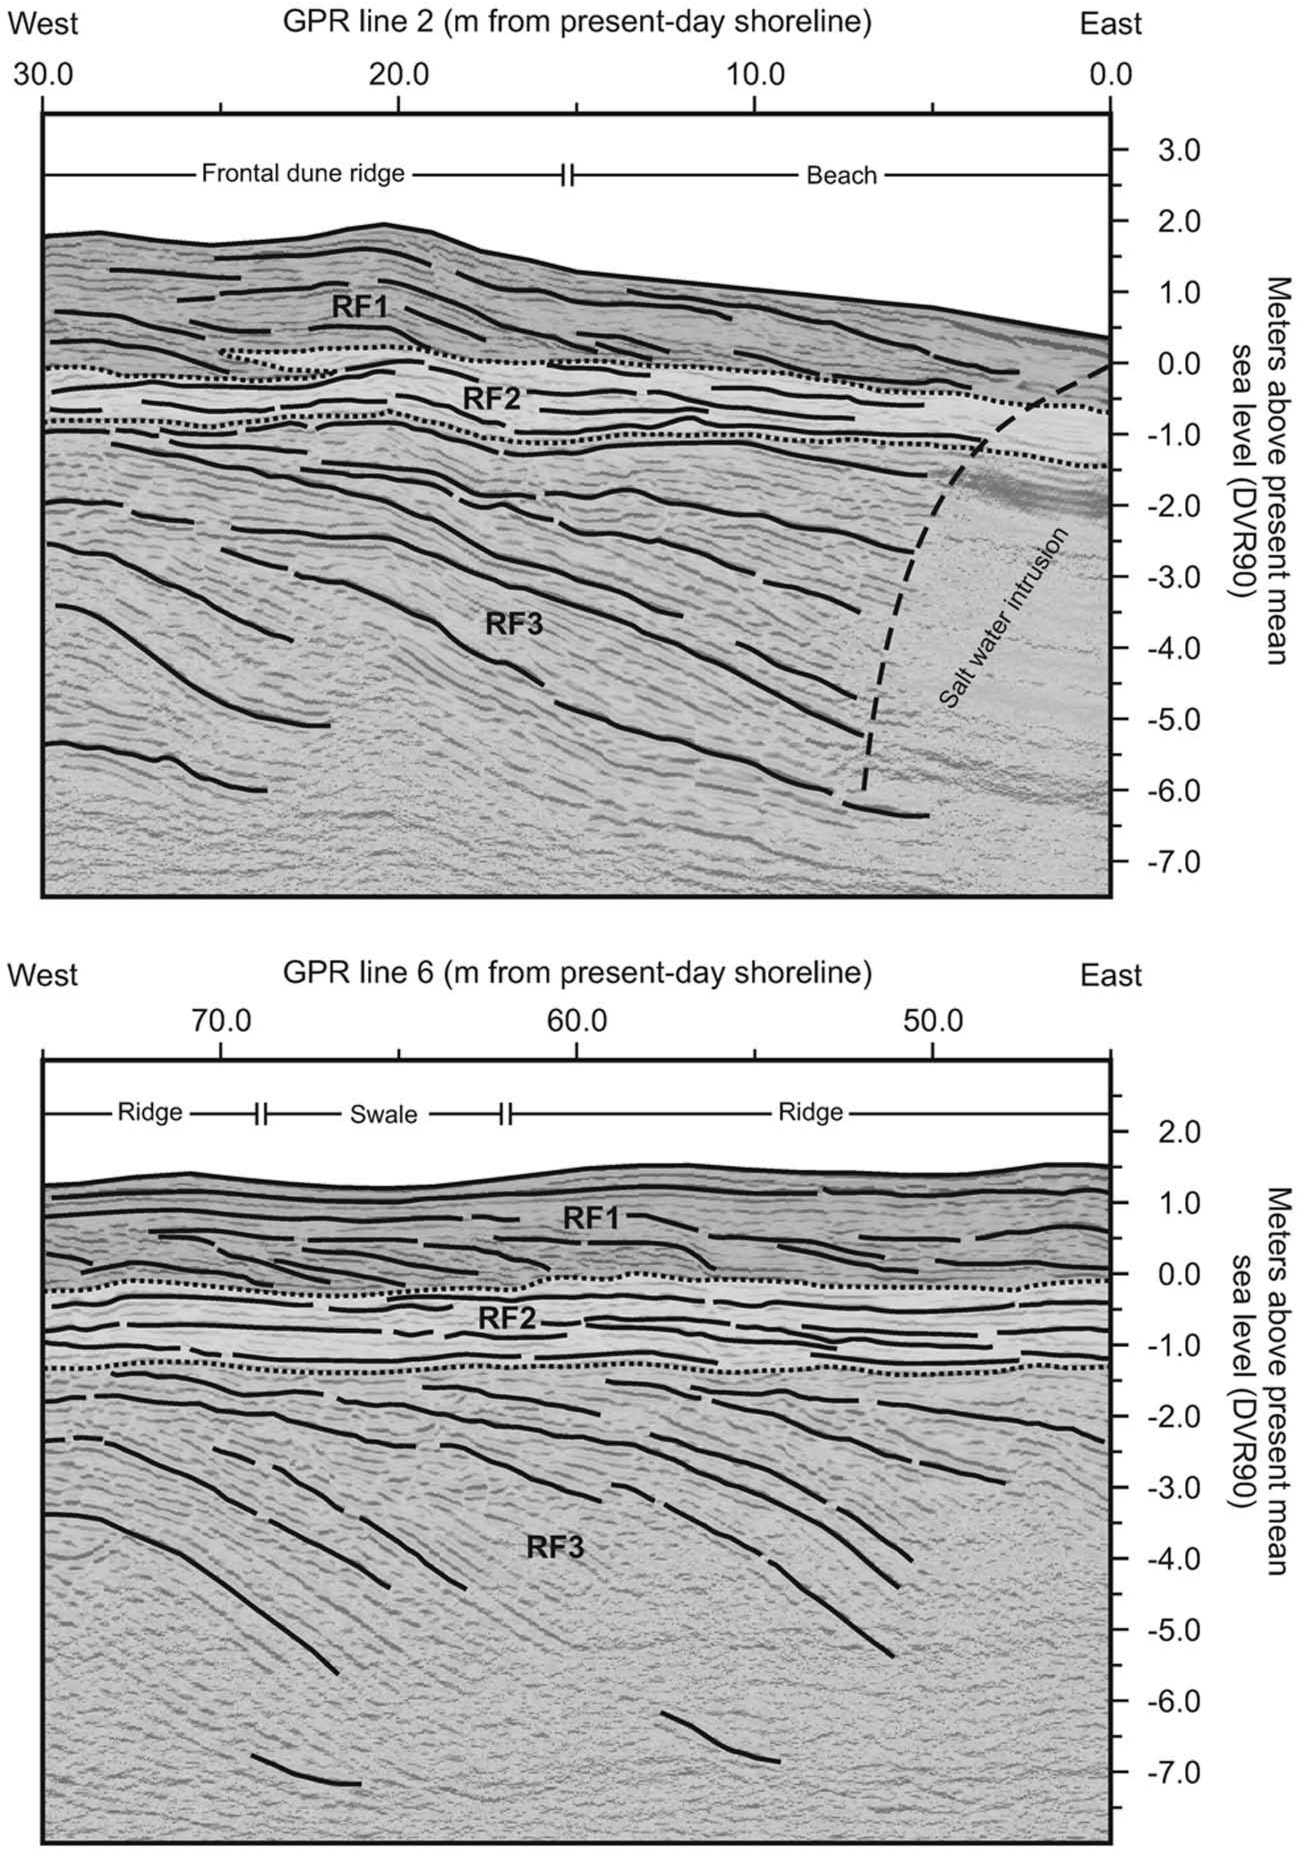
Examples of GPR reflection data collected across the eastern part of the beach-ridge system on Feddet. Selected reflections are marked by solid, black lines. Vertical exaggeration is 1:2. Vertical axes represent depth (above reference value DVR90) and are converted from timescale based on the assumption of constant radar velocities for each GPR section (0.07 m/ns for both GPR line 2 and line 6). Horizontal axes represent distance to the shoreline at the time of recording. Dotted lines separate radar facies RF1, RF2, and RF3. The near-coastal part of GPR line 2 clearly shows the dampening effect on the radar signal due to intrusion of salt water (marked by a dashed line).
RF2 is characterised by reflections with eastward/seaward dips of 0.3–2.6° (on average around 1.4°, see Table 1), although more irregular reflections with variable dip direction can be seen. RF2 is interpreted to represent the upper shoreface deposits. Similar reflection characteristics interpreted as upper shoreface have been described by Tamura et al. (2008), Nielsen and Clemmensen (2009), and Clemmensen and Nielsen (2010). The more irregular reflection patterns seen in the GPR data sections from Feddet, which in some cases also show inland dipping reflections, may be interpreted as upper shoreface deposits exhibiting intertidal and/or subtidal bars structures.
RF3 is characterised by eastward/seaward relatively steep-dipping reflections, exhibiting clinoform wedge-like structures. As the focus of this paper is on beachface and upper shoreface deposits any further description or interpretations of RF3 will not be given here.
Comparison of GPR observations and topographical data
Dip values of reflections interpreted to represent beachface and upper shoreface have been calculated for each of the nine GPR data sections on the eastern coast of Feddet. In total, 71 beachface and 60 upper shoreface reflection dips were calculated (maximum, minimum, and average values are summarised in Table 1). The reflection dip data set only includes reflections representing beach and swale deposits younger than c. 120 years. This time interval was chosen in order to allow comparison of deposits deposited under comparable condition as we assume that sea level and wind strength and pattern (on average during the last 120 years) do not significantly differ from the present-day conditions. Dip values of beachface (circles) and upper shoreface reflectors (triangles) have been plotted in the diagram on Figure 5 together with dip values of the beachface and upper shoreface of the present coast (solid lines). Also plotted on Figure 5 is the average dip value (square) of sedimentary structures measured in the trench dug on the beach parallel to topographic profile 1. It is evident from Figure 5 that there is good agreement between dip values based on interpretation of the GPR reflection data, topographic data of the present coast, and sedimentary structures. The dip values (calculated on basis of GPR interpretations) of the beachface show variability within a large interval (max.–min. difference of 6.9°) compared with the upper shoreface dip values (max.–min. difference of 2.3°), but also the dip values of the beachface based on topographic data show larger variability compared with dip values of the upper shoreface.

Plot of dip values (represented by ΔY/ΔX) of both beachface and upper shoreface deposits. Solid lines represent the overall dip values based on the topographic profiles (Figure 2). Circles represent dip values (in total 71 measurements) based on GPR reflections interpreted as beachface deposits. Likewise, triangles represent dip values (in total 60 measurements) based on GPR reflections interpreted as upper shoreface deposits. The square indicates average dip value of seaward dipping beach strata measured 10–30 cm below ground surface in a trench dug parallel to topographic profile 1. Dip values are summarised in Table 1.
Discussion
The internal architecture of fossil beach-ridge and swale deposits have in various GPR studies been investigated regarding identification of sedimentary features which may be used as a proxy for sea level (cf. Clemmensen and Nielsen, 2010; Clemmensen et al., 2012b; Nielsen and Clemmensen, 2009; Tamura et al., 2008). Nielsen and Clemmensen (2009) analysed GPR reflection data collected across beach-ridge and swale deposits from Anholt, Denmark and identified downlap points which they interpreted to represent the boundary between beach and upper shoreface deposits. By comparing the variation in height of the downlap points (relative to mean sea level) with sea level values measured by the Danish Maritime Safety Administration from 1991 to 2007 they concluded that their findings indicate that the downlap points corresponded to sea-level height, when the sediment was deposited.
In this study, integration of high-resolution topographic data of the active coast and high-quality GPR reflection data allow us to estimate dip values of reflections interpreted to represent beachface and upper shoreface deposits and to investigate the comparability between these findings and dip values of the present beach and upper shoreface.
The topographic data, collected along cross-shore profiles, clearly show a distinct change in dip from the beachface (average of 6.0°) to the upper shoreface (average dip of 0.9°) (Figures 2, 3 and Table 1). Interestingly, the vertical position of the break point coincides with the average sea level measured the same day (within a few centimeters). Bascom (1951) finds that the slope of the beachface is related to grain size. A typical beachface sample from Feddet has a mean grain size of 0.315 mm which, according to Bascom (1951), indicates that the beachface should have a slope around 5.0° in good agreement with our observations.
Furthermore, we find that dip values based on interpretation of GPR reflections are similar to dip values found along cross-shore profiles of the active coast, in regard to beachface as well as upper shoreface deposits (Figure 5). The comparison in Figure 5 shows that the dip values of beachface and upper shoreface deposits clearly falls within two separate intervals 4.3°–11.2° and 0.3°–2.6°, respectively. In general, the dip values of beachface and upper shoreface reflections plotted in Figure 5 show some variability within their giving intervals. The comparison in Figure 5 clearly shows us that the dip values of the beachface and upper shoreface of the present coast (solid lines) coincide with the dip values of the two respective intervals based on the GPR interpretations (circles and triangles). This is supported by observations in the trench parallel to topographic profile 1. Measurements of the orientation of the internal sedimentary structures, show similar dip values (on average 4.6°) as the surface of the beach (4.7° according to topographic profile 1, see Table 1).
Even though the beachface of the present coast also shows some variation in dip values (between 4.7° and 6.7°), the dip values fall within the lower half of the interval given by the beachface dips based on GPR data. Similar to the beachface, the dip values of the present upper shoreface also fall within the lower half of the range given by the upper shoreface dips. This variability in dip probably reflects that the cross-shore profiles represent the morphology at the specific day when the beach and upper shoreface sediments were deposited under conditions resulting in the given gradients.
Changes in coastal morphology, including changes of the gradient of the beachface and upper shoreface and bar dynamics, occur because of daily, seasonal and annual variation in wind strength and patterns, wave energy input, coastal currents, and sediment supply (e.g. Masselink et al., 2006). Such seasonal and annual variation will likely result in different cross-shore profiles than the ones presented in Figures 2 and 3. If the cross-shore profile was traced during a period with relatively higher (or lower) sea level it would result in a shift of the cross-shore profile up (or down) compared with the ones shown in Figure 3. The level of the break point, which equals mean sea level, would statistically be within a given range according to the histogram.
The good agreement between dip values based on interpreted GPR reflections and morphology of the present coast compared with actual sea level clearly indicates that the downlap points identified in the GPR reflection data can be used as a marker of sea level at the time of deposition. The variation in the dip values based on GPR beachface and upper shoreface reflectors, as illustrated by the plot in Figure 5, most likely represents variation in depositional conditions during the investigated time period (here c. 120 years), as might be expected. This result may thus indicate that both beachface and upper shoreface deposits formed under relatively high energy, resulting in relatively steep gradients, and deposits formed under relatively low energy, resulting in relatively lower gradients, are preserved. In addition, identification of downlap points under both beach ridges and swales, may indicate that beachface/upper shoreface deposits and the associated downlap points identified in the GPR data sections are not only preserved when sea level at the time of deposition was relatively high (i.e. extreme storm events) but also during relatively lower sea level.
Following deposition of beachface sediments and formation of beach ridges, the downlap points are relatively well-protected from subsequent erosion or modification compared with e.g. beach-ridge crests or bottom of swales. We consider the relatively high preservation potential of downlap points as one of the strengths when using the downlap point as a proxy for palaeo-sea level (e.g. Clemmensen and Nielsen, 2010; Nielsen and Clemmensen, 2009; Rodriguez and Meyer, 2006). Surely, storm events may erode older beach-ridge deposits and remove downlap points, but this will affect beach-ridge crests and swale bottoms as well.
Conclusion
We find that downlap points identified in GPR reflection data across modern and young beach-ridge systems are markers of sea level at the time of deposition. Our conclusion is based on a comparative analysis of high-resolution topographic data of the active coast, sedimentary architecture by GPR reflection data, sea-level measurements, and sedimentary structures in a trench on the beach.
The present beachface in our cross-shore profiles exhibits on average a seaward dip of 6.0° and the upper shoreface exhibits dip value of 0.9°. Trench studies indicate a similar seaward dip of internal beach strata, on average 4.6°, compared with the present surface of the beach.
We have used GPR reflection data to study the internal structures of the youngest part of the beach-ridge system in order to estimate dip values of reflectors interpreted as representing beachface and upper shoreface deposits.
We find that dip values fall within two separate intervals according to the type of deposit. Beachface dip values falls within 4.3°–11.2° with an average of 7.1°, whereas upper shoreface dip values are within the range 0.3°–2.6° with an average of 1.4°. A clear difference in seaward dip exists between beachface and upper shoreface deposits and the boundary between the beachface and upper shoreface is visible as points of downlap in the GPR sections. This is consistent with the findings of dip values based on the topographic data.
Importantly, we see that the distinct change in dip value between the present beachface and upper shoreface (corresponding to the downlap points identified in the GPR data) within a few centimetres, coincides with the actual sea level at the day of recording.
Our results clearly support and validate the findings of Nielsen and Clemmensen (2009) and indicate that for a microtidal regime as the one around the Baltic Sea and Kattegat Sea the downlap points identified in GPR reflection data across beach-ridge and swale deposits do mark a clear change in dip and this change in dip marks actual sea level at the time of deposition within the uncertainty of our measurements. We infer that downlap points in other microtidal beach systems also can be markers of palaeo-sea level at the time of deposition.
Footnotes
Acknowledgements
We would like to thank two anonymous reviewers for their constructive comments on the manuscript.
Funding
This study was financed by The Danish Council for Independent Research | Natural Sciences and the Carlsberg Foundation and by the Danish Council for Strategic Research (DSF) under the project Danish Coasts and Climate Adaptation – Flooding Risk and Coastal Protection (COADAPT), project no. 09-066869. Promax and SeisVision software were available at the Department of Geosciences and Natural Resource Management, University of Copenhagen through a Landmark University grant.