
Abstract
Changes in relative sea-level (RSL) during the Holocene are reconstructed based on ground-penetrating radar (GPR) data collected across a raised beach ridge system on the island of Samsø, Denmark. The internal architecture of the beach ridge and swale deposits is divided into characteristic radar facies. We identify downlap points interpreted to mark the transition from the beachface to the upper shoreface and, thus, sea-level at the time of deposition. This new data set shows that beach steps can be preserved and resolved in GPR reflection data. This is important, as downlap points identified at the base of the beach steps should be corrected for beach step height in order to be used as a marker of sea-level. Identification of beach steps in combination with observed changes in dips of the interpreted beachface reflections can give information about changes in the morphodynamic conditions of beach ridge progradation through time. The vertical levels of identified downlap points are combined with an age model based on optically stimulated luminescence-dated samples to reconstruct RSL for the past c. 5000 years. Overall, the reconstruction shows that the period between c. 4800 and 3800 yr BP was characterized by relatively high RSL values around 2.3 m above DVR90 (Danish Vertical Reference 1990). A marked decrease in RSL of c. 1.3 m occurred between c. 3800 and 3600 yr BP at a rate of c. 5 mm/yr. After c. 3500 yr BP, the RSL curve shows a gradual decrease at a rate of c. 0.6 mm/yr.
Introduction
Sea-level change is a measure of the relative vertical movement between the sea and land surfaces (cf. Coe, 2003; Posamentier and Allen, 1999). Observed changes in relative sea-level (RSL) measured at a specific locality most often reflect both global and local conditions, that is, changes in ocean volume caused by, for example, growth or melting of ice-sheets and changes in the thermal expansion of the oceans and vertical land movements driven by tectonic processes (uplift and subsidence), sediment deposition and ice loading/unloading (cf. Lambeck et al., 2012; Peltier, 2004).
Following the deglaciation of the Weichselian ice-sheets, the global sea-level was rising constantly (cf. Fairbanks, 1989). However, it was not until c. 16,000 years ago that the rate of global sea-level rise increased rapidly, and around 7000 years ago the rate of sea-level rise started to decrease (Fairbanks, 1989; Fleming et al., 1998; Peltier and Fairbanks, 2006; Vink et al., 2007). The interactions between the global sea-level rise and the regional isostatic rebound were the main factors determining the RSL changes in southwest Scandinavia (Lambeck et al., 1998). Investigations have shown how changes in RSL may have affected depositional environments, ecosystems, and may have even contributed to cultural changes in this region (Berglund, 1971, 1983; Christensen, 1982, 1995; Hede, 2003; Iversen, 1937; Jacobsen, 1982; Jessen, 1937; Krogh, 1973; Noe-Nygaard, 1988, 1995; Noe-Nygaard and Hede, 2006; Noe-Nygaard et al., 2005; Richter and Noe-Nygaard, 2003; Schmölcke et al., 2006; Troels-Smith, 1937; Yu, 2003; Yu and Berglund, 2007).
The concerns for a future rise in sea-level due to global warming has generated much debate and interest in past climate variability (cf. Horton et al., 2014). Intense efforts have been made to improve our knowledge, and more detailed estimates of past variation in sea-level are crucial for the interpretation and understanding of possible future changes in sea-level and the consequences thereof. Furthermore, comparison of RSL curves from localities within a limited geographic area may be used to extract information about differential vertical land movements (cf. Antonioli et al., 2009; Lambeck et al., 1998; Nielsen et al., 2014).
In order to make reliable estimates of past changes in (relative) sea-level, good proxies or markers preserved in the sediments are essential. Different approaches and methods have been used in order to reconstruct past changes in sea-level, including ground-penetrating radar (GPR) investigations of beach ridge deposits (Bard et al., 1996; Bjørnsen et al., 2008; Clemmensen et al., 2001, 2012b; Engels and Roberts, 2005; Fraser et al., 2005; Gehrels et al., 2006; Goy et al., 2003; Hansen et al., 2012; Nielsen and Clemmensen, 2009; Orford et al., 2003; Peltier and Fairbanks, 2006; Rodriguez and Meyer, 2006; Tamura et al., 2008; Uścinowicz, 2006; Van Heteren et al., 2000; Yu, 2003).
Recent investigations of GPR data collected across beach ridge and swale deposits have resolved reflection patterns characterized by seaward dipping reflections interpreted as beachface deposits downlapping onto underlying sub-horizontal to slightly dipping reflections interpreted as upper shoreface deposits (e.g. Clemmensen and Nielsen, 2010; Hede et al., 2013; Nielsen and Clemmensen, 2009; Tamura et al., 2008). Tamura et al. (2008) interpreted downlapping reflections as markers of a depth level of c. 1 m below sea-level. Nielsen and Clemmensen (2009) investigated a recent beach ridge system formed in a microtidal environment at Anholt, the Kattegat Sea, Denmark, and they concluded that the downlap point represents actual sea-level at the time of deposition. The findings by Nielsen and Clemmensen (2009) were later supported by studies of a second microtidal beach system facing the Faxe Bay of the Baltic Sea (Hede et al., 2013). Hede et al. (2013) compared GPR data collected across recent beach ridge deposits with independent coastal morphological data and showed that dips of beachface and upper shoreface reflections were clustered in two separate intervals and that the dips of beachface and upper shoreface reflections corresponded with dips of the beachface and upper shoreface of the modern coast, respectively. In addition, within a few centimetres, there was correspondence between the break point (i.e. the distinct decrease in the dip) marking the transition from beachface deposits to upper shoreface deposits and actual sea-level at the day of recording at Feddet, Denmark (Hede et al., 2013).
In prograding beach ridge systems, the lowest parts of beach ridges are likely to have a high preservation potential (cf. Clemmensen and Nielsen, 2010; Rodriguez and Meyer, 2006), whereas the upper parts may be subject to reworking and erosion. The high preservation potential of the downlap point is one of the strengths of this method for the reconstruction of palaeo sea-level.
In this study, we present data from the Nordby Hede beach ridge system on the island of Samsø, southern Kattegat Sea, Denmark. The purpose of the study is to describe changes in RSL during the middle and late Holocene. The study is based on interpretation of GPR reflection data collected across raised beach ridge and swale deposits and topographic measurements along cross-shore profiles. Based on characteristic reflection patterns, we identify downlap points in the GPR data. An age model is constructed based on optically stimulated luminescence (OSL) dating of sediment samples, and an RSL curve is established based on variation in the vertical level of the downlap points identified along the GPR transect. Variation of beachface and upper shoreface reflectivity is discussed in relation to changes in morphodynamic conditions.
Study area
The island of Samsø is located in a microtidal regime in the southern part of the Kattegat Sea with a tidal range of ~0.3 m (according to the Danish Meteorological Institute; Figure 1). The island is c. 26-km long and up to c. 7-km wide and has an area of approximately 114 km2. The northern and southern parts of Samsø are characterized by an undulating moraine landscape. The characteristic topography is primarily formed by the Bælthav readvance in the late Pleistocene (Houmark-Nielsen, 2011; Kjær et al., 2003). Later, the early Atlantic transgression probably initiated the role of marine geomorphic processes in the area and produced large quantities of sediment from the Pleistocene deposits that resulted in the formation of beach ridge systems at Samsø, including the Nordby Hede beach ridge system, which is the largest on the island (Figure 1c). As the Nordby Hede beach ridge system developed, a connection between the northern and southern parts of Samsø was established. Due to past and on-going isostatic rebound, former coastal cliffs and beach deposits can now be found 3–4 m above present sea-level (Hansen et al., 2012; Lambeck et al., 1998; Mertz, 1924; Nielsen et al., 2014).
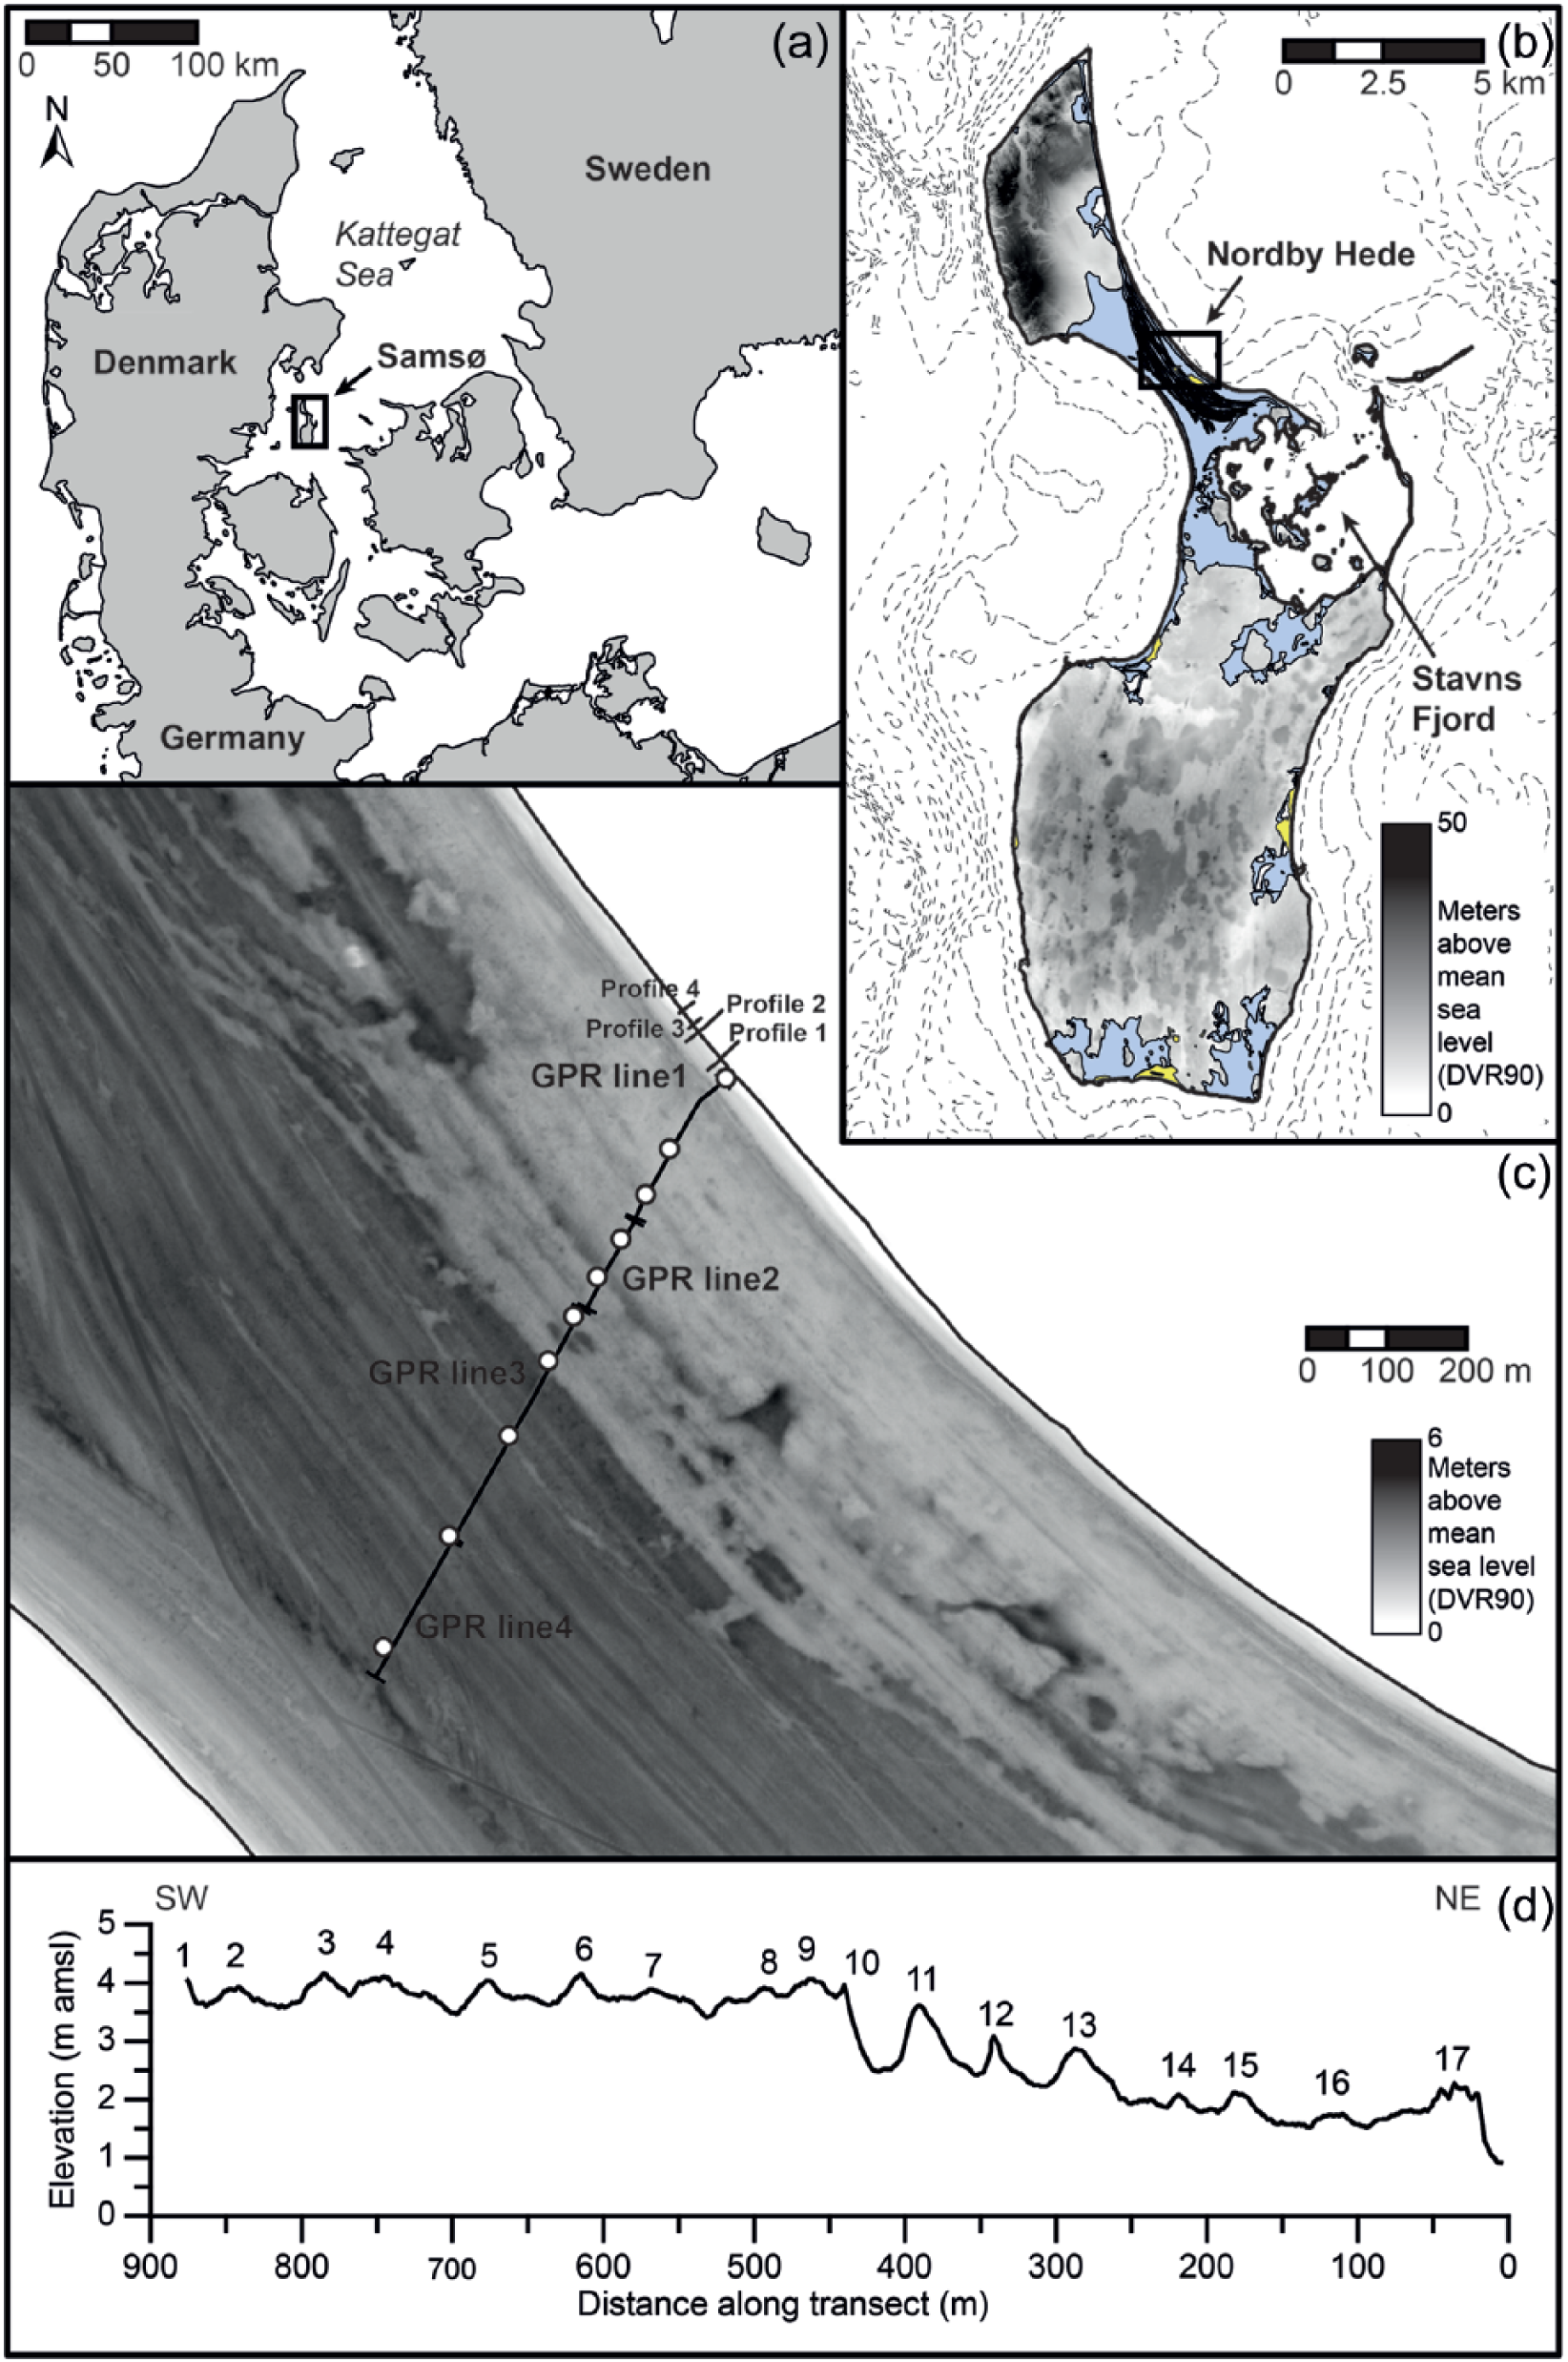
(a) Location of the study area. Samsø is an island located in the Kattegat Sea, Denmark. (b) Topographic map of Samsø based on a digital terrain model. Blue areas represent marine deposits and yellow areas represent aeolian deposits. Dashed lines are bathymetry with an equidistance of 5 m. (c) Topographic map of the Nordby Hede beach ridge system investigated in this study. Solid black lines indicate positions of collected ground-penetrating radar (GPR) sections. Also shown are four topographic profiles (1–4) measured perpendicular to the coastline. White circles mark position of optically stimulated luminescence (OSL) samples. (d) Elevation along GPR transect from 0 m (the coast) to c. 900 m inland. Numbered beach ridges are indicated. Source: Danish Geodata Agency G15-99.
Nordby Hede is formed by successions of sub-parallel beach ridges (Figure 1c). Beach ridge levels, crest orientation and the location of unconformities indicate a complex geometry with older ridges prograding in different directions from both the area just north of Stavns Fjord and from the southern part of the northern island. Younger ridges cut across the oldest beach ridge deposits and replace them with a system of NW-SE orientated ridges in two detached systems prograding towards the northeast (a major system) and towards southwest (a minor system), respectively. The top of the beach ridges are composed of thin layers of pebbly sand and sand overlain by aeolian sand.
In this study, we focus on the eastern part of the Nordby Hede (i.e. the major) beach ridge system as it seems to have formed by continuous progradation towards the NE and is composed of several well-preserved NNW-SSE trending beach ridges. This part of the beach ridge system is more than 5-km long and c. 1-km wide. Data sampling was done along a c. 900-m transect crossing 17 major beach ridges and 16 swales and shows distinct variations in the topography (Figure 1d). The transect runs along a clearance in the forest, which, roughly 80–100 years ago, was established as a path and is now used as a shooting range. Although this transect is not running exactly perpendicular across the ridges, we have chosen this path in order to be able to carry out the GPR survey adequately, as the quality of a GPR survey in the forest would be negatively affected by reflections from tree roots.
The topographic cross-profile is from c. 900 to 440 m (beach ridge nos 1–10) characterized by the highest ridge and swale levels reaching c. 4.2 and 3.4 m above DVR90, respectively. This part of the profile forms a topographic plateau with an average elevation of around 3.8 m above DVR90. At around 440 m, a marked decrease in elevation can be observed. Three large ridges (nos 11–13) reaching c. 3.6, 3.1 and 2.9 m above DVR90 characterize the interval between c. 440 and 250 m, with a gradual decrease in elevation. This trend continues until around 100 m. In total, the decrease from c. 440 to 100 m has a magnitude of around 1.5 m. Between c. 250 and 100 m, three less pronounced ridges (nos 14–16) reach elevations of up to c. 2.1 m above DVR90. After c. 100 m, elevation increases (ridge no. 17) followed by a smooth decrease representing the active beach plain. The high elevation of ridge no. 17 is due to a thick cover of aeolian deposits (foredune) compared with older ridges. Some of the aeolian sand along the whole transect has been removed during construction of the path/shooting range.
Methods
GPR
GPR reflection data were recorded in November 2011 with shielded 250-MHz antennae from Sensors & Software™. GPR reflection data were acquired along a c. 900-m transect divided into four individual, successive profiles. The transect runs almost perpendicular to the orientation of beach ridge crests and starts on the present east coast of Nordby Hede (see Figure 1). We used a record length of 500 ns and a trace spacing of 0.05 m. A total of eight traces were stacked into a single trace for each recording. Skipped traces were not left blanked during recording, but were filled in the data file as a repeat of the last successfully collected trace (Sensors & Software, 2006). Less than 1% of the traces were skipped during recording. The processing and presentation of the GPR data were carried out using Reflex-Win ver. 7.0 by Sandmeier Scientific Software and Petrel E&P Software Platform (ver. 2013.1).
The standard processing steps and parameters chosen included (1) correction of start time and time cut; (2) ‘dewow’ using a timewindow of 8 ns in order to eliminate low frequency noise; (3) bandpass filtering with a lower cutoff of 50 MHz, lower plateau of 100 MHz, upper plateau of 500 MHz and upper cutoff of 600 MHz; (4) application of a divergence compensation gain and scaled windowgain to compensate for geometrical spreading and damping effects; (5) topographic migration; and (6) a correction of the data sections for 3D topography with topographic data extracted from the digital elevation model. The radar wave velocities along the four profiles were estimated from analysis of the curvature of diffraction hyperbolas identified in the raw reflection data sections. Minor lateral and vertical variations in the velocities were observed. For migration, we used a constant velocity of 0.13 m/ns for GPR lines 1 and 3 and a velocity of 0.12 m/ns for GPR lines 2 and 4. The velocity analysis indicated that the water table was probably well below the depth interval of interest.
Digital elevation model, reference datum and coastal topography
We have used a digital elevation model based on airborne laser scanning (LiDAR) carried out by COWI A/S in the years 2005–2007. The model has a resolution of 1.6 m and a vertical accuracy of c. 0.06 m according to the Danish Geodata Agency, Danish Ministry of the Environment (http://www.geodata-info.dk). The individual GPR sections have been georeferenced in relation to the DEM as DGPS measurements were taken along the GPR sections every c. 30 m. In order to do topographic corrections of the GPR data sections and for topographic migration of the GPR data, as part of the data processing, topographic data from the DEM were extracted for every recorded GPR trace (corresponding to every 0.05 m along the transect and not only every c. 30 m). All elevations in this study refer to the current national reference, Danish Vertical Reference 1990 (DVR90). High-resolution DGPS measurements have been conducted along six cross-shore profiles on the east coast of Nordby Hede. The profiles were measured on 30 June 2013 and traced up to 60 m offshore and approximately 20 m inland. Profiles 1 to 4 were measured near the start of the GPR transect and profiles 5 and 6 were measured c. 1.7 km northwest of profile 4 (Figure 1c).
OSL dating
A total of 11 samples for OSL dating were taken at 10 different sites along the GPR transect (see Figure 1). One of these samples (sample no. 114730/Nordby Strand 1) represents recent beachface deposits at the seaward end of the transect. Two samples were taken at site 4 (sample nos 114723 and 114724) where a marked change in topography occurs. Samples were taken in opaque plastic tubes (c. 30-cm long and 5 cm in diameter) at depths between 0.55 and 1.0 m below the surface. All samples were taken in beach sand well below any aeolian deposits at the field site. OSL measurements were made by the Nordic Laboratory for Luminescence Dating, Risø National Laboratory, Denmark. OSL ages are given in years before the present (i.e. years before the year of sampling). For dating methodology and sample treatment, see Clemmensen et al. (2007) and Clemmensen et al. (2012b). Details of the OSL samples are summarized in Table 1.
Summary of OSL data.

NH and NS are abbreviations of Nordby Hede and Nordby Strand, respectively.
Distance along transect in metres.
Sample site elevations in metres above mean sea-level (DVR90).
Corrected sample depth based on estimated missing aeolian cover.
Corrected age determinations based on corrected sample depths.
(n) is the number of aliquots used to derive the dose.
w.c. is the observed water content in weight percent.
In the field and from the DEM, it becomes obvious that the shooting range cuts through the beach ridges. Elevations along the shooting range are thus lower than elevation values on its sides. It is therefore likely that some aeolian sand was removed during construction of the path/shooting range. As the cosmic ray dose rate is a function of sample burial depth, the original long-term burial depth of the sample must be considered (Bjørnsen et al., 2008; Prescott and Hutton, 1994). As the topography along the path/shooting range has been clearly modified, we have corrected the sample depths in order to get a better estimate of the original burial depth of the samples. To do this, we compared the topography along the transect with the topography on both sides of the shooting range, and based on an estimation of the reduced aeolian cover, we corrected the depth of each OSL sample (except for the one taken on the present beach) to 2 m allowing for an additional aeolian sand cover of up to c. 1.5 m. The correction has resulted in an increased age of 200 years for the oldest samples and an increased age of 30 years of the second youngest sample (Table 1).
Results
Description and interpretation of GPR data sections
Spectral analysis has shown that the peak frequency of the received GPR signals was between 255 and 275 MHz. In our case, the vertical resolution of the GPR reflection data is in the range c. 0.1–0.15 m, if one-fourth wavelength is used as the criterion for estimation of the vertical resolution (cf. Jol, 1995), and the penetration depth of the recorded GPR signals is about 6 m. Based on reflection characteristics, the GPR data sections have been divided into three separate radar facies, termed RF1, RF2 and RF3 (cf. Clemmensen and Nielsen, 2010; Hede et al., 2013). The overall characteristics of the internal architecture of the beach ridge system investigated are in many aspects similar to observations made in GPR sections from a beach ridge system on Anholt, Denmark, investigated by Clemmensen and Nielsen (2010) and Clemmensen et al. (2012a) and from the beach ridge system on Feddet, Denmark, described by Hede et al. (2013).
An example of the general internal architecture of the Nordby Hede beach ridge system is presented in Figure 2. The GPR data section shown covers the interval from c. 220 to 250 m along the transect. Selected reflections, marked by thick dotted (RF1), dashed (RF2) and thin dotted (RF3) black lines, indicate examples of reflections characterizing the three radar facies.

Example of ground-penetrating radar (GPR) reflection data collected across the Nordby Hede beach ridge system, Samsø. Selected reflections are marked by dotted and dashed black lines. RF1, RF2 and RF3 refer to radar facies 1, 2 and 3. The horizontal axis represents distance (m) along the transect. The vertical axis represents elevation in metres (DVR90) and is converted from timescales based on estimated radar wave velocities. Circles mark identified downlap points.
RF1 represents the ground surface and topmost deposits. Overall, RF1 is characterized by sub-horizontal to slightly seaward dipping continuous reflections alternating with less continuous reflections. Reflections running parallel to the ground surface (up to c. 0.5 m below surface) can, in parts of the transect, be followed over longer distances (up to around 30 m). The thickness of RF1 varies from c. 0.4 m and up to 1.1 m, although the thickness reaches c. 1.4 m at the outermost ridge.
The reflectivity of RF1 is interpreted as mainly aeolian sand and dune ridge deposits, consistent with observations made in holes that were dug for OSL sampling. It is not possible to exactly pinpoint the boundary between the aeolian sand and the uppermost part of the beachface deposits of sand and pebbly sand based on the GPR reflection characteristics. The lowest part of RF1 may therefore represent the transition to or the upper part of the underlying RF2 deposits.
In general, RF2 is characterized by eastward (i.e. seaward) dipping reflections. Single reflections may appear as curved reflections (i.e. starting as sub-horizontal reflections followed by a smoothly increasing dip). The majority of the reflections have a dip between c. 4° and 13° (on average c. 8°; n = 192), although a dip of c. 15° for a single reflection has been measured. The seaward dipping reflections of RF2 are interpreted as beachface deposits of sand and pebbly sand formed under uprush- and backwash processes (cf. Clemmensen et al., 2012b; Clemmensen and Nielsen, 2010). The dips found in this study are comparable with the findings (dips between 4.3° and 11.2° and on average 7.1°) from Feddet by Hede et al. (2013). Dips of the beachface reflections (circles in Figure 3) along with topography have been plotted as a function of distance. The plot shows a lateral increase in the dips of beachface reflections from the southwest to the northeast (Figure 3). From c. 880 to 450 m, the dips of the beachface reflections vary between c. 4° and 9° (average dip of c. 6°). At around 450 m, the dips start to increase. From c. 450 to 0 m, the dips vary between c. 4° and 15° with an average dip of around 9°. In addition to the increase in dip at c. 450 m, it appears that also the dip variability shows an increase.

Plot of dips of the beachface and upper shoreface reflections. Triangles represent dips of the interpreted upper shoreface reflections (n = 170). White and black circles represent dips of the interpreted beachface reflections (n = 190). Solid line represents topography. Also indicated are locations along the transect where optically stimulated luminescence (OSL) samples have been taken (NH refers to samples Nordby Hede 1–9 and NS refers to Nordby Strand 1).
When comparing the variation in the dips of the beachface reflections and the topographic variation along the transect, we observe that the increase in dip of the beachface reflections occurs more or less simultaneously with the marked decrease in surface elevation (Figure 3). In general, the reflections in RF2 are continuous, although reflections in limited parts of RF2 are less continuous. Examples of inland dipping reflections occur only rarely in RF2. These inland dipping reflections are interpreted as representing overwash deposits.
RF3 is characterized by a more diverse reflection pattern. The reflections become gradually weaker and less continuous with increasing depth, most likely because of the geometric spreading of the signal and loss of energy, though lithological changes as an increase in clay content will cause a dampening of the signal and may also explain the weaker reflections. The reflections in RF3 can be described as mainly slightly eastward dipping reflections although both undulating and inland dipping reflections are observed. Steeper reflections do occur in R3, mostly in the older and lowest parts of the transect, although a few steep reflections have been seen in the younger part as well. Since the majority of the steeper dipping reflections occur in the lowest part of RF3, it may be argued that RF3 be divided into RF3 and RF4. The upper 1.5 to 2 m of RF3 is characterized by predominantly slightly eastward dipping reflections. The dips range between c. 0.1° and 4° (on average c. 2°; n = 170). In comparison, the steeper dipping reflections observed in the lowest part of RF3 have a dip between 6.3° and 9.3°. Based on the overall sub-horizontal to slightly seaward dipping pattern of the reflections below the beachface deposits, the upper part of RF3 is interpreted to represent upper shoreface deposits. Hede et al. (2013) found dips of the upper shoreface deposits between 0.3° and 2.6° (on average 1.4°). In general, the dips of the upper shoreface reflections found in this study are similar to the findings by Hede et al. (2013). In RF3, the undulating reflection pattern with inland dipping reflections may be interpreted as intertidal and/or subtidal bar structures.
Two factors of uncertainty may affect the estimation of the dip of the reflections: (1) The transect is not measured directly perpendicular to the beach ridges which may result in a slight underestimation of the dip. (2) Uncertainty in the estimated GPR wave velocity leads to inaccuracies in migration and uncertainty in depth and dip estimation. As an example, a beachface reflection dipping c. 6.5° and an upper shoreface reflection dipping c. 2.0° (migrated with a velocity of 0.13 m/ns) will only have a dip of c. 5.2° and 0.9°, respectively, if the GPR data were migrated with a velocity of 0.11 m/ns instead.
The choice of (constant) velocity used for migration is based on diffraction hyperbolas identified in the depth interval of interest for this study, that is, the interval where RF2 reflections downlap on the upper reflections in RF3. The diffraction hyperbolas identified indicate that the radar wave velocity decreases slightly with depth, most likely because of an increase in water saturation. As a consequence, the dips of the upper shoreface reflections may have been overestimated and are more likely to have been slightly overestimated than the beachface reflections. This may explain some of the differences in the dips of the upper shoreface reflections found in this study compared with the results presented by Hede et al. (2013).
Downlaps and sea-level
Figures 2 and 4a show examples of seaward dipping reflections in RF2 terminated by reflections in RF3 with lower apparent dips. The downlap points (marked by circles in Figures 2 and 4) are picked both in cases where beachface reflections are terminated by underlying upper shoreface reflections (cf. Nielsen and Clemmensen, 2009) and in cases where reflections show a clear change in the dip from steeply dipping beachface to slightly dipping upper shoreface (cf. Hede et al., 2013).

(a) Example of ground-penetrating radar (GPR) reflection data with interpreted beachface deposits gently dipping towards the sea and downlapping onto interpreted upper shoreface deposits. (b) Example of a topographic cross-shore profile on the east coast of Feddet (from Hede et al., 2013). (c) Example of GPR reflection data with interpreted beachface deposits and beach steps downlapping onto interpreted upper shoreface deposits. Note the change in dip from the beachface to the steeper beach step (marked by arrows). (d) Topographic profile (profile 1 in Figure 1) measured on the east coast of Nordby Hede. Contrary to the topographic profile in (b), the topographic profile in (d) shows a clearly developed beach step with a steeper dip compared with the beachface. Dashed lines in (b) and (d) represent actual sea-level on the day of recording.
As a modern analogue, an example of a topographic beach profile measured across a modern coast (here represented by an example from Feddet by Hede et al., 2013) is shown in Figure 4b. The topographic beach profile shows a seaward dipping beachface (c. 6°) and a slightly dipping upper shoreface (c. 0.8°). Dips of the modern beachface and upper shoreface are comparable with dips of the interpreted beachface and upper shoreface reflections from both Feddet and Samsø. The break point in the topographic beach profile that marks the transition from the beachface to the upper shoreface is situated close to sea-level and corresponds to the downlap point identified in the GPR reflection data (see Figure 4a).
The analysis of the GPR data from Samsø has also revealed that differences in dip characteristics of beachface reflections may occur. Some reflections in RF2 show abruptly increasing dips (marked by arrows in Figure 4c) c. 10–40 cm above the level where we identify the downlap point (circles in Figure 4c). We interpret this steep part of the reflection as the beach step (cf. Bauer and Allen, 1995; Austin and Buscombe, 2008) and the part of the reflection above the break is interpreted as the beachface. Examples of beach steps in RF2 have been observed primarily in the youngest part of the transect along GPR lines 1 and 2. In total, 42 beach steps have been identified: 35 between c. 0 and 450 m and 7 between c. 450 and 900 m (black circles in Figure 3).
As a modern analogue to the interpretation of beach steps in the GPR data, an example of a cross-shore beach profile measured on the east coast of Nordby Hede is shown in Figure 4d. All six beach profiles measured on the east coast of Nordby Hede show a clear beach step at the transition from the beachface to the upper shoreface, but as the profiles are similar, only one is shown as an example in Figure 4d. Based on the six beach profiles, the average dip of the modern beachface, beach step and upper shoreface has been estimated to c. 6°, 11° and 1°, respectively, and the height of the beach step varies between c. 20 and 40 cm (on average c. 30 cm).
The changes in reflectivity characteristic (variations in the dips of the beachface and upper shoreface reflections, beach step present or not present) in RF2 along the GPR transect is interpreted to reflect variability in morphodynamic conditions at the time of deposition.
Based on reflections in RF2, the dips of the beachface reflections show an increase from an average of c. 8° before the break to an average dip of c. 17° after the break point. This is on average some degrees steeper than the dip of the beach step on the modern coast. However, in general, the dips of beachface reflections are slightly steeper than the beachface of the modern beach and most likely reflect natural variability in the morphodynamic conditions between the time of deposition and the conditions at the present coast. The height of the beach step reflections in the GPR data has been estimated to vary between c. 15 and 40 cm (on average c. 30 cm). This also corresponds well with the observations from the modern coast.
In the six topographic beach profiles from Samsø, it has also been observed that the transition (break point) from beachface to beach step coincided (within a few centimetres) with actual sea-level at the day of recording. As a consequence, vertical levels of downlap points identified at the base of beach step reflections have to be corrected for the height of the beach step in order to use the downlap point as a marker of sea-level.
Based on these findings, variation in RSL is estimated based on the vertical levels of downlap points identified at the base of both beachface reflections and beach step reflections (Figure 5). In general, the plotted levels of the downlap points follow the topography (grey curve in Figure 5). The constructed RSL curve shows variations along the GPR transect and has been divided into three main units (units 1 to 3; Figure 5). Unit 1 covers the interval from c. 850 to 450 m and is characterized by the highest RSL along the transect. The RSL varies between c. 1.7 and 2.8 m above DVR90 with an average value of 2.3 m above DVR90. To some degree, the RSL curve in unit 1 is parallel to the topographic plateau described earlier. Unit 2 is characterized by a marked decrease in RSL of c. 1.2 m within a relatively short distance (from c. 450 to 410 m) and unit 3 (from c. 410 to 0 m) is characterized by an overall decrease from c. 1.2 to −0.5 m (DVR90).

Plot of vertical levels of identified downlap points along the transect in metres (DVR90). White circles are downlap points identified at the transition from beachface to upper shoreface. Black circles are downlap points identified at the transition from beach step to upper shoreface. In the latter case, the level of the downlap point is corrected for the height of the beach step. Dashed line represents relative sea-level based on vertical levels of all downlap points. Solid black line represents a smoothed relative sea-level curve based on a running mean on the same data set (window width of 7). Also shown is topography along the transect (grey solid line). Based on overall variation in relative sea-level, the transect is divided into units 1, 2 and 3.
Chronology of the beach ridge system
An age model for the beach ridge system on Nordby Hede is constructed based on 11 OSL samples (Table 1 and Figure 1). The samples were taken in wave-deposited sand-rich units below any aeolian sand. Compared with the GPR data, OSL samples have been taken in the upper part of the beach ridge/swale deposits and should therefore represent the final stages of wave-deposition at the sample site. Based on its exact geographical position (as determined by DGPS), each OSL sample was assigned a distance along the transect. The position of OSL sample Nordby Strand 1 marks the start of the transect (see Table 1).
As described earlier, it is most likely that some aeolian sand had been removed when the path/shooting range was constructed. Therefore, we have used the corrected OSL age determinations for this age model. The corrected OSL age determinations and uncertainties are plotted against distance along the transect (Figure 6). The age model shows that the progradation rate decreases from c. 30 to c. 11 cm/yr. A simple second order polynomial can be fitted to the age determinations and can be used to describe the age/distance relationship, although the second order polynomial crosses several of the age determinations in their outermost age-uncertainty interval. If we choose a second order polynomial, we also assume an even change in progradation rate for the whole time period investigated as the polynomial will smooth out any variations in the progradation rate. We have chosen to put more emphasis on OSL sample 4b than 4a, as we take the age determinations of the adjacent OSL samples into consideration, and since both the topographic variation along the transect and the described changes in dips of the beachface reflections indicate that changes in morphodynamic conditions and progradation rate most likely have occurred, a fourth order polynomial was fitted to the OSL data (solid line in Figure 6). This was chosen in order to reflect the variation in progradation rate in the age model as the data indicate. Based on the resulting age model, any given downlap point identified in the GPR reflection data sections at a given distance x along the GPR transect can be assigned an age.
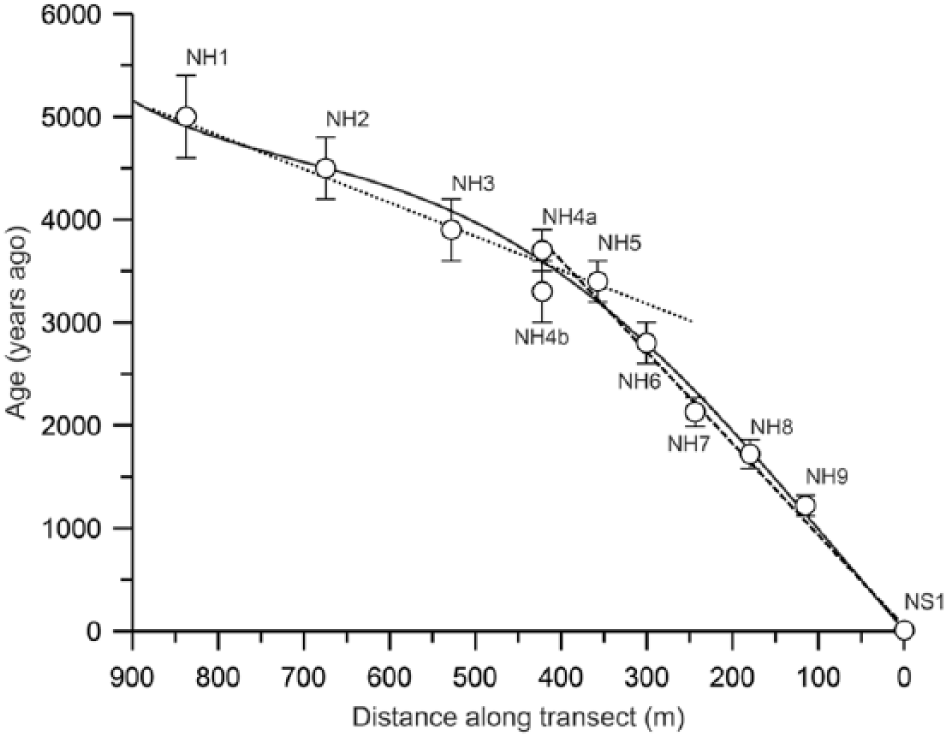
Age model of the beach ridge system. The age model is based on 11 optically stimulated luminescence (OSL) age estimates (see Table 1 for OSL details). The age model indicates a decrease in the overall progradation rate from c. 0.3 m/yr (dotted line) in the oldest part to c. 0.11 m/yr (dashed line) in the youngest part of the profile. A fourth order polynomial was fitted to the OSL age determinations (solid black line).
Discussion
Holocene sea-level changes
The GPR data from this study show that beach steps may be preserved and resolved in GPR reflection data. Beach steps are morphological features located at the seaward edge of the beachface (cf. Austin and Buscombe, 2008). They typically consist of the coarsest material found on the beachface and are usually a few to tens of centimetres high and form a characteristic topographic break in a cross-section of the beach (Bauer and Allen, 1995; Davis and Fitzgerald, 2004; Masselink and Kroon, 2004). A number of theories have been proposed as an explanation for the formation of beach steps, including formation of a backwash vortex (e.g. Austin and Buscombe, 2008; Bauer and Allen, 1995; Masselink and Kroon, 2004). Beach steps are modified or destroyed during high wave conditions, even for a single short event, which tends to smooth out the beach profile. In general, beach steps occur during low to moderate wave energy conditions, while flat profiles occur after high energy wave events (Masselink et al., 2006).
At some specific times during the past, the cross-shore profile of the east coast of Nordby Hede had an appearance like the one represented by the topographic beach profile without a beach step which gave rise to reflections illustrated in Figure 4a. At other times, the morphodynamic conditions resulted in the formation and preservation of a cross-shore beach profile with a beach step like the one represented by the topographic beach profiles measured on the east coast of Nordby Hede on 30 June 2013 which gave rise to reflections illustrated in Figure 4c. The size of the beach step and the vertical GPR resolution (in our study c. 0.1–0.15 m) are the main factors determining whether the beach step is resolved in the GPR reflection data. This implies that in some cases, beach steps are smaller than the vertical resolution of the GPR method and the beach step will as a consequence not always be resolved in the GPR data. In cases with beach steps of only a few centimetres in height (and therefore not resolved in the GPR data), this will not have a significant influence on the vertical level of the downlap point in the GPR reflection profile, if the downlap point, in this case, is not corrected for the height of the beach step. In cases, as shown by the results presented here, where the beach step is resolved in the GPR reflection data, the downlap points should be corrected for the height of the beach step in order to place the downlap point as close as possible to the actual sea-level at the time of deposition.
The reconstructed variations in RSL presented in Figure 5 have been plotted against time, based on the age model (Figure 7). A running average (window width 7) has been fitted to the data (solid, black line). Our data show that in the last 5000 years, the period from c. 4750 to 3750 yr BP (corresponding to unit 1) is characterized by an ‘RSL plateau’ with relatively high RSL values (average around 2.3 m above DVR90). Similar high RSL is seen in the sea-level reconstruction from Anholt, Denmark, which is also based on the same GPR methodology (Clemmensen et al., 2012a).
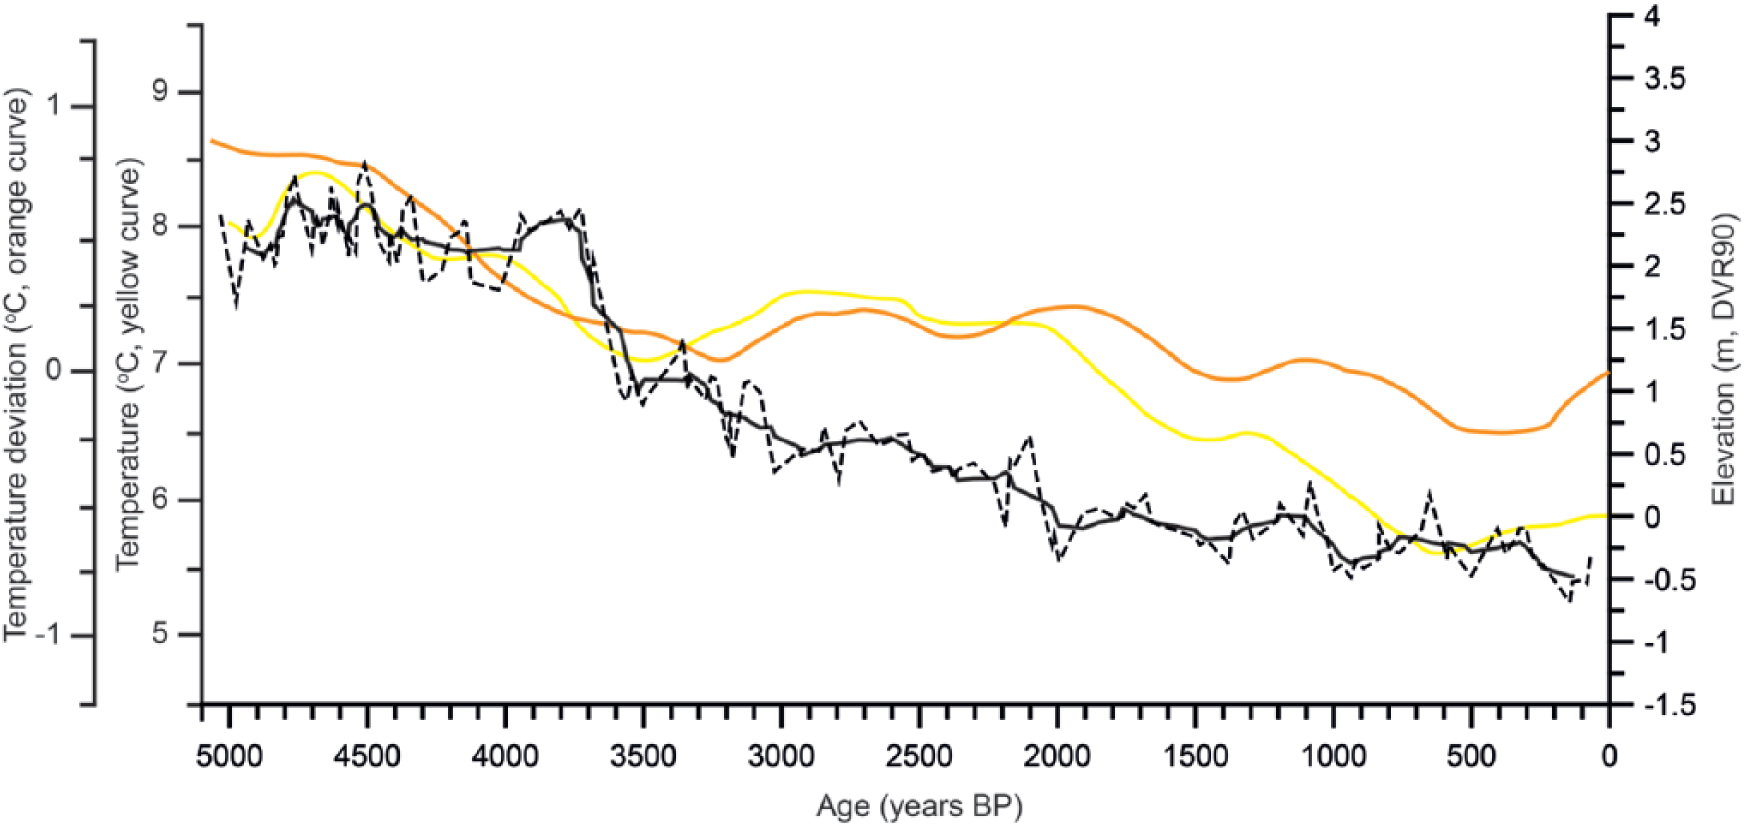
Solid black line represents the smoothed relative sea-level curve based on vertical levels of downlap points (running mean with a window width of 7). The dashed line runs through all identified downlap points. Yellow curve represents pollen-based temperature reconstruction from Lake Flarken, Sweden (Antonsson, 2006) and orange curve represents reconstructed July temperatures (as deviation from the mean of the past 200 years) for Northwest Europe (Renssen et al., 2009).
The record from Samsø indicates a marked decrease in RSL of up to c. 1.3 m during a period of c. 200 years (corresponding to a rate of c. 6 mm/yr) at about 3800 years ago. The RSL curve from Anholt shows a similar decrease but of a magnitude of up to 3.5 m with a rate of c. 5 mm/yr (Clemmensen et al., 2012a). Although the rate of the RSL decrease is nearly the same at Anholt and Samsø, the amplitude at Anholt is apparently more than twice the amplitude at Samsø. Also, there is an apparent difference in the timing of these events; however, within uncertainty of the OSL dating, they may be simultaneous. The fact that the RSL curve for Anholt generally shows higher values than the curve for Samsø may be attributed to spatial differences in vertical land movement in the region (Hansen et al., 2012; Lambeck et al., 1998; Nielsen et al., 2014).
After c. 3500 yr BP, the RSL curve from Samsø shows a gradually decreasing RSL with only minor fluctuations. In general, the RSL is decreasing at a rate of c. 0.6 mm/yr between c. 3500 and 300 yr BP (unit 3). Four minor peaks in RSL appear to have occurred around 2600, 1700, 1150 and 650 years ago. The youngest part of the GPR transect on Anholt is awaiting interpretation, and so we cannot compare with this part of the RSL curve yet (Clemmensen et al., 2012a).
Parts of the Atlantic and Subboreal period in southern Scandinavia are characterized by the Littorina transgressions and have been documented in several investigations (Berglund, 1971; Berglund et al., 2005; Christensen, 1995; Christensen et al., 1997; Hede, 2006; Iversen, 1937; Jacobsen, 1982, 1983; Jessen, 1937; Krogh, 1973; Yu, 2003). The time period resolved by the record from Samsø covers only the last part of the Littorina period but shows comparable trends with the Littorina studies. Yu (2003) has investigated RSL changes along the southern coast of Sweden and describes five major and minor transgression/regression phases covering the period from c. 8000 to 3000 cal. BP. According to the study by Yu (2003), the last of the Littorina transgressions (L5; the second of the two Subboreal transgressions) lasted from c. 4500 to 4100 cal. yr BP and was followed by a marked decrease in RSL. This is consistent with the relatively high RSL values from Samsø and Anholt, and both localities also indicate an increase in RSL between c. 4900 and 4750 yr BP which might correspond to the start of the L5 transgression.
The RSL is influenced by a number of factors, including changes in temperature (cf. Coe, 2003). In Figure 7, pollen-based temperature reconstructions from Lake Flarken, central southern Sweden, are shown by the yellow curve, and the orange curve is reconstructed July temperatures for Northwest Europe (Antonsson, 2006; Renssen et al., 2009).
The relatively high RSL values prior to c. 4000 yr BP are correlating with high temperatures. This period concurs with the final part of the Holocene climatic optimum which was characterized by the highest temperatures during the Holocene (cf. Renssen et al., 2009; Seppä et al., 2009). The marked decrease in RSL as shown by the Samsø curve at around 3800 yr BP may therefore partly be due to the temperature decrease following the end of the Holocene thermal maximum. In addition, Seppä et al. (2009) also describes a late Holocene cold anomaly between 3800 and 3000 cal. yr BP based on stacked pollen-based temperature records in Northern Europe which temporally coincide with the RSL decrease. Overall, the gradual decrease in RSL from c. 3500 yr BP is overall parallel with a decrease in temperature. The warm periods during the late Holocene, known as the ‘Roman Warm Period’ and the ‘Medieval Warm Period’, may be correlated with peaks in RSL between c. 2200–2000 yr BP and 1300–1000 yr BP, respectively.
Beachface reflections and dips
The analysis of estimated dips of the beachface and upper shoreface reflections shows a clear change across the beach ridge system (Figure 8). The oldest part of the beach ridge system (from 900 to 450 m, corresponding to c. 5000–3750 yr BP) is characterized by relatively flat beachface profiles with only seven identified beach steps. In this interval, beachface reflections are dipping between c. 4° and 9° (average of c. 6°) (Figure 8). The dip of the beachface is dependent on both grain size and wave energy (cf. Davis and Fitzgerald, 2004; Masselink and Kroon, 2004). This part (900–450 m) of the GPR transect most likely accumulated under quite stable conditions, almost static RSL, high wave energy and with a large sediment supply. This resulted in a flattening of the beachface profile and may also be the explanation why relatively few beach steps have been preserved and identified in this part of the transect (cf. Davis and Fitzgerald, 2004). For most of the period from c. 5000 to 3750 yr BP, the beach was therefore close to its dissipative end member (Davis and Fitzgerald, 2004; Short, 1984; Smith, 1990). In this period, the progradation rate has been relatively large compared with the period from 3750 yr BP to the present, according to the age model. The sediment supply was most likely brought to the area by alongshore transport. Northeast of Nordby Hede, a relatively flat area of low water depth (> −5 m according to the bathymetric model described by Nielsen et al., 2000) suggests the existence of two headland sections positioned in an E-W direction out from the elevated core of the northern island (Figure 1). These headlands have probably served as the major source area of sediment since the postglacial transgression of the Kattegat Sea around 7600 years ago (Bjørnsen et al., 2008; Sander et al., 2015; Yu et al., 2007). Material entering from southern and south-easterly directions (littoral drift) is assumed to be of only minor importance for the accumulation of the system.
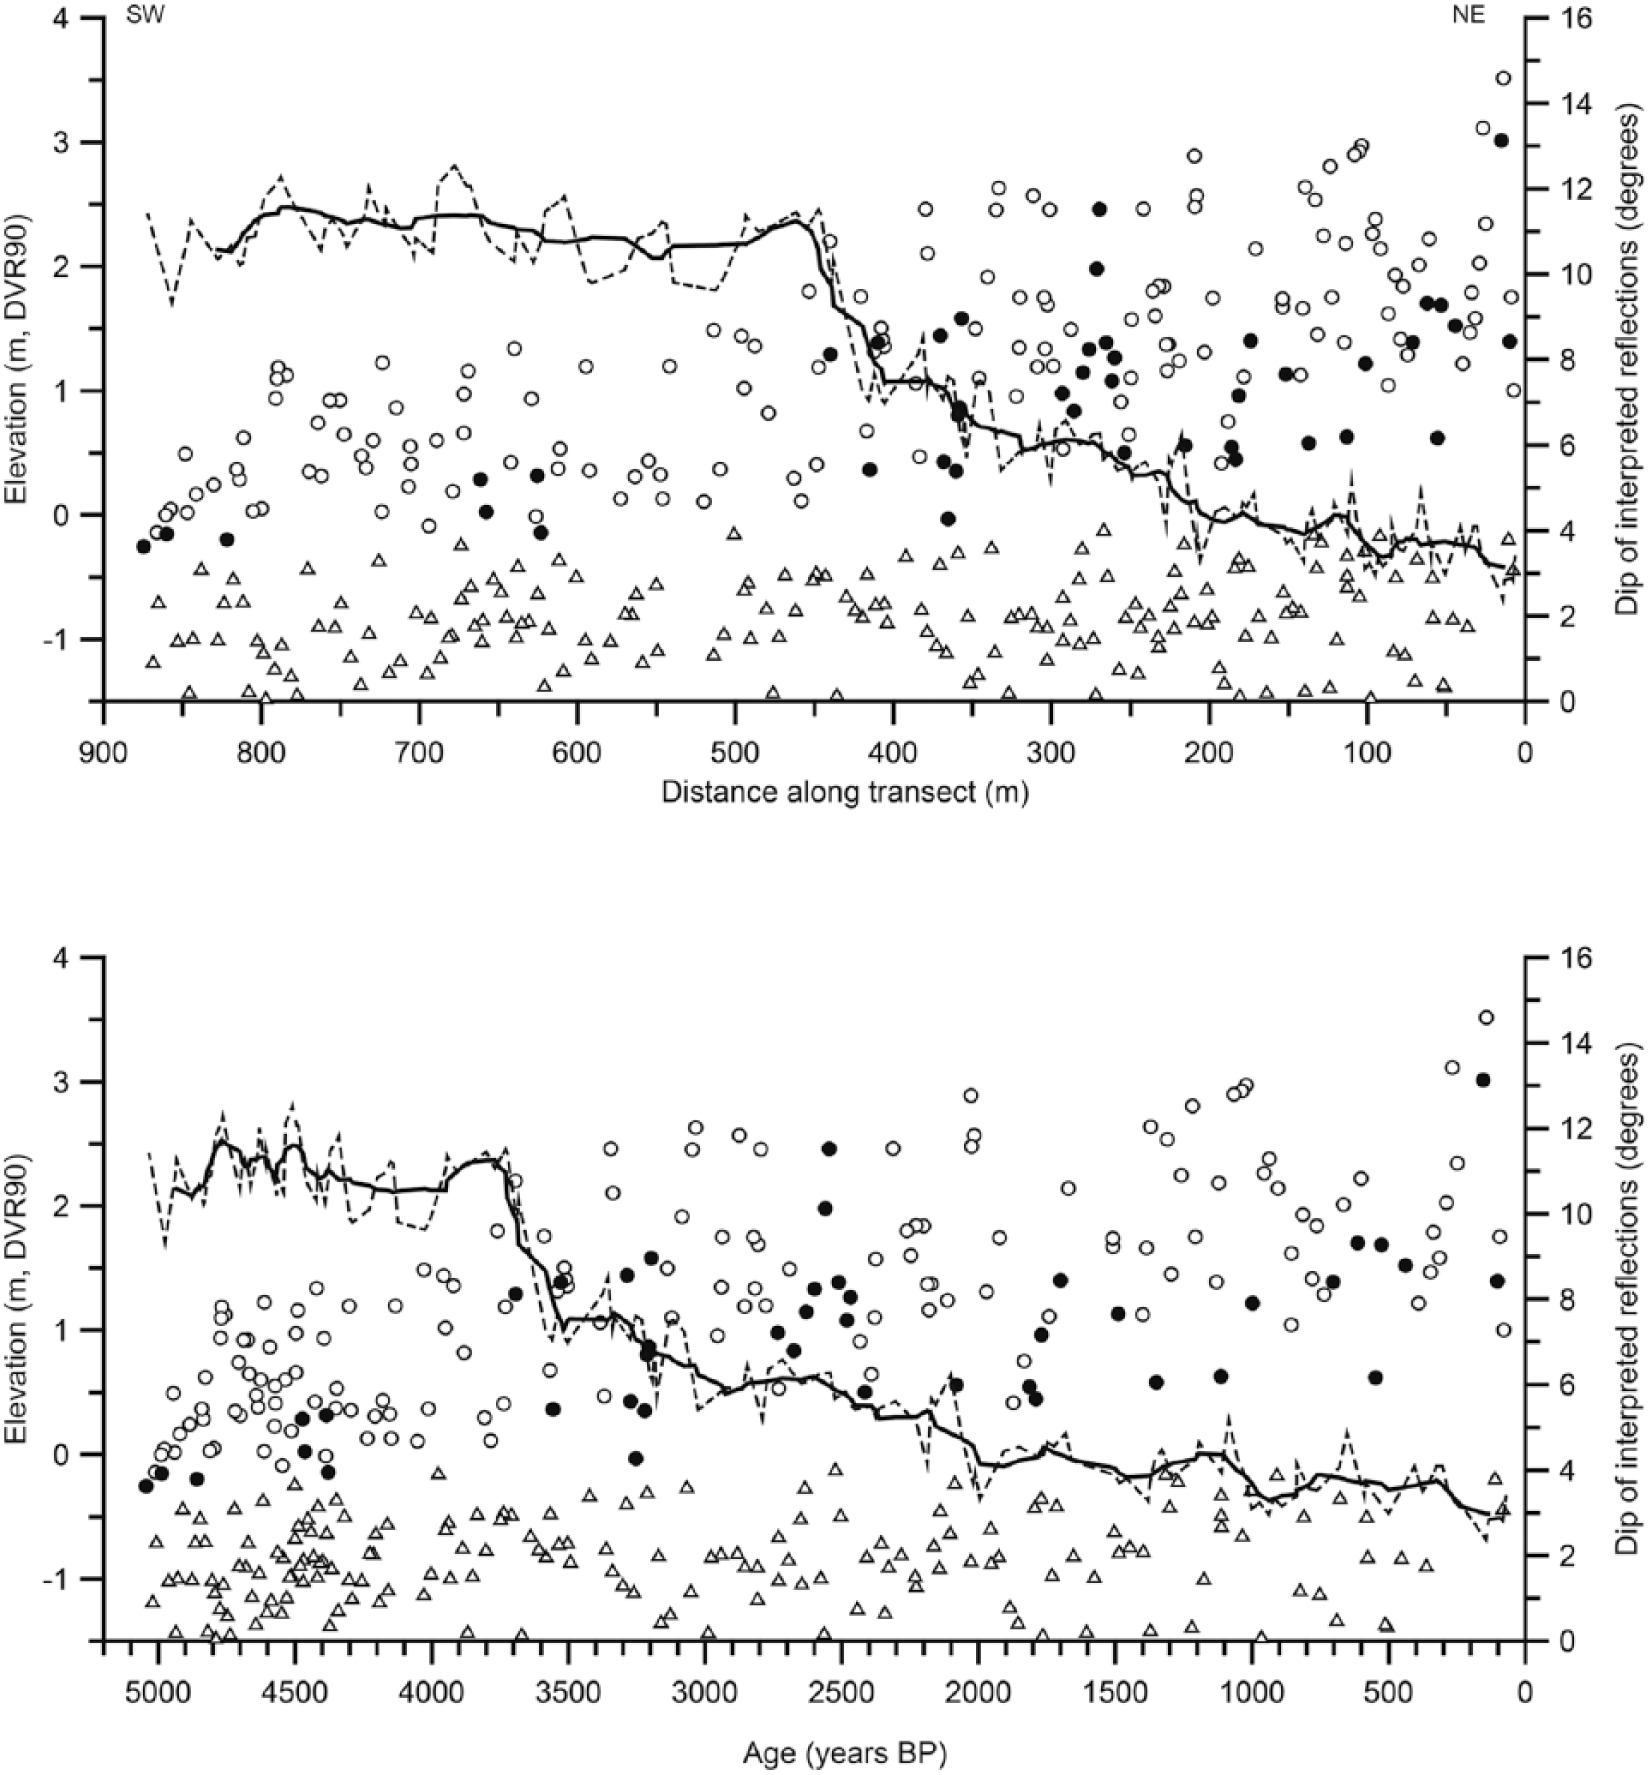
Plot of the dips of the beachface and upper shoreface reflections as a function of distance (top figure) and age (bottom figure). Triangles represent dips of the interpreted upper shoreface reflections. White circles represent dips of the interpreted beachface reflections and black circles represent dips of the interpreted beachface reflections where a beach step reflection has additionally been identified. The dashed line represents relative sea-level variations based on vertical levels of all downlap points. The solid line represents a smoothed relative sea-level curve (running mean with a window width of 7).
Around c. 450 m, corresponding to c. 3750 yr BP, the dips of the beachface reflections start to increase (Figure 8). This change in dip is contemporaneous with the marked change in topography and decrease in vertical levels of downlap points. From c. 450 to 0 m, corresponding to the period from 3750 yr BP to present day, the dips vary between c. 4° and 15° (average of c. 9°). These are steeper dips than for the oldest part of the transect. The increase in dips of the beachface reflections indicates a change in wave energy and/or grain size (source material, longshore sorting, distance) and thereby a change of the dominant morphodynamic conditions from high wave energy to the low and moderate wave conditions characteristic of reflective beaches (cf. Davis and Fitzgerald, 2004). In contrast to the dips of the beachface reflections, the dips of the upper shoreface reflections do not show any significant changes through time (Figure 8). The variability in the dips of the upper shoreface appears to be almost the same along the transect, and the average dip for the interval from 0 to 450 m is c. 2.0° and the average dip for the interval from 450 to 900 m is 1.8°. The interpretation of a decrease in wave energy is supported by the increased number of identified beach steps observed in the same interval (filled circles in Figure 8) (Austin and Buscombe, 2008; Masselink and Kroon, 2004). As revealed by the age model, the progradation rate is slowing down and the ridges that are now building up slowly suggest a significant drop in sediment supply. The indication of an RSL decrease is strongly supported by the observation that the tops of the ridges are not at the same level, but decrease towards the present coastline. Detailed analyses of grain size variations along the transect are open for future investigations and may add new knowledge about changes in the morphodynamic conditions and the development of the beach ridge system.
Conclusion
In this study, we use downlap points identified in GPR data collected across a raised beach ridge system on Samsø, Denmark, to reconstruct changes in past RSL. Our study shows that the method for using downlap points as markers of sea-level as described by Nielsen and Clemmensen (2009), Clemmensen and Nielsen (2010) and Hede et al. (2013) works properly for a continuous succession of beach ridge of mid- to late Holocene age in the microtidal environment at Samsø.
Furthermore, this new data set shows that beach steps can be preserved and resolved in GPR reflection data. A break in the beachface reflections and increase in dip is interpreted to represent the beach step. This is consistent with the findings of dips of the modern beachface and beach step based on cross-shore beach profiles. Since actual sea-level is located close to the beachface–beach step transition, the vertical levels of the downlap points identified at the base of the beach step reflections have to be corrected for the height of the beach step in order to be used as a marker of sea-level.
The RSL reconstruction shows an RSL plateau with high sea-level around 2.3 m above DVR90 between c. 4800 and 3800 years ago. The RSL plateau is followed by a marked decrease of c. 1.3 m at a rate of c. 6 mm/yr between c. 3800 and 3600 years ago. From 3500 to 300 years ago, the RSL overall decreased at a rate of c. 0.6 mm/yr. The decrease in RSL occurred shortly after the Holocene climatic optimum, indicating that temperature may have been a contributing factor. However, future comparison of RSL curves from the region may reveal whether differential vertical land movements can explain such variation and differences in RSL curves observed at different localities in the Danish area.
Footnotes
Acknowledgements
The ReflexW and Petrel software packages were available at the Department of Geosciences and Natural Resource Management, through grants to the University of Copenhagen. Andrew S Murray is thanked for providing OSL age determinations for the age model and Kristoffer Kildelund is thanked for help with correcting the language. We would also like to thank the two anonymous reviewers for constructive comments and suggestions to the manuscript.
Funding
This study was financed by The Danish Council for Independent Research/Natural Sciences (FNU), the Carlsberg Foundation and the Geocenter Denmark (grant 11-2011).