



Abstract
The Cape Canaveral Peninsula is the largest Holocene coastal sand deposit composed of beach ridges on the Atlantic coast of Florida. It is composed of 16 beach-ridge sets that are separated by erosional surfaces. Despite its prominence as a Holocene coastal depocenter, there are a limited amount of chronological data constraining the timing of its formation. In this study, we apply optically stimulated luminescence (OSL) dating on sand-sized quartz and radiocarbon dating on individual marine shells to develop a refined chronology of the Cape Canaveral beach-ridge plain with particular focus on constraining the depositional age of the northwesterly-most, and geographically oldest, beach-ridge set on the peninsula. We obtain an average OSL age of 5680 ± 240 years (n = 4) for the initiation of coastal deposition at Cape Canaveral. The new ages, and the organization of beach ridges into 16 distinct sets indicates that the Cape Canaveral beach-ridge plain experienced an ~5700-year history of alternating deposition and erosion, with 75% of present-day Cape Canaveral (Beach-ridge Sets 5–16) deposited over the past 2000 years and Beach-ridge Sets 8–16 comprising 50% of the area over the past 1000 years. Because the minimum swale elevations of the ~5700-year Beach-ridge Set 1, and those of all the younger beach-ridge sets, are within several decimeters of present-day mean higher high water, we hypothesize that all the beach ridges present at Cape Canaveral could have been deposited at or within decimeters of present-day sea level. There is no evidence for Holocene “highstand” events over the past 5700 years in the published sea level curves from northeast and south Florida, which are based on subsurface estuarine foraminifera/leaf litter and mangrove peat data, respectively. This dichotomy illustrates the need to integrate both subaerial and subsurface data to produce a more realistic Holocene sea-level curve for the southeastern United States.
Introduction
During the Last Glacial Maximum 18,000 years ago, eustatic sea level was ~120 m below its present-day position (Berger, 2013). The melting of these largely northern hemisphere, continental glaciers occurred over a 10,000-year interval from 15,000 to 5000 years ago with a 1 m/100 year overall average rate of rise (Berger, 2013). Sea-level reconstructions (SLRs) for tectonically stable continental blocks in equatorial (Brazil: Angulo et al., 1999; Van Andel and Laborel, 1964) and southern hemisphere (Australia: Hesp, 1999, 2006) locations record SLRs with positions equal to or slightly higher than present-day over the past 5000–6000 years. In the northern hemisphere south of the maximum glacial advance, SLRs for the past 5000–6000 years indicate a sea level that is monotonically rising with an ever-decreasing rate of rise. This situation characterizes the basically non-tectonic Atlantic coast of North America (Massachusetts: Van Heteren et al., 2000; northeast Florida: Hawkes et al., 2016; south Florida and Caribbean: Khan et al., 2017) as well as the northeast Gulf of Mexico coast (Milliken et al., 2008) and has been attributed to the gradual collapse of a crustal forebulge formed as a result of the loading of glacial ice (Clark et al., 1978; Roy and Peltier, 2015; Walcott, 1972). This forebulge-collapse control on SLRs from the Atlantic coast of North America has been widely supported by subsurface-collected data. This subsurface sampling of supra- and intertidal peats and shell-bearing swash-zone deposits that onlap a basal transgressive disconformity is a paradigm that may well be inherently biased against the discovery of material deposited during past sea-level events equal to or higher than present-day. Those material referents would have been deposited farther landward at an elevation near that of present-day. In addition, these referents most likely would have had a relatively low preservation potential because of the lack of overlying deposits thick enough to protect against oxidation, soil-forming processes, and surface erosion, especially during any subsequent sea-level lowstand. The actual southern extent of this collapsing forebulge has been questioned by researchers working on subaerial, 5000–3000 year-old beach-ridge plains along the northeastern Gulf of Mexico coast from Alabama (Blum et al., 2003), panhandle Florida (St. Vincent Island: Forrest, 2007; López and Rink, 2007, 2008), and southwest Florida (Sanibel Island: Stapor et al., 1991) whose results indicate that sea-level was within approximately a meter of present-day at certain times during that 2000-year time interval. Subaerial archeologic data have been interpreted to indicate that several sea-level “highstands,” equal to present-day, have occurred over the past 2000 years in both panhandle and southwest Florida (Walker et al., 1994, 1995). Thus, there appears to be a pronounced difference in the interpreted SLRs from the northeast Gulf coast and the southwest Florida coast between the subsurface-collected and subaerial-collected data.
This study focuses on mapping and refining the chronology of a prominent subaerial beach ridge plain at Cape Canaveral, Florida that preserves an extensive and well-preserved history of Holocene deposition. We use OSL dating techniques to determine depositional ages for (1) the two northwesterly-most and geographically-oldest beach ridges of the Cape Canaveral beach-ridge plain, (2) the subsurface sand facies 20 m west (core CCT22) of the oldest beach ridge, (3) the subsurface sand facies in a beach ridge located in the central part of the beach-ridge plain (core CCT14), and (4) the submerged marine-sand floor of a prominent swale located near the eastern tip (core CCPS02). In addition, we present suites of radiocarbon ages of single shells collected from various beach-rock exposures that supplement the OSL-derived chronometric framework. These ages are used to develop a revised chronology together with previously determined OSL ages (Rink and Forrest, 2005). We have also developed a detailed map of the individual beach ridges and constructed three crest-perpendicular topographic profiles using high-resolution LiDAR data. This map has enabled the determination of crest orientations as well as the interpretation of distinct beach-ridge sets based on erosional truncations and onlapping relationships. The topographic profiles have been used to quantify swale elevations in order to estimate ancient Mean Higher High Water (MHHW) positions during the construction of their adjacent beach ridges. There are few other locations on the eastern seaboard of North America that preserve such an extensive record of Holocene subaerial coastal deposition; this study serves to increase awareness of this archive to the broader scientific community.
Geologic and geographic setting
The Cape Canaveral beach-ridge plain, or “complex cuspate foreland” (Gulliver, 1895; Johnson, 1919; Kurz, 1942; White, 1958, 1970) along with the immediately landward Merritt Island beach-ridge plain are the two prominent geographic features of Florida’s east coast. Merritt Island, the Cape Chester of May (1972), is a geographically restricted, volumetrically significant, beach-ridge plain of Pleistocene age (MIS5; Burdette et al., 2010; Osmond et al., 1970; Rink and Forrest, 2005). Chester Shoal (Figure 1) is a possible erosional remnant of a Pleistocene shoal originally attached to Merritt Island. The sediments that comprise both the Pleistocene Merritt Island and the Holocene Cape Canaveral beach-ridge plains consist almost exclusively of quartz sand and carbonate sand- to pebble-size shell fragments. Siliciclastic silt and clay are essentially absent; the silt- and clay-size material found in the water-filled, crescent-shaped swales at the southeast tip of Cape Canaveral are organic debris from the plants that colonize these ponds.
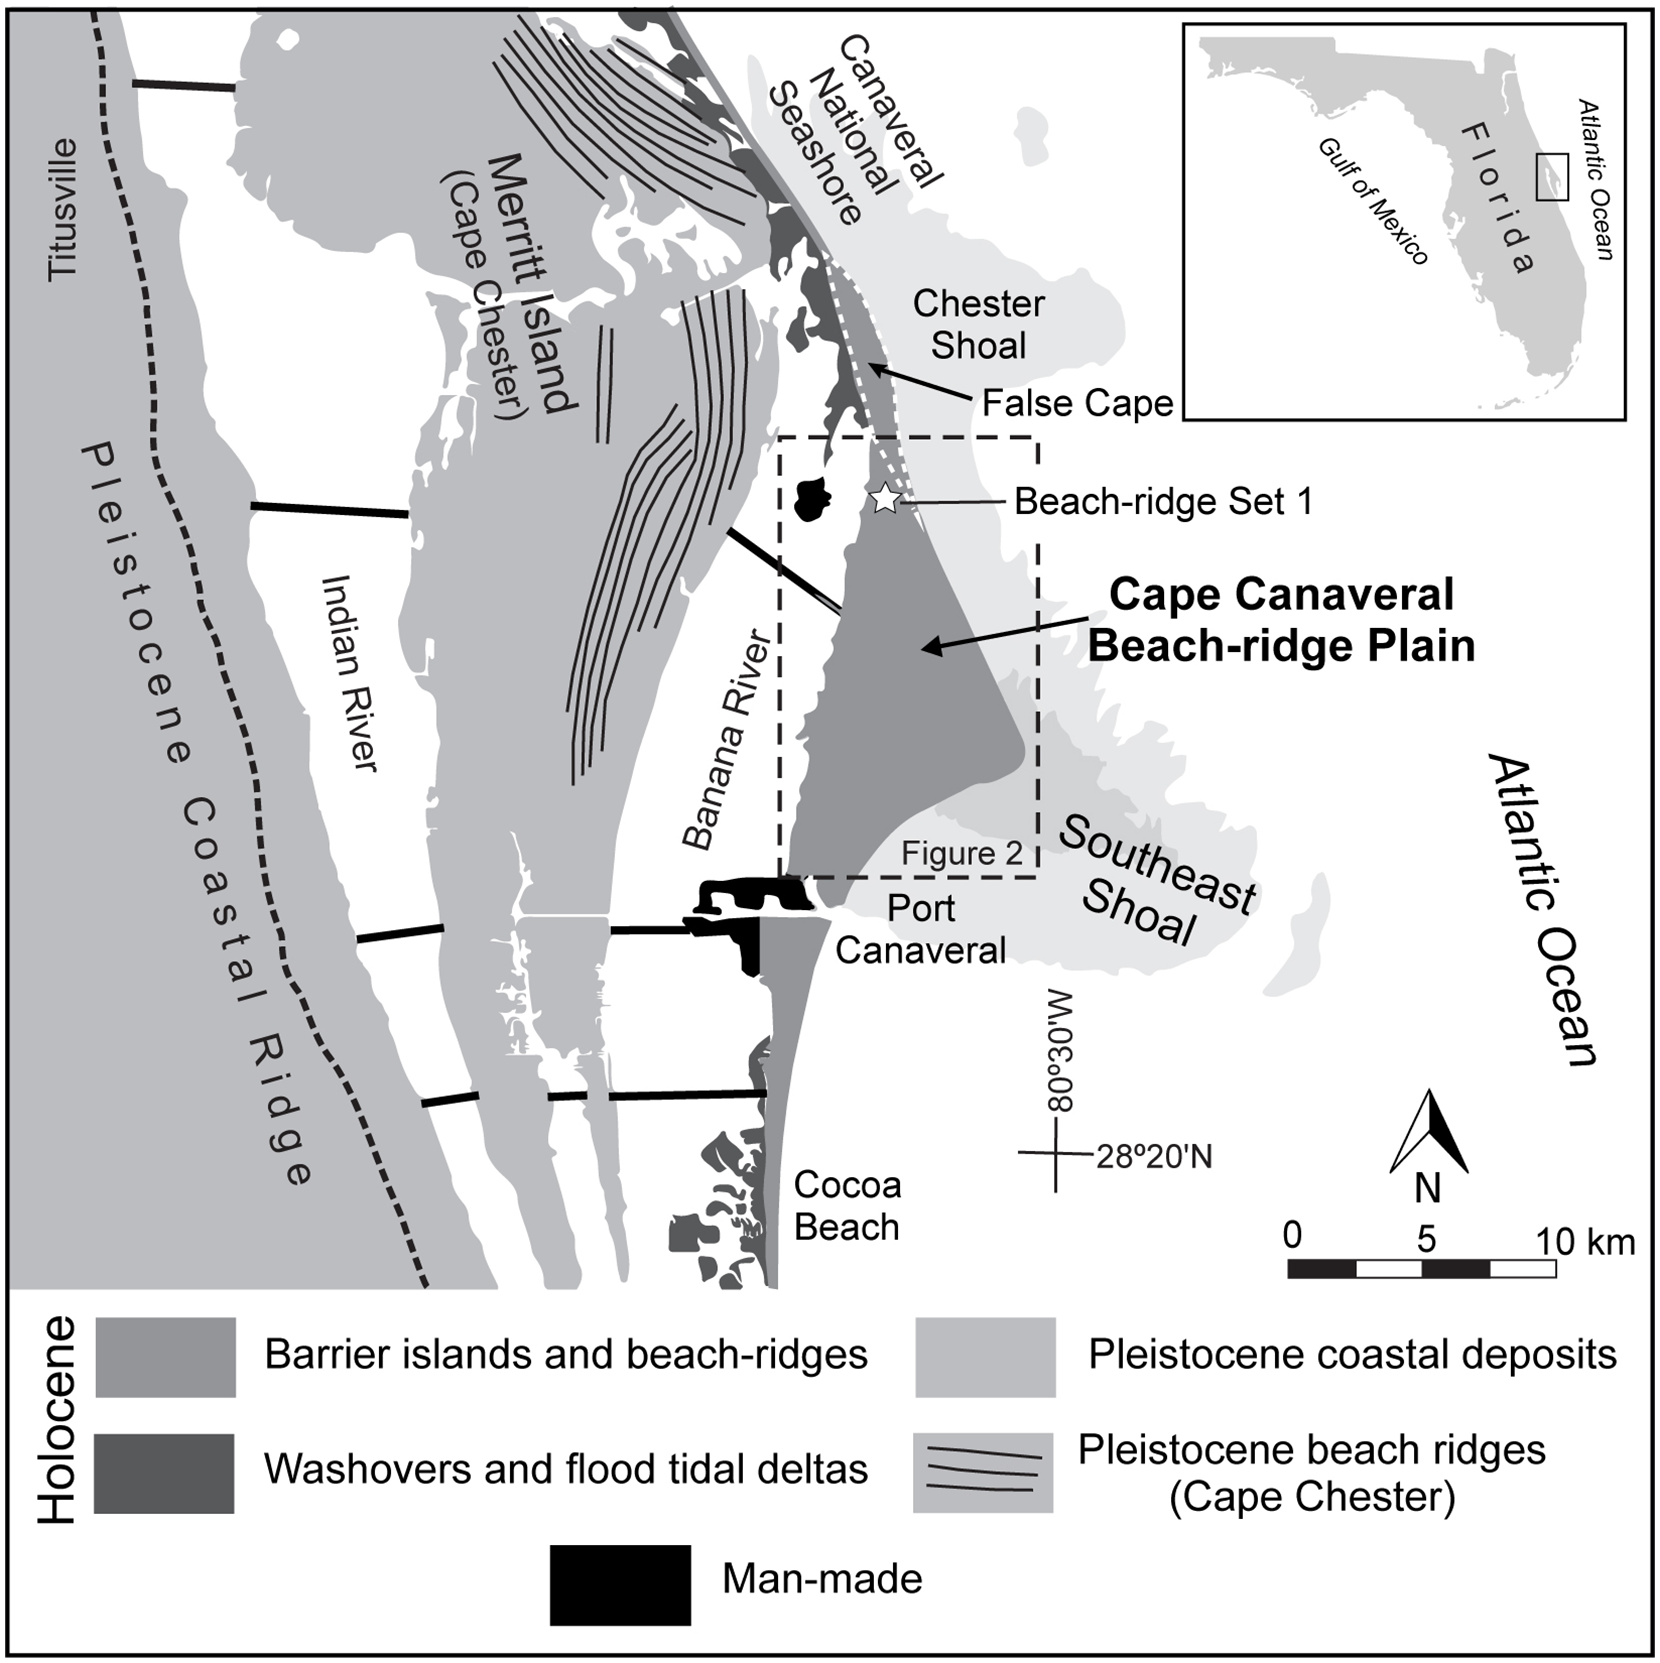
Location map of the Cape Canaveral beach-ridge plain, located on the east, Atlantic coast of Florida. The Chester and Southeastern sub-tidal shoals are outlined to the <3 m (darker gray pattern) and 3–8 m (lighter gray pattern) depths. Observe the Holocene washover and flood tidal delta deposits in the Banana River (actually a lagoon) on the western margin of the narrow Holocene barrier islands at Cocoa Beach, False Cape, and the Canaveral National Seashore. Note also the Pleistocene beach ridges on Merritt Island that define Cape Chester; the northernmost of these Pleistocene ridges are truncated immediately landward of the Holocene barrier island that comprises the Canaveral National Seashore.
The Holocene Cape Canaveral beach-ridge plain is separated from Merritt Island by the 10 km-wide Banana River (actually a lagoon) and extends 10 km out into the Atlantic Ocean (Figure 1). At its eastern tip this beach-ridge plain abuts Southeast Shoal which extends 12 km farther out into the Atlantic (Figure 1). This triangular-shaped beach-ridge plain thins toward the south into a narrow barrier island and to the north is truncated by the much smaller False Cape beach-ridge plain (Figure 1). Arguably, the Cape Canaveral beach-ridge plain and its adjacent Southeast Shoal constitute the largest volume of geographically restricted, Holocene coastal deposits in the southeastern United States.
The Cape Canaveral part of the Florida coast is micro-tidal (1.2 m, United States Department of Commerce [USDC], 2020) and of relatively low wave-energy (1.2–1.4 m and 6.1–7.7 s for average significant waves, Corson et al., 1981). Mineralogic and textural examination of Holocene barrier islands and other coastal deposits along the northeast Florida coast indicate the presence of distinct sand masses along the 230 km coast from Jacksonville to Cape Canaveral. This is an indication of a compartmented rather than integrated littoral drift system along this straight, continuous shoreline that is broken by only two natural inlets (Stapor and May, 1983). This compartmented littoral drift system further suggests that the sediment deposited into the Cape Canaveral beach-ridge plain primarily came from local erosion of the Pleistocene Merritt Island beach-ridge plain and any associated shoals as well as onshore transport of material present on the adjacent nearshore shelf. Given the kilometers-long continuity of the individual beach ridges that comprise the Cape Canaveral beach-ridge plain, hurricane-produced impacts appear to have been limited to the immediate beach, berm, and any back-beach ridge.
Beach-ridge origin and chronometry
The geomorphic term “beach ridge” has been, and continues to be, used to describe any ridge at or along a beach which can be formed by wave, wind, storm surge, or any combination of these three processes (Hesp, 2006; Stapor, 1982; Tamura, 2012; Taylor and Stone, 1996). Beach ridges formed of sand in other Florida micro-tidal and low wave-energy settings have been interpreted as having been initiated and largely constructed as the result of wave processes (Forrest, 2007; Stapor, 1975; Stapor et al., 1991) with the ridges possibly having local foredune caps or decoration. However, many sandy beach-ridge plains in Australia have been interpreted as being primarily foredunes on top of a wave-constructed berm (e.g. Hesp, 1999, 2006 for examples and review). In general, there is some agreement that wave processes form an initial berm which is then followed by upbuilding either by swash deposition by waves, foredune deposition by wind, or some combination of both (Otvos, 2000; Tamura, 2012).
Most chronologies of coastal deposits, both subaerial and subtidal, are based heavily on radiocarbon dating (e.g. Rodriguez and Meyer, 2006; Tamura et al., 2007; Tanigawa et al., 2013). However, developing an accurate radiocarbon chronology can be problematic in coastal settings because of (1) a frequent lack of suitable materials because marine shells are susceptible to chemical dissolution in sand deposits and (2) the ability of such “suitable” materials to directly date the time of deposition and not just estimate the age of the radiocarbon-dated material (Oliver et al., 2015; Tamura, 2012). The first step in minimizing potential variability is to radiocarbon date single shells. Secondly, selecting only articulated, in life-position pelecypods maximizes the ability of the radiocarbon age to estimate the time of deposition of the surrounding siliciclastic material. This “in life-position” requirement basically rules out many coastal deposits and all beach-ridge plain deposits given that they result from the deposition of material that has been transported from elsewhere. All other mollusk shells must be considered clasts which can only provide maximum estimates of the time of deposition of the surrounding siliciclastic material. One strategy to minimize the problem of older shells being reworked into younger deposits is to radiocarbon date enough shells until there is a cluster of overlapping ages at the younger end of a spectrum of ages (Stapor et al., 1991). Such a cluster will provide an estimate of the actual depositional age; the more members in the cluster the better the estimate will be. In this way, the ages of reworked shells can provide extremely important information on both the ages and locations of probable sources for some of the siliciclastic material having been reworked.
Optically stimulated luminescence (OSL) dating, which is not reliant on the presence of organic material, has become an increasingly utilized tool for constructing sediment chronologies over the last ~200,000 years (Rhodes, 2011). The technique allows for assessment of the time elapsed since silicate minerals were last exposed to sunlight, and hence, the depositional age of sand- or silt-size sediments. OSL dating has been successfully applied to many coastal aeolian, intertidal, and subtidal deposits, and has contributed largely to our understanding of rates and processes in these depositional settings (e.g. Jacobs, 2008; Murray and Clemmensen, 2001; Reimann et al., 2012; Rink and Forrest, 2005; Tamura et al., 2019; Van Heteren et al., 2000).
Previous chronometric investigations at Cape Canaveral
Brooks (1972) mapped the Cape Canaveral beach-ridge plain as undifferentiated deposits of sand, shell, clay, marl, and peat of Holocene age on the basis of radiocarbon dating that was performed yielding uncorrected and uncalibrated ages of ⩽7670 years BP (Figure 2a). Brooks’ radiocarbon ages, the earliest reported chronometric data from the Cape Canaveral beach-ridge plain, describe a coherent and reasonable chronometric framework with younger deposits located southeastward consistent with the overall direction of progradation inferred by beach-ridge geography (Figure 2a). However, it is unclear if these samples comprised multiple shells or only a single shell and more importantly, only a single radiocarbon age determination was made at a given sample site. Brooks’ ages cannot take into account the potential for re-deposition of older shells into younger deposits as is strongly indicated by the obvious erosion/truncation the older beach ridges at Cape Canaveral. Rink and Forrest (2005) determined OSL depositional ages for the Cape Canaveral beach-ridge plain ranging from 4200 to 150 years, also showing a southeastward progression of younger ages consistent with the direction of long-term progradation (Figure 2a). However, these depositional ages are 2000–3000 years younger than the radiocarbon ages of Brooks (1972) on shells contained within geographically nearby deposits. This discrepancy is an indication that although Brooks’ radiocarbon ages yield the correct younging direction, they may significantly overestimate the actual time of deposition.
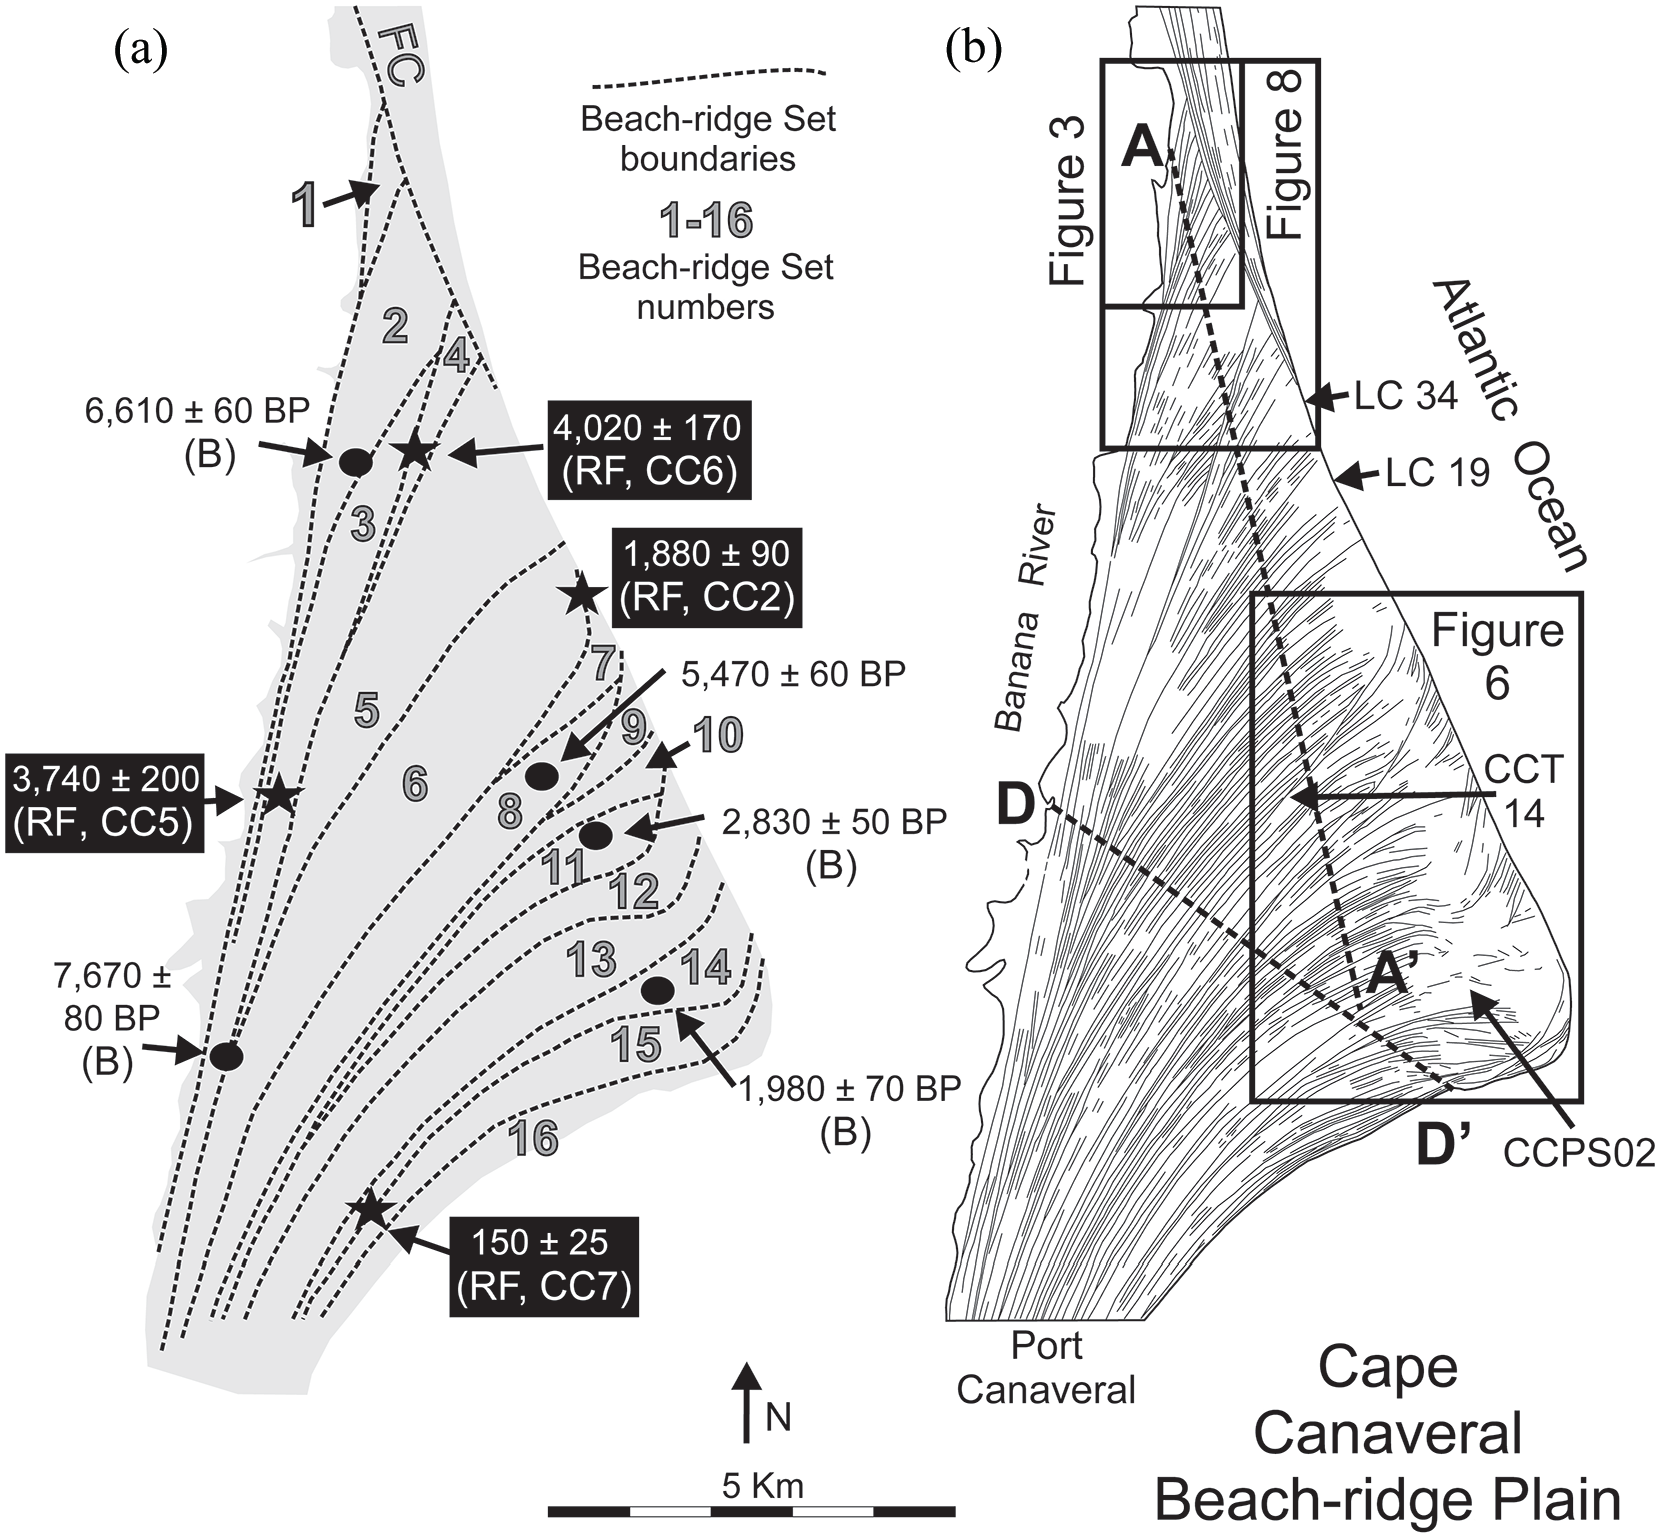
Architecture of the Cape Canaveral beach-ridge plain. (a) The beach ridges at Cape Canaveral have been organized into 16 sets defined on the basis of erosional truncations and/or lateral onlaps. Set boundaries are shown by the dashed lines. The existing chronometric data for the Cape Canaveral beach-ridge plain consists of radiocarbon shell ages (in uncalibrated years BP where “present” is 1950, Brooks, 1972) and OSL quartz sand ages (Rink and Forrest, 2005). The Brooks (1972) uncalibrated radiocarbon ages are located by the black circles; the respective ages are followed with a (B). Rink and Forrest (2005) ages are located by the black stars with the respective ages followed by (RF); the CC2, CC5, CC6, or CC7 designate individual samples. (b) The vast majority of the individual beach ridges that are preserved in the Cape Canaveral beach-ridge plain are shown by the narrow black lines. Blank areas where beach ridges are missing result from construction at the Cape Canaveral Air Force Station; ridges are widely spaced at the southeastern tip because of very wide swales as well as construction. This line drawing was made from 2007 LiDAR images. The locations of topographic profiles AA′ and DD′, also based on the 2007 LiDAR data, are shown by the two dashed lines. Cores CCT14 (OSL sample) and CCPS02 (used to determine the base of the wide swales and OSL sample) are located by the black arrows. Sea cliffs where shells comprising beach-rock were collected for radiocarbon dating are shown at LC34 and LC19.
Methods
LiDAR mapping of beach-ridges
Compilation of a Cape Canaveral beach-ridge plain LiDAR digital elevation map was accomplished using the 2007 LiDAR coverage available for download at http://digir.fiu.edu/LIDAR/LIDARNew.php and processed using the Global Mapper© GIS software package. The LiDAR data was processed to display bare ground elevations only and eliminated other potential elevations such as structures and vegetation from consideration. The vertical resolution of the LiDAR data is 0.15 m. A custom color gradient was developed in order to display subtle elevation changes over the relatively flat terrain as a Digital Elevation Model (DEM). For the full suite of LiDAR images and base data see Doran et al. (2014). A highly detailed topographic map was produced from the LiDAR images, which permitted the beach ridges to be organized into 16 beach-ridge sets (Figure 2a, b). Additionally, three detailed crest-perpendicular topographic profiles constructed from the LiDAR data. Profile AA′ was positioned to cross the swales in more proximal locations relative to ancient, eastern tips (Figure 2b) and profile DD′ to cross the swales in more distal positions (Figure 2b). A third crest-perpendicular topographic profile PA-PA′ was positioned to cross the crests of Beach-ridge Set 1 starting at the location of core CCT22 and extending to the dune fringe immediately west of the False Cape beach-ridge set (Figure 3a). As far as ridge and swale elevations are concerned, these profiles can be considered purely random. These topographic profiles contain examples of the following geomorphologies: (1) individual ridges separated by distinct swales, (2) amalgamated ridge and swale sets with elevations of the intervening swales noticeably higher than the obvious “bounding” swales, (3) swales of much lower, but nearly concordant, elevations which occur in all of the beach-ridge sets, and (4) isolated ridges that are markedly higher than the vast majority of ridges. A contour map of Beach-ridge Set 1 was constructed from the DEM using a contour interval of 0.3 m with zero being Mean Sea Level (MSL); this map shows the detailed topography of ridges and, more importantly, of the intervening swales (Supplemental Figure 1).
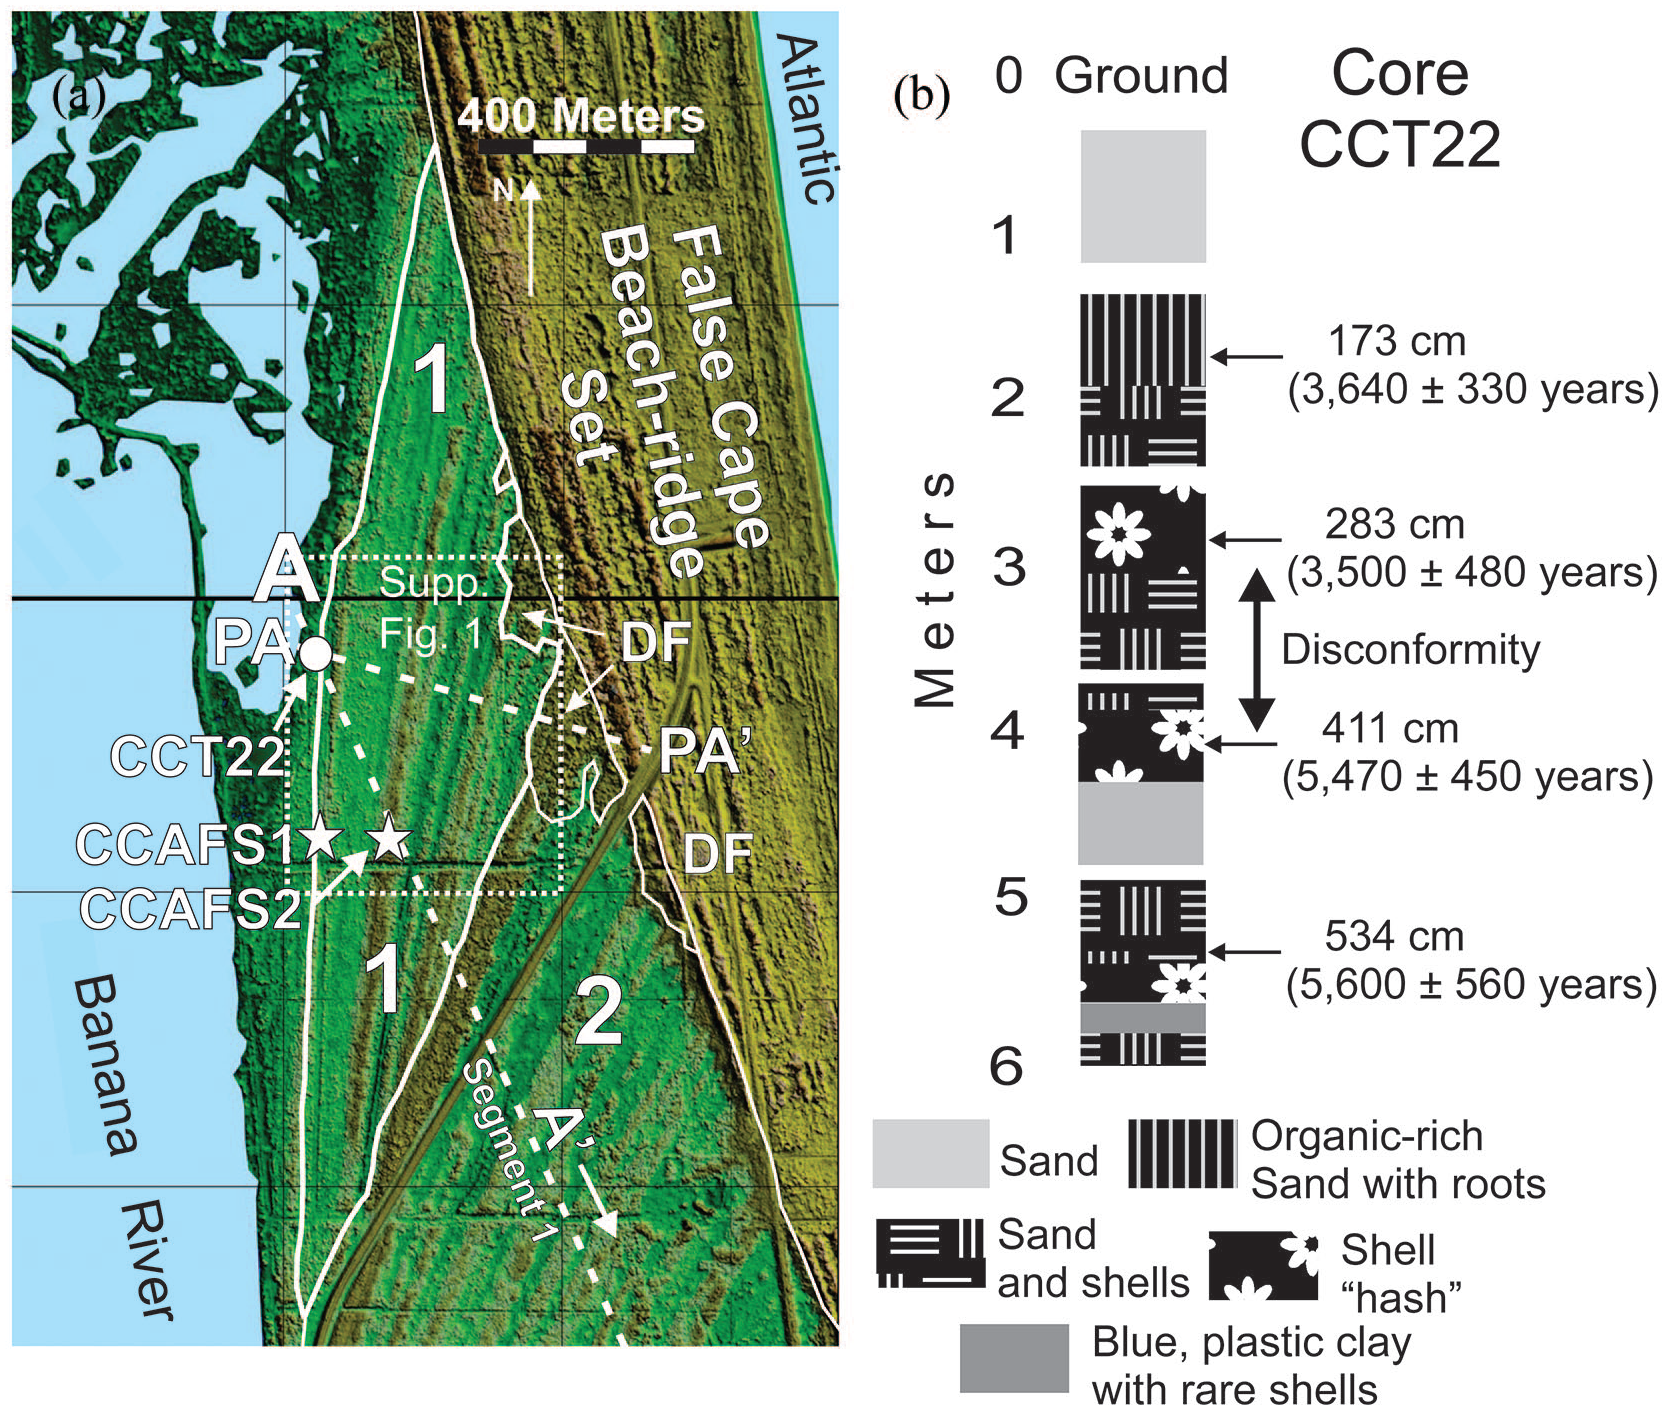
(a) This LiDAR image shows the region of Beach-ridge Set 1, the oldest subaerial, coastal deposit preserved at the Cape Canaveral beach-ridge plain. The white numbers 1 and 2 identify the beach-ridge sets, the borders of which are shown by the solid white lines. The very much younger False Cape Beach-ridge Set is separated by a dune fringe (DF) that transgresses over Beach-ridge Sets 1 and 2. The northern segment of topographic profile AA′ is shown by a white dashed line as is the Beach-ridge Set 1 crest perpendicular topographic profile PA-PA′ (Figure 8). Sand samples for OSL dating were collected in Core CCT22 which is located at the landward margin of Beach-ridge Set 1. Sand samples for OSL dating were also collected from pits dug into the crests of the two oldest beach ridges in Set 1, sites CCAFS1 and CCAFS2. (b) The stratigraphic column shows the various facies units described in core CCT22. No sedimentary structures were observed except for the upper and lower planar contacts of the blue, plastic clay. The four OSL samples taken in this core are located with the short black arrows. The double-headed arrow marks the interval where a disconformity is hypothesized to exist. The evidence for this disconformity is the 1500-year age difference between OSL samples collected from −283 and −411 cm; there is no physical surface.
OSL dating
OSL samples were primarily collected from three vertical cores each targeting three geographically distinct beach ridge sets along the Cape Canaveral beach-ridge plain. Core CCT22, which targeted the subsurface sand facies ~20 m west of the oldest beach ridge of Set 1, was collected by push-coring with a 5 cm diameter opaque black plastic tube (Figure 3). Two samples (CCAFS1 and CCAFS2) were also collected from the crests of the two oldest beach ridges of Set 1 by horizontally hammering 8 cm diameter aluminum tubes into the basal walls of ~1 m deep and wide, hand-dug pits (Figure 3a). CCT14 at Beach-ridge Set 8 was collected using similar push-coring techniques. At Beach-ridge Set 14, core CCPS02 was collected through the overlying freshwater by VibraCoring with an 8 cm diameter aluminum pipe (Figure 2b). The core lithologies were described in the field using clear tubes that were obtained by push coring adjacent to the opaque black tubes that were used for OSL dating.
The cores used for OSL dating were transported to the AGE Laboratory at McMaster University (Hamilton, Canada). In a darkroom laboratory under dim orange light, the cores were opened, and sandy intervals were sampled for OSL preparation and analysis. Following oven drying (~60°C), the samples were first treated with 10% HCl and 30% H2O2 to remove carbonates and organic material, respectively. Standard dry sieve methods were used to obtain the 212–150 µm grain size fraction. Heavy minerals were then removed from the 212–150 µm grain size fraction for each sample using Lithium polytungstate (2.70 g/cm3). The remaining quartz grains were treated with 40% HF for 40 min to etch the alpha-irradiated surface of the grains (Aitken, 1998). The samples were then immediately treated with a 10% HCl solution for 15 min and then re-sieved with 150 µm sieve mesh.
Untreated sub-samples (~30 g) of the samples removed for dating were used to determine the radioelemental concentrations of U, Th, and K via neutron activation analysis and delayed neutron counting (conducted at the McMaster Nuclear Reactor) for dose rate calculation. Gravimetric moisture content was measured for all samples. Dose rate calculations incorporated dose rate conversion factors from Liritzis et al. (2013) and Guérin et al. (2011), estimated moisture content over the burial period, and cosmic dose contribution following Prescott and Hutton (1994). All annual dose rates include an internal contribution of 10.5 μGy/a (Rink and Odom, 1991). Dose rate calculations were carried out using the DRAC v. 1.2 (Durcan et al., 2015).
Multigrain aliquots were prepared on 9.8 mm-diameter stainless steel discs. Grains were loaded onto the stainless steel discs by applying Silkospray™ through a 0.5 mm-diameter mask (~15 grains). Considering only 5–10% of quartz grains contain a measurable OSL signal (Duller et al., 2000), we expect the 0.5 mm aliquots to closely approximate single grain measurements. Luminescence measurements on samples from cores CCT22, CCT14, and CCPS02 were conducted using a Risø OSL/TL-DA-15 reader. Photons were detected through an EMI 9635QA photomultiplier tube fitted with a 7 mm-thick Hoya U-340 filter. Measurements were carried out using blue diodes (470 ± 30 nm) operating at 90% power (~30 mW/cm2). Laboratory irradiations were performed using a calibrated 90Sr/90Y radioactive source attached to the Risø luminescence reader (dose rates of ~0.08 Gy/s). Measurements on samples CCAFS1 and CCAFS2 were made using the same experimental set-up but on an automated Risø TL-DA-20 luminescence reader housed at the Desert Research Institute in Reno, Nevada, USA with a 90Sr/90Y beta radioactive source delivering ~0.13 Gy/s.
Equivalent dose (DE) measurements followed a standard SAR protocol with an embedded IR depletion test (Duller, 2003; Murray and Wintle, 2000, 2003). A total stimulation time of 100 s was used for measurements; the OSL signal was integrated from the first 0.4 s of the decay curve and the subtracted background integrated from the last the last 4 s. Dose recovery tests (Murray and Wintle, 2003) applying different preheat temperatures (ranging from 160°C to 260°C) were performed on 12 aliquots of CCT22-3 in order to test determine the optimal preheat temperature for OSL measurement. Laboratory bleaching for dose recovery tests was carried out using blue light stimulation for 400 s. Thermal transfer tests were also carried out over the same range of preheat temperatures to assess the possibility of charge transfer from light insensitive shallow traps to light sensitive OSL traps following preheating (Rhodes, 2000). A preheat temperature of 200°C and a cut-heat of 160°C was chosen for use in subsequent DE measurements.
All measurements were required to pass the following criteria for further analysis: <10% test dose error, <10% recycling ratio error, <10% recuperation, and a signal greater than 3σ above background. An additional acceptance criterion, a fast ratio of >20, was also applied to each aliquot (Duller, 2012; Durcan and Duller, 2011). All individual DE values incorporated an instrumental error of 1.5%. DE values used for age calculation were modeled using the central age model (CAM) of Galbraith et al. (1999) with a σb of 0.1 added in quadrature to reflect the intrinsic overdispersion in DE’s determined through dose recovery tests. OSL ages were determined by dividing the resultant DE by the total environmental dose rate of the surrounding sediments (Aitken, 1998; Durcan et al., 2015). Errors on age estimates were added in quadrature and incorporate errors related to dose rate and modeled DE calculations.
Radiocarbon dating
Gastropod and disarticulated pelecypod shells were collected for radiocarbon dating by the author Stapor in the late 1970s, before the advent of OSL dating, from beach-rock exposed in wave-cut cliffs at Launch Complex (LC) 34 (10 samples) and LC19 (11 samples) both of which are located within Beach-ridge Set 5 (Figure 2a). Sample pretreatment and analysis was conducted at the South Carolina Marine Resources Research Institute; liquid scintillation beta counting was employed to determine the uncorrected C14 age. Ages were corrected for carbon isotope fractionation using an assumed δ13C of 0‰ reflecting the average of marine shells (Keith and Weber, 1964). The corrected radiocarbon ages were converted to calendar ages using the Marine13 calibration curve (Reimer et al., 2013) with no localized reservoir correction. Beta Analytic Radiocarbon Laboratory of Miami, Florida carried out the calibration (Ron Hatfield, written communication). By convention, radiocarbon ages are reported in cal years BP, where 0 BP is the year 1950.
Results and discussion
OSL performance and ages
Samples consistently showed good reproducibility of the given dose throughout the range of preheat temperatures used in dose recovery experiments. Thermal transfer tests also showed no evidence for thermal transfer over the range of preheat temperatures tested (Figure 4a). Signals were bright and generally dominated by the fast component (Figure 4b, <5% of all measured aliquots were rejected on the basis of the fast ratio test). Growth curves displayed exponential growth and samples had natural signals well below signal saturation (Figure 4b). Sensitivity changes showed little change over the course of the SAR cycle. Sensitivity decreased but remained within ~20% of the first test dose response. Recuperation in our samples had a mean of ~1.4%, further supporting the appropriateness of the applied SAR protocol to these samples.
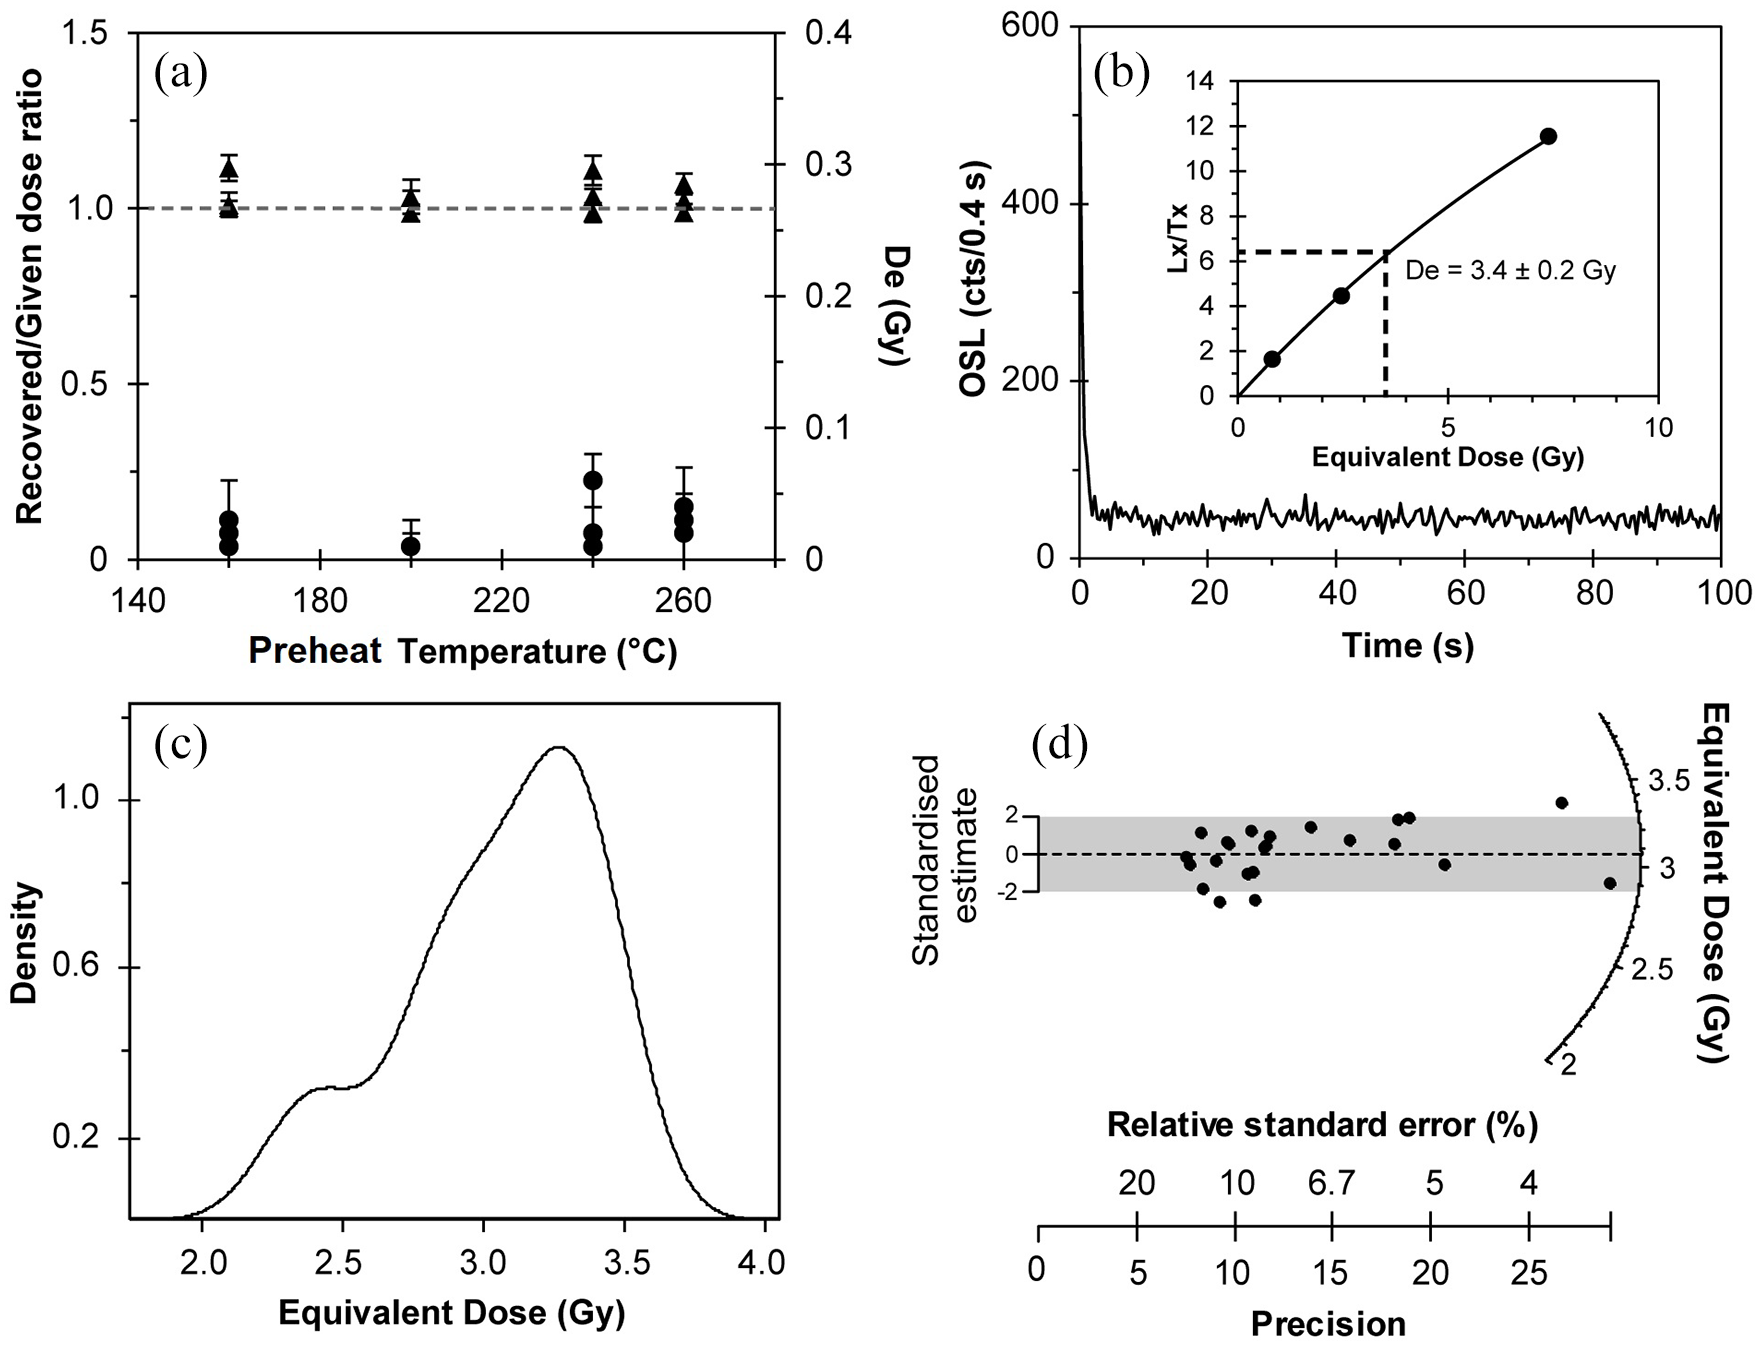
(a) Results of a dose recovery (upper) and thermal transfer test (lower) for sample CCT22-4. The cut-heat was fixed at 160°C for all measurements. (b) A typical quartz decay curves for a 0.5 mm (~15 grains) aliquot of sample CCT22-4. The inset shows a SAR dose response curve for the same aliquot. (c) Representative equivalent dose distribution for sample CCAFS1 displayed as a probability density plot. (d) Radial plot showing that 87% of data fall within 2σ of the CAM equivalent dose (shaded region).
Analytical data for luminescence dating are summarized in Table 1. The low percentage of accepted aliquots across all samples was largely the result of insensitive grains– a direct consequence of carrying out measurements of small aliquots. DE distributions were normally distributed and displayed low overdispersion (<20%) which is typical of coastal sediments (e.g. Ballarini et al., 2003). A representative DE distribution for sample CCAFS1 is displayed as both a probability density plot and radial plot in Figure 4c and d, respectively. DE distributions for all other samples can be found in Supplemental Figure 2. Samples collected from core CCT22 displayed higher overdispersion compared to the other samples, potentially owing to incomplete bleaching of sediments within the subtidal conditions in which the core CCT22 sediments were deposited. Subtidal sediments may have a greater probability of incomplete bleaching relative to foreshore or intertidal deposits due to the attenuation of solar radiation by water absorption and turbidity (Berger, 1990). An additional external source of DE scatter may be related to microdosimetry, a probable feature of coastal Florida’s low dose rate sediments (Mayya et al., 2006), or bioturbation (e.g. Bateman et al., 2007; Rink et al., 2013).
A summary of quartz OSL equivalent doses, dose rates, and calculated ages.
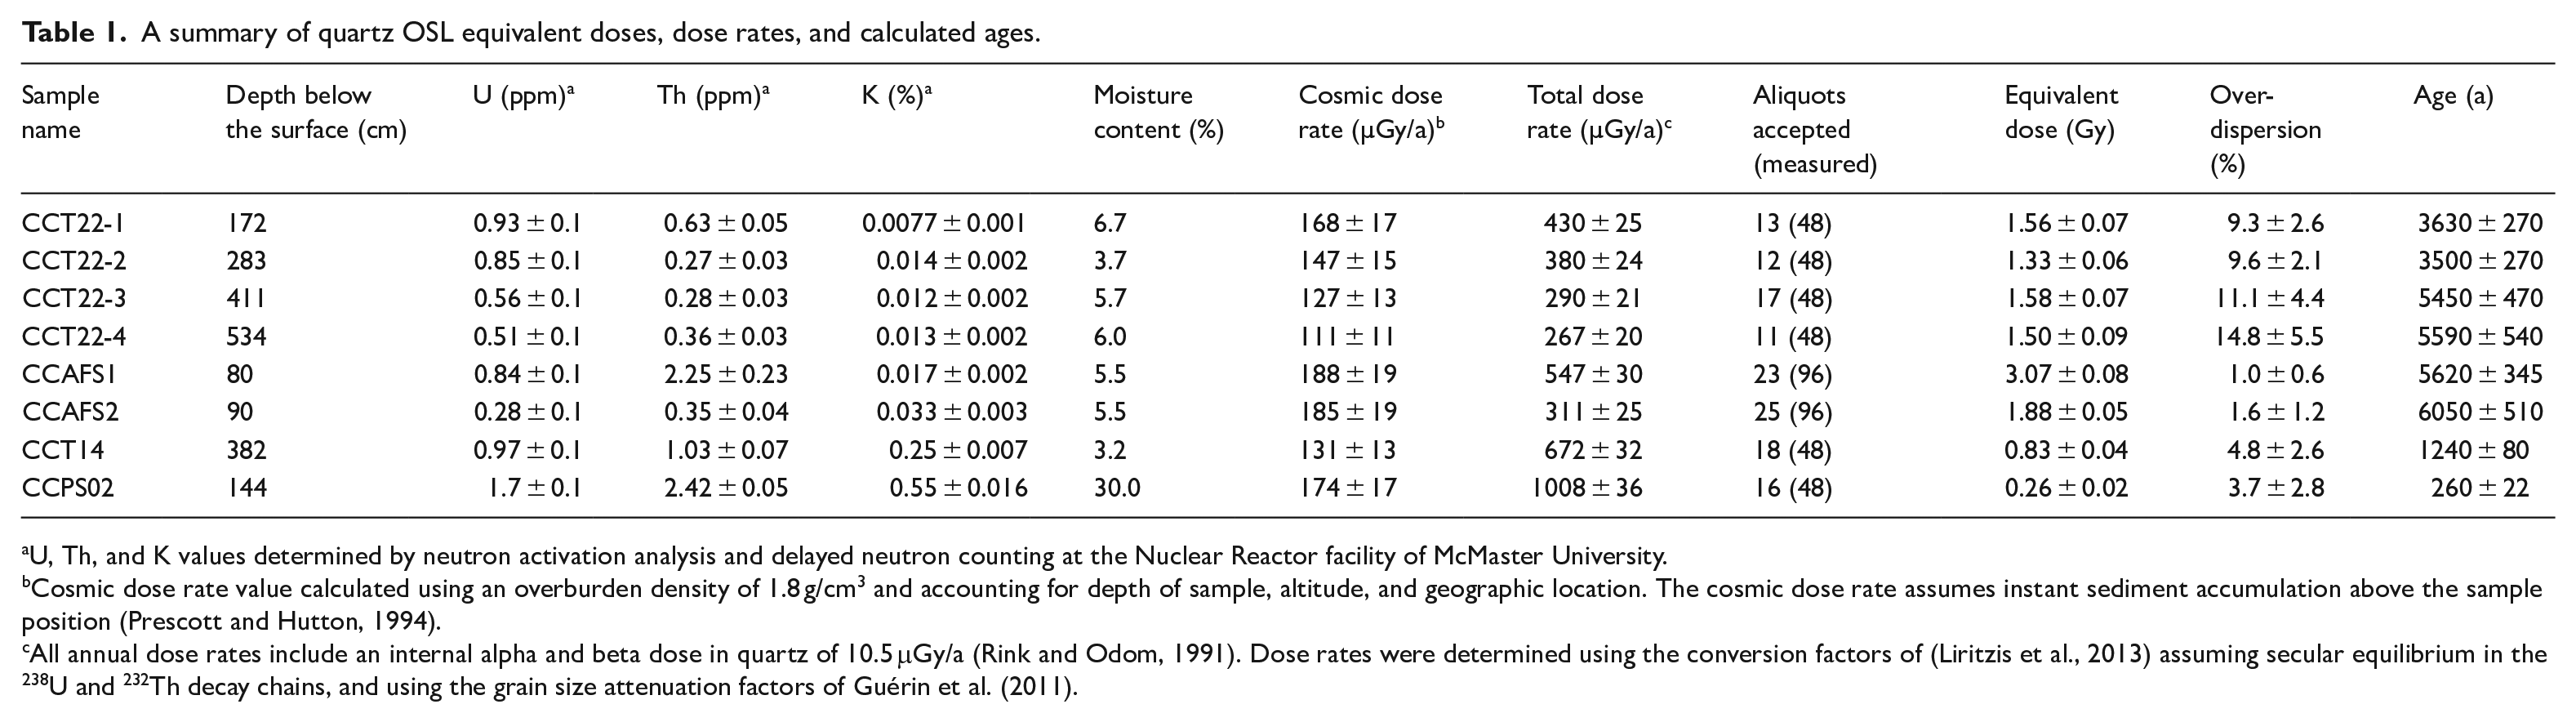
U, Th, and K values determined by neutron activation analysis and delayed neutron counting at the Nuclear Reactor facility of McMaster University.
Cosmic dose rate value calculated using an overburden density of 1.8 g/cm3 and accounting for depth of sample, altitude, and geographic location. The cosmic dose rate assumes instant sediment accumulation above the sample position (Prescott and Hutton, 1994).
All annual dose rates include an internal alpha and beta dose in quartz of 10.5 μGy/a (Rink and Odom, 1991). Dose rates were determined using the conversion factors of (Liritzis et al., 2013) assuming secular equilibrium in the 238U and 232Th decay chains, and using the grain size attenuation factors of Guérin et al. (2011).
The fundamental control on the reliability of OSL ages is whether they support the sedimentologic and stratigraphic interpretations based on geologic evidence. In the case of beach-ridge plain studies they must agree with the relative stratigraphic age relationships of the various beach ridges and sets. In order to meet this requirement, it is imperative that a suite of OSL ages be determined. The calculated OSL ages describe a coherent Holocene-age sequence with decreasing age toward the southeast of the beach-ridge plain (Table 1). Samples collected from the CCT22 core at Beach-ridge Set 1 have stratigraphically consistent ages ranging from 3630 ± 270 years to 5590 ± 540 years. The two OSL samples collected from the crests of the geographically oldest beach ridges, CCAFS1 (5620 ± 345 years) and CCAFS2 (6050 ± 510 years) (~25–150 m southeast of CCT22, respectively, Figure 3a), have ages that are statistically indistinguishable from the ages of the lower two samples collected from CCT22 (Table 1). Consistent with beach-ridge geography, OSL ages decrease toward the southeast from 1240 ± 80 years at Beach-ridge Set 8 (CCT14) to 260 ± 22 years at Beach-ridge Set 14 (CCPS02) (Table 1).
Radiocarbon ages
Calibrated radiocarbon ages, and their respective uncorrected values, made on individual marine mollusk shells from LC34 and LC19 are shown in Table 2. Ages at each site describe a ~20,000-year spectrum ranging from 2100 to 25,000 cal years BP indicating that reworking of shells from older, nearby deposits and their redeposition into younger deposits had occurred (Table 2). The youngest age at LC34 is 2100 ± 100 and 2300 ± 175 cal years BP at LC19. Stapor et al. (1991) argue that a cluster of overlapping ages at the younger end of a spectrum of shells can be used to more accurately estimate the actual, rather than just a maximum, depositional age of a deposit containing reworked shells. The larger the number of individual ages in a cluster, the greater the probability that the clusters average age estimates the actual depositional age. There is no such cluster at either the LC34 or the LC19 spectrums and thus their youngest ages of 2100 and 2300 cal years BP, respectively, are only maximum estimates and thus deposition at these two sites can be no older than these respective ages and may well be much younger. It should be noted that although a combined total of 21 individual shells were radiocarbon dated at these 2 sites, only a maximum estimate of depositional age for Beach-ridge Set 5 could be determined. We consider all of the shell radiocarbon ages of Brooks (1972) to be only maximum estimates of depositional ages as well. This maximum age estimate of Beach-ridge Set 5 is within the ~2000 year-interval of the adjacent OSL ages of Rink and Forrest (2005) determined at Beach-ridge Set 4 (CC6: 4020 ± 170, Figure 2a) and Beach-ridge Set 7 (CC2: 1880 ± 90, Figure 2a). The ~20,000 year-spectrum of ages determined on these 21 samples dramatically illustrates that redeposition of older shells into much younger deposits is a major complicating factor in the ability of shells to indicate depositional age.
Radiocarbon ages from Launch Complex 34 and 19, Beach-ridge Set 5. The calibrated ages with the white background could have been reworked from known, earlier Cape Canaveral deposits. The ages with the dark gray background most likely are reworked from the nearby Pleistocene deposits of Merritt Island; their ages are most likely the result of Holocene contamination of ~100,000-year old material. The ages with the light gray background are most likely from shells reworked from Holocene sediments located a short distance offshore which were deposited at earlier and lower sea levels. There are no clusters of overlapping ages at the young ends of these two age distributions and therefore the youngest respective ages should be considered maximum estimates of the depositional ages.
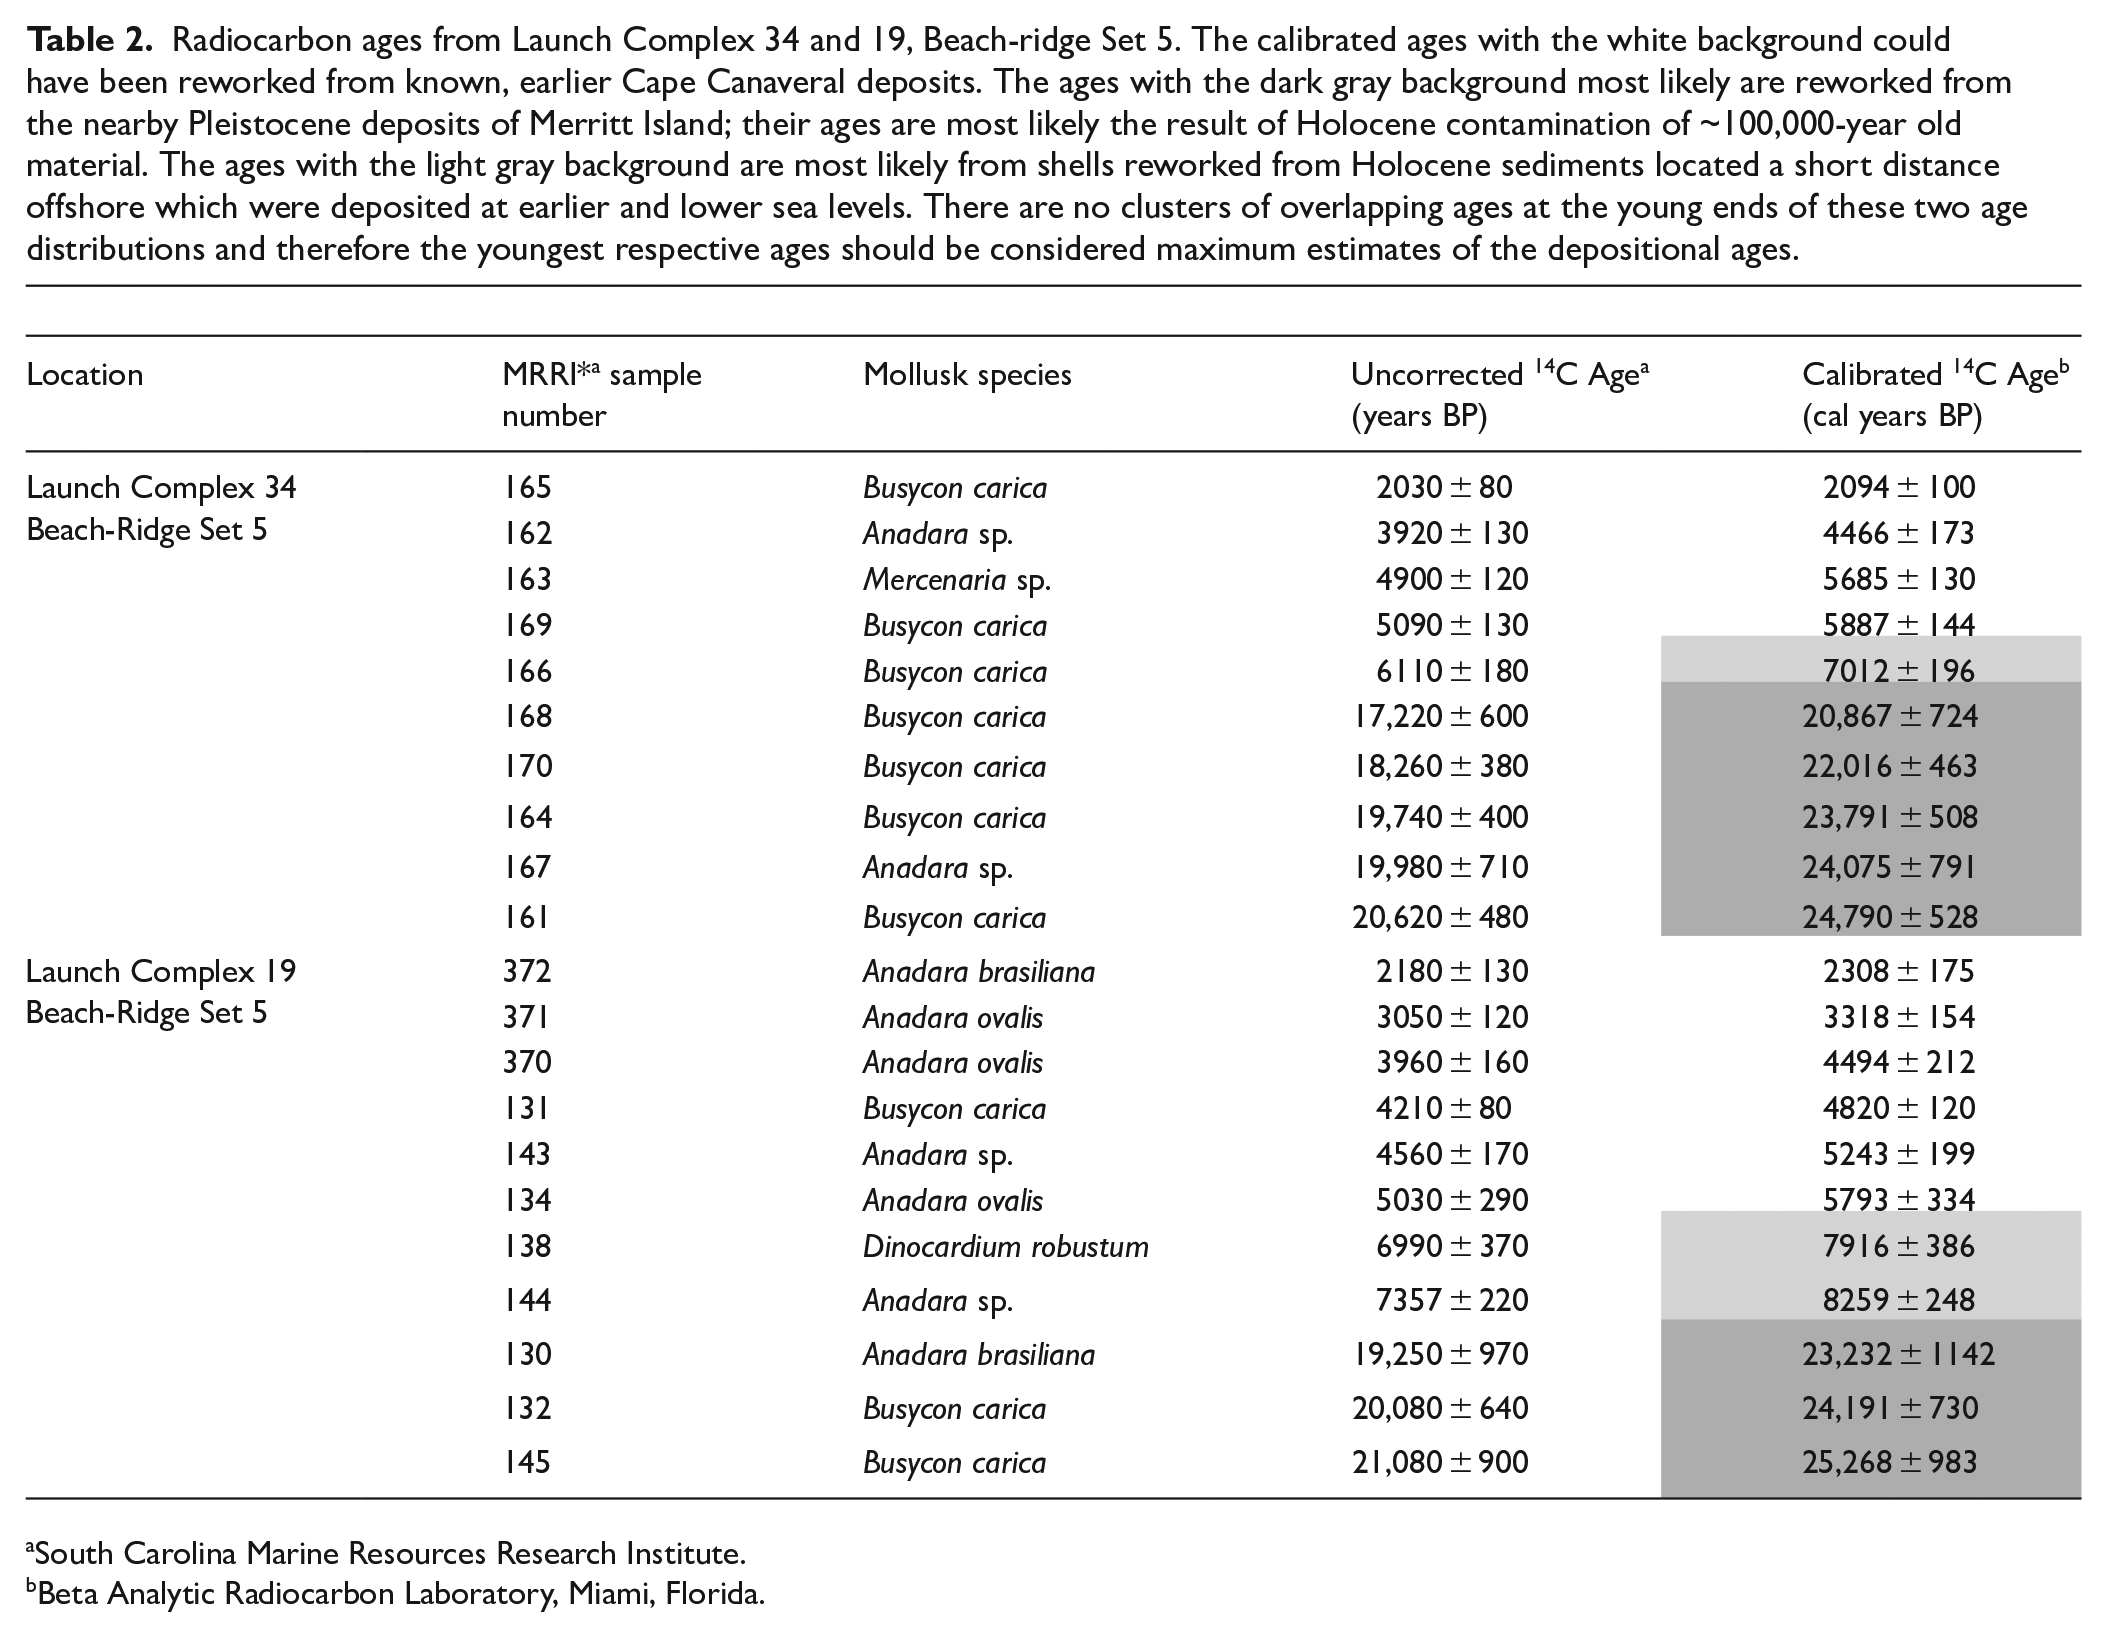
South Carolina Marine Resources Research Institute.
Beta Analytic Radiocarbon Laboratory, Miami, Florida.
Although these radiocarbon results were unable to determine the actual depositional age of Beach-ridge Set 5, they provide significant information about the sources that may have supplied the shells deposited in Set 5. The ages less than 6000 cal years BP (Table 2) most likely have come from the erosion of the previously deposited Beach-ridge Sets 1–4. The ages 7000- and 8000-cal years BP, highlighted in light gray in Table 2, most likely have come from the erosion of an as yet unidentified, earlier Holocene deposit that formed at a lower sea level. The ages 20,000 cal years BP and older, highlighted in darker gray in Table 2, are possibly the result of an undetectable <3% contamination by modern carbon and/or <5% undetected recrystallization in shells that are essentially “dead” with respect to C14 (Chappell and Polach, 1972; Olsson, 1968; Olsson et al., 1968). Furthermore, 20,000 years ago during the Wisconsin glacial lowstand, sea level was some 120 m below present day (Berger, 2013). The survival of marine shells transported across some 100 km of nearshore shelf to be deposited into Holocene beach ridges formed arguably within no more than ~5 m of present-day MSL is extremely problematic. A simpler explanation for these >20,000 cal years BP shells is that they have been eroded from the geographically and topographically nearby late Pleistocene Anastasia Formation dated by OSL to near 100,000 years (Burdette et al., 2009) that comprises Merritt Island (Cape Chester, Figure 1), and were contaminated with modern carbon at some time during their transit. Thus, the older radiocarbon ages of marine mollusk shells that comprise these two spectrums can help to identify potential nearby sources of the material redeposited into Beach-ridge Set 5.
A revised chronometric framework for the Cape Canaveral beach-ridge plain
A combination of the OSL ages of Rink and Forrest (2005) and the OSL and radiocarbon ages presented in this paper has enabled the creation of a much more complete chronometric framework for the Cape Canaveral beach-ridge plain (Figure 5). The oldest preserved deposits are some 5700 years old (Beach-ridge Set 1) and the youngest (Beach-ridge Set 16) are less than 150 years old. Most of the existing Cape Canaveral beach-ridge plain (75% of total area) was deposited in no more than 1400 years and is represented by: (1) Beach-ridge Sets 5 and 6 (24% of total area) deposited over no more than 200 years between 2100 and 1900 years, and (2) Beach-ridge Sets 8–16 (51% of total area) deposited over 1000 years between 1150 and present-day. The remaining 4300 years are presented by (1) Beach-ridge Sets 1–4, and (2) the erosional truncations or disconformities that define the boundaries between the various beach-ridge sets, especially those that bound Beach-ridge Set 4.
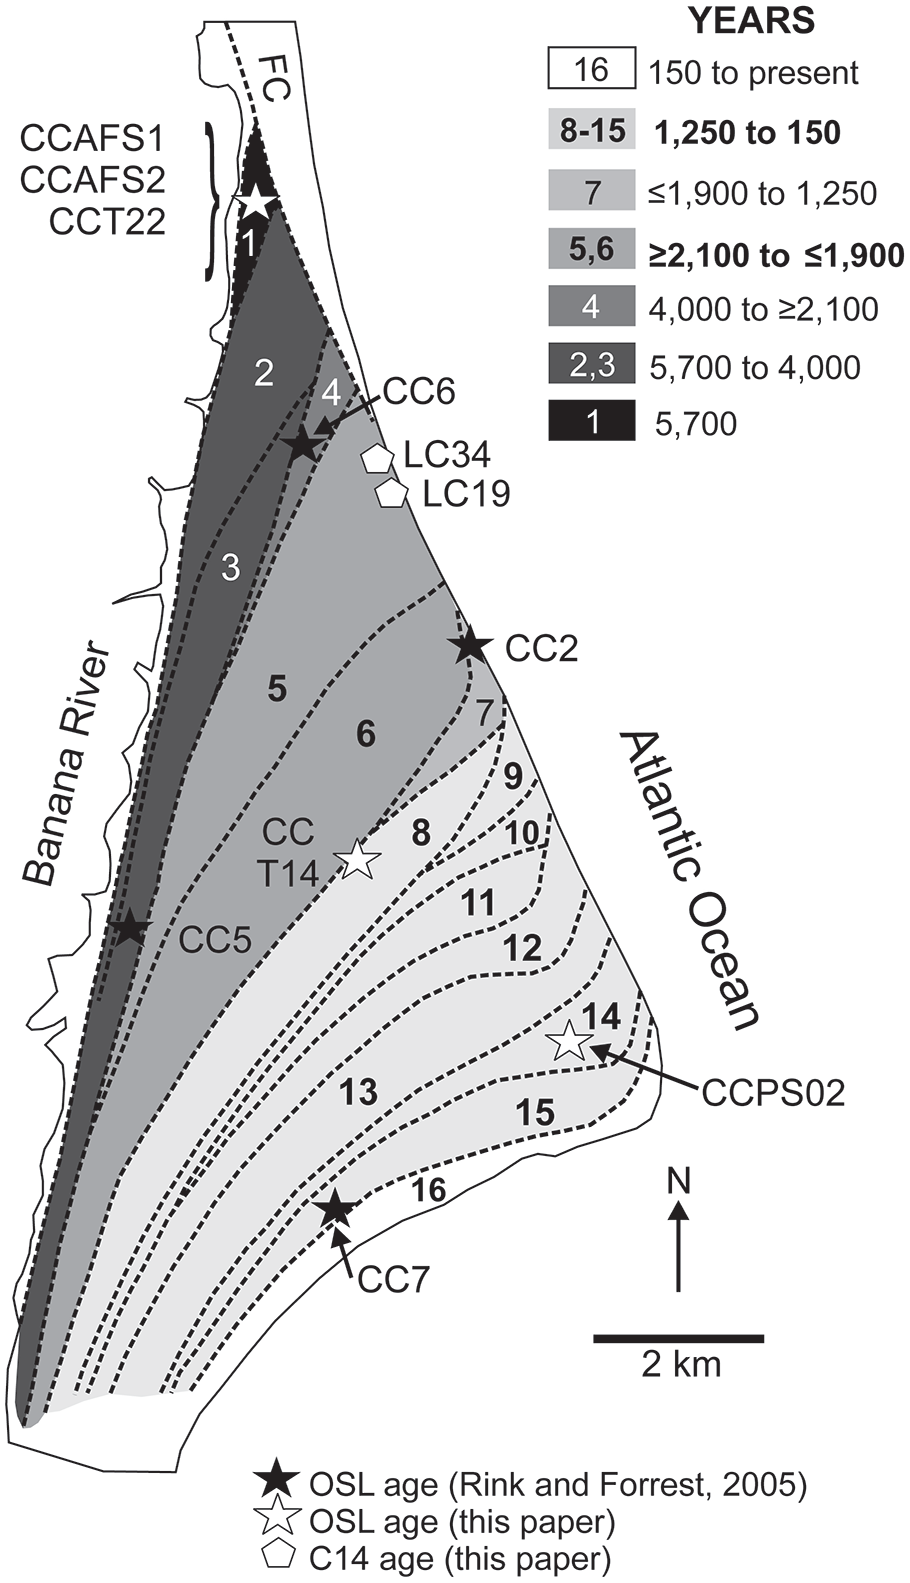
Chronometric framework diagram for the Cape Canaveral beach-ridge plain based on: (1) OSL ages (black stars) from Rink and Forrest (2005), (2) OSL ages (white stars) from this paper, and (3) radiocarbon ages (white pentagons) from this paper. The Cape Canaveral beach-ridge plain records a 5700-year period of alternating deposition and erosion. The majority of the existing Cape Canaveral beach-ridge plain (75% of total area) was deposited over no more than 1400 years of the 5700-year long period and is represented by: (1) Beach-ridge Sets 5 and 6 (24% of total area) deposited over no more than 200 years between 2100 and 1900 years, and (2) Beach-ridge Sets 8–16 (51% of total area) deposited over 1000 years between 1150 and present-day. The remaining 4300 years are represented by (1) Beach-ridge Sets 1–4, and (2) the erosional truncations or disconformities that define the boundaries between the various beach-ridge sets.
The OSL depositional age of 1880 ± 90 years for the oldest beach ridge present in the adjacent, younger Beach-ridge Set 7 (CC2 of Rink and Forrest, 2005) provides a younger bound to the deposition of Beach-ridge Sets 5 and 6. This younger bound strongly suggests that the part of Beach-ridge Set 5 between LC34 and the youngest beach ridge truncated by the erosion boundary between Sets 6 and 7 was deposited over no more than some 300 years, the difference between the 1σ maximum depositional age estimate of 2100 ± 100 cal years BP at LC34 and the 1σ minimum actual depositional OSL age of 1880 ± 90 years for Set 7.
The OSL age of 1240 ± 80 years from Core CCT14, taken in one of the oldest beach ridges in Set 8, is a maximum estimate for the deposition of Beach-ridge Sets 8–15. The OSL ages of 260 ± 22 years for the sand base of the major swale in Set 14 (Core CCPS02) and 150 ± 25 years for one of the youngest beach ridges in Set 15 (CC7 of Rink and Forrest, 2005) confirm that deposition of Beach-ridge Sets 8–15 occurred over no more than 1000 years.
Cape Canaveral beach-ridge geography and geomorphology
The LiDAR-based map produced in this study emphasizes that the Cape Canaveral beach ridges are oriented in a northeast-southwest direction and that the progressive accretion of beach ridges occurred in a south-easterly direction (Figure 2b). The Cape Canaveral beach ridges are (1) composed primarily of quartz sand with minor amounts of shell fragments, (2) organized into sets that contain multiple parallel to subparallel, mostly regularly-spaced, continuous, linear to gently curved, wall-like ridges with variations in crest and swale elevations along strike typically less than 1 m, and (3) have crests that are essentially parallel to the southeast-facing shoreline. The 16 mapped beach ridge sets are separated from each other by erosional truncations, onlapping of older by younger ridges, and abrupt southwest shifts of southeastward prograding ridges (Figure 2a). The occurrence of the beach ridges organized into sets separated by erosional truncations indicates fluctuations in the local sand supply between abundance and shortage with the former resulting in deposition and shoreline progradation and the latter in erosion and shoreline retreat.
The geometry of the Cape Canaveral swales changes dramatically along depositional strike from the proximal area of the southeast tip toward the more distal areas to the southwest (Figure 6). At the southeast tip many swales have a crescent-shape which follows the convex pattern of the beach ridges, with a NW-SE dimension perpendicular to strike of up to several hundred meters (Figure 6). Both ridges and swales have been significantly truncated by long-term erosion occurring along the NE-facing shore. These crescent-shape swales contain freshwater lakes that are commonly floored with a several decimeter-thick layer of very fine-grained organic debris and minor amounts of siliciclastic clay overlying fine- to medium-grained quartz sand containing marine shells. The base of the crescent-shape, lake-filled swale in Beach-Ridge Set 14 (CCPS02, Figure 6) occurs at an elevation of −0.6 m MSL which is within 3 cm of the Mean Lower Low Water (MLLW) at the Cocoa Beach Atlantic Pier tide gage (Figure 7); this concordance is not surprising given that the marine-shell bearing sand at the base of this freshwater lake is only 260 ± 22 years old (CCPS02, this paper). This pattern of convex seaward beach ridges and 100 m wide swales suggests a relatively high rate of progradation with beach-ridge formation occurring on the tops of emergent nearshore bars perhaps similar to the mechanism proposed by Hine (1979). This crescent-shape swale pattern changes southwestward to the classic linear, narrow geometry within less than 1 km of the southeast tip (Figure 6).
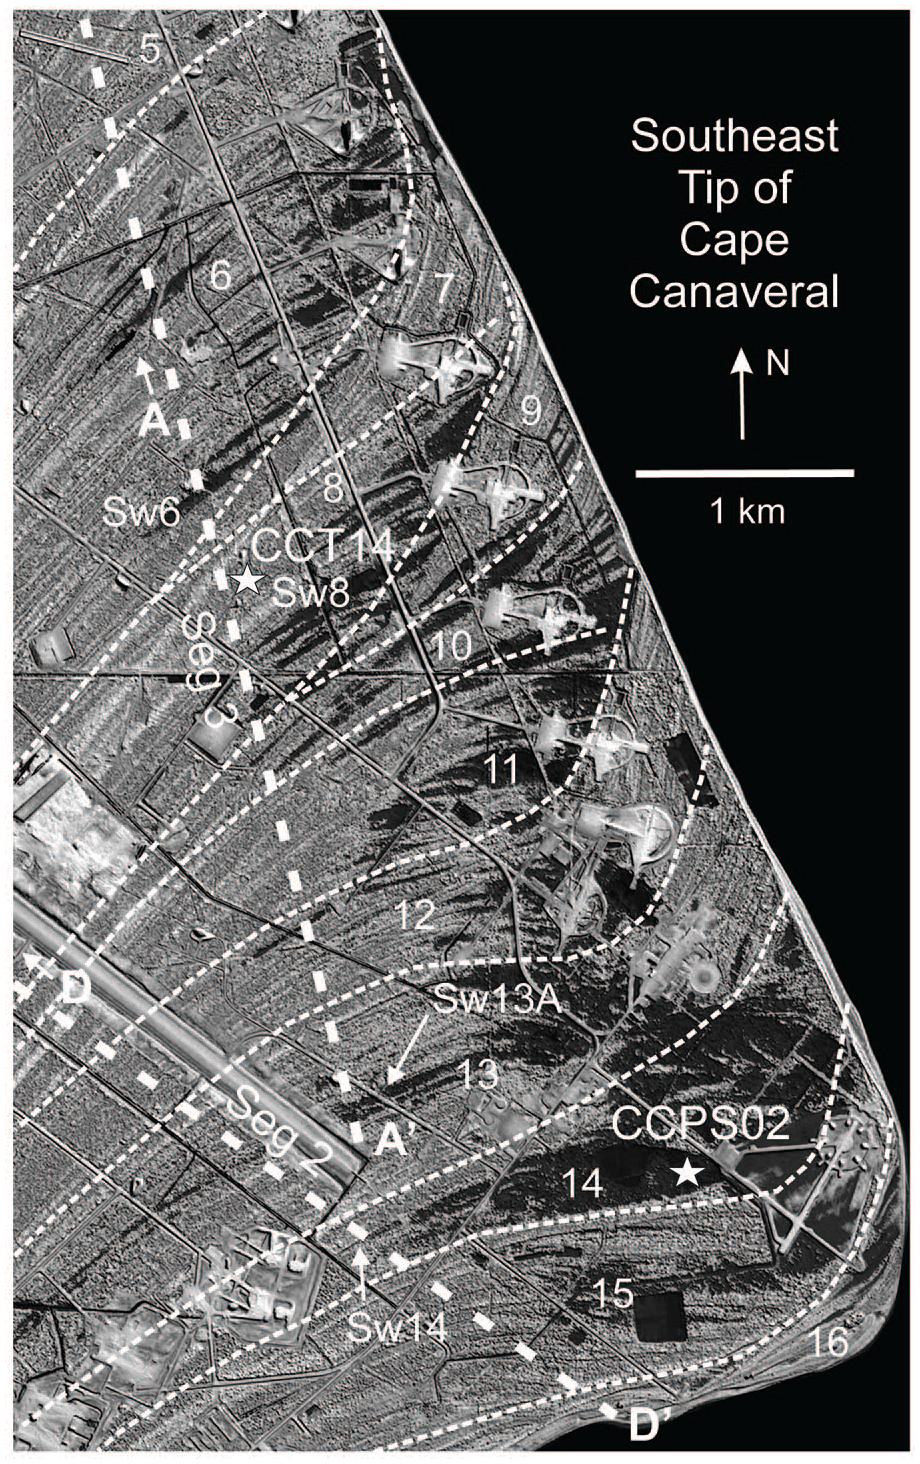
The southeast tip of Cape Canaveral showing both the crescent-shape and linear, narrow swales. Sw designates individual linear, narrow swales within a particular beach-ridge set; the other numbers identify crescent-shape swales within respective beach-ridge sets. AA′ and DD′ are topographic profiles. CCPS02 locates the core which penetrated to the fine- to medium-grained sand containing marine shells at the base of crescent-shape swale 14; sample CCPS02 (−144 cm) yielded an OSL age of 260 ± 22 years. Core CCT14 locates the initiation of beach ridge deposition at Beach-ridge Set 8; sample CCT14 (−382 cm) yielded an OSL age of 1240 ± 80 years.
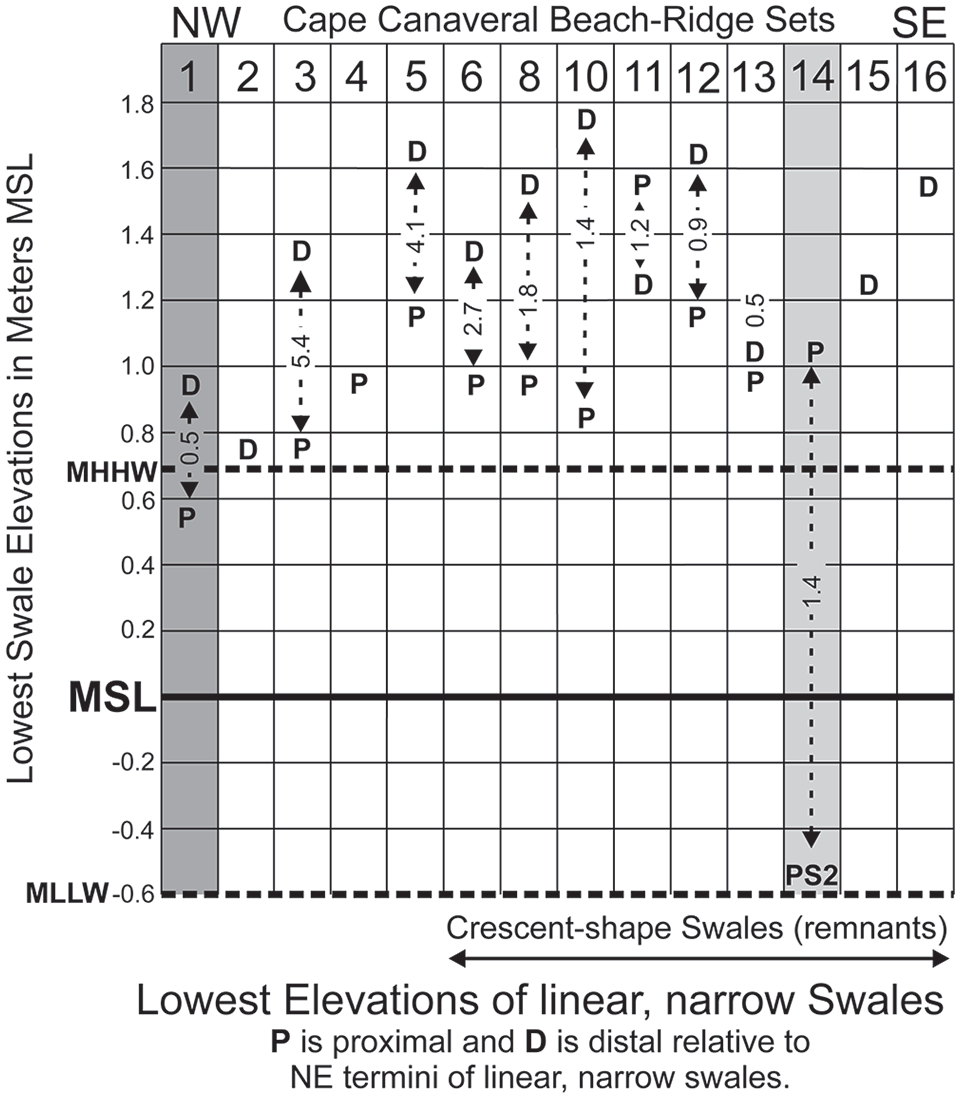
A matrix showing the elevations of the lowest swales present in the various Cape Canaveral beach-ridge sets. P is the lowest elevation of the proximal portion and D the distal portion of the linear, narrow swales. MHHW is Mean Higher High Water and MLLW is Mean Lower Low Water. The columns for Beach-ridge Set 1 and Set 14 are highlighted in gray. The numbers on the dashed lines are the distances in kilometers separating the respective P- and D-values.
The vast majority of swales separating the Cape Canaveral beach ridges have the narrow, linear geomorphology common to beach-ridge plains worldwide. The ridge crest elevations indeed have considerable variability, probably due to differences in the amount of aeolian dune caps or decoration, however, the elevations of the lowest swales (all of the narrow, linear geometry) in the various beach-ridge sets are, unexpectedly, markedly similar. Proximal (P, from profile AA′ of Figure 8 and Supplemental Figure 3) and more distal values (D, from profile DD′ of Supplemental Figure 4) of the lowest-elevation, linear, narrow swales are shown in Figure 7 along with the present-day tidal datums of MHHW and MLLW as determined at the Cocoa Beach Atlantic Pier tide gage (USDC, 2020). Except for Beach-ridge Set 11, P-values are lower than their associated D-values, however, differences ⩽0.15 m are at or below the level of LiDAR resolution and may not be significant (Figure 7). About 90% of the P-values of the 11 beach-ridge sets that have both P- and D- values for their respective lowest swales are within 0.5 m of present-day MHHW.
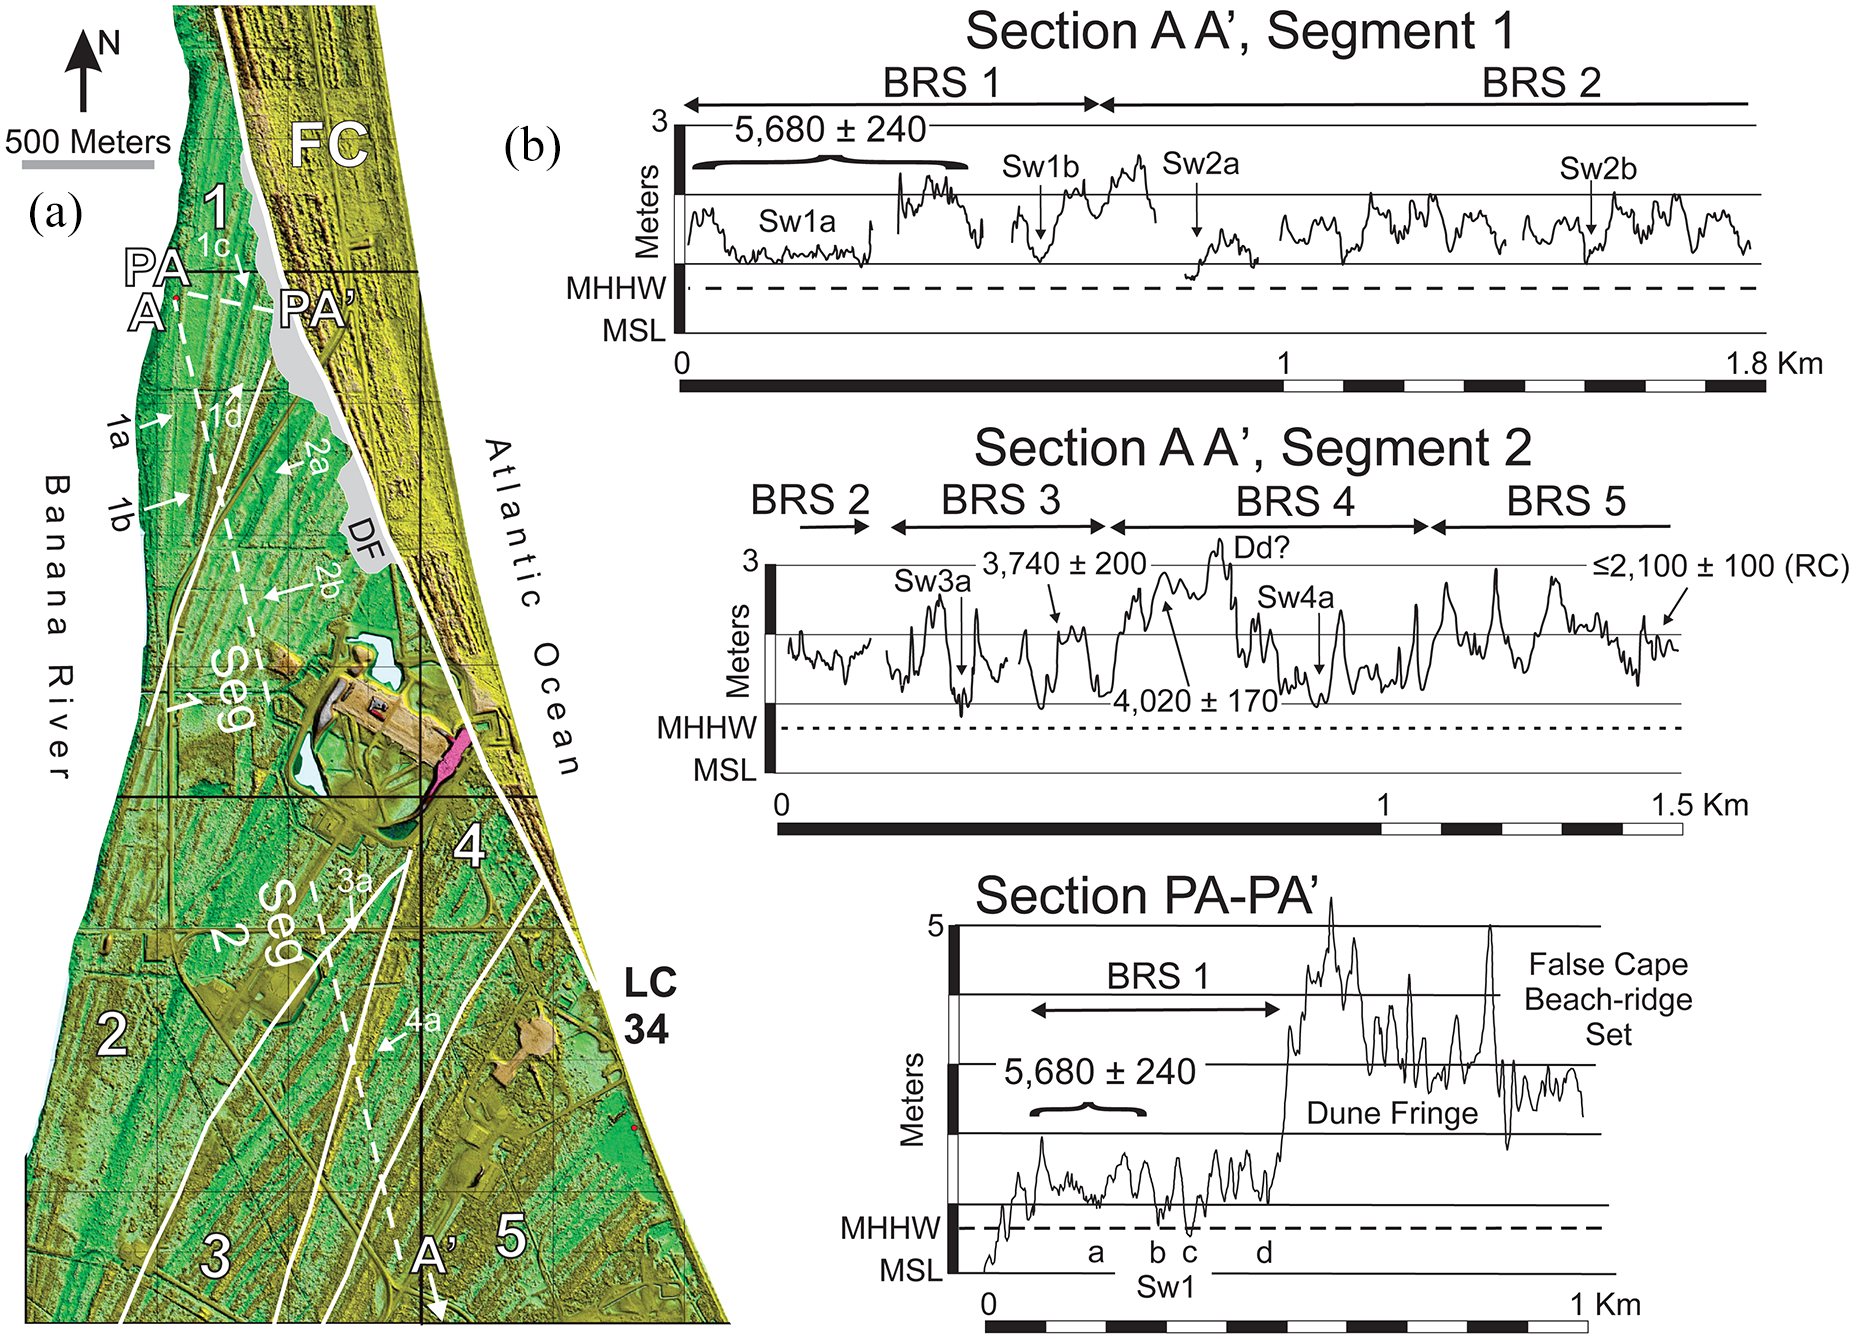
(a) LiDAR image of the northernmost part of Cape Canaveral that contains Beach-ridge Sets (BRS) 1–5. The darker areas are of lower elevations (swales) and the lighter areas are higher elevations (crests). FC locates the False Cape beach-ridge set. DF is the dune fringe landward of the False Cape beach ridges. Topographic profiles are designated, PA-PA′, AA′ Segments 1 and 2. Individual swales are identified with 1 (BRS 1), 2 (BRS 2), 3 (BRS 3), and 4 (BRS 4). Notice that swales 1c and 1d are present in section PA-PA′ but do not extend southwest to Segment 1 of Section AA′. LC34 is Launch Complex 34. (b) Topographic profiles PA-PA′ and AA′ Segments 1–2 have been constructed from LiDAR data with a 0.15 m vertical resolution; the vertical exaggeration of these sections is 115×. Because profiles AA′ Segments 1–2 are not perpendicular to the ridge crests the widths of both crests and swales are somewhat exaggerated. BRS is Beach-ridge Set, Sw is a particular swale, Dd? is possible dune decoration. Numbers are OSL ages in years; the number with (RC) is the youngest radiocarbon age (in cal years BP) of a spectrum of ages made on single shells collected in a sea cliff at Launch Complex 34 (LC34). Notice that the lowest swales in BRS 2–5 are essentially of equal elevation, about 1 m MSL, which is equal to the elevations of the majority of the swales in BRS 1. Only BRS 1 swales 1b and 1c are lower at an elevation of present-day MHHW.
There are four major potential sources that probably supplied sediment during the deposition of the Cape Canaveral beach-ridge plain: (1) southeast littoral transport from regions further to the north, (2) erosion of the NE-facing shoreline, (3) net onshore transport from the adjacent Southeast Shoal, and (4) direct onshore transport from the adjacent nearshore shelf. The littoral-drift model of Stapor and May (1983), based on present-day bathymetry and wave parameters of deep-water height and period, indicates that littoral transport along the NE Florida coast is highly compartmentalized with numerous cells separated by drift divides and convergences. One such divide is located ~20 km north of False Cape with a predicted southward littoral transport of no more than 30,000 m3/year coming from local erosion of this 20 km stretch of coast. The predicted existence of a drift divide along this NE-facing shoreline allows for the net, long-term southern transport of the majority of the material eroded from the Pleistocene Cape Chester beach-ridge plain of Merritt Island, the southern half of which is now missing (Figure 1). Net onshore transport from Southeast Shoal as well as direct onshore transport from the immediate nearshore cannot be evaluated at present.
Beach-ridge Set 1 geomorphology and stratigraphic interpretation
Beach-ridge Set 1 has one of the smaller areas (0.47 km2) of all the 16 identified set remnants. However, it contains the oldest, and topographically lowest, beach ridges preserved in the Cape Canaveral beach-ridge plain (Figures 3 and 8). The constituent ridges have crest elevations of ~1.5 m MSL, are linear, and gently converge to the south (Figure 8). The swales consist of fine- to medium-grained quartz sand, the same material as the ridge crests, and have elevations that range from 0.5 to 1.1 m MSL (profile AA′, Segments 1 and 2 and profile PA-PA’ of Figure 8). The low value is ~0.1 m below the MHHW elevation recorded at the nearby Cocoa Beach Atlantic Pier tide gage.
Because the beach ridges preserved in Beach-ridge Set 1 converge to the south, the younger swales are truncated southward by even younger beach ridges: Swales 1c and 1d shown in the crest-perpendicular profile PA-PA′ are not present in profile AA′ (Segment 1, Figure 8). The +0.55 m MSL elevation of Swale 1c of profile PA-PA′ is the lowest elevation present in Beach-ridge Set 1 and the lowest elevation of all the linear, narrow swales recorded on the LiDAR-based topographic profiles AA′-Segments 1 and 2 (Figure 8). Swale 1b, the next lowest in Beach-ridge Set 1, is at an elevation equal to present-day MHHW, and the two remaining Set 1 swales, 1a and 1d, are 0.4 m above MHHW (Figure 8). These swales are composed of fine to medium sand; silt, and organic and/or siliciclastic clay-size material is absent, unlike the crescent-shape swales located near the eastern tip. These very similar swale elevations occur in Beach-ridge Sets 1–3 that were deposited over a 1700-year interval (Figure 8). The ridge-crest to swale-bottom relief ranges from 0.75 to 1.25 m in Beach-ridge Sets 1 and 2 while in Set 3 the range is 1–1.5 m (Figure 8). The topographic inset map of the portion of Beach-ridge Set 1, covers the area that includes core CCT22, section PA-PA′, OSL sample CCAFS1, and OSL sample CCAFS2, clearly shows that these low swale elevations extend throughout the respective swales intercepted by the various topographic profiles (Figure 3a for topographic map location and Supplemental Figure 1 for contour map).
Core CCT22 is located some 20 m west of the oldest ridge in Beach-ridge Set 1. The sediments penetrated in this core comprise a sequence of fine- to medium grained, quartz sand with a variable content of moderately sorted shell fragments; these shell fragments are primarily of marine pelecypods and gastropods (Figure 3b). There were no visible sedimentary structures in core CCT22 except for the bedding plane which separates the overlying shelly sand from the basal clay. The marine shell content and the juxtaposition immediately adjacent to a beach-ridge plain strongly argue that, at the very least, a significant fraction of the sediments present in the lower half of core CCT22 were deposited in a sub-tidal setting, most probably on a shoreface.
Core CCT22 provides evidence for the age of the earliest Holocene sediments preserved on the Cape Canaveral beach-ridge plain. The sequence of OSL ages show a clear trend of decreasing age moving upward in the core, ranging from 5590 ± 540 years at the base (CCT22-4) and 3630 ± 270 years for the uppermost sample (CCT22-1; Table 1 and Figure 3b). However, the basal 1.25 m (CCT22-3: 5450 ± 470 years and CCT22-4: 5590 ± 540 years) is of a similar age and the section between −178 cm (CCT22-1: 3630 ± 270 years) and −283 cm (CCT22-2: 3500 ± 270 years) is also of a similar age. These two sections are different by some 1500–2000 years, suggesting either a continuous, but variable, depositional rate or the existence of at least two discrete depositional episodes separated by a disconformity between samples CCT22-2 and CCT22-3. Because there are no sedimentary structures present that might suggest an erosion surface, a more exact location for this disconformity is not possible without additional OSL dating (Figure 9).
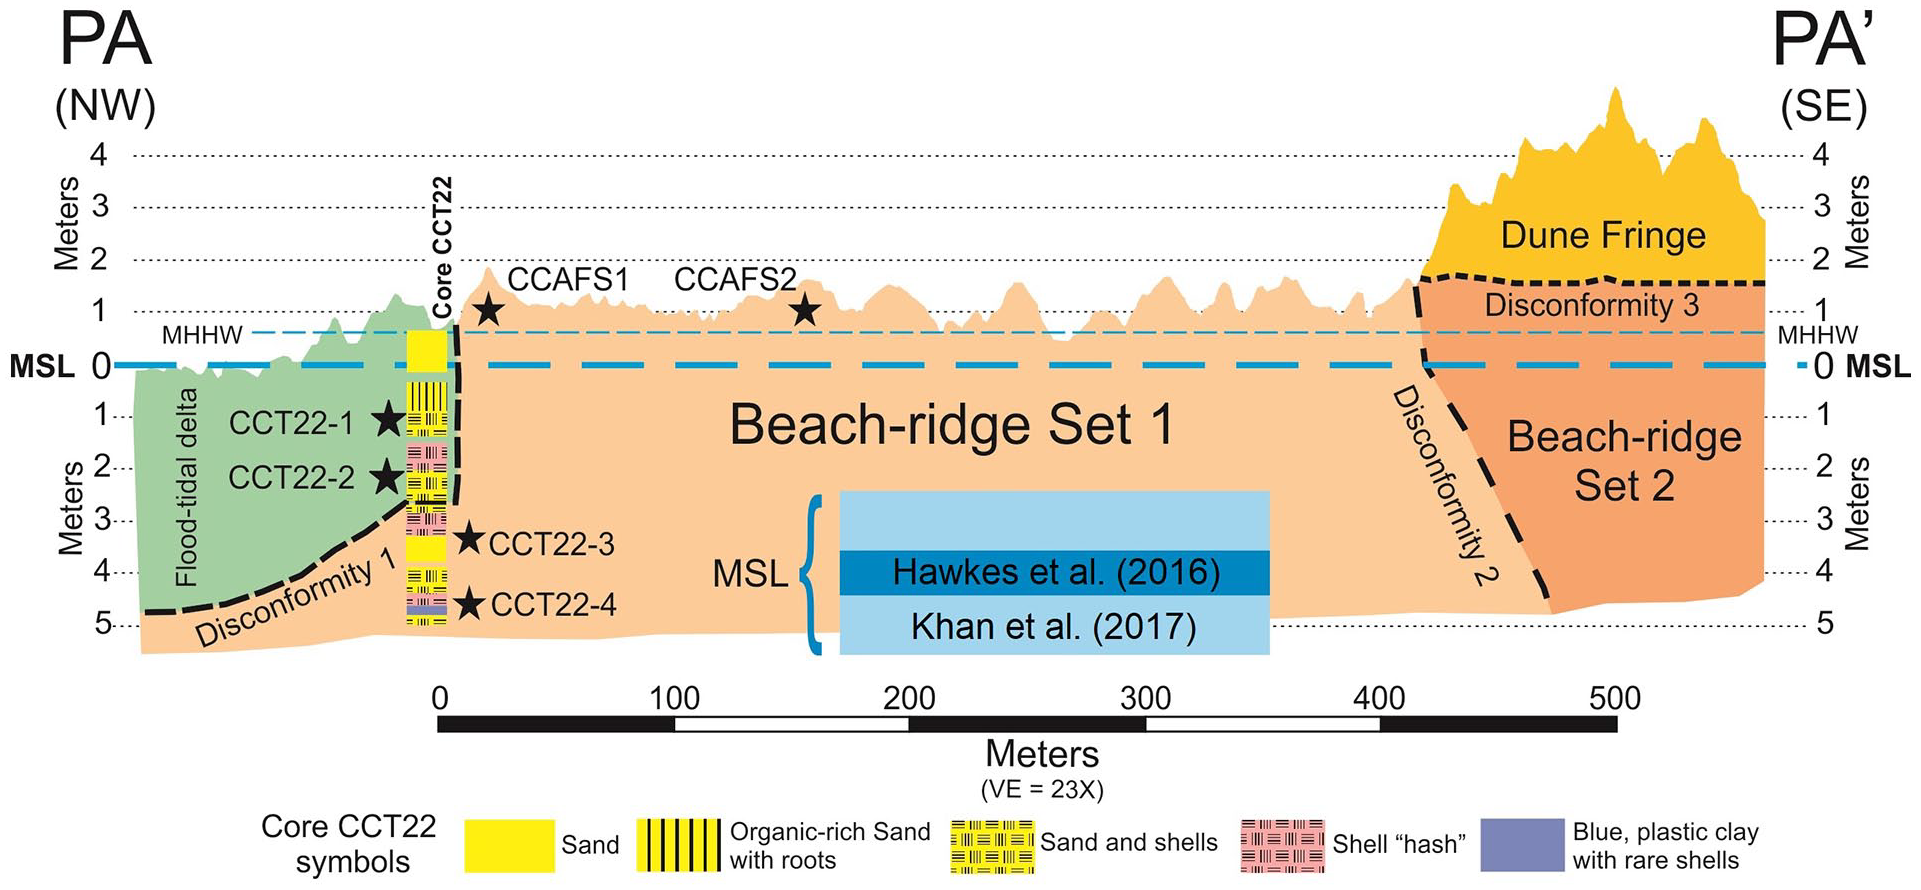
A stratigraphic section and topographic profile of the ridges comprising Beach Ridge Set 1, the geographically oldest ridge set on the Canaveral Peninsula. Superimposed on this figure are (1) the OSL sample locations for the ages reported in this study, and (2) a generalized lithologic description of core CCT22. The position of Mean Higher High Water (MHHW) is from the Cocoa Beach Atlantic Pier; MSL at this location is 0.575 m NAVD88 (USDC, 2020). Observe that the swales are either at present-day MHHW or several decimeters above. The vertical portion of Disconformity 1 is required by the 1500–2000 year age difference between core samples CCT22-1 (−172 cm, 3630 ± 270 years) and CCT22-2 (−283 cm, 3500 ± 270 years) and sample CCAFS1 (5620 ± 345 years) from the top of the geographically adjacent, and topographically elevated, oldest beach-ridge of Beach-ridge Set 1. Disconformity 1 continues downward separating the younger material in core CCT22 from the older deposits of Beach-ridge Set 1. Because the ages of core samples CCT22-3 (−411 cm, 5450 ± 470 years) and CCT22-4 (−534 cm, 5620 ± 345 years) are statistically indistinguishable from the age of sample CCAFS1, and CCAFS2 (6050 ± 510 years) as well, these two deposits can be considered co-eval and Disconformity 1 can reasonably be projected into the core somewhere between sample CCT22-2 (3500 ± 270 years) and CCT22-3 (5450 ± 470 years). Because there are no sedimentary structures present that might suggest an erosion surface, a more exact location for of Disconformity 1 is not possible without additional OSL dating. Disconformity 2 is the projection of the truncation boundary that separates Beach-ridge Sets 1 and 2 (Figure 3); disconformity 3 occurs between the overlying dune fringe and the underlying deposits of Beach-ridge Set 2. The 5500–6000 year-old MSL position of Khan et al. (2017) and Hawkes et al. (2016) are shown with the gray and dark gray 2σ bands, respectively. Using this sea-level position, the entire Beach-ridge Set 1 topography would have had to result from 5 to 6 m high wave run-up. This vertical component of wave run-up should require offshore wave heights of 7–8.5 m (Guza and Thornton, 1982) or a significant breaker height of 5–7 m (Roberts et al., 2010); both of these estimates are at least five to six times the present-day, average, significant wave-height determined by Corson et al. (1981) and three to four times the storm wave-height estimate (95th percentile of measured waves) of Thompson (1977).
OSL samples CCAFS1 and 2, collected from ~1 m below the crests of the adjacent oldest and second-oldest beach ridges comprising Beach-ridge Set 1, have yielded ages of 5620 ± 345 and 6050 ± 510 years respectively, and are statistically indistinguishable from the ages of the basal 1.25 m of core CCT22 (CCT22-3: 5450 ± 470 years and CCT22-4: 5590 ± 540 years). Together the four samples yield an average age of 5680 ± 240 years (hereafter rounded to 5700 years). The 5500–6000 year-old, beach-ridge crest samples are 3.5–4 m above the uppermost section (−283 to −178 cm) of core CCT22 which is 2000 years younger, a geometric relationship that requires the existence of a significant disconformity between this uppermost section of core CCT22 and Beach-ridge Set 1 ridge-crest sample CCAFS1. We interpret the two beach-ridge crest samples, CCAFS1 and CCAFS2, and the two subtidal samples from the adjacent core CCT22 from 4 to 5 m depth to represent the initial supra-/intertidal and subtidal deposits respectively of a beach-ridge plain that prograded into this area some 5500–6000 years ago (Figure 9).
The marine-shell-rich sand composition of the ~3500 year deposits in the upper 3 m of core CCT22 argues for deposition in a littoral or marine-influenced environment, however, the continuity of the seaward-adjacent ridges comprising Beach-ridge Set 1 precludes any westward-directed sediment transport across them. We hypothesize that these ~3500-year deposits represent distal portions of flood-tidal deltas that were formed when a barrier was breached at some nearby position farther to the north. This hypothesized paleogeography was similar to that of the present-day False Cape beach-ridge set and the adjacent, narrow Canaveral National Seashore barrier (Figure 1) that has extensive washover and relic flood-tidal delta deposits extending west into the Mosquito Lagoon (Mehta and Brooks, 1973). This hypothesized breaching occurred subsequent to the deposition of Beach-ridge Set 3 and prior to or sometime during the early period of the deposition of Beach-ridge Set 4, given the 4020 ± 170 year OSL age (CC6 in Figure 2a, Rink and Forrest, 2005) on the boundary between Sets 3 and 4. We suggest that the digitate deposits that extend westward from the False Cape Beach-ridge Set into the northern portions of the Banana River (Figure 1) are remnants of other ancient flood-tidal deltas that originally formed landward of pre-existing, similar, narrow barriers. The boundary between Beach-ridge Sets 1 and 2 as well as the contact between the “dune fringe” and the underlying Beach-ridge Set 2 are also disconformities (Figure 9).
The OSL ages reported here for the initial deposition of Beach-ridge Set 1 are ~1000 years younger than the 6610 ± 60 years BP radiocarbon age of Beach-ridge Set 2 or 3 reported by Brooks (1972) and ~1500 years younger than the oldest radiocarbon shell age (7067 ± 80 years BP) reported for Beach-ridge Set 3 or 6 (Figure 2a). This is not surprising if one considers the ages reported by Brooks (1972) to have been determined from reworked clasts which need not estimate the time of deposition (Stapor et al., 1991). However, these OSL ages for Beach-ridge Set 1 are as expected older than the 3740 ± 200 years OSL age reported by Rink and Forrest (2005) for the younger Beach-ridge Set 3 (Figure 2a).
Sea-level interpretation from beach ridges
It should be expected that there is a relationship between beach ridges and sea level, although any such calibration has been, and still can be, difficult to estimate (Otvos, 2000). The boundary between swash zone deposits and any overlying aeolian deposits has been used to estimate the uppermost level of constructive wave action and thus can be regarded as an indicator of sea level (Otvos, 2000). However, it can be difficult to obtain natural or man-made exposures that show the critical sedimentary structures that may be able to identify this interface; commonly used core tubes are not wide enough to adequately identify the critical sedimentary structures. Ground penetrating radar (GPR) can under the right circumstances image these critical structures, especially the beach/subtidal interface (Tamura et al., 2008). However, if the GPR survey uses a sand road bull-dozed nearly flat across or along the ridges, the uppermost part of the radargram may not properly image the upper meter of the deposit as well as not image much, if any, of the ridge itself (Rodriguez and Meyer, 2006). Van Heteren et al. (2000) were able to readily identify the swash-formed, gravel-rich sand from the immediately overlying, dune-deposited sand and interpreted this boundary to be a sea-level indicator, however, the ability of grain-size characteristics of fine to medium sand to differentiate aeolian from swash deposits is a matter of some dispute (see Otvos, 2000; Tanner, 1995 for opposing views).
Unfortunately, there are no natural cliff exposures of Beach-ridge Set 1 and the banks of the canal that crosses this set are so overgrown and slumped that any internal structures present are not visible. In addition, there is no available GPR survey. Thus, estimating the MSL during deposition must be based solely on the geomorphology of the ridges and swales. The ridge crests are linear, continuous and show no obvious effects of wind action, such as the markedly irregular downwind margin of the dune fringe that formed prior to the deposition of the False Cape beach-ridge set (Figures 3 and 8). However, aeolian dune sand capping or decorating the Set 1 ridges cannot at present be ruled out. The elevation of the intervening sand-floored swales can provide a better estimate of sea level in that a swale represents back-beach or supratidal deposition that experienced minimal wave run-up, compared to that responsible for beach-ridge construction, and can be expected to have a minimal amount of dune decoration because of the potential for reworking by subsequent, infrequent, higher-water events. One should consider the lowest swale elevations to be the best estimators of MHHW, because any wave runup will skew elevations upward and thus the lowest swale elevation will be the most conservative estimator. It should be emphasized that this strategy should only be used in swales composed of sand-size material because this material has to be moved by traction transport and is essentially not compressible. It is striking that the 16 beach-ridge sets present in the Cape Canaveral beach-ridge plain, which span some 5700 years, have only a 0.5 m range in the elevation of their lowest, linear, narrow swales (Figure 7) and, furthermore, the vast majority of these lowest swales are within 0.3 m of present-day MHHW.
Sea-level interpretation of the 5700-year beach-ridge Set 1
Based on the elevations alone of the sand-floored swales it is not unreasonable to hypothesize that Beach-ridge Set 1 was deposited at a MHHW position within decimeters of present-day MHHW and hence MSL. If one uses the 5700-year sea-level position of Hawkes et al. (2016) and Khan et al. (2017) then the entire Beach-ridge Set 1 topography would have had to result from a wave run-up that had a vertical component 5–6 m high. This vertical component would necessitate a significant deep-water wave-height of 7–8.5 m (Guza and Thornton, 1982) or a significant breaker-height of 5–7 m (Roberts et al., 2010); both of these estimates are at least five to six times the present-day, average, significant wave-height determined by Corson et al. (1981) and three to four times the storm wave-height estimate (95th percentile of measured waves) of Thompson (1977), in other words, a dramatically different wave climate than what exists today along the Cape Canaveral coast. Furthermore, the minimum elevations of the linear, narrow swales presented in Figure 7 further suggest that this hypothesis can be extended to cover the deposition of all of the beach-ridge sets comprising Holocene Cape Canaveral. This hypothesis does not rule out the occurrence of lower-than-present sea-level events over the past 5700 years, it only argues that any such lower events were not recorded in the preserved beach-ridge deposits of Cape Canaveral. This 5700-year sea-level position hypothesized to be equal to or within decimeters of present-day for the Cape Canaveral Beach-ridge Set 1 is a significant addition to the Gulf of Mexico and southeastern United States sea-level data collected from onshore (subaerial) sites (see Figure 5A in Balsillie and Donoghue, 2004 for a compilation).
Discussion of Holocene sea-level data from the southeastern United States
The vast majority of Holocene sea-level data from the southeastern United States come from the interpretation of supra- to intertidal, organic-rich material recovered in cores which sample subsurface Holocene deposits that directly overlie Pleistocene material. This has resulted in a depositional model of coastal onlap interpreted to have been caused by a continuous, monotonically rising sea-level resulting from the gradual collapse of a glacial forebulge (Clark et al., 1978; Roy and Peltier, 2015; Walcott, 1972). Simply put, no matter how expertly one can determine a depositional environment nor how accurately one can determine a depositional age, if one is looking in the wrong place one will never identify a deposit formed at a sea-level position equal to, or higher than, present day. That this probable bias against the recognition of “highstand” events may well be inherent to the onlapping, intertidal paradigm, is a fundamental issue, and should not be dismissed as trivial.
A critical review of submarine-collected, coral, sea-level data from subtidal coral reefs in south Florida by Stathakopoulos et al. (2020) has resulted in a significant reduction in the number of previously used data points. They evaluated the visual taphonomic characteristics of 303 existing coral data points and selected 134 as being suitable sea-level indicators. Of these 134 suitable samples only 6 samples of the commonly used Acropora palmata (shallow water, monospecific framework deposits, 5 m ecologic range, Lighty et al., 1982) define the SLR covering the past 6000 years (Figure 10). Rise and fall events less than this 5 m range may be difficult to identify, although certain “finger-like” morphologic features have been used to identify and/or interpret reef-crest samples from deeper water samples (Lighty et al., 1982). The observation that in-situ corals only comprise from 15% to 40% of total reef mass (Blanchon and Perry, 2004; Hubbard et al., 1998) presents a further limiting factor as does the challenge of identifying such in-situ corals in cores (Hubbard et al., 1998). Khan et al. (2017) presents a compilation of Caribbean coral data. It is unlikely that subtidal coral deposits from a previous sea-level position equal to that of today can be readily recognized given that such a deposit would serve as an excellent substrate for subsequent colonization by encrusting corals and, furthermore, any such disconformable interface could be difficult to identify in a core of only several inches in width.
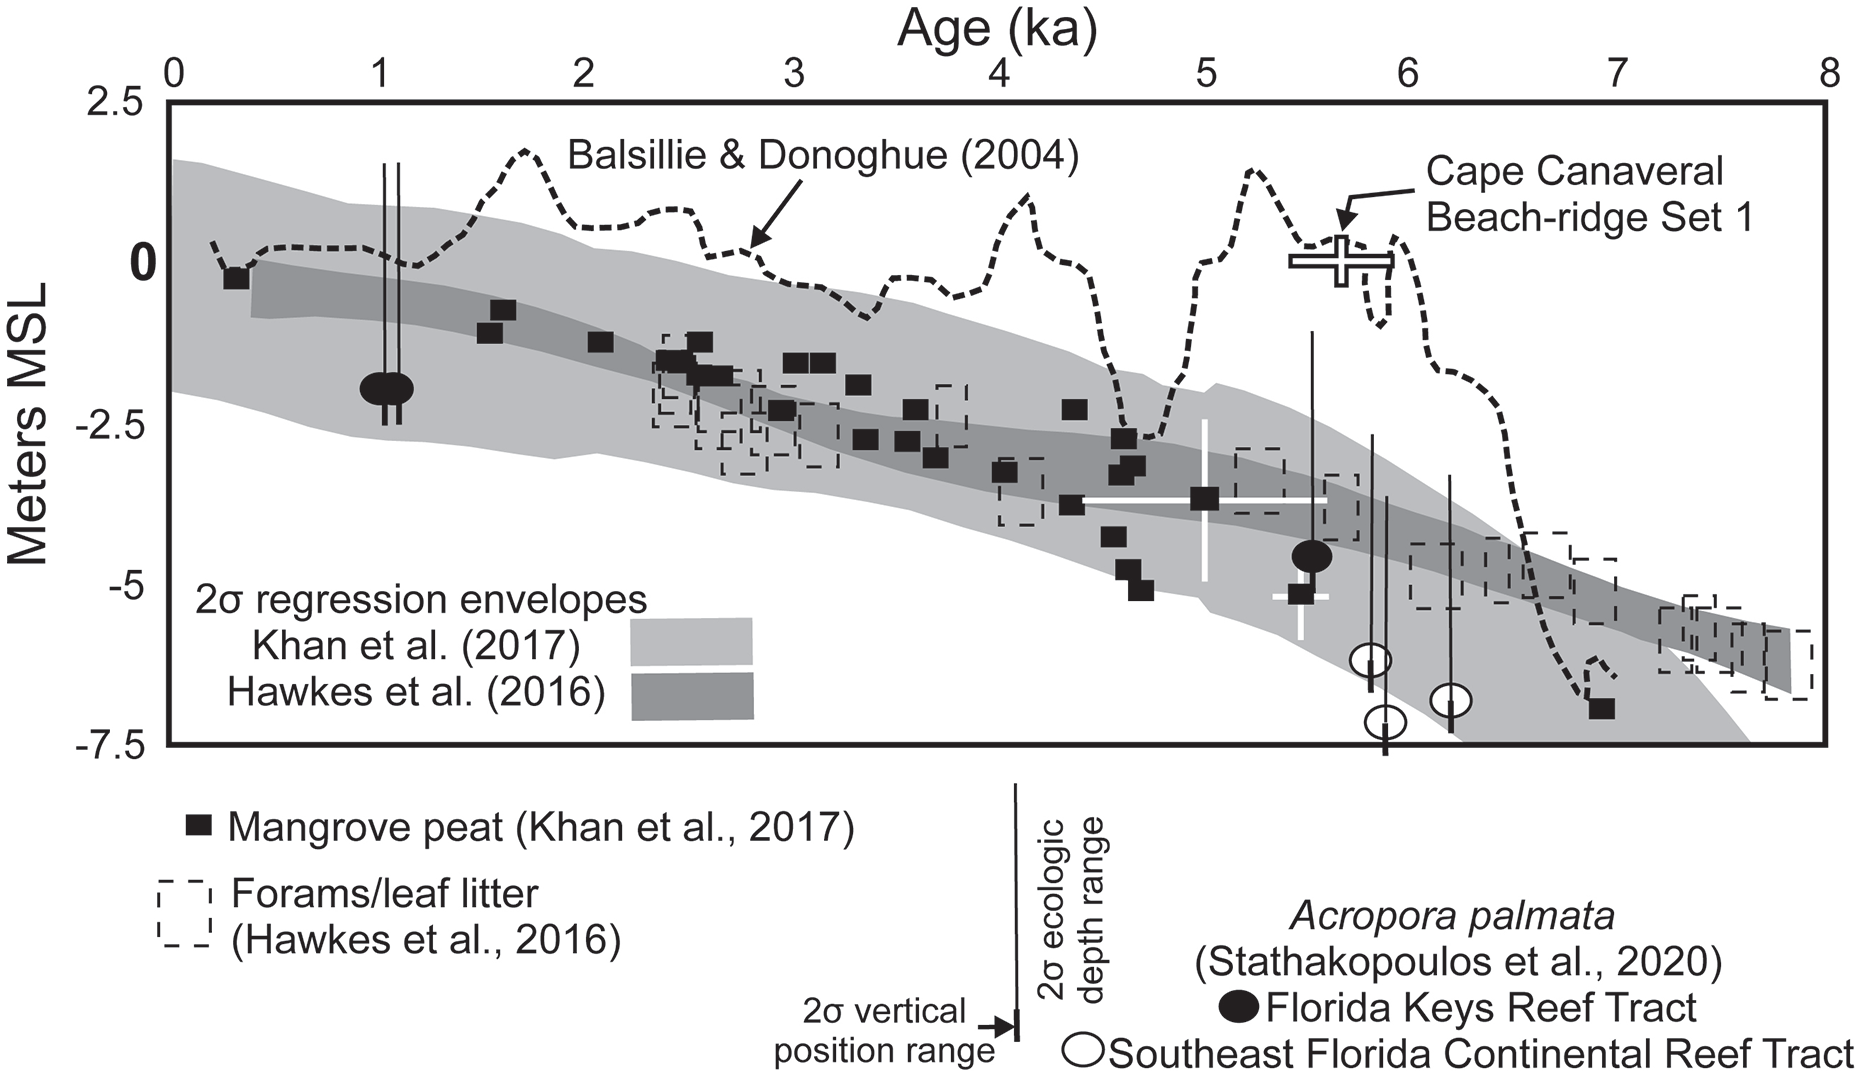
The Cape Canaveral Beach-ridge Set 1 position versus the sea-level curves of (1) Hawkes et al. (2016) for northeast Florida and Khan et al. (2017) for southeast Florida, both based on subsurface data and (2) the Balsillie and Donoghue (2004) curve, a 7-point floating average, based on onshore data from the northern Gulf of Mexico and south Florida. Four OSL ages with a mean of 5680 ± 240 years provide the chronometric estimate of the depositional age of the Cape Canaveral Beach-ridge Set 1. Calibrated radiocarbon ages provide the chronometric control for the Hawkes et al. (2016), Khan et al. (2017), and the Stathakopoulos et al. (2020) sea-level data; OSL ages provide the chronometric control for the Cape Canaveral Beach-ridge Set 1. The small, solid, black squares show the mangrove peat data points; error estimates for those data in the 4000–6000-year range are shown by the white crosses. The Hawkes et al. (2016) basal estuarine foraminifera data points and error estimates are shown by the dashed line rectangles. The white and black circles are the Acropora palmata data points from Stathakopoulos et al. (2020); their associated 2σ error estimates are shown by the black vertical lines. The 2σ regression envelopes for the Hawkes et al. (2016) and Khan et al. (2017) are shown by the two shaded, sloping bands. This figure is a modification of Figure 4 in Stathakopoulos et al. (2020).
The best, perhaps the only, place to look for deposits of earlier sea-level highstands is up at present-day sea level, the material referents of which can be (1) skeletons of intertidal and/or subtidal organisms that encrust a well-lithified substrate as in Brazil (Angulo et al., 1999; Van Andel and Laborel, 1964) and (2) the inter- and supratidal clastic deposits of beach-ridge plains as in Australia (Hesp, 1999, 2006); geomorphic referents, such as elevated notches and any associated secondary erosional terraces, cannot at present be dated.
Pre-Holocene, well-lithified rocks on which skeletonized, intertidal marine organisms can attach are essentially absent along coasts of the southeastern United States. The Silver Bluff notch cut into lithified, Pleistocene Miami Oolite in Coral Gables, Florida (Cooke, 1945), and the scarps and terraces cut into humate-impregnated, Pleistocene sand scattered along the Franklin Co., Florida, Gulf of Mexico coast (Figure 9 of Stapor, 1975) are secondary, erosional geomorphic features 1–2 m above present-day MSL whose chronometric time of origin, at present, cannot be determined. Thus, beach-ridge plains provide arguably the best places to look for material referents of Holocene sea-level positions equal to, or even higher than, present-day. However, prior to the development of OSL dating, the vast majority of beach ridges in the southeastern United States could not be dated because of their fundamental lack of shells. Wide, non-deltaic, beach-ridge plains that could record sea-level highstands are not common in the southeastern United States. There are only four major candidates: (1) the Little Point Clear and Lake Shelby areas, Baldwin Co., Alabama, have 5500-year records, see Blum et al. (2003) and Rodriguez and Meyer (2006) for opposing sea-level interpretations; (2) St. Vincent Island, Florida, has a 4000-year record (Forrest, 2007; López and Rink, 2007, 2008); (3) Sanibel Island, Florida, has a 3000-year record (Stapor et al., 1991) and (4) Cape Canaveral, Florida, now with a 5700-year record. Stapor et al. (1991) were able to date Sanibel Island beach ridges because this beach-ridge plain alone has abundant shells; the other three previously mentioned beach-ridge plains were dated by means of OSL. This interpreted MSL position of at least equal to present-day for the ~5700-year Cape Canaveral Beach-ridge Set 1 is ~4 m above the arguably coeval positions in both the Hawkes et al. (2016) and the Khan et al. (2017) curves, both based on subsurface data (Figure 10). It is 3.5 m above the coeval Acropora palmata position in southeast Florida (Figure 10, Stathakopoulos et al., 2020). However, it fits on the Balsillie and Donoghue (2004) curve based on onshore or subaerial data from the northern Gulf of Mexico and South Florida (Figure 10). Given the documented recovery of sea-level to it present-day position some 5000–6000 years ago along tectonically stable coasts well removed from centers of continental glaciation, evidence of this recovery should be expected to be found along the Florida Gulf of Mexico and Atlantic coasts, both of which meet the stable tectonic and distant geographic location requirements. The deposition and preservation of beach-ridge plains requires the presence of sand, which, however, is, and apparently has been, in very short supply along the vast majority of the Florida coastline and nearshore shelf, given the paucity of laterally extensive, kilometers-wide, barrier islands and/or beach-ridge plains. These four previously mentioned beach-ridge plains from the Gulf of Mexico coast and the Atlantic coast of Florida strongly argue for the existence of a mid-Holocene, sea-level “highstand” equal to that of present-day which is, however, not indicated by any of the SLRs based on subsurface data. The sea-level index points from beach-ridge plains scattered along the Florida Gulf of Mexico and Atlantic coasts argue for the serious consideration of a regional SLR of the past 5000–6000 years similar to the fluctuating model of Fairbridge (1961).
Conclusions
OSL dating of the quartz sand comprising the oldest Holocene beach-ridge set preserved on Cape Canaveral has yielded a depositional age of some 5700 years. Given that the elevations of the intervening sand-floored swales range from +0.5 to +1.1 m MSL, it is conservatively estimated that mean sea-level during this deposition was equal to or within several decimeters of present day. This 5700-year sea-level position is in agreement with tropical and southern hemisphere curves as well as the Balsillie and Donoghue (2004) Gulf of Mexico curve derived from onshore, subaerial data; it is 4 m higher than coeval points on the Hawkes et al. (2016) and Khan et al. (2017) curves derived from intertidal indicators collected in subsurface cores. A more complete, as well as realistic, depiction of the successive positions of sea level over the past 6000 years, at least along the Florida coast of the southeastern United States, must involve both subsurface and subaerial data.
An improved chronometric framework for the deposition of the Cape Canaveral beach-ridge plain indicates that 75% of the preserved beach ridges (Sets 5–16) were deposited during 1400 years out of the 5700-year interval; furthermore, half of the existing beach ridges, Sets 7–16, were deposited during the past 1000 years. The remaining 4300 years are represented by (1) Beach-ridge Sets 1–4 and (2) the erosional truncations or disconformities that define the boundaries between the beach-ridge sets.
A total of 21 radiocarbon ages made on individual, marine, mollusk-shells collected from two adjacent sites in Beach-ridge Set 5 yielded two spectrums of ages ranging from 2100 to 25,000 cal years BP. Because there is no cluster of overlapping ages at the younger end of either spectrum, the youngest age can only be considered a maximum estimate of depositional age. However, three nearby sources that could have contributed reworked shells to the deposits of Beach-ridge Set 5 can be identified in the two spectrums of ages. The erosion and subsequent redeposition of disarticulated pelecypod and gastropod shells can severely limit the ability of radiocarbon shell ages to estimate the timing of deposition. The truncation of older beach ridges and beach-ridge sets is an indicator that reworking of older shells into younger deposits has most likely occurred in a given area.
Supplemental Material
sj-docx-1-hol-10.1177_09596836211049975 – Supplemental material for A 5700-year-old beach-ridge set at Cape Canaveral, Florida, and its implication for Holocene sea-level history in the southeastern USA
Supplemental material, sj-docx-1-hol-10.1177_09596836211049975 for A 5700-year-old beach-ridge set at Cape Canaveral, Florida, and its implication for Holocene sea-level history in the southeastern USA by Kathleen Rodrigues, Frank W Stapor, William J Rink, James S Dunbar and Glen Doran in The Holocene
Supplemental Material
sj-docx-2-hol-10.1177_09596836211049975 – Supplemental material for A 5700-year-old beach-ridge set at Cape Canaveral, Florida, and its implication for Holocene sea-level history in the southeastern USA
Supplemental material, sj-docx-2-hol-10.1177_09596836211049975 for A 5700-year-old beach-ridge set at Cape Canaveral, Florida, and its implication for Holocene sea-level history in the southeastern USA by Kathleen Rodrigues, Frank W Stapor, William J Rink, James S Dunbar and Glen Doran in The Holocene
Supplemental Material
sj-docx-3-hol-10.1177_09596836211049975 – Supplemental material for A 5700-year-old beach-ridge set at Cape Canaveral, Florida, and its implication for Holocene sea-level history in the southeastern USA
Supplemental material, sj-docx-3-hol-10.1177_09596836211049975 for A 5700-year-old beach-ridge set at Cape Canaveral, Florida, and its implication for Holocene sea-level history in the southeastern USA by Kathleen Rodrigues, Frank W Stapor, William J Rink, James S Dunbar and Glen Doran in The Holocene
Supplemental Material
sj-docx-4-hol-10.1177_09596836211049975 – Supplemental material for A 5700-year-old beach-ridge set at Cape Canaveral, Florida, and its implication for Holocene sea-level history in the southeastern USA
Supplemental material, sj-docx-4-hol-10.1177_09596836211049975 for A 5700-year-old beach-ridge set at Cape Canaveral, Florida, and its implication for Holocene sea-level history in the southeastern USA by Kathleen Rodrigues, Frank W Stapor, William J Rink, James S Dunbar and Glen Doran in The Holocene
Footnotes
Acknowledgements
The authors thank Tom Penders for his support of the work done on Patrick Air Force Base at Cape Canaveral. KR thanks Amanda Keen-Zebert for use of the Desert Research Institute luminescence lab facilities for work on CCAFS1 and CCAFS2. FWS thanks Thomas D. Mathews of the South Carolina Marine Resources Research Institute for making the initial radiocarbon ages of the shells collected from LC19 and LC34.
Author note
We wish to mark here the untimely sad death of our co-author Glen Doran who passed away in August 2021 during the final review of this manuscript. His largest contribution was to make all of this work a possibility in that he obtained both the permission and the funding to carry out work on the Canaveral Peninsula. His enthusiasm and his earnest love for his colleagues and students always made a day in the field with Glen a joy and a memory. We dedicate this paper to Glen.
Funding
The author(s) disclosed receipt of the following financial support for the research, authorship, and/or publication of this article: This paper presents selected sedimentologic, geomorphologic, and chronometric information collected during an archeologic and geologic assessment of the Cape Canaveral Air Force Station, Grant # FA2521-12-P-0098 awarded to Glen Doran. WJR and KR thank the Natural Sciences and Engineering Research Council of Canada for financial support of the OSL dating work on CCT22, CCT14 and CCPS02.

Supplemental material
Supplemental material for this article is available online.
References
Supplementary Material
Please find the following supplemental material available below.
For Open Access articles published under a Creative Commons License, all supplemental material carries the same license as the article it is associated with.
For non-Open Access articles published, all supplemental material carries a non-exclusive license, and permission requests for re-use of supplemental material or any part of supplemental material shall be sent directly to the copyright owner as specified in the copyright notice associated with the article.
