



Abstract
Recent paleo-climatic/environmental studies have resulted in several high-resolution paleo-precipitation/moisture reconstructions in Northwestern (NW) China over extended periods. Nevertheless, those reconstructions are mostly about the climatic history of individual sites, while fine-grained portrayal and analysis of the geographic extent of drought anomalies across the entire NW China are still missing. We based our study on the dryness/wetness grade series of 19 sites in NW China, which are primarily derived from historical documents, to reconstruct the annual geographic extent of drought anomalies in NW China in AD 1470–2008. Our reconstruction reveals the following periods of drought in NW China: the AD 1470s–1490s, 1620s–1640s, 1700s–1720s, 1770s–1790s, 1860s–1870s, and 1910s–1930s. The most extremely dry years were AD 1928 and 1929. In addition, we found that the influence of El Niño Southern Oscillation (ENSO) on the geographic extent of drought anomalies in NW China was non-stationary at the inter-annual to multi-decadal timescale and that the correlation switched from positive to negative since the late ‘Little Ice Age’. We propose that this non-stationary relationship is attributable to the variance of ENSO and the strength of Asian Summer Monsoon. To conclude, we discuss the implications of the above findings within the context of global warming.
Introduction
Northwestern (NW) China includes Sha’anxi, Gansu, Ningxia, Qinghai, and Xinjiang. The total area of the region is about 3.09 million km2, comprising approximately one-third of China’s land area. Most of the regions in NW China are marked by aridity, where the mean annual rainfall is below 250 mm. In the western plains, annual precipitation is in the range of 50–150 mm; in the Taklimakan Desert, precipitation is even less than 25 mm. However, annual evaporation is more than 1400 mm on average and about 2000–3000 mm in the desert areas (Deng et al., 2005; Zhao, 1986).
Precise knowledge of natural long-term climate variability is critically important in making it possible for local administration to anticipate and plan reasonable preventive measures for potential future droughts. But the short instrumental precipitation records in NW China are major obstacles in understanding and predicting regional precipitation variability. The records cover only the past 50 years and thus contain a limited subset of drought events, which are too short to investigate multi-decadal or longer climate oscillations. This makes it difficult to evaluate the magnitude and frequency of modern droughts in a historic context (Yang et al., 2011). Fortunately, since the AD 1990s, there has been a surge of high-resolution moisture/precipitation reconstructions of various sites in NW China. Those reconstructions are grounded on proxies such as tree-ring chronologies (e.g. Chen et al., 2014; Fang et al., 2009a, 2009b, 2012; Kang et al., 2012, 2013, 2014; Li et al., 2006, 2007; Sheppard et al., 2004; Yang et al., 2011, 2014a, 2014b; Zhang et al., 2011), cave speleothems (e.g. Cai et al., 2010; Tan et al., 2011a; Zhang et al., 2008), and historical documents (e.g. Tan et al., 2008; Yan et al., 1993). They help to unveil the complex climate dynamics in different parts of NW China over extended periods.
The precipitation regime of NW China is influenced by multiple atmospheric circulation systems such as Asian Summer Monsoon (ASM), Winter Monsoon, and Westerlies simultaneously. Hence, the hydro-climate in NW China is characterized by substantial regional variation (Zhao, 1986). Given that most of the above mentioned high-resolution reconstructions are derived from proxies at individual sites, their contained hydro-climatic signals may be site-specific in nature, which could not be generalized to other parts of NW China. At the moment, fine-grained portrayal and analysis of the spatial extent of drought in NW China over extended periods still remain very limited. Although attempts have been made to map the spatial extent of drought in major climatic epochs (e.g. Chen et al., 2010, 2015; Yang et al., 2014a), the inter-annual to multi-decadal change of the spatial extent remains insufficiently explored. Such a gap in knowledge may obstruct the investigation of the spatial extent of recent drought in NW China and whether it is still within the range of natural climate variability during historic times. NW China is the monsoon northernmost marginal active zone and is prone to severe drought. At the inter-decadal timescale, those drought anomalies that originate in NW China will spread in a southward/southeastward direction to the Yangtze River and South China (Qian et al., 2009). Therefore, investigating ‘the historical climate change of this region is not only important in its own right, but also helps to have a better understanding of the natural process of climate change in China’s borderland between semi-humid and semi-arid regions’ (Dai et al., 2009: 751).
In the present study, we used historical information about dryness/wetness to reconstruct the annual geographic extent of drought anomalies across all of NW China for a period longer than 500 years. Our focus is the inter-annual to multi-decadal variability. As the signals of El Niño Southern Oscillation (ENSO) from the Pacific Ocean are detected in the paleo-precipitation/moisture reconstructions of several sites in NW China (Fang et al., 2009a, 2009b, 2012; Kang et al., 2012, 2013; Li et al., 2006, 2007; Yang et al., 2014a), and as ENSO is considered to be a very important force in causing hydro-climatic variability over China (Chen et al., 2015), we also examined whether and how far the geographic extent of drought anomalies in NW China is attributable to ENSO activity. Based on our findings, the associated implications within the context of global warming were discussed.
Materials and methods
Historical drought anomalies records
Our drought anomalies records were derived from the Yearly Charts of Dryness/Wetness in NW China for the Last 500-year Period (1470–2008) compiled by Bai et al. (2010), which is the official updated version of widely employed Yearly Charts of Dryness/Wetness in China for the Last 500-year Period (Chinese National Meteorological Administration, 1981). The latter dataset contains dryness/wetness grade series for 120 sites in China in AD 1470–1979, and 12 of the sites are located in NW China (including Xining, Geermu, Zhangye, Lanzhou, Pingliang, Tianshui, Yinchuan, Yulin, Yan’an, Xi’an, Hanzhong, and Ankang). In recent years, Bai et al. (2010) have updated the dryness/wetness grade series of those 12 sites to the year AD 2008 and have added the dryness/wetness grade series of 7 new sites in NW China into the dataset (including Xinghai, Yushu, Gangcha, Wudu, Yanchi, Guyuan, and Baoji). The locations of all of the sites in NW China with the dryness/wetness grade series in Bai et al.’s (2010) dataset are shown in Figure 1.
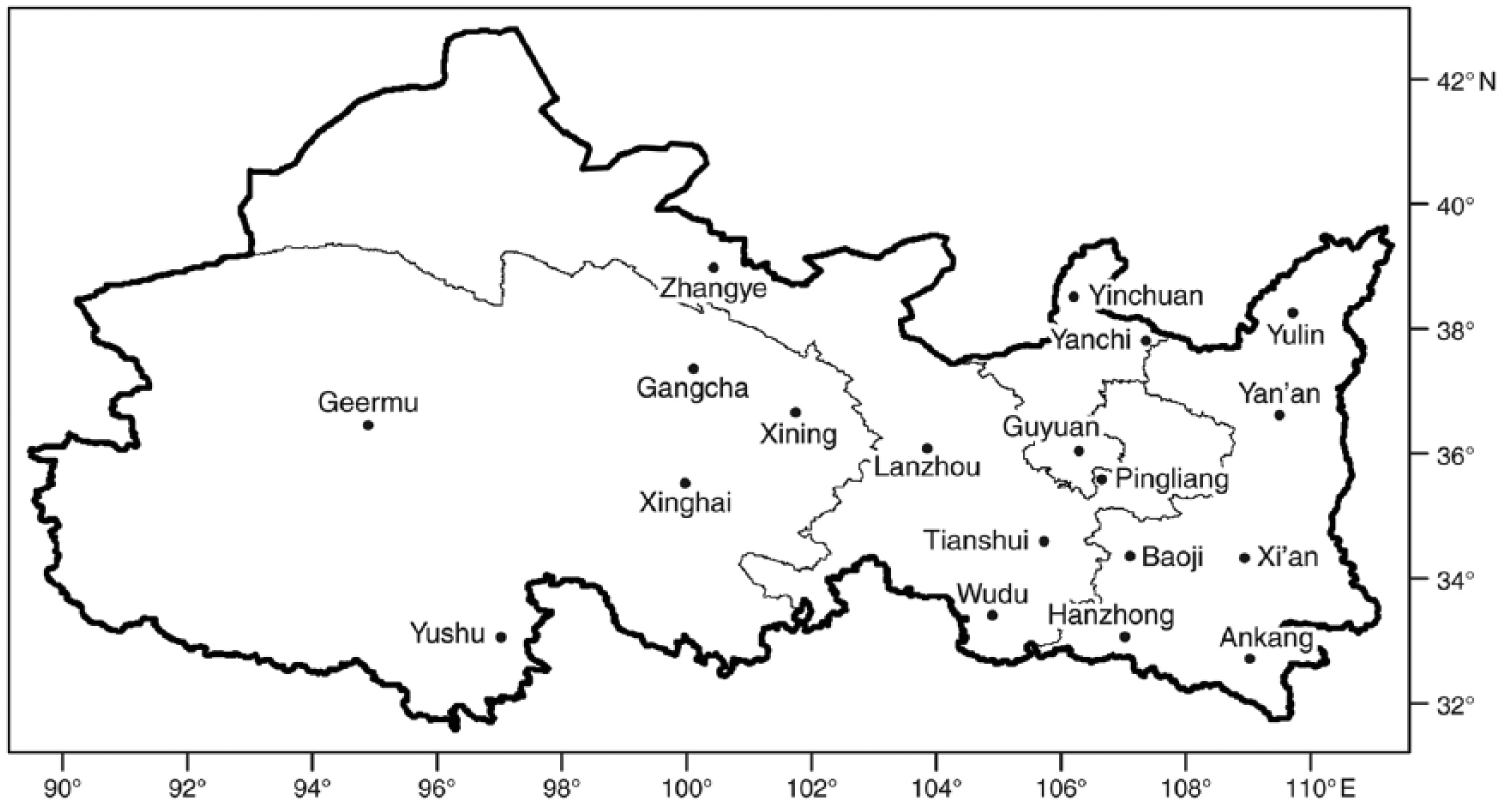
Map showing the location of the 19 sites in NW China covered in the present study (modified from Bae et al. (2010)). The dryness/wetness grade series of those sites are employed to reconstruct the annual geographic extent of drought anomalies.
In the above datasets, a 5-point grading system was applied to describe local climatic conditions, ranging from extremely wet to extremely dry (1 to 5, detail grade descriptor is presented in Table 1). The dryness/wetness grades of each site in AD 1470–1950 (i.e. the period without instrumental precipitation records) were assigned according to the statistical evaluation of historical descriptions about dry/wet conditions in local gazettes and other historical documents, while the grades in AD 1951–2008 (i.e. the period with instrumental precipitation records) were assigned according to the measured amounts of summer (May–September) rainfall in the meteorological stations nearby. The grade conversion is operationalized as





Detailed description of dryness/wetness grade.

where
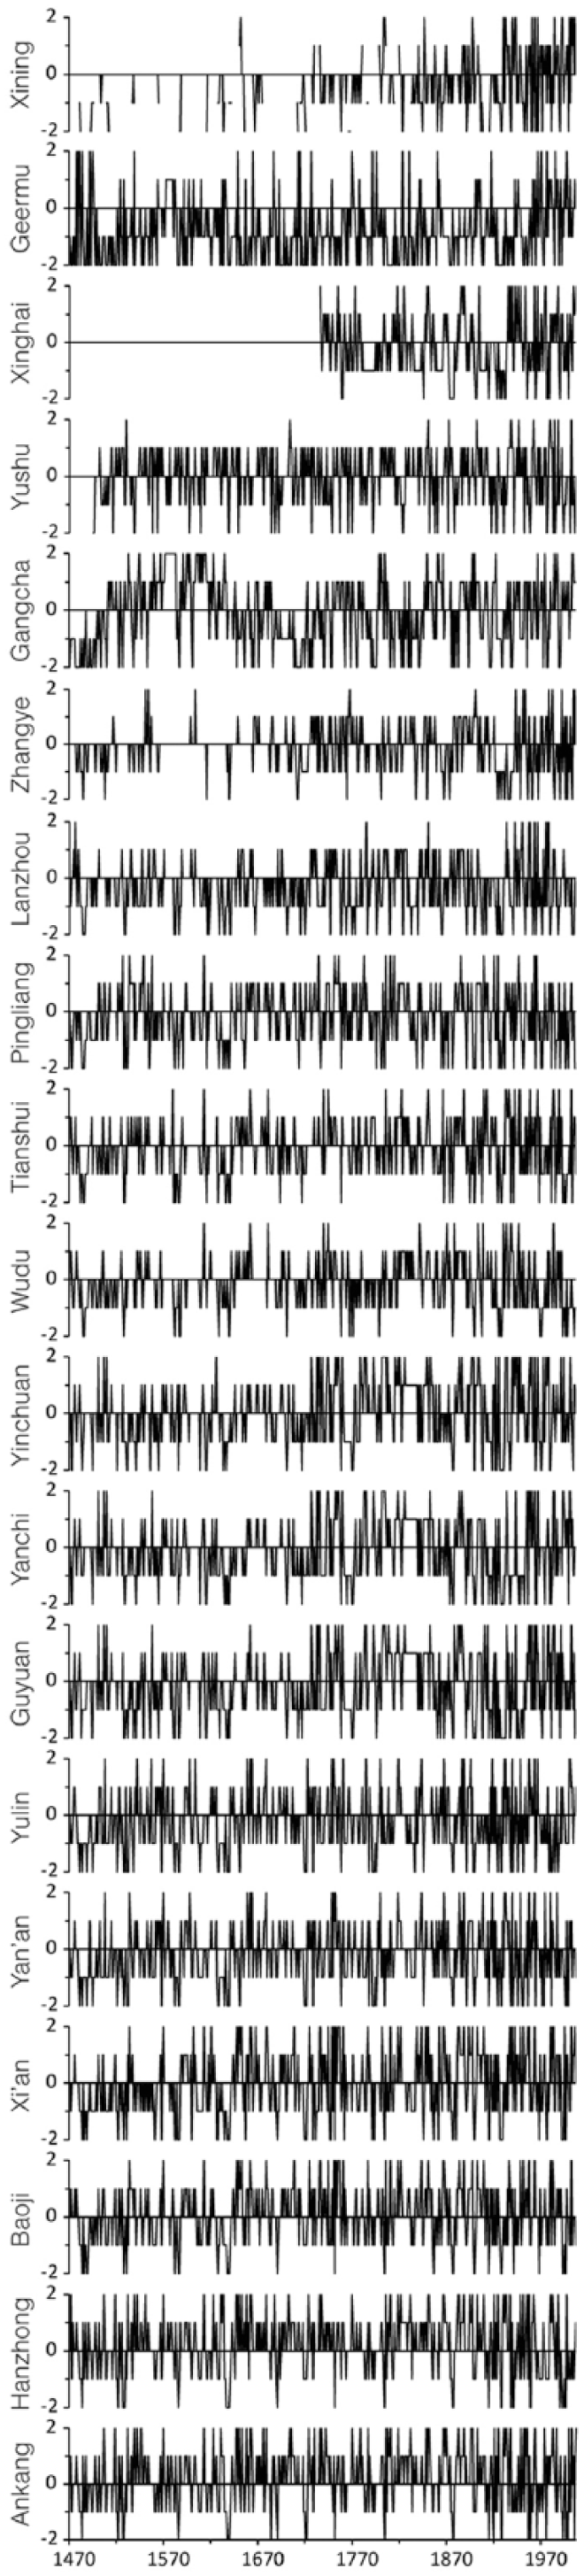
Dryness/wetness grade series of the 19 sites in NW China in AD 1470–2008. The dryness/wetness grade ranges from 2 to −2, representing the spectrum from extremely wet to extremely dry.
ENSO records
ENSO refers to the coupling variations in the sea surface temperature of the tropical eastern Pacific Ocean and in air surface pressure in the tropical western Pacific. El Niño and La Niña are the unusually warm and cold phases of the ENSO cycle, and their alternation has profound impacts on worldwide weather and climate via atmospheric teleconnections (McPhaden et al., 2006). For our ENSO data, Li et al.’s (2013) annual Niño 3.4 index reconstruction is chosen. The reconstruction is derived from 2222 tree-ring chronologies from Asia, New Zealand, and North and South America, covering both the tropics and mid-latitudes in the Northern and Southern Hemispheres. The inclusion of tropic records in the reconstruction allows it to capture the signals of ENSO more precisely. The reconstruction spans AD 1301–2005, covering almost the entire time span of our historical drought anomalies records. The ENSO record can be downloaded from the World Data Center for Paleoclimatology (ftp://ftp.ncdc.noaa.gov/pub/data/paleo/treering/reconstructions/enso-li2013.txt).
Reconstruction of the spatial extent of drought anomalies
Osborn and Briffa (2006) use the periods with synchronous warm or cold anomalies in various temperature reconstructions to determine the climatic anomalies in the Northern Hemisphere. Their method takes both the magnitude and the spatial influence of climate change into account, which helps to trace whether the periods of warmth or cold are widespread or spatially restricted. We followed their principles to obtain the spatial extent of drought anomalies in NW China spanning AD 1470–2008. The following steps were taken.
First, we applied the non-parametric Spearman correlation to examine the interrelationship among the dryness/wetness grade series of the 19 sites in NW China. Results are presented in Table 2. There are 171 inter-series Spearman correlation coefficients in total; 124 of them are positively significant at the 0.05 level. This indicates the presence of a common signal among the 19 sites. On the other hand, there are 31 statistically insignificant and 16 negatively significant correlation coefficients. All of them are pertinent to the comparison between the stations in the western part of NW China and their eastern counterparts. This reveals the disparity of precipitation between the two parts of NW China that are separated by the ASM limit (Chen et al., 2008; Shi et al., 2007). The precipitation regime north of the limit is mainly influenced by the Westerlies, while the one south of the limit is primarily determined by the ASM (Chen et al., 2008, 2010).
Non-parametric Spearman correlation matrix among the dryness/wetness grade series of the 19 sites in NW China.
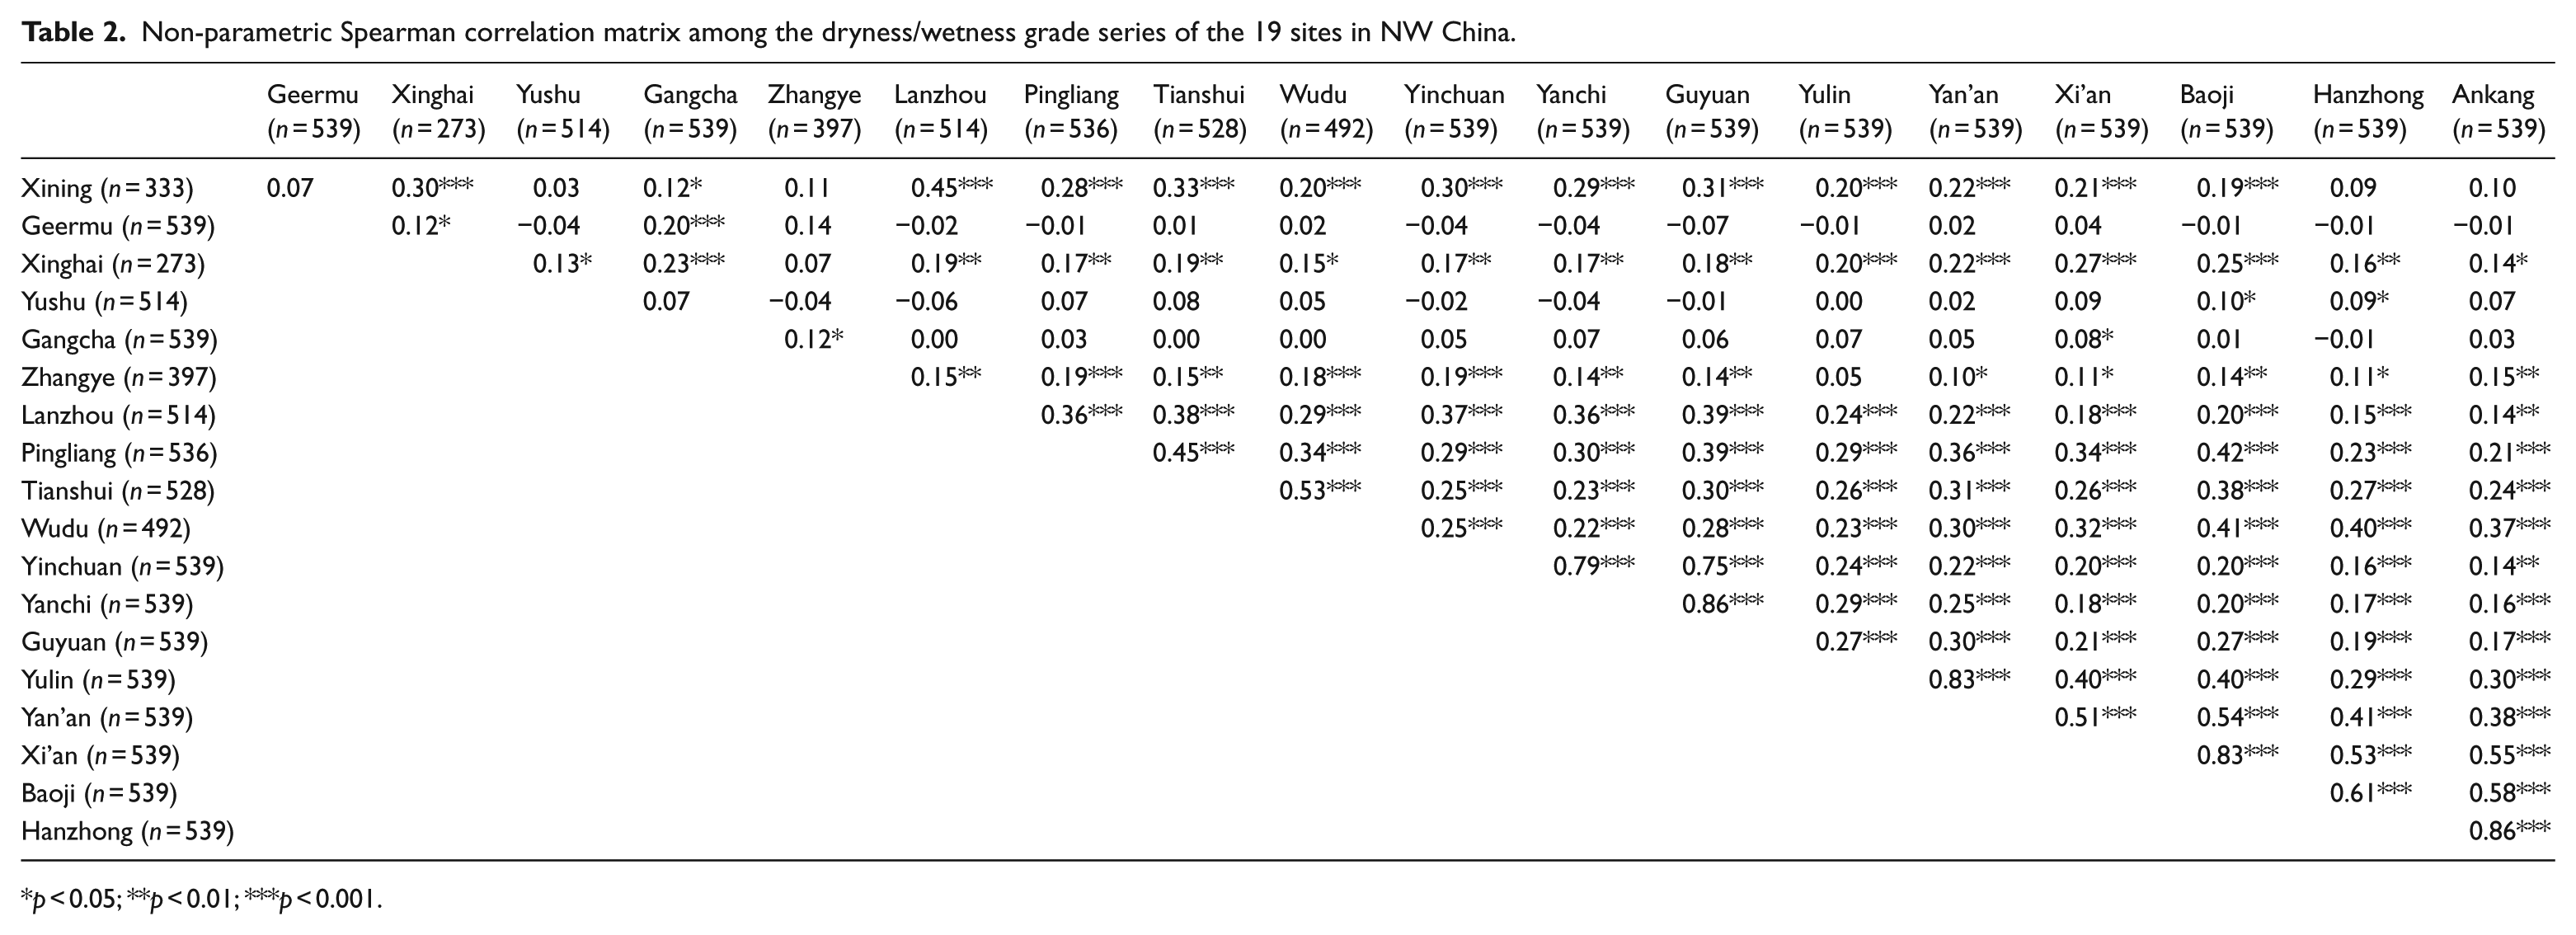
p < 0.05; **p < 0.01; ***p < 0.001.
Next, we counted the fraction of those series that have data in any given year whose dryness/wetness grade was below zero on a yearly basis (i.e. dry). At the same time, those above zero were also counted (i.e. wet) (Figure 3a). All series were given equal weight in the counting process. We found that at the multi-centennial timescale, a larger proportion of the sites in NW China was dry in ~AD 1470–1650 and 1870–1930, while the proportion in wetness increased throughout our study time span.
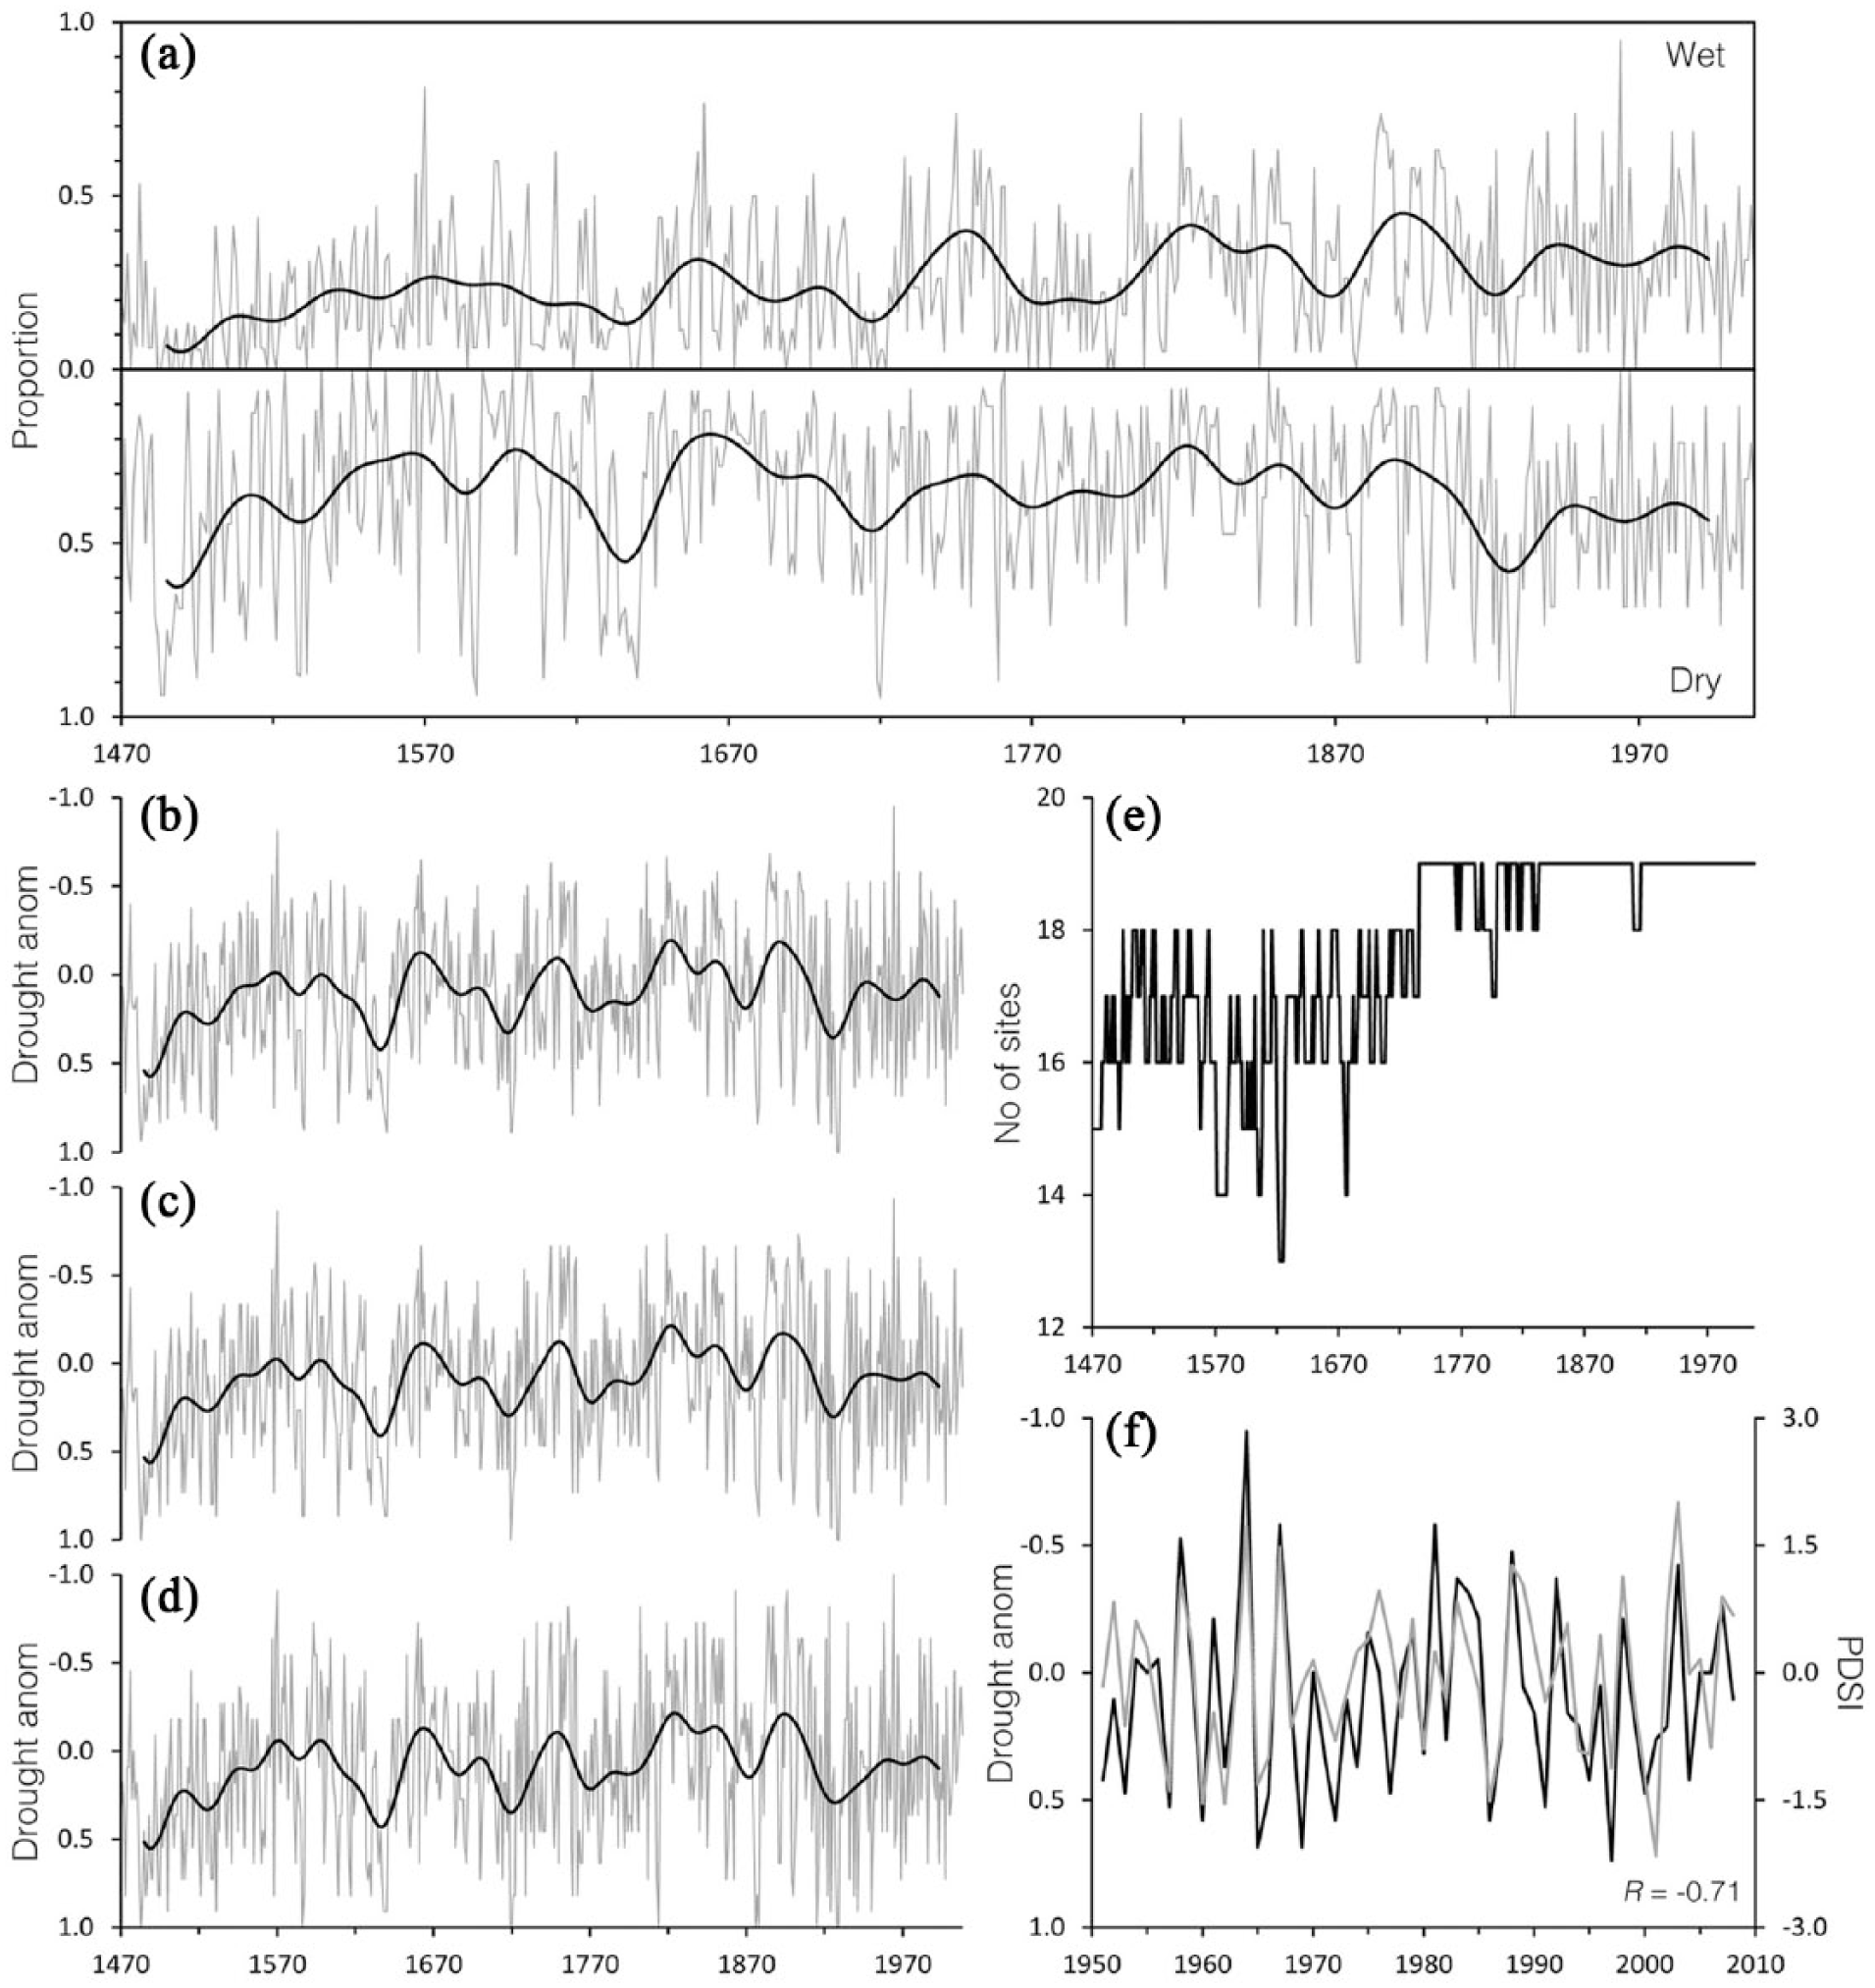
Reconstruction of the geographic extent of drought anomalies in NW China. (a) Proportion of sites in dryness/wetness. (b) The ‘complete’ reconstruction of the geographic extent of drought anomalies in NW China, which is determined by the proportion difference between dry and wet (i.e. dry minus wet). (c) The reconstruction with the sites Xining, Xinghai, Zhangye, and Wudu removed. (d) The reconstruction with the sites Xining, Xinghai, Yushu, Zhangye, Lanzhou, Pingliang, Tianshui, and Wudu removed. (e) Number of sampled sites in individual years. (f) Comparison between the ‘complete’ reconstruction (black line, corresponds to the left Y-axis) and PDSI (gray line, corresponds to the right Y-axis) in AD 1951–2008. The black lines in panels (a)–(d) are the smoothed values of time-series obtained via Mann’s (2008) 31-year low-pass adaptive filter. The left Y-axes of panels (a)–(d) and (f) are inverted for better data conceptualization.
Finally, the fraction of dry was subtracted from the fraction of wet to give the spatial extent of drought anomalies in NW China. The resultant drought anomalies time-series is shown in Figure 3b. The multi-centennial trend of the spatial extent of drought anomalies reveals that the aridity of NW China has been relatively mild over time.
It is worth mentioning that 8 out of the 19 sites (Xining, Xinghai, Yushu, Zhangye, Lanzhou, Pingliang, Tianshui, and Wudu) had missing data spaced irregularly in time. The dryness/wetness grade series of those sites were also included when counting the annual fraction of drought/flood. The merit of this practice is that it augments sampled sites and hence, gives a more precise estimation about the geographic extent of drought anomalies. On the other hand, the inclusion of those sites may raise a concern whether our reconstruction is significantly distorted by the missing data. Therefore, we conducted a sensitivity test to check whether our ‘complete’ reconstruction of drought anomalies (Figure 3b) would be significantly different if those ‘incomplete’ site records are excluded. We removed those sites with more than 5% missing data in their dryness/wetness grade series (Xining, Xinghai, Zhangye, and Wudu) and then repeated our reconstruction procedures. The Pearson correlation coefficient between the resultant reconstruction (Figure 3c) and the ‘complete’ one is 0.98 (n = 539, p < 0.001). We then removed all of the sites with missing data to do the reconstruction, and the Pearson correlation coefficient between the resultant reconstruction (Figure 3d) and the ‘complete’ one is 0.94 (n = 539, p < 0.001). The strong correlations may indicate that the influence of missing data upon our reconstruction is only minimal. The number of sampled sites in individual years is presented in Figure 3e.
Results and discussion
Validation of the geographic extent of drought anomalies in NW China
To verify the validity of our complete drought anomalies reconstruction, we correlated it with the Palmer Drought Severity Index (PDSI) monthly 2.5° × 2.5° gridded dataset compiled by Dai et al. (Dai, 2011a, 2011b; Dai et al., 2004). In the PDSI dataset, positive and negative values of the index correspond to wet and dry conditions, respectively. The PDSI dataset spans AD 1850–2012. In reference to Yang et al. (2014a), we only used the PDSI data that are derived from instrumental records. The earliest instrumental observations in NW China began in AD 1951. To match with our reconstruction, only those grids falling within NW China (excluding Xinjiang) were chosen, and the monthly PDSI values between May and September of those grids were averaged to give the annual PDSI (Figure 3f). The Pearson correlation coefficient between the PDSI and our reconstruction over their common period (i.e. AD 1951–2008) is −0.71 (n = 58, p < 0.001), indicating that our reconstruction could capture the moisture regime fluctuations in NW China in recent decades.
To further verify the validity of our complete drought anomalies reconstruction, we compared it with other annual precipitation proxies/reconstructions derived from various sites in NW China and the surrounding regions. Our results show that there is good agreement between our time-series and various proxies/reconstructions (Figure 4), and all of the Pearson correlation coefficients are significant at the 0.001 level (Table 3). In addition, it is observed that our drought anomalies series is strongly correlated with those precipitation series with broad geographic coverage, such as the ones for Sha’anxi (Yuan, 1994), Gan-Ning-Qing Region (Yuan, 1994), and North-Central China (Yi et al., 2012). In contrast, for those precipitation series derived from remote areas such as Northeastern Tibetan Plateau (Yang et al., 2014b) and Northeastern Qinghai (Sheppard et al., 2004), their correlation with our drought anomalies series is relatively weak, although it is statistically significant. The weak correlation may be attributable to the discrepancy of geographic coverage of the time-series.

Comparison among annual precipitation proxies/reconstructions derived from various sites in NW China and the surrounding regions. (a) Geographic extent of drought anomalies in NW China. (b) Precipitation index of North-Central China (Yi et al., 2012). (c) Precipitation index of Northeastern Tibetan Plateau (Yang et al., 2014b). (d) Precipitation index of Northeastern Qinghai (Sheppard et al., 2004). (e) Drought anomalies of Gan-Ning-Qing Region (Yuan, 1994). (f) Drought anomalies of Sha’anxi (Yuan, 1994). The left Y-axes of panels (a), (e), and (f) are inverted for better data conceptualization. Gray vertical shadings denote the drought periods identified in our geographic extent of drought anomalies reconstruction.
Annual precipitation proxies/reconstructions derived from various sites in NW China and the surrounding regions and their Pearson correlation with our geographic extent of drought anomalies reconstruction.
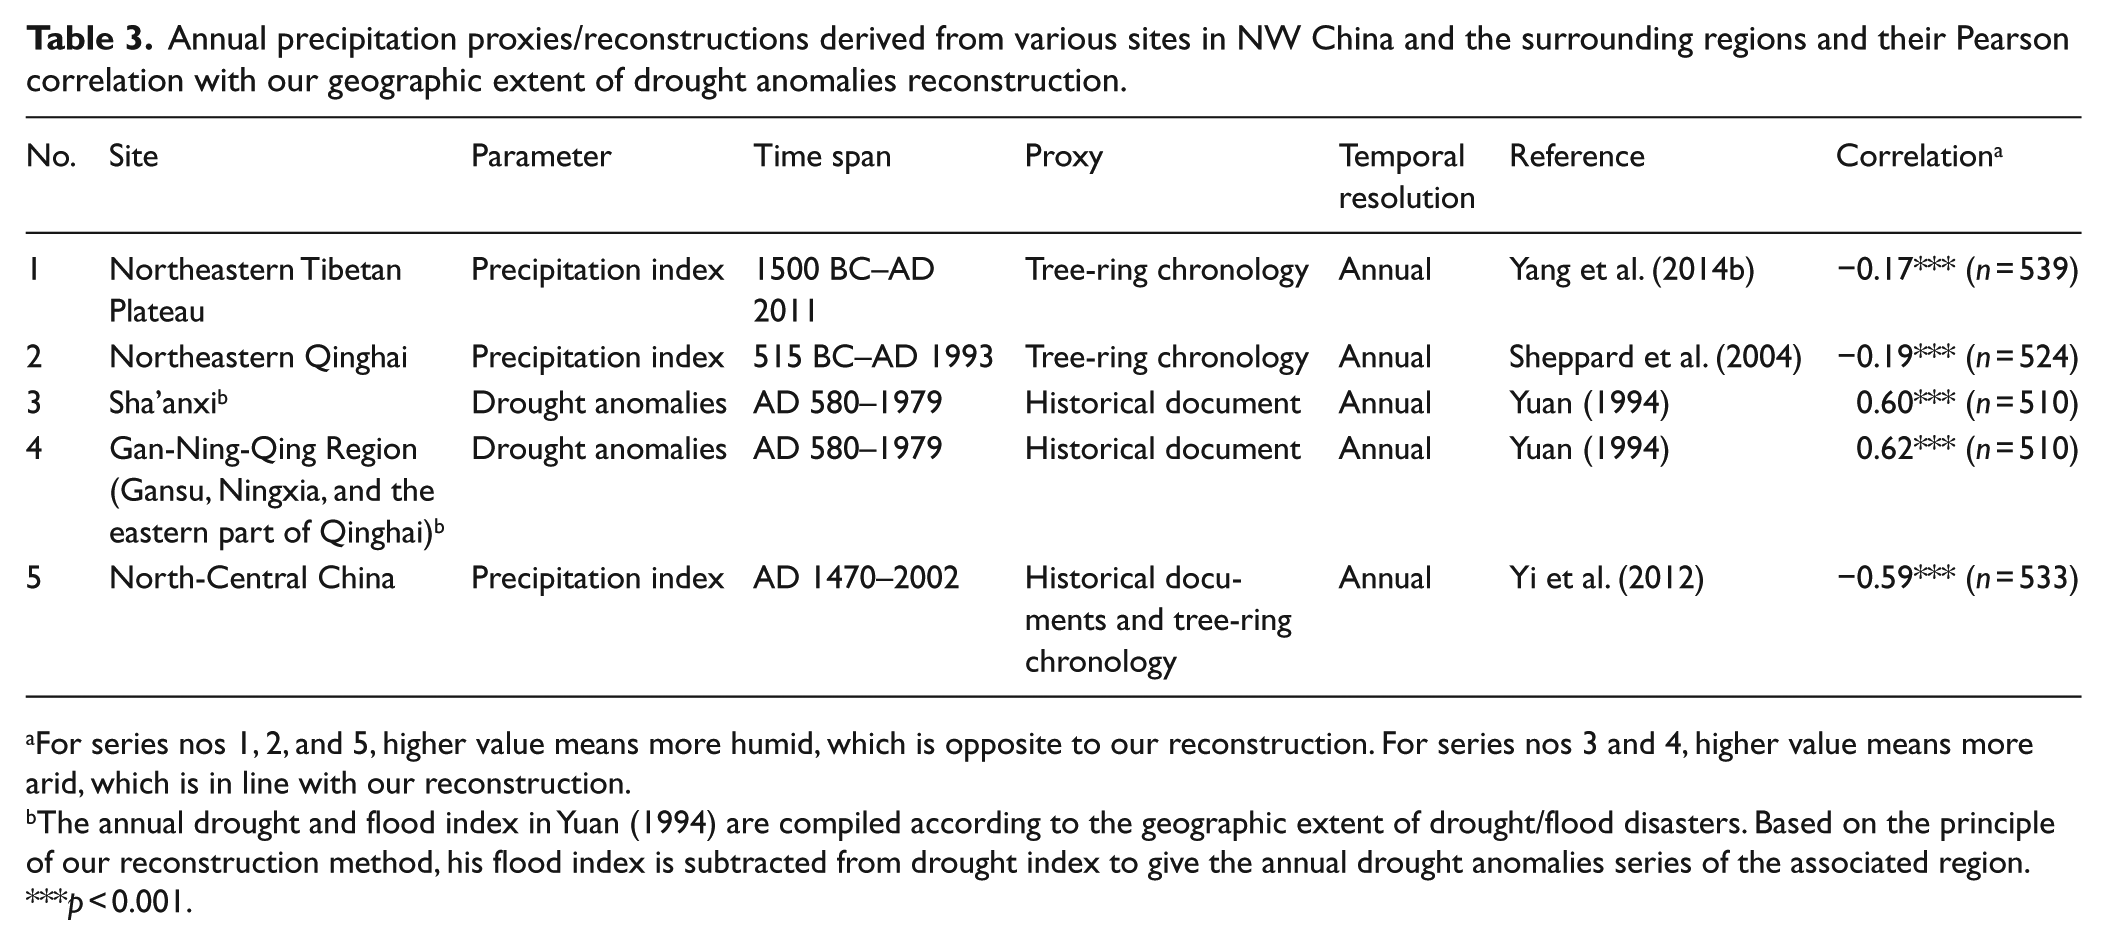
For series nos 1, 2, and 5, higher value means more humid, which is opposite to our reconstruction. For series nos 3 and 4, higher value means more arid, which is in line with our reconstruction.
The annual drought and flood index in Yuan (1994) are compiled according to the geographic extent of drought/flood disasters. Based on the principle of our reconstruction method, his flood index is subtracted from drought index to give the annual drought anomalies series of the associated region.
p < 0.001.
We applied Mann’s (2008) 31-year low-pass adaptive filter to obtain the multi-decadal variability of our drought anomalies reconstruction. To optimize the smoothed values with the raw time-series, the filter adaptively weights the three lowest order time-series boundary constraints, namely, minimum norm, minimum slope, and minimum roughness. This helps to yield more accurate assessments of long-term climate change. The drought periods are illustrated as the AD 1470s–1490s, 1620s–1640s, 1700s–1720s, 1770s–1790s, 1860s–1870s, and 1910s–1930s, which match those recorded in other proxies/reconstructions (Figure 4). In addition, they are coincident with the historical mega droughts documented in other studies, such as the five most severe drought events of AD 1480–1499, 1625–1644, 1710–1729, 1875–1878, and 1922–1931 at the northern fringe of ASM region (Yang et al., 2014a) and the widespread droughts of AD 1460–1500, 1570–1600, 1620–1650, 1700–1730, 1760–1780, and 1920–1970 in Sha’anxi, Gansu, and Ningxia (Zhang et al., 2011). In general, our reconstruction incorporates the footprints of those historical mega droughts across NW China.
Our spatial extent of drought anomalies time-series was randomly sampled (with replacement) to generate 10,000 new time-series via bootstrapping procedure, with n equal to the total number of data points of our original time-series. Then, the 90% and 10% quantiles of the confidence limit of every bootstrapped time-series were calculated. Finally, we averaged all of the generated 90% and 10% quantiles to obtain the final confidence limit for our drought anomalies reconstruction. The above method allows us to estimate empirically the sampling distribution of statistic without making assumptions about the form of the population and without deriving the sampling distribution explicitly (Fox and Weisberg, 2011). A given year would be considered as extremely dry (wet) if its value of drought anomalies is >90% (<10%) quantile of the confidence limit. The identified extremely dry and wet years are listed in Table 4. The extremely dry years in NW China are clustered in the periods AD 1470–1499, 1500–1524, 1625–1649, 1700–1724, 1875–1899, 1900–1924, and 1925–1949, while the extremely wet years in NW China are clustered in the periods AD 1575–1599, 1750–1774, 1825–1849, 1875–1899, and 1900–1924. The most extremely dry years over the last 539 years are identified as AD 1928 and 1929, in which all of the 19 sites are marked by dryness. Although the two drought years might not be the worst ever at some individual sites (e.g. Kang et al., 2012, 2013), they were marked by a high incidence of missing rings in the tree-ring chronologies across the semi-arid and arid areas of northern China, which was synchronous with extremely low precipitation recorded at several meteorological stations, the dramatic runoff decline or drying up of river courses and desiccation of lakes, catastrophic agricultural failure, great famines and merciless decimation of the population in North China and the eastern part of Northwest China. (Liang et al., 2006: 427)
Extremely dry/wet years in NW China in AD 1470–2008 identified in our geographic extent of drought anomalies reconstruction.
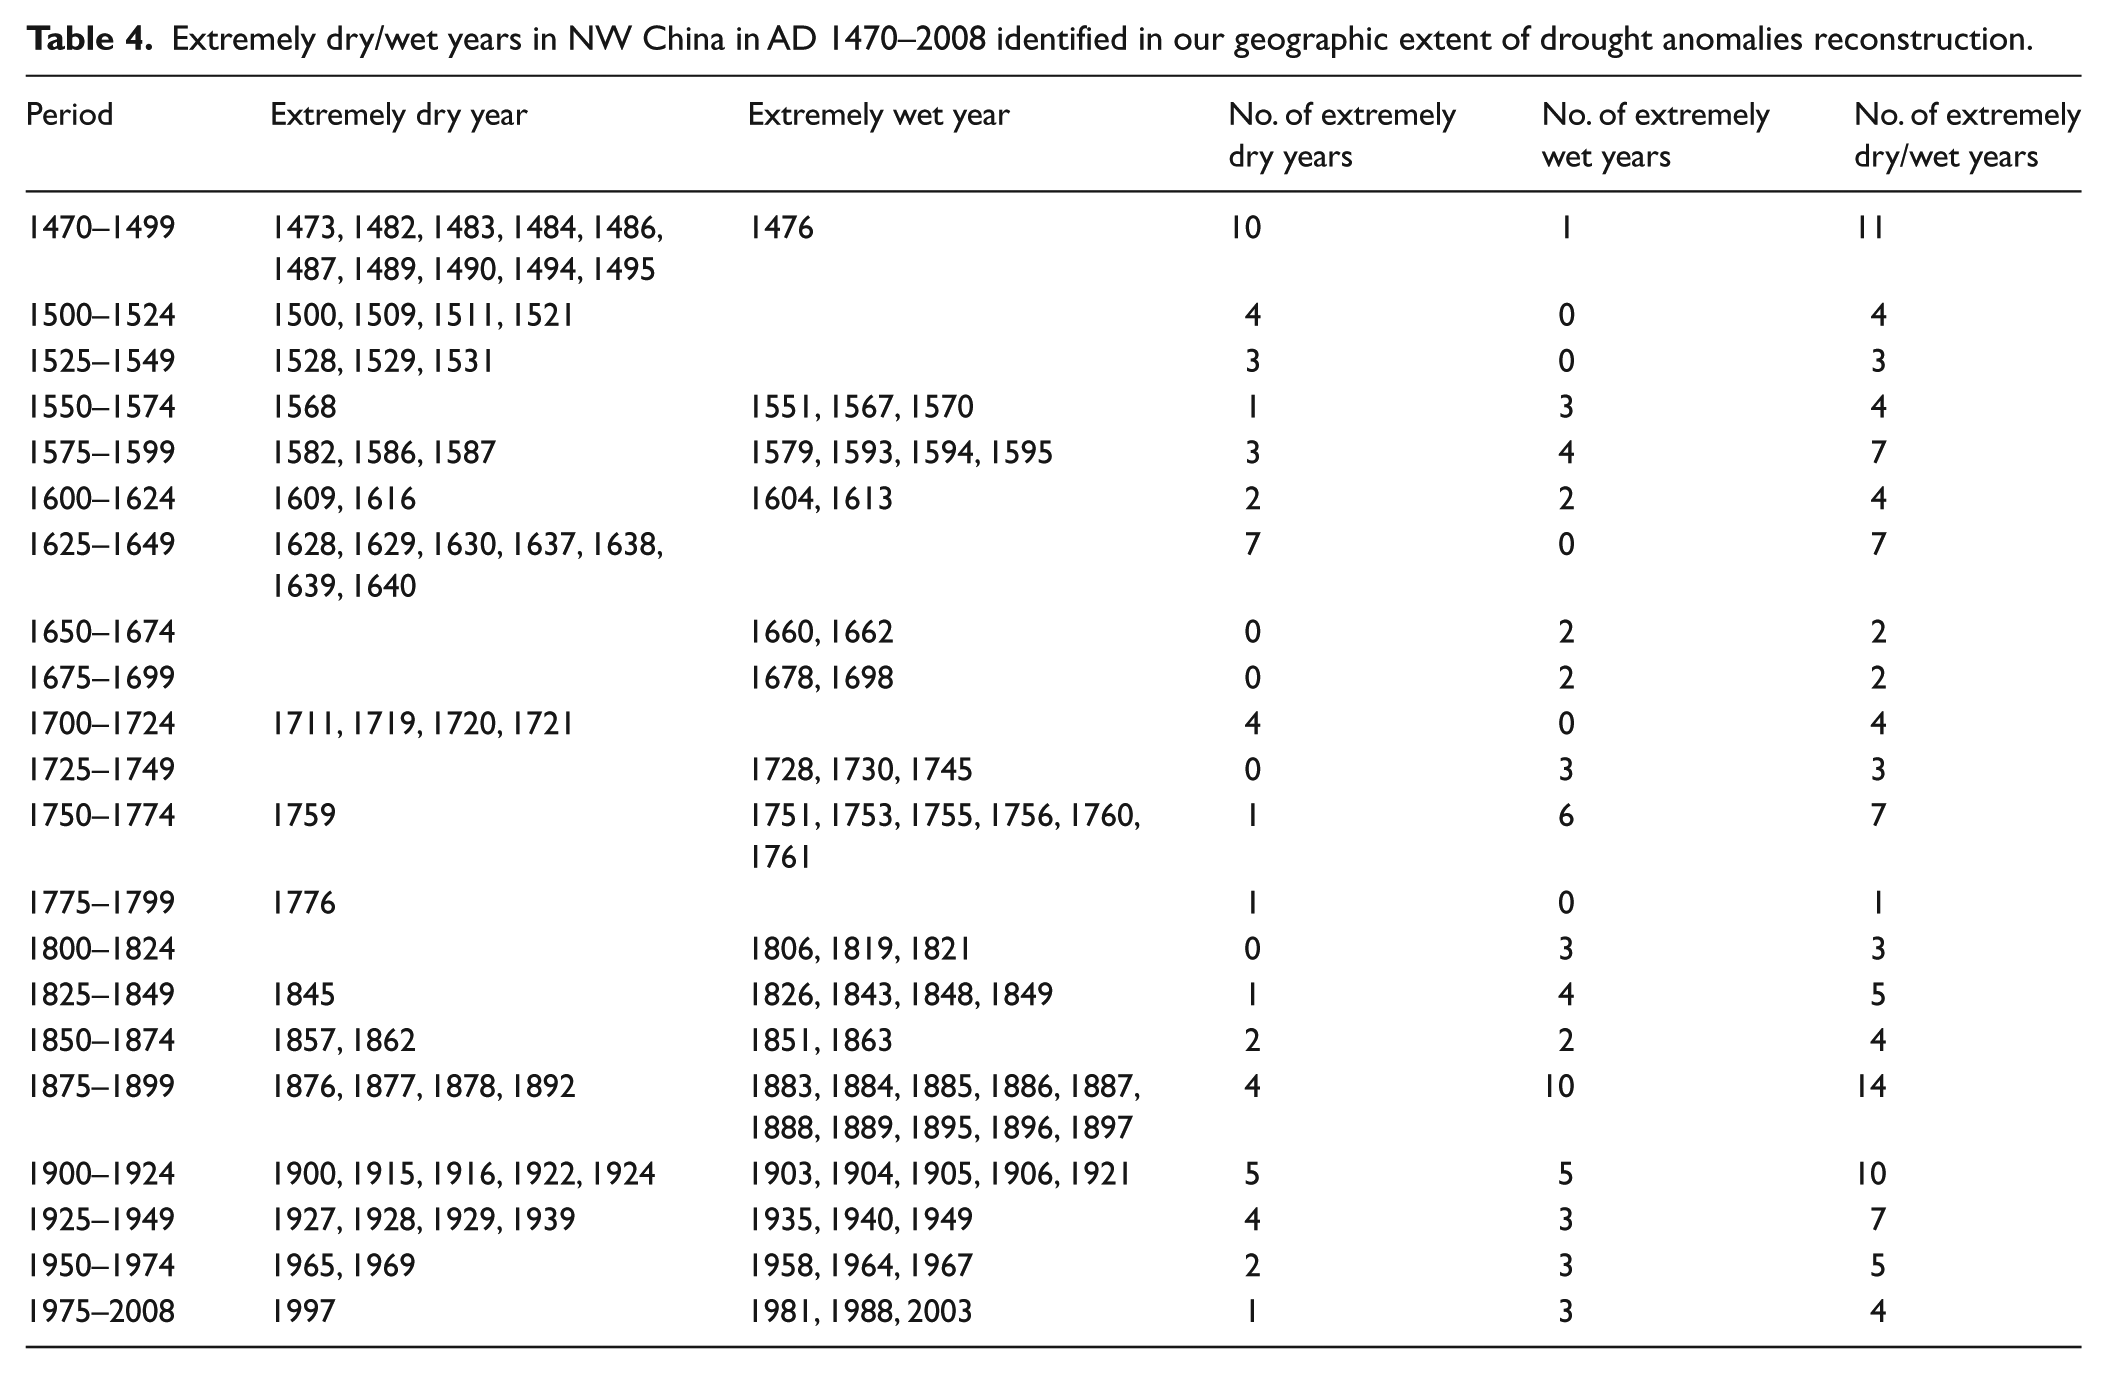
We also calculated the 31-year running variance of our drought anomalies reconstruction, as the variability at this timescale is pertinent for revealing any stochastic relationship between climatic variables (Li et al., 2013). The variance will be large if the data are very spread out around the mean and from each other, and vice versa. Result shows that there are three aberrant peaks of variance (i.e. intense fluctuation of drought anomalies) in the AD 1570s–1640s, 1720s–1760s, and 1880s–1930s (Figure 5a). As shown in Table 4, those periods are characterized by more frequent occurrence of extremely dry and extremely wet years. Those peaks may arise stochastically. Yet, they are coincident with the weakening of ASM as shown in Zhang et al.’s (2008) reconstruction (Figure 5b). As indicated by Yan et al. (1992), the weakening of the East ASM could engender abnormal precipitation variability in North-Central China, resulting in more frequent climatic extremes (both drought and flood) despite the long-term decrease in mean precipitation.
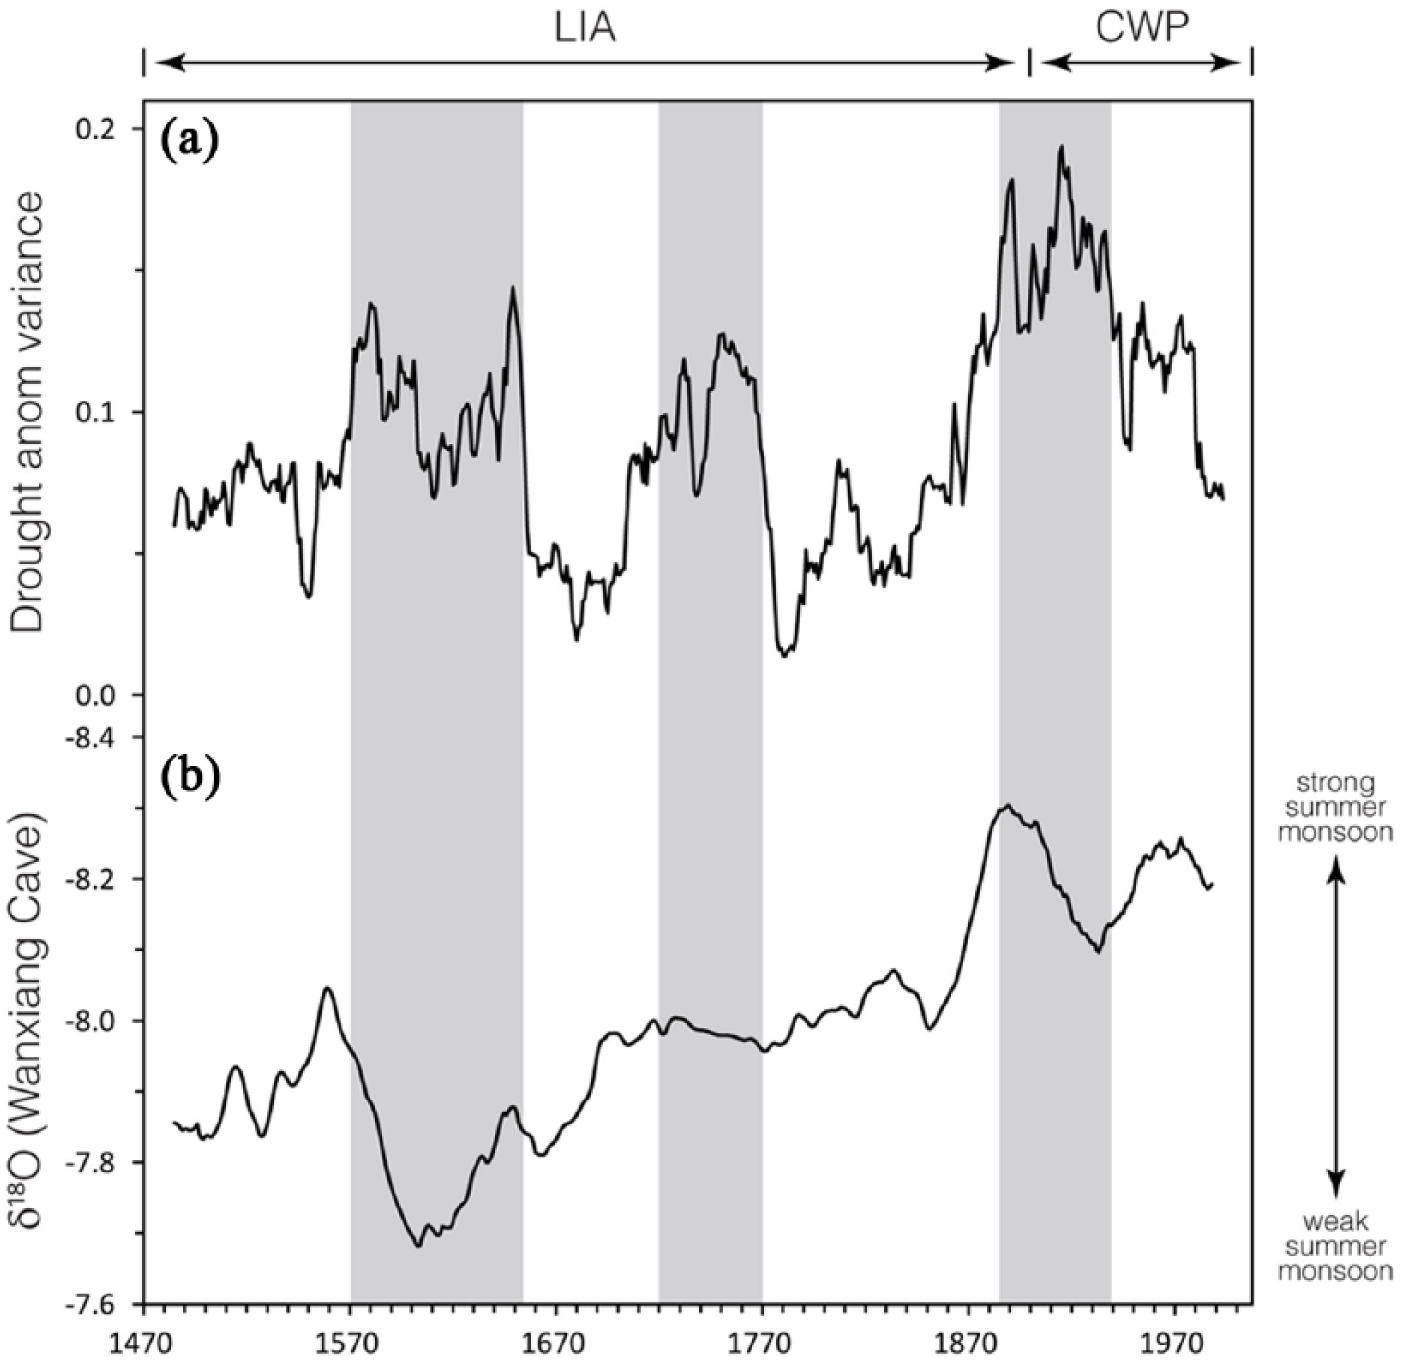
Comparison between the variance for the geographic extent of drought anomalies in NW China and the strength of ASM. (a) 31-year running variance for the geographic extent of drought anomalies in NW China. (b) 31-year moving average of Wanxiang Cave δ18O record (Zhang et al., 2008), which is a proxy negatively correlated with the strength of ASM. Gray vertical shadings denote the coincidence between the intensification of drought anomalies variance and the weakening of ASM.
Our spatial extent of drought anomalies time-series was wavelet transformed to divulge its main periodicities and the evolution in time of each frequency (Torrence and Compo, 1998). In this study, Morlet wavelet was employed because it is the most suitable wavelet to detect variations in the periodicities of geophysical signals along time-series in a continuous manner (Rigozo et al., 2008). The wavelet power spectrum of the drought anomalies time-series reveals that there are significant ~2- to 4-year, ~16- to 32-year, and ~64-year bands (Figure 6). The high-frequency ~2- to 4-year periodicity falls within the 2- to 8-year variability of ENSO (Torrence and Webster, 1999), concurring with previous studies (cf. section ‘Introduction’). The inter-decadal ~16- to 32-year and the long ~64-year periodicities are coincident with the 15- to 25-year and 50- to 70-year variability of the Pacific Decadal Oscillation (PDO) (Minobe, 1999). The periodicities of our time-series show the teleconnection between the Pacific Ocean and the geographic extent of drought anomalies in NW China, which can be supported by previous studies of ENSO and PDO forcings as driving drought variability at the northern fringe of the ASM region (Kang et al., 2012; Yang et al., 2014a). It is interesting that the 11-year periodicity corresponding to sunspots was not significant in the wavelet power spectrum, as in other studies of paleo-precipitation/moisture fluctuation in NW China (e.g. Qian and Lin, 2009; Tan et al., 2011b; Zhang et al., 2011). This indicates that solar forcing may take place with multi-decadal to centennial time constants, which are related to thermal equilibrium of the deeper ocean and thermohaline circulation (Dijkstra and Ghil, 2005; Qian and Lin, 2009).

Wavelet analysis of the geographic extent of drought anomalies in NW China. (a) Wavelet power spectrum. The contour levels are chosen so that 75%, 50%, 25%, and 5% of the wavelet power are above each level, respectively. The cross-hatched region is the cone of influence, where zero padding has reduced the variance. Black contour is the 10% significance level, using a red-noise (autoregressive lag1) background spectrum. (b) Global wavelet power spectrum (black line). The dashed line is the significance for the global wavelet spectrum, assuming the same significance level and background spectrum as in (a).
ENSO and the geographic extent of drought anomalies in NW China
We examined the relationship between ENSO and the geographic extent of drought anomalies in NW China over their common period by using cross wavelet transform (Figure 7a), which exposes their common power and relative phase in time–frequency space (Grinsted et al., 2004). We also detected their correlation in specific time–frequency domain using squared wavelet coherence (Figure 7b), which can find significant coherence even if their common power is low (Grinsted et al., 2004). Our cross wavelet transform (Figure 7a) and squared wavelet coherence (Figure 7b) results show that the oscillations of ENSO are manifested in the drought anomalies on wavelengths varying from 2 to 32 years throughout the full period. Nevertheless, the associated year bands occur intermittently. Besides, the wavelet coherence is shifted from in-phase to anti-phase when the ‘Little Ice Age’ (LIA, c. AD 1400–1900) is transited to the Current Warm Period (CWP, c. AD 1900 onward). Although their co-variability at the inter-annual to multi-decadal timescale could be generally regarded as significant, the intermittence of year bands together with the phase shift of wavelet coherence indicates that the ENSO–drought teleconnection in NW China is non-stationary and probably modulated by other factors. It is observed that a significant ~64- to 128-year band exists since AD 1700. However, as the inter-annual to multi-decadal variability of drought anomalies in NW China is the focus of this study (cf. section ‘Introduction’), that year band will not be further discussed here.

Wavelet analysis of the connection between ENSO (Li et al., 2013) and the geographic extent of drought anomalies in NW China. (a) Cross wavelet transform and (b) squared wavelet coherence between the two time-series over their common period AD 1470–2005. Significant periodicities (p < 0.1) against red noise are outlined in black on the wavelet and the wavelet squared coherency spectra. Their relative phase relationship is indicated by arrows (pointing right (left) for in-phase (anti-phase)). The legend indicates power. The region outside the cone of influence, where edge effects might distort the picture, is shaded.
We proceeded to calculate 31-year moving (Pearson) correlation between the time-series of ENSO and the spatial extent of drought anomalies in NW China. The resulting moving correlation (MC) curve is presented in Figure 8a, which exhibits two main features: (1) recurrent oscillations and (2) secular downward trend in which the MC coefficients are switched from positively significant in the LIA to negatively significant in the CWP. The above features concur with our cross wavelet transform and squared wavelet coherence analysis stated in the previous paragraph, highlighting the non-stationarity of the ENSO–drought association in NW China. This raises a question: What modulates the association?

Modulation of the teleconnection between ENSO and the geographic extent of drought anomalies in NW China. (a) 31-year moving correlations (MC) of the geographic extent of drought anomalies in NW China with Li et al.’s (2013) ENSO reconstruction. The dashed horizontal lines indicate the 0.1 significance level. (b) 31-year running variance of Li et al.’s (2013) ENSO reconstruction. (c) MC curve of (a) (black solid line) and the 31-year moving average of Zhang et al.’s (2008) Wanxiang Cave δ18O record (gray dashed line). Gray vertical shadings denote the coincidence between the weak ENSO variance and the troughs/falls of MC coefficients.
Before answering the above question, some possible mechanisms linking ENSO and the drought anomalies in NW China should be considered. First, the anomalous cyclone over East Asia, which is a part of the large-scale circulation pattern over Asia, provides the teleconnection between El Niño and rainfall anomalies in NW China during the summer and fall of ENSO onset years (Wu et al., 2003). Second, the Indian Monsoon circulation interacts with the regional circulations in northern China in some epochs, and such interaction is interrupted in other epochs. When the interaction is active, the Indian Monsoon variations originating from ENSO are extended to affect the rainfall variation in northern China (Feng and Hu, 2004). Third, when sea surface temperature in the equatorial eastern Pacific becomes warmer during El Niño years, the meridional temperature gradient will become larger, thus implying a stronger Hadley cell. A stronger Hadley circulation will induce a stronger intensity of the western Pacific sub-tropical high, which together with a westward shift of the location of the sub-tropical high can lead to a change of the northern fringe of ASM (Wang and Li, 1990). Briefly, all of the above proposed mechanisms indicate that the hydro-climatic influence of ENSO in NW China is primarily operationalized by some regional circulations/atmospheric anomalies and ASM.
Decadal to inter-decadal ENSO variability may result from internal dynamics that are largely stochastic in nature. Also, the hydro-climatic influence of ENSO on the pan-Pacific regions strengthens when its temporal variability intensifies (i.e. strengthening of ENSO), and vice versa (Li et al., 2013). As revealed by empirical meteorological data, the regional circulations/atmospheric anomalies responsible for their teleconnection are better developed during the epochs of large ENSO variance (Chowdary et al., 2012; Feng and Hu, 2004). Therefore, we hypothesized that the recurrent oscillations of ENSO–drought correlation are driven by ENSO itself. We calculated the 31-year variance of ENSO (Figure 8b) and then overlaid it with our MC curve (Figure 8c). It is seen that all of the periods of weak ENSO variance are coincident with the troughs/falls of MC coefficients. The positive ENSO–drought correlation is dampened when the ENSO variance is small. The above result supports that the climatic impact of ENSO in NW China is governed by the periodic variations of ENSO.
As the climatic influence of ENSO in NW China is, in part, operationalized by ASM, and the variance of our drought anomalies reconstruction is shown to be connected with the strength of ASM (Figure 5), we proposed that the secular downward trend of the MC curve is governed by the strength of ASM. We compared our MC curve with the 31-year running mean of Zhang et al.’s (2008) ASM reconstruction and found a good match between their secular trends (Figure 8c). When ASM was weak, the drought-inducing effect of ENSO in NW China was stronger, and vice versa. To verify this non-linearity, we used non-parametric Nadaraya–Watson estimator (Nadaraya, 1964; Watson, 1964) to further predict the interaction between ENSO and ASM in driving the geographic extent of drought anomalies in NW China. Results show that the mean of the geographic extent of drought anomalies in NW China is conditional on the synthesis of ENSO and ASM (Figure 9). The drought area expands only if ENSO strengthens and ASM weakens in unison.
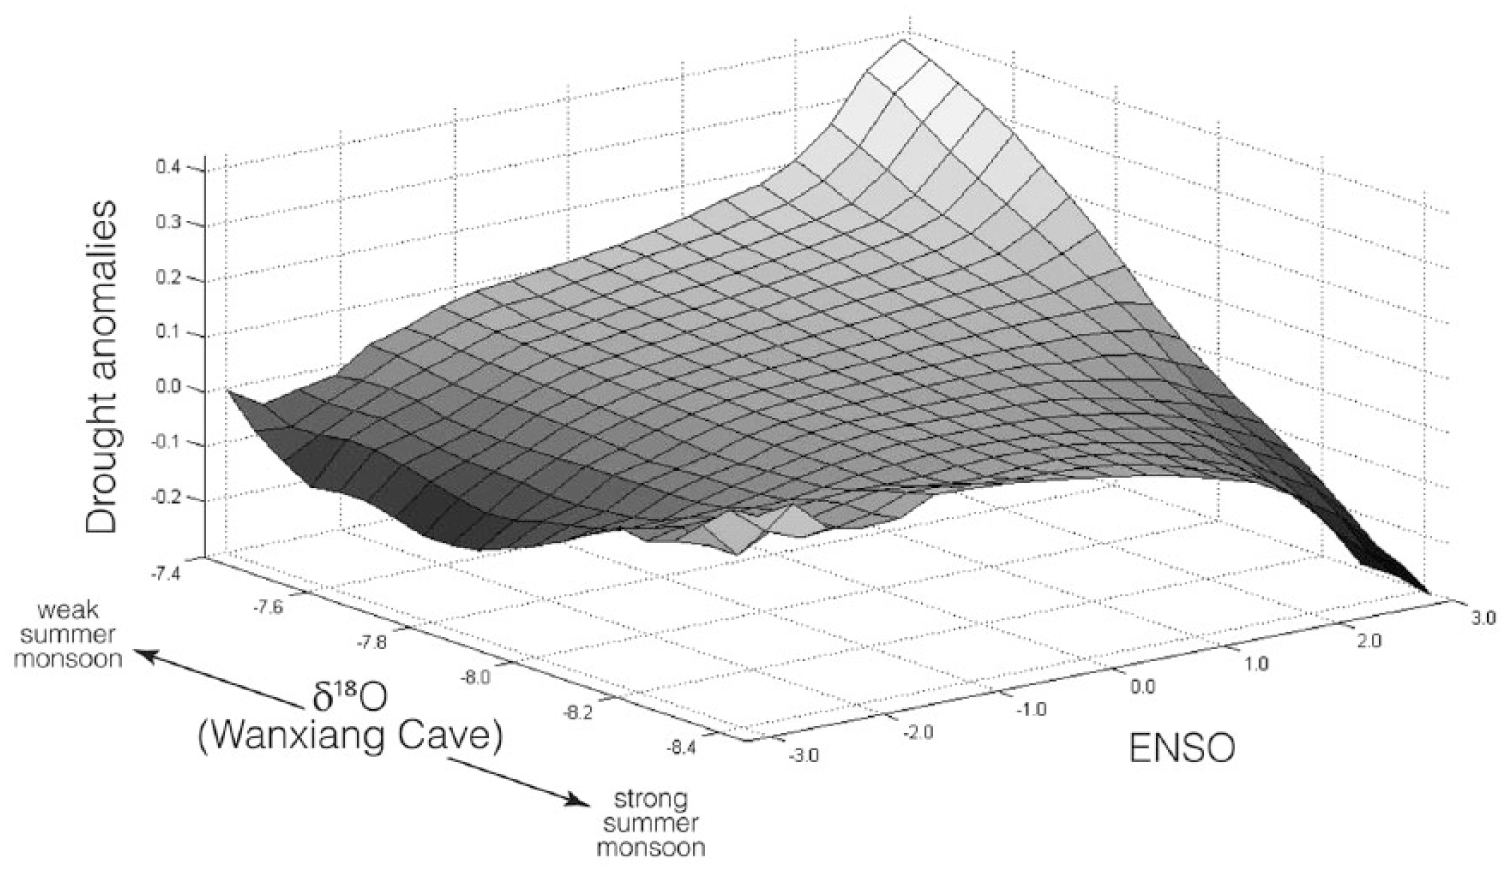
Non-parametric Nadaraya–Watson estimate of the mean of the geographic extent of drought anomalies in NW China conditional on ENSO (Li et al., 2013) and ASM (Zhang et al., 2008), using a normal kernel. The sloping surface of the figure epitomizes the interaction between ENSO and ASM in determining the geographic extent of drought anomalies in NW China.
Over the past few decades, ENSO and summer precipitation in NW China are positively correlated in general (Gao et al., 2006; Su and Wang, 2007). However, the above phenomenon is subject to the background of the warm 20th century, in which the north edge of ASM lies on NW China, dividing the region into two parts. In the LIA, the temperature was much lower than that in the CWP (Mann and Jones, 2003; Moberg et al., 2005). Since oceanic and terrestrial heat capacities are different, the temperature of the land decreased quickly during that time. The Tibetan Plateau is a heat sink, which further magnified such differences between the Asian continent and its surrounding ocean. The ASM was weakened and the Winter Monsoon was strengthened, which led the north fringe of ASM to move south. At the same time, the low temperature also forced the Westerlies and the Pacific Inter-tropical Convergence Zone to migrate southward (Chen et al., 2010; Tan et al., 2008; Yang et al., 2014a). The above mentioned atmospheric configuration in the LIA implies that the geographic pattern of regional circulations/atmospheric anomalies that is responsible for ENSO–drought teleconnection and, consequently, the hydro-climatic influence of ENSO in NW China during the time might be very different from that in the present days. This may explain the match of secular trends between our MC curve and the strength of ASM, and also the shift of wavelet coherence from in-phase to anti-phase (Figure 7) and the switch of MC coefficients from positive to negative (Figure 8) since the late LIA.
Although the effect of ENSO on NW China has been mentioned in some paleo-climatic/paleo-environmental (Fang et al., 2009a, 2009b, 2012; Li et al., 2006, 2007) and meteorological (Huang et al., 2004; Li and Mu, 2000; Su and Wang, 2007; Torrence and Webster, 1999; Wang et al., 2008; Zhou et al., 2007) studies, the focus is mostly confined to its high-frequency (i.e. 2–10 years) influence on precipitation/moisture at individual sites or in relatively short periods (~50 years). Only a few of them (e.g. Chen et al., 2010, 2015) touch on the low-frequency (i.e. multi-decadal) ENSO–drought teleconnection at large-spatial scale over an extended period. Universal consensus about the associated mechanism is still lacking at the moment. Our results show that the effect of ENSO on the geographic extent of drought anomalies in NW China over the past five centuries was non-stationary, which is governed by the variance of ENSO and the strength of ASM. The above findings are in contrast with those in previous studies (Tan et al., 2008, 2011b; Zhang et al., 2011), in which the precipitation reconstructions are directly compared with solar activity, while the discrepancy between the two records is ascribed to ENSO or time-lag. Our results may serve as an alternative explanation about the inter-annual to multi-decadal teleconnection between ENSO and drought in NW China. Yet, on the centennial to multi-centennial timescale, ENSO may be more important in causing regional precipitation disparity rather than widespread homogeneous precipitation change in NW China (Lee et al., 2014). Further investigation is needed to determine whether the ENSO–drought dynamics transcend different timescales.
Conclusion
Paleo-climatic/environmental studies about NW China are often based on proxies at individual sites. However, subject to the unique physical setting of NW China, there are considerable limitations for those studies in providing a comprehensive picture of the precipitation regimes across the entire NW China. We based our study on the dryness/wetness grade series of the 19 sites in NW China, which are primarily derived from historical documents, to reconstruct a fine-grained and high-resolution picture of the geographic extent of drought anomalies in NW China spanning AD 1470–2008. The advantage of our method is the emphasis on incorporating the spatial influence of climate change into the reconstruction. Our reconstruction is also robust, as the moisture regime fluctuations in recent decades recorded in the PDSI dataset and the historical mega droughts spotted in other independent studies can be well traced. The drought periods in NW China were identified as the AD 1470s–1490s, 1620s–1640s, 1700s–1720s, 1770s–1790s, 1860s–1870s, and 1910s–1930s, and AD 1928 and 1929 were the most extremely dry years. Our study also concurs with Yi et al. (2012) that dryness/wetness grade is a valuable climate proxy in quantitative reconstructions. We also systematically investigated the effect of ENSO activity on the geographic extent of drought anomalies in NW China at the inter-annual to multi-decadal timescale. Our results show that their relationship was non-stationary and their correlation switched from positive to negative since the late LIA.
Instrumental climate records show increasing warming during the 20th century in the Northern Hemisphere. The warmth is unprecedented over the past two millennia (Mann and Jones, 2003; Moberg et al., 2005), resulting in a more vigorous hydrological cycle (Su and Wang, 2007). In our analysis, the ENSO–drought teleconnection in NW China is shown to be governed by the variance of ENSO and the strength of ASM. It should be noted that the periodic fluctuations of ENSO variance before AD 1900 may arise stochastically, while those in the warm 20th century may be caused by the change in the background state, such as the secular positive trend in tropical sea surface temperatures (Li et al., 2013). In unison, the dominant forcing of ASM variability has been changed from natural (solar forcing) to anthropogenic (greenhouse gases and aerosols) in recent decades (Ammann et al., 2007; Meehl et al., 2003), and its trend in the late 20th century was distinguished as clearly anomalous (Zhang et al., 2008). Owing to the interplay of the East ASM with the Westerlies at the northern fringe of ASM, regional variations in the aridity threshold triggered by atmospheric circulation changes will be more pronounced in NW China than in other monsoon regions (Lee and Zhang, 2010). This may further complicate the triangulation among ENSO, ASM, and drought anomalies in NW China (Gao et al., 2006). The phase shift of wavelet coherence (Figure 7) together with the positive–negative switch of MC coefficients (Figure 8) may have evidenced the above phenomenon. The fine-grained picture about the geographic extent of drought anomalies and its associated dynamics may provide essential information concerning drought variability in NW China. Undoubtedly, the involved mechanism is complex. We merely focused on the influence of ENSO from the Pacific Ocean on the geographic extent of drought anomalies in the present study. Yet, other forcings, such as PDO, Atlantic Multi-decadal Oscillation, and North Atlantic Oscillation (Chen et al., 2015; Kang et al., 2012; Lee and Zhang, 2010, 2011; Yang et al., 2014a), should not be neglected. To improve projections about the regional water resource uncertainty within the context of global warming, the spatial extent of drought in NW China and its driving mechanisms should be further researched.
Footnotes
Acknowledgements
We thank Dr JB Li for helpful discussions on the hydro-climatic influence of various atmospheric circulations on NW China. Last but not least, a special thanks to Dr Giles Young and two anonymous reviewers for their valuable comments on the manuscript.
Funding
This research was supported by the Hui Oi-Chow Trust Fund (201205172003 and 201302172003), HKU Seed Funding Programme for Basic Research (201109159014), Research Grants Council of The Government of the Hong Kong Special Administrative Region of the People’s Republic of China (HKU758712H and HKU745113H), and the CAS/SAFEA International Partnership Program for Creative Research Teams.