
Abstract
This paper provides another look at the response of the Asian summer monsoon (ASM) to insolation forcing and oceanic feedback during the Holocene, using a fully coupled general circulation ocean–atmosphere model forced by Earth’s orbital variations. The model results revealed a recurrent circumglobal teleconnection (CGT) pattern in the summertime (June–July–August) mid-latitude circulation of the Northern Hemisphere during the Holocene. The CGT index showed a decreasing trend before ~5 ka BP and a slight increasing trend afterwards, affected by the combined effects of summer insolation, Indian summer monsoon (ISM), North Atlantic and Indian Ocean–western Pacific Ocean sea surface temperature (SST). The CGT showed a close relationship with ASM precipitation and surface air temperature during the Holocene and, therefore, could act as a bridge linking the ASM to insolation, high-latitude forcing (North Atlantic SST), and low-latitude forcing (tropical Ocean SST). We emphasize that the mid-latitude atmospheric circulation has been a key factor for the evolution of the ASM during the Holocene. In addition, the CGT provides a viable explanation for the out-of-phase relationship in the moisture evolution but an in-phase relationship in the speleothem δ18O between arid central Asia and the ISM region during the Holocene.
Introduction
The Asian summer monsoon (ASM), including the Indian summer monsoon (ISM) and East Asian summer monsoon (EASM), is a major component of the Earth’s climate system. Paleoclimatic proxy records (e.g. Wang, 2009; Wang et al., 2005) and simulations (e.g. Braconnot et al., 2007; Jin et al., 2014) suggest that Holocene evolution of the ASM is governed by boreal summer insolation via its influence on the sea–land thermal contrast due to different heat capacities between the ocean and land (Kutzbach and Otto-Bliesner, 1982). In addition, abrupt changes of the ASM are tightly linked to North Atlantic cold events during the Holocene (Gupta et al., 2003; Wang et al., 2005; Xu et al., 2015). Tropical Ocean sea surface temperature (SST) is also suggested to play an important role in the evolution of the ASM (Jin et al., 2014; Prasad et al., 2014; Xu et al., 2015).
In recent years, teleconnections associated with the ASM have attracted growing interest in the research community, both in terms of present-day and future climates (Ding and Wang, 2005, 2007; Huang et al., 2011; Lee et al., 2011). Ding and Wang (2005) revealed a recurrent circumglobal teleconnection (CGT) pattern in the summertime mid-latitude circulation of the Northern Hemisphere based on an analysis of National Centres for Environmental Prediction (NCEP)–National Centre for Atmospheric Research (NCAR) reanalysis data for a 56-year period. The CGT pattern, which features a zonal wavenumber 5 structure, has a significant relationship with ASM rainfall and surface air temperature (Ding and Wang, 2005). North Atlantic Ocean (Ding and Wang, 2005) and tropical heating (Chen and Huang, 2012; Ding and Wang, 2005; Yang et al., 2009) are two important factors exciting the CGT pattern.
The CGT and its association with the ASM have seldom been explored over longer time scales, such as the Holocene epoch – during which the climate has mainly been controlled by insolation. In this study, we explore the behaviour of the CGT pattern over the past 9500 years in response to insolation forcing and oceanic feedback and its association with the ASM in a transient simulation forced by Earth’s orbital variations.
Methods
Model description
The model used in this study was the Kiel Climate Model (KCM; Park et al., 2009), a coupled atmosphere–ocean general circulation model. The model comprises the spectral atmospheric model ECHAM5 (Roeckner et al., 2003) and the Nucleus for European Modelling of the Ocean (NEMO; Madec, 2008) ocean–sea-ice general circulation model, coupled through OASIS3 (Valcke, 2006). The horizontal resolution of the atmospheric model ECHAM5 is T31 (3.75° × 3.75°), and in the vertical direction, there are 19 levels up to 10 hPa. The horizontal resolution of the ocean model NEMO is on average 1.3°, based on 2° Mercator meshes with grid refinement in the tropical regions, where the meridional grid-point separation reaches 0.5°. The KCM has been used for studies of internal climate variability (Park and Latif, 2008, 2010), external forced variability (Latif et al., 2009) and Holocene ASM precipitation changes (Jin et al., 2014). A detailed description of the KCM can be found in Park et al. (2009), including further information on the performance of the model.
Numerical experiments
Before the Holocene transient (HT) experiment was performed, two millennial integrations with the KCM were run an early Holocene integration (9500 years before present (BP), H9K) and a pre-industrial integration (AD 1800, H0K), to bring into equilibrium. Both the H9K and H0K experiments were initialized with Levitus (1982) climatology data. Greenhouse gas (GHG) concentrations in the atmosphere were prescribed to pre-industrial levels. The orbital parameters were set to the values of 9.5 and 0 ka BP, respectively.
After two control simulation experiments, the HT simulation, forced by Earth’s orbital parameters for the period from 9.5 to 0 ka BP, was performed. The HT simulation was initiated from the last year of the H9K equilibrium experiment. Earth’s orbital parameters (eccentricity, obliquity and precession; Berger and Loutre, 1991) varied during this period, and a 10-fold acceleration scheme (Lorenz and Lohmann, 2004) in the HT simulation was employed to save on calculation resources. As such, the climate trends and feedbacks of the last 9500 years (9.5–0 ka BP), imposed by the external orbitally driven insolation changes, were represented in the experiment by 950 model years in 10-year intervals. The orbital acceleration effect for a factor of 10 can be neglected in the model when considering interannual time scale changes of atmospheric and oceanic systems (such as the seasonal variability of paleo-El Niño–Southern Oscillation (ENSO)), since the variations in orbital parameters during the Holocene period have been very slow. GHGs were kept the same as in the aforementioned two time-slice simulations over the entire period of the transient Holocene simulation (from 9.5 to 0 ka BP). The boundary conditions for the three simulations are summarized in Table 1.
Boundary conditions.
In addition, daily precipitation data recorded at Wulumuqi weather station (43.47°N, 87.39°E) from 1960 to 2012 (provided by the China Meteorological Data Sharing Service System, available online at http://cdc.nmic.cn/home.do); oxygen-18 content of precipitation samples (δ18O) taken at Wulumuqi weather station from 1986 to 2003 (provided by the Global Network of Isotopes in Precipitation (GNIP), available online at http://www.iaea.org/water); and NCEP-NCAR daily reanalysis data for 1960–2012 (Kalnay et al., 1996) were used in this study to validate the simulation results.
CGT pattern and possible driving factors
First, we examined whether a CGT pattern exists during the Holocene, following Ding and Wang (2005). We selected summertime (June–July–August, JJA) 200 hPa geopotential height averaged over the region (35°–40°N, 60°–70°E) as the base point (Figure 1a). Figure 1b shows a one-point correlation map between the base point and JJA 200 hPa geopotential height during the Holocene. The belt-shaped CGT pattern around 40°N is clear, with six well-defined centres located over Western Europe, European Russia, West-central Asia, East Asia, the North Pacific, and North America, as represented by ‘+’ and ‘−’ signs. The centre over the North Pacific during the Holocene is more southerly compared with that at present, based on NCEP-NCAR reanalysis data (Ding and Wang, 2005). The CGT pattern was more obvious after the removal of the millennial-scale trend (insolation forcing; Figure 1c). To further confirm the CGT pattern, empirical orthogonal function (EOF) analysis was performed on JJA 200 hPa geopotential height (detrended) north of 20°N from the KCM HT simulation. The second EOF mode resembles the characteristic CGT pattern (Figure 2a), which is similar with the results revealed by Ding and Wang (2005) and Ding et al. (2011). Furthermore, the associated PC2 is significantly correlated with the detrended time series of the base-point geopotential height (R = 0.6, p < 0.01; Figure 2b). Therefore, the CGT pattern still existed during the Holocene despite Earth’s orbital variations have changed significantly throughout this epoch. The geopotential height over the base point (Figure 1a, black line) was taken as the CGT index (CGTI), which we use in the following analysis.
(a) Summer (JJA) mean 200 hPa geopotential height anomaly (black line) averaged over the area (35°–40°N, 60°–70°E) from 9.5 to 0 ka BP with a temporal resolution of 10 years. June insolation at 37.5°N (red line; Berger and Loutre, 1991) is plotted for comparison. (b) One-point correlation map between the base point (black line in (a)) and JJA 200 hPa geopotential height for the Holocene. (c) As in (b) but with the removal of the millennial-scale trend. Only significant correlation coefficients exceeding the 99% confidence level are plotted. Plus and minus signs indicate divergence and convergence, respectively.
Empirical orthogonal function (EOF) analysis for JJA 200 hPa geopotential height (detrended) from the KCM HT simulation: (a) the second mode explained 19% of total variance and (b) the associated principal component (PC2, red line) and its comparison with the detrended time series of the base-point geopotential height (detrended, black line).
Generally, the phase of the CGT followed boreal summer insolation (Figure 1a, red line), shifting from positive to negative throughout the Holocene. This is due to that the decreasing insolation lowered the surface air temperature (Figure 3a, blue line), leading to an increase in the sea-level pressure (SLP; Figure 3a, black line, multiplied by −1) and, accordingly, a decrease in the geopotential height in the upper atmosphere (Figure 3b, black line). Therefore, the CGTI followed boreal summer insolation.
(a) Comparison of JJA mean sea-level pressure (multiplied by −1, black line) and surface air temperature (blue line) averaged over the area (35°–40°N, 60°–70°E) covering the time span 9.5–0 ka BP with a temporal resolution of 10 years. June insolation (red line) at 37.5°N is plotted for comparison. (b) Comparison of JJA mean sea-level pressure (multiplied by −1, red line) and 200 hPa geopotential height (CGTI, black line) averaged over the area (35°–40°N, 60°–70°E) from 9.5 to 0 ka BP with a temporal resolution of 10 years.
In addition to insolation forcing, the CGT was likely modulated by other factors, as the CGTI experienced a slight increasing trend (Figure 1a) and showed the same trend as SLP (Figure 3b, SLP multiplied by −1) after ~5 ka BP. In the present-day climate system, when the effect of insolation forcing can be neglected, the diabatic heating of ISM precipitation triggers and maintains the CGT pattern (Ding and Wang, 2005). The ISM heating induces upper level divergence to its north-west over West-central Asia, which in turn excites the CGT pattern (Ding and Wang, 2005; Enomoto et al., 2003; Yang et al., 2009). During the Holocene, the CGTI correlates closely to ISM precipitation (All Indian Summer Rainfall Index; Shukla and Mooley, 1987; Shukla and Paolino, 1983), even when the millennial-scale trend (insolation forcing) is removed (R = 0.4, p < 0.01; Figure 4a and b). The ISM heating generates divergence in the upper atmosphere over West-central Asia, which then excites successive downstream cells along the westerly waveguide, forming the CGT (Figure 5a). This mechanism agrees with that in the present-day climate system.
Comparison of the CGTI (black line) and (a) ISM precipitation (red line), (c) TIO SST (red line), (e) IWP SST (red line) and (g) AMO (red line) without the removal of the millennial-scale trend covering the time span 9.5–0 ka BP with a temporal resolution of 10 years. The millennial-scale trend is removed in the right-hand panels (b, d, f and h). Both the CGTI and AMO are smoothed with a 7-point filter in their comparison (g and h).
Regression maps of JJA geopotential height (unit: gpm) at 200 hPa with reference to (a) ISM precipitation, (b) TIO SST, (c) IWP SST and (d) AMO. Dark (light) shading indicates areas where correlations are positively (negatively) significant at the 99% confidence level. When regressing the geopotential height on the AMO, both the time series were smoothed with a 7-point filter, and the 99% confidence level was estimated by Monte Carlo experiments (Di Lorenzo et al., 2010; Livezey and Chen, 1983).
The ISM rainfall responsible for the CGT pattern also relates to the SST anomalies over the tropical Indian Ocean (TIO), especially over the North Indian Ocean. Yang et al. (2009) suggested that the Indian Ocean Basin mode, a basin-wide warming or cooling that takes place over the TIO (Yang et al., 2007), can induce a significant CGT pattern in the Northern Hemisphere summer mid-latitude atmosphere via influencing the ISM. Chen and Huang (2012) further focused on the tropical heating anomalies in the North Indian Ocean, in which SST anomalies are mostly responsible for the CGT pattern. Our simulation results, however, revealed that the relationship between the CGT and TIO SST (mean SST averaged the area (10°S–20°N, 40°–100°E)) is very weak under conditions of Holocene insolation forcing (R = 0.12, p < 0.01; Figure 4c). But their relationship becomes closer when insolation forcing is removed (R = 0.28, p < 0.01; Figure 4d). However, TIO SST did not generate a significant CGT pattern during the Holocene, as shown in Figure 5b. The positive relationship between the CGT and TIO SST was probably due to a strengthening of the action centre of the CGT over West-central Asia (Figure 5b). The TIO warming was also able to increase the upper-level pressure to its north-west over West-central Asia (Figure 5b) as a response to Gill-type Rossby waves (Gill, 1980), which, therefore, enhanced the CGT pattern.
Unlike in the present-day climate system, in which TIO SST induces a significant CGT pattern, our simulation results showed a much closer relationship between the CGTI and Indian Ocean–western Pacific Ocean (IWP) SST (mean SST averaged over the area (10°S–20°N, 80°–150°E)) during the Holocene (Figure 4e and f). Furthermore, their close relationship was independent from insolation forcing, as demonstrated by the fact that the correlation coefficient after the removal of the millennial-scale trend (R = 0.44, p < 0.01) was larger than that before (R = 0.31, p < 0.01). The role of IWP SST in the CGT is probably via maintaining the action centre over East Asia, as shown in Figure 5c. The IWP warming can induce a westward extension of the western Pacific subtropical high (WPSH), which is accompanied by an enhanced WPSH intensity (Zhou et al., 2009). Due to the barotropic structure, the action centre of the CGT over East Asia is also strengthened, and therefore, a strong phase of the CGT occurs. IWP SST also experienced an increasing trend after ~5 ka BP, as did the CGTI (Figure 4e), which was able to offset the insolation forcing and lead to a slight increasing trend in the CGTI at that time.
Apart from tropical heating, Ding and Wang (2005) also suggested that the action centre over Western Europe is a key area for emitting an arch-shaped wave train that propagates from Europe to West-central Asia via Eastern Europe and, therefore, speculated that the North Atlantic Ocean is an important source generating the CGT pattern. Figure 4g and h shows a close relationship between the CGTI and the Atlantic Multidecadal Oscillation (AMO; mean SST averaged over the area (0°–60°N, 80°W–0°E) with (R = 0.35, p < 0.01) and without (R = 0.57, p < 0.01) the removal of the millennial-scale trend, respectively. The AMO is the leading pattern in low-frequency SST variation for the North Atlantic, featuring a basin-wide warming or cooling over the North Atlantic with a 65- to 80-year periodicity (Enfield et al., 2001; Schlesinger and Ramankutty, 1994). Therefore, time series were constructed with a 7-point filter (our simulation was accelerated by 10 times) for analysis. Figure 5d further reveals the role of the AMO in exciting the CGT pattern, in that the warm North Atlantic Ocean generated anomalous positive pressure in the upper atmosphere over the north-eastern Atlantic and Western Europe. The atmospheric circulation in the upper atmosphere over the north-eastern Atlantic and Western Europe can be affected by the low-level atmospheric circulation. As shown in Figure 6, the CGT pattern was closely related with the first principal component (PC1) of the geopotential height at 850 hPa over (30°–80°N, 30°W–30°E; R = 0.52, p < 0.01). The leading EOF pattern of the geopotential height over this area featured an anticyclone over the north-eastern Atlantic and Western Europe (Figure 6a, contours), which could be strengthened by the AMO (Figure 6a, colour scale). This low-level anticyclone is located just over the positive action centre of the summer North Atlantic Oscillation (Folland et al., 2009), which can strengthen the high-level divergence due to the barotropic structure, ultimately resulting in an enhanced CGT. The enhancing AMO also likely contributed to the increasing trend in CGTI after ~5 ka BP (Figure 4g).
Empirical orthogonal function (EOF) analysis for JJA geopotential height at 850 hPa (7-point filtered and detrended) over the North Atlantic (30°–80°N, 30°W–30°E). (a) The leading EOF pattern (contours, accounting for 57.5% of the total variance) and its comparison with the regression pattern of JJA geopotential height at 850 hPa (7-point filtered and detrended) on the AMO (7-point filtered and detrended; colour scale). Dotted areas indicate correlations significant at the 99% confidence level, as estimated by Monte Carlo experiments (Di Lorenzo et al., 2010; Livezey and Chen, 1983). (b) The first principal component (PC1) and its comparison with the CGTI (7-point filtered and detrended) from 9.5 to 0 ka BP with a temporal resolution of 10 years.
The CGT associated with ASM rainfall and surface air temperature
Rainfall
The ASM is closely related to the CGT pattern (Ding and Wang, 2005). As shown in Figure 7a, the CGT showed a significant correlation with ASM precipitation forced by Earth’s orbital variations – especially the ISM precipitation, with a strong positive correlation. Positive precipitation anomalies were also found over the EASM region – except the South China Sea and east of the Qinghai–Tibet Plateau, where there were negative anomalies. After the removal of the millennial-scale trend (insolation forcing), the relationship between the CGTI and ISM precipitation weakened (Figure 7b). Over the EASM region, the area with negative anomalies became extended, covering the South China Sea, East China Sea, southern China, south-west China and Mongolia (Figures 7b and 8a). However, the positive relationship was enhanced over eastern China and the Korean Peninsula, compared with that before the removal of insolation forcing. Therefore, the response of the EASM to insolation forcing and the CGT was different from that of the ISM. Indeed, as Dallmeyer et al. (2015) pointed out, the ISM system is more sensitive to insolation forcing compared with the EASM system.
Correlation maps between JJA precipitation and CGTI (a) without and (b) with the removal of the millennial-scale trend. (c and d) As in (a and b) but for JJA surface air temperature. Only significant correlation coefficients exceeding the 99% confidence level are plotted.
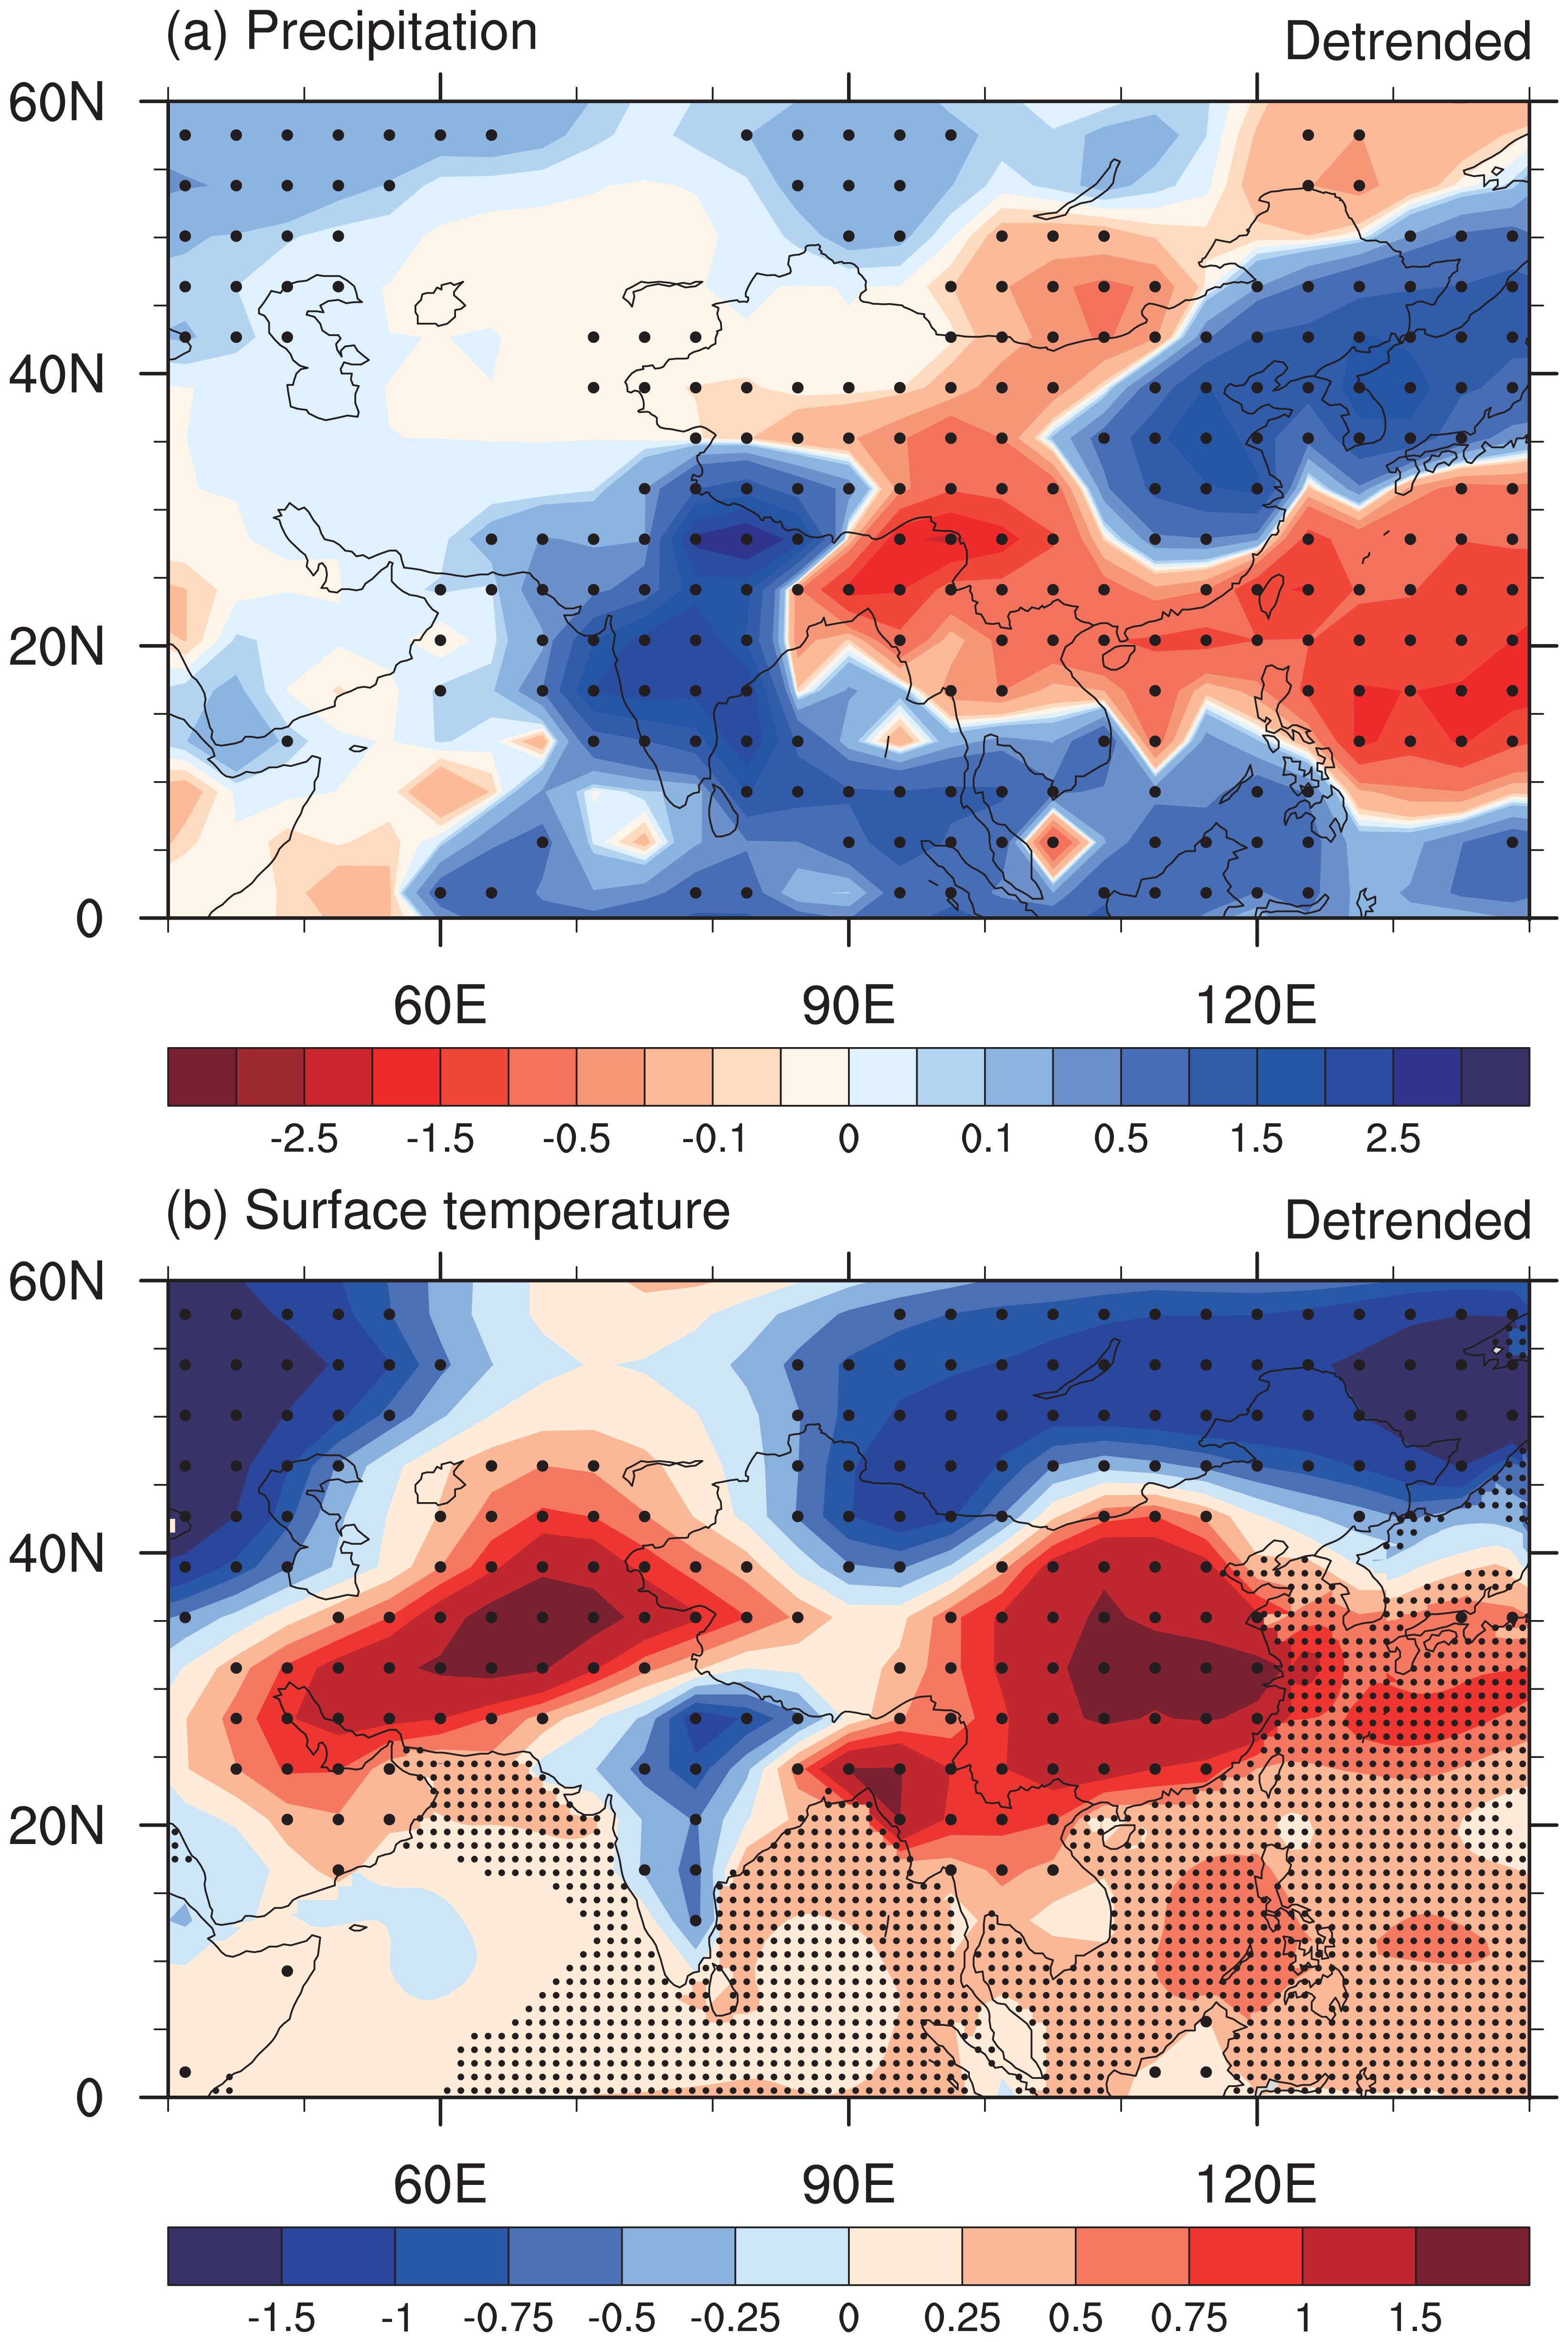
Composite difference of (a) JJA precipitation (detrended) and (b) surface air temperature over land and SST over the ocean (detrended) between positive (top 10%) and negative (bottom 10%) CGTI (detrended) years. Dotted areas indicate changes that are significant at the 99% confidence level.
The different response patterns of precipitation anomalies to insolation forcing and the CGT pattern mirror the complexity of the ASM system. The physical mechanisms of the precipitation related to insolation forcing and the CGT pattern may also show obvious differences. The evolution of the ISM, a tropical monsoon system, relates directly to the migration of the Intertropical Convergence Zone in response to solar insolation (Fleitmann et al., 2007). Insolation can also control the CGT via inducing tropical heating, as mentioned above. An anomalous high over West-central Asia (Figure 1b and c), associated with a positive phase of the CGT, generates northerly anomalies over North India (east of the anomalous high) and easterly anomalies over south-west Asia (south of the anomalous high) in the upper atmosphere, which in turn enhance the vertical meridional wind shear (Goswami et al., 1999) and the vertical zonal wind shear (Ding and Wang, 2005; Webster and Yang, 1992), respectively. The increased meridional and zonal wind shears ultimately reinforce the ISM and associated precipitation (Goswami et al., 1999; Webster and Yang, 1992). Therefore, insolation forcing can control the ISM via influencing the CGT.
Over subtropical East Asia, the WPSH and associated southerly monsoon winds over East Asia are crucial to the formation of the EASM (Figure 9a). Variations in summer insolation can alter the land–sea thermal contrast between Eurasia and the North Pacific Ocean, which in turn influence the southerly monsoon winds. Southerly monsoon winds transport moisture from the Indian Ocean and eastern Pacific Ocean to northern China, which generates heavy rainfall there when interacting with synoptic weather systems moving down from the middle and high latitudes through mid-latitude westerlies (Liu et al., 2014). Hence, the EASM is less sensitive to insolation forcing than the ISM system, as enhanced southerly monsoon winds related to insolation forcing do not necessarily increase EASM precipitation. These also raise the importance of the effect of mid-latitude atmospheric circulation, especially the CGT pattern, on the EASM, in the closer relationship between the CGT pattern and EASM precipitation after the removal of insolation forcing, compared with that before (Figure 7a and b). The CGT induced an anomalously strong WPSH via the enhancement of the action centre over East Asia during the positive phase, as compared with the negative phase, which enhanced the southerly monsoon winds (Figure 9b). The positive phase of the CGT was also associated with warm SST anomalies in the IWP (Figure 8b), leading to intensified local evaporation. The enhanced southerly monsoon winds transported sufficiently warm water vapour from the IWP to eastern China and the Korean Peninsula (Figure 9b). The water vapour, transported by the westerly winds, was also increased during the positive phase of the CGT (Figure 9b). In addition, an anomalous cyclone related to the positive CGTI transported moisture from the north-eastern Pacific Ocean to East Asia (Figure 9b). These three moisture flows converged over northern China and the Korean Peninsula, leading to positive precipitation anomalies (Figure 8a). The anomalously strong WPSH also produced descending motion over southern China, south-west China and the western Pacific, causing negative precipitation anomalies in these regions (Figure 8a). Therefore, the CGT pattern can cause an obvious ‘north–south’ dipole pattern in EASM precipitation anomalies after the removal of insolation forcing. This dipole pattern also prevails on interannual to interdecadal time scales in observations for the past 50 years (Ding et al., 2008, 2009), which is attributed to ENSO (Shi et al., 2012). The influence of ENSO on this dipole pattern probably takes place via the ISM, as the ISM excites the CGT and, therefore, affects EASM precipitation (Ding and Wang, 2005).
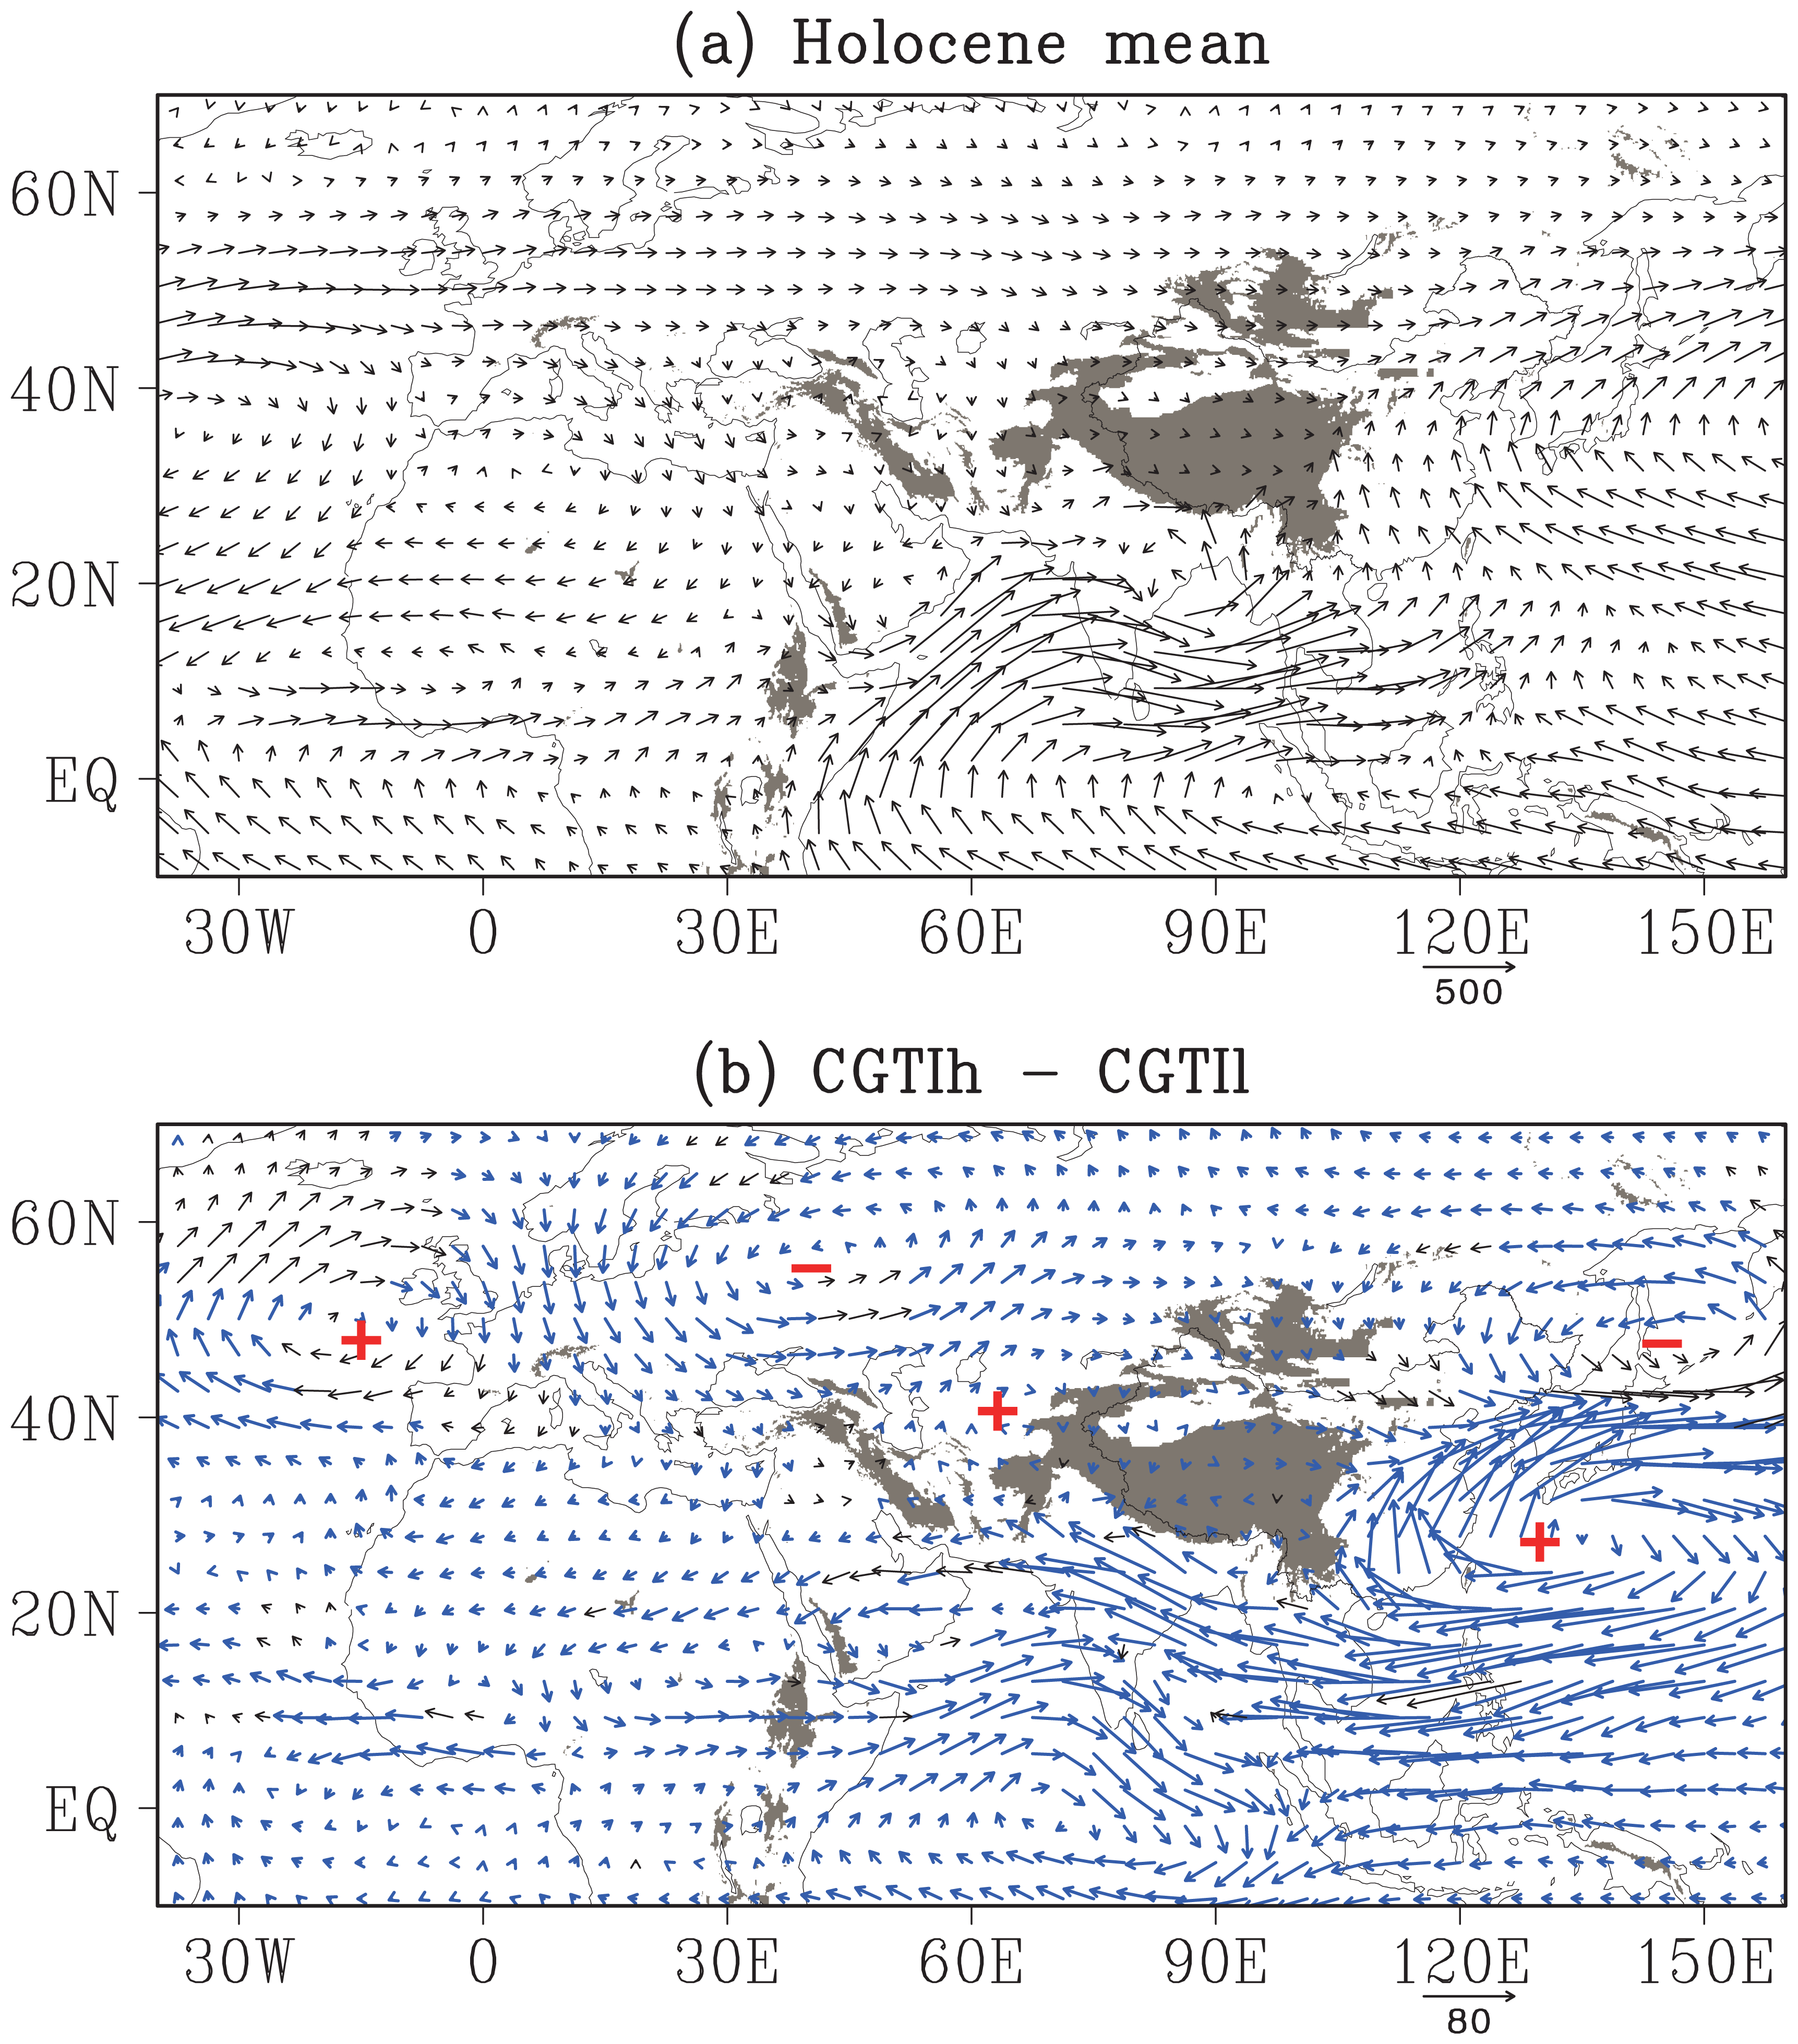
(a) Climatological water vapour transportation (1000–200 hPa) in summer during the Holocene (arrows, kg m−1 s−1). (b) Composite difference of water vapour transportation (1000–200 hPa, detrended) between positive (top 10%) and negative (bottom 10%) CGTI (detrended) years. Blue vectors indicate changes that are significant at the 95% confidence level. Areas above 1500 m (above sea level) are shaded in grey. The pressure levels below the surface pressure as a result of topography were omitted when computing the water vapour fluxes. Plus and minus signs indicate divergence and convergence, respectively.
In addition, precipitation anomalies related to the CGT in arid central Asia were opposite to those over most areas of the ASM region (Figures 7a, 7b and 8a). Chen and Huang (2012) revealed that the leading mode of summer rainfall variations in north-west China is influenced by the CGT. Therefore, the CGT has probably played an important role in the out-of-phase relationship between the moisture evolution in arid central Asia and the ASM region during the Holocene, as documented by proxy records (Chen et al., 2008; Hong et al., 2014; Leroy et al., 2014; Long et al., 2014; Wang and Feng, 2013).
Surface air temperature
Surface air temperature anomalies related to the CGT showed differences between the ISM and EASM, with positive anomalies over the EASM region and negative anomalies over the ISM region for both cases (with and without detrending; Figures 7c, 7d and 8b). Surface air temperature anomalies at middle latitudes resembled the CGT pattern. Before the removal of the long-term trend, the negative pressure anomalies of the CGT pattern were not obvious (Figure 1b), and accordingly, the surface temperature showed positive anomalies (Figure 7c). After the removal of the long-term trend, the negative pressure anomalies of the CGT pattern were very clear over European Russia, north-western China, Siberia, Mongolia and North-east Asia (Figure 1c). Accordingly, the temperature switched to negative anomalies over these regions (Figures 7d and 8b).
A possible influence on speleothem oxygen-isotope values
High-resolution and precisely dated speleothem oxygen isotope (δ18O) records from Asia have provided key evidence for past monsoonal changes (Fleitmann et al., 2003, 2007; Sinha et al., 2005, 2007, 2011; Wang et al., 2005). Cheng et al. (2012) found that δ18O records of stalagmites from Kesang Cave in arid central Asia were very similar to those from Qunf Cave in South Asia, shifting from light to heavy throughout the Holocene (Figure 10). Therefore, Cheng et al. (2012) suggested that strong ASM could intrude into the Kesang site and/or adjacent areas in arid central Asia to produce heavy rainfall during the high insolation times (e.g. the early Holocene). However, this is in contrast to conclusions based on other proxy records that the ASM cannot bring rainfall to arid central Asia (Chen et al., 2008; Hong et al., 2014; Leroy et al., 2014; Long et al., 2014; Wang and Feng, 2013). Given that the CGT pattern is closely associated with rainfall in both the ASM region and arid central Asia (Figures 7a, 7b and 8a), exploring the linkage between the CGT pattern and speleothem δ18O changes may provide insight into this controversy. Shifts in δ18O values of Qunf Cave in South Asia are mainly controlled by the amount of precipitation (Fleitmann et al., 2003; Wei and Gasse, 1999), which is influenced by the CGT pattern. But can the CGT pattern affect precipitation δ18O values in arid central Asia?
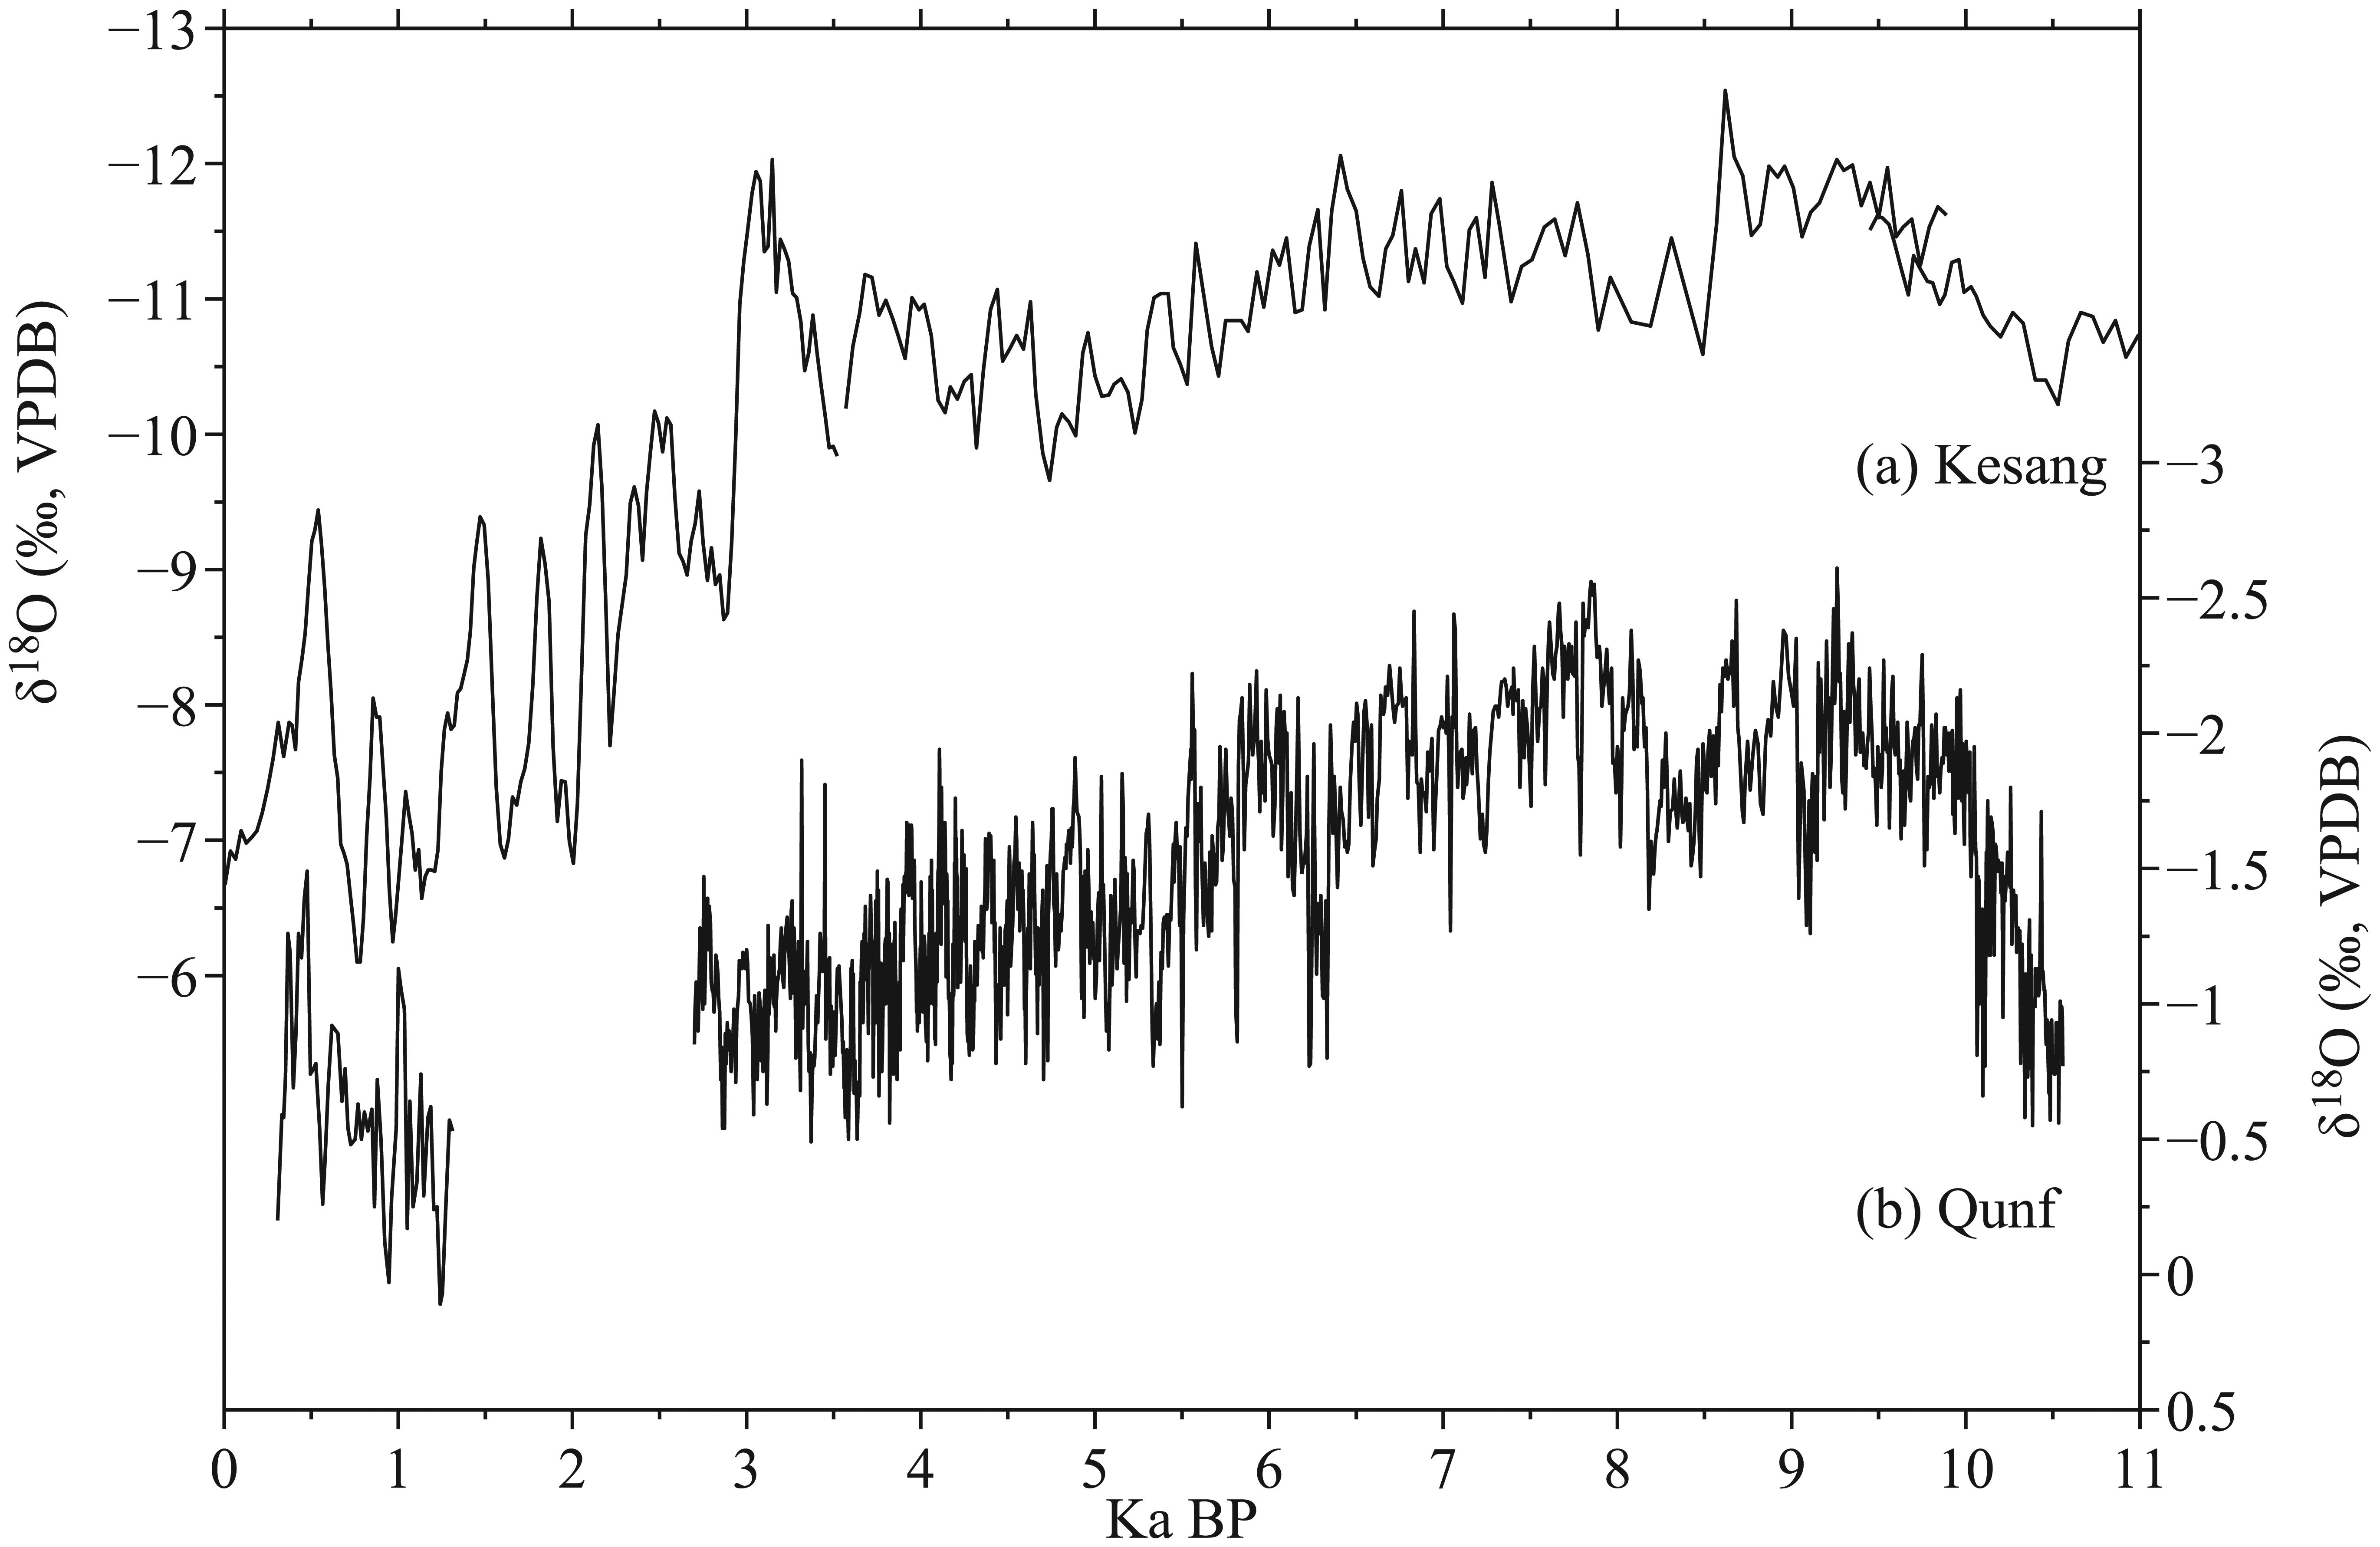
Comparison of speleothem δ18O records from Kesang Cave (Cheng et al., 2012) and Qunf Cave (Fleitmann et al., 2003).
Since speleothem δ18O values are closely related to the moisture source, we analysed the water vapour transportation for the rainfall at Wulumuqi weather station near Kesang Cave site (Figure 11). Because of the massive mountains surrounding it, water vapour in the lower atmosphere cannot reach arid central Asia. In addition, the moisture content in the upper atmosphere is very low. Therefore, we only analysed the water vapour transportation at 700 hPa (about 3000 m above sea level). Although water vapour in arid central Asia comes mainly from the North Atlantic Ocean via westerly winds (Figure 9a), the moisture source for the rainfall at Wulumuqi weather station is different between heavy rain (Figure 11a and b) and light rain (Figure 11c and d) at present. The moisture for light rain comes only from the west at 700 hPa (Figure 11c and d). However, moisture from the Indian Ocean can arrive over arid central Asia through monsoonal winds over the east of the Qinghai–Tibet Plateau in the days prior to heavy rain events at Wulumuqi weather station (Figure 11a). In addition, moisture from the west is reduced during the days both prior to and during heavy rain events, as compared with light rain events (Figure 11). Therefore, moisture from the Indian Ocean likely contributes enormously to heavy rain at Wulumuqi weather station. The convergence of warm, wet air currents from the Indian Ocean and cold currents from the west (North Atlantic Ocean) is beneficial for the formation of heavy rain. This moisture transportation from the Indian Ocean is weakened on the days during heavy rain events (Figure 11b). The distance covered by the moisture transportation from the Indian Ocean is much shorter than that from the North Atlantic Ocean. Since the short-distance moisture transport is associated with relatively positive δ18O values, heavy rain at Wulumuqi weather station possesses relatively high δ18O values (Figure 12). This is different from precipitation δ18O in South Asia, in which heavy rain possesses relatively low δ18O values (Fleitmann et al., 2003; Wei and Gasse, 1999). Furthermore, heavy rain events at Wulumuqi are associated with the negative phase of the CGT pattern, as compared with light rain events (Figure 13). This further supports our KCM simulation results, which showed the CGTI to be negatively related to summer precipitation in arid central Asia (Figures 7a, 7b and 8a), as the positive phase of the CGT would have reduced the number of heavy rain events. Therefore, the CGT pattern can also influence the precipitation and precipitation δ18O values in arid central Asia.
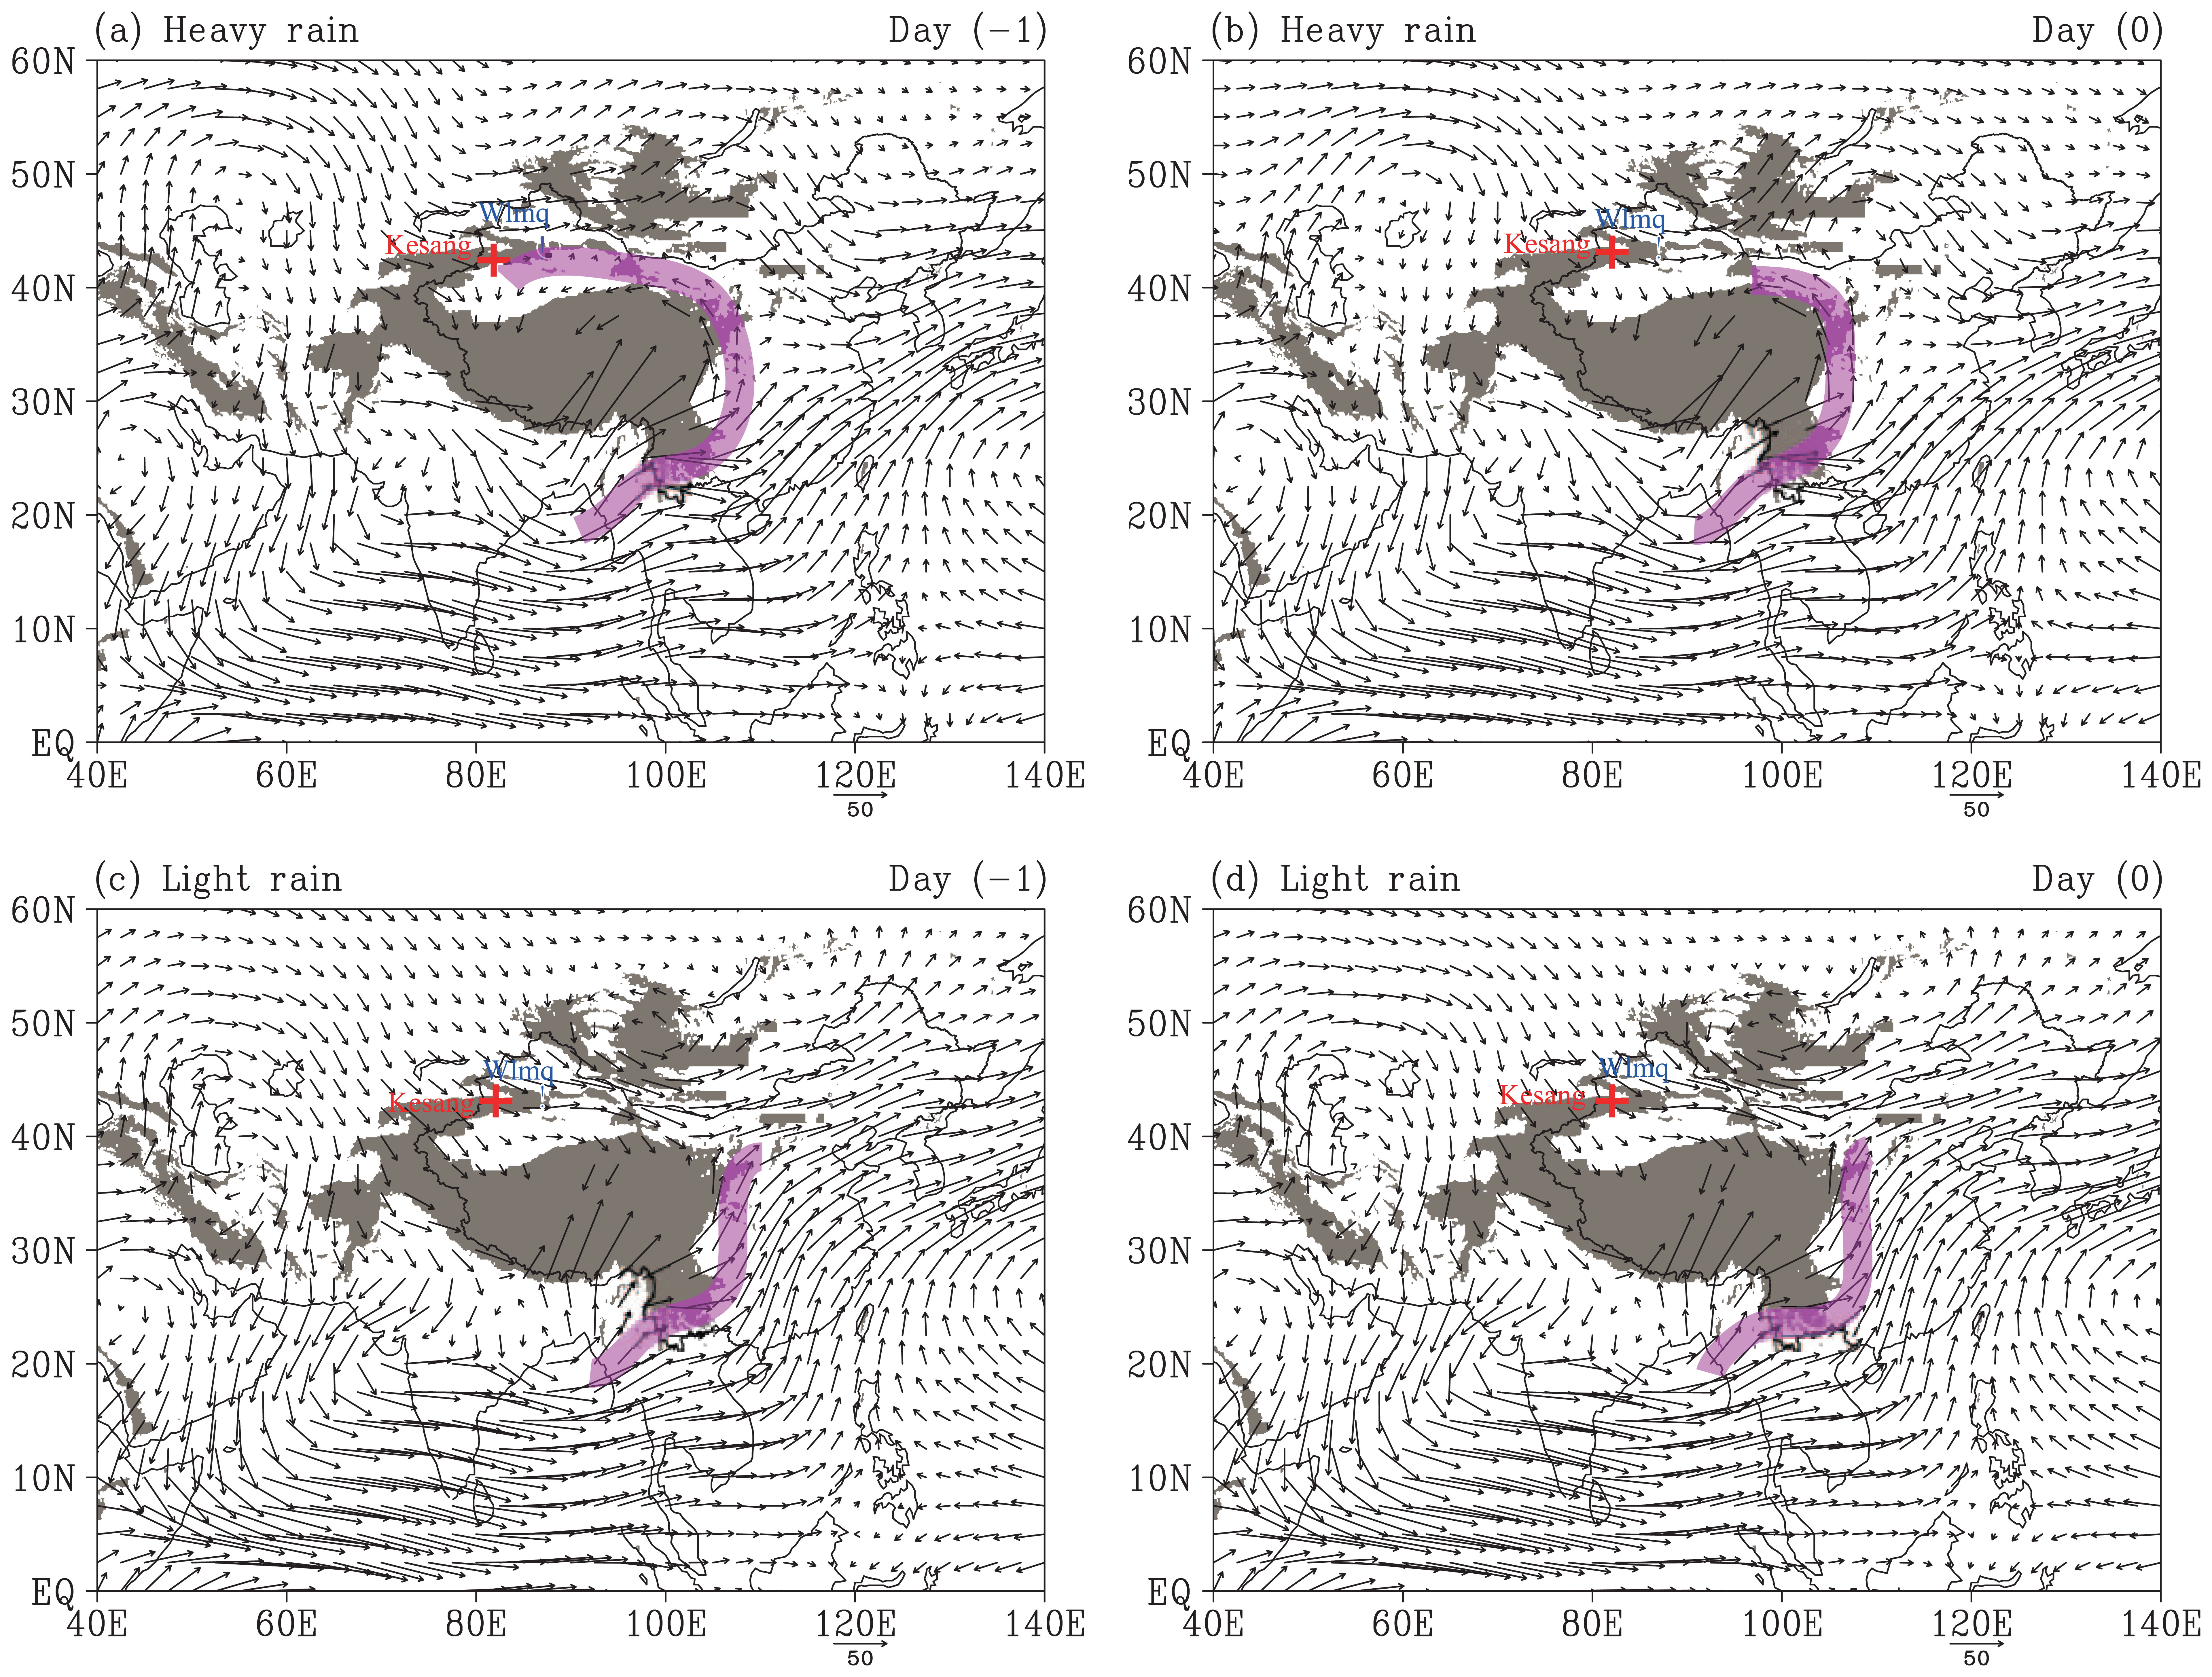
Mean water vapour flux at 700 hPa based on the (a and b) top 50 and (c and d) bottom 50 daily precipitation events at Wulumuqi weather station in summer during 1960–2012 using the NCEP-NCAR reanalysis daily data set (Kalnay et al., 1996). (a and c) The days prior to daily precipitation events. (b and d) The days during daily precipitation events. Areas above 1500 m (above sea level) are shaded in grey. The red cross and blue dot indicate Kesang Cave and Wulumuqi weather station, respectively. Magenta shading indicates the water vapour transport path. The pressure levels below the surface pressure as a result of topography were omitted when computing the water vapour fluxes.
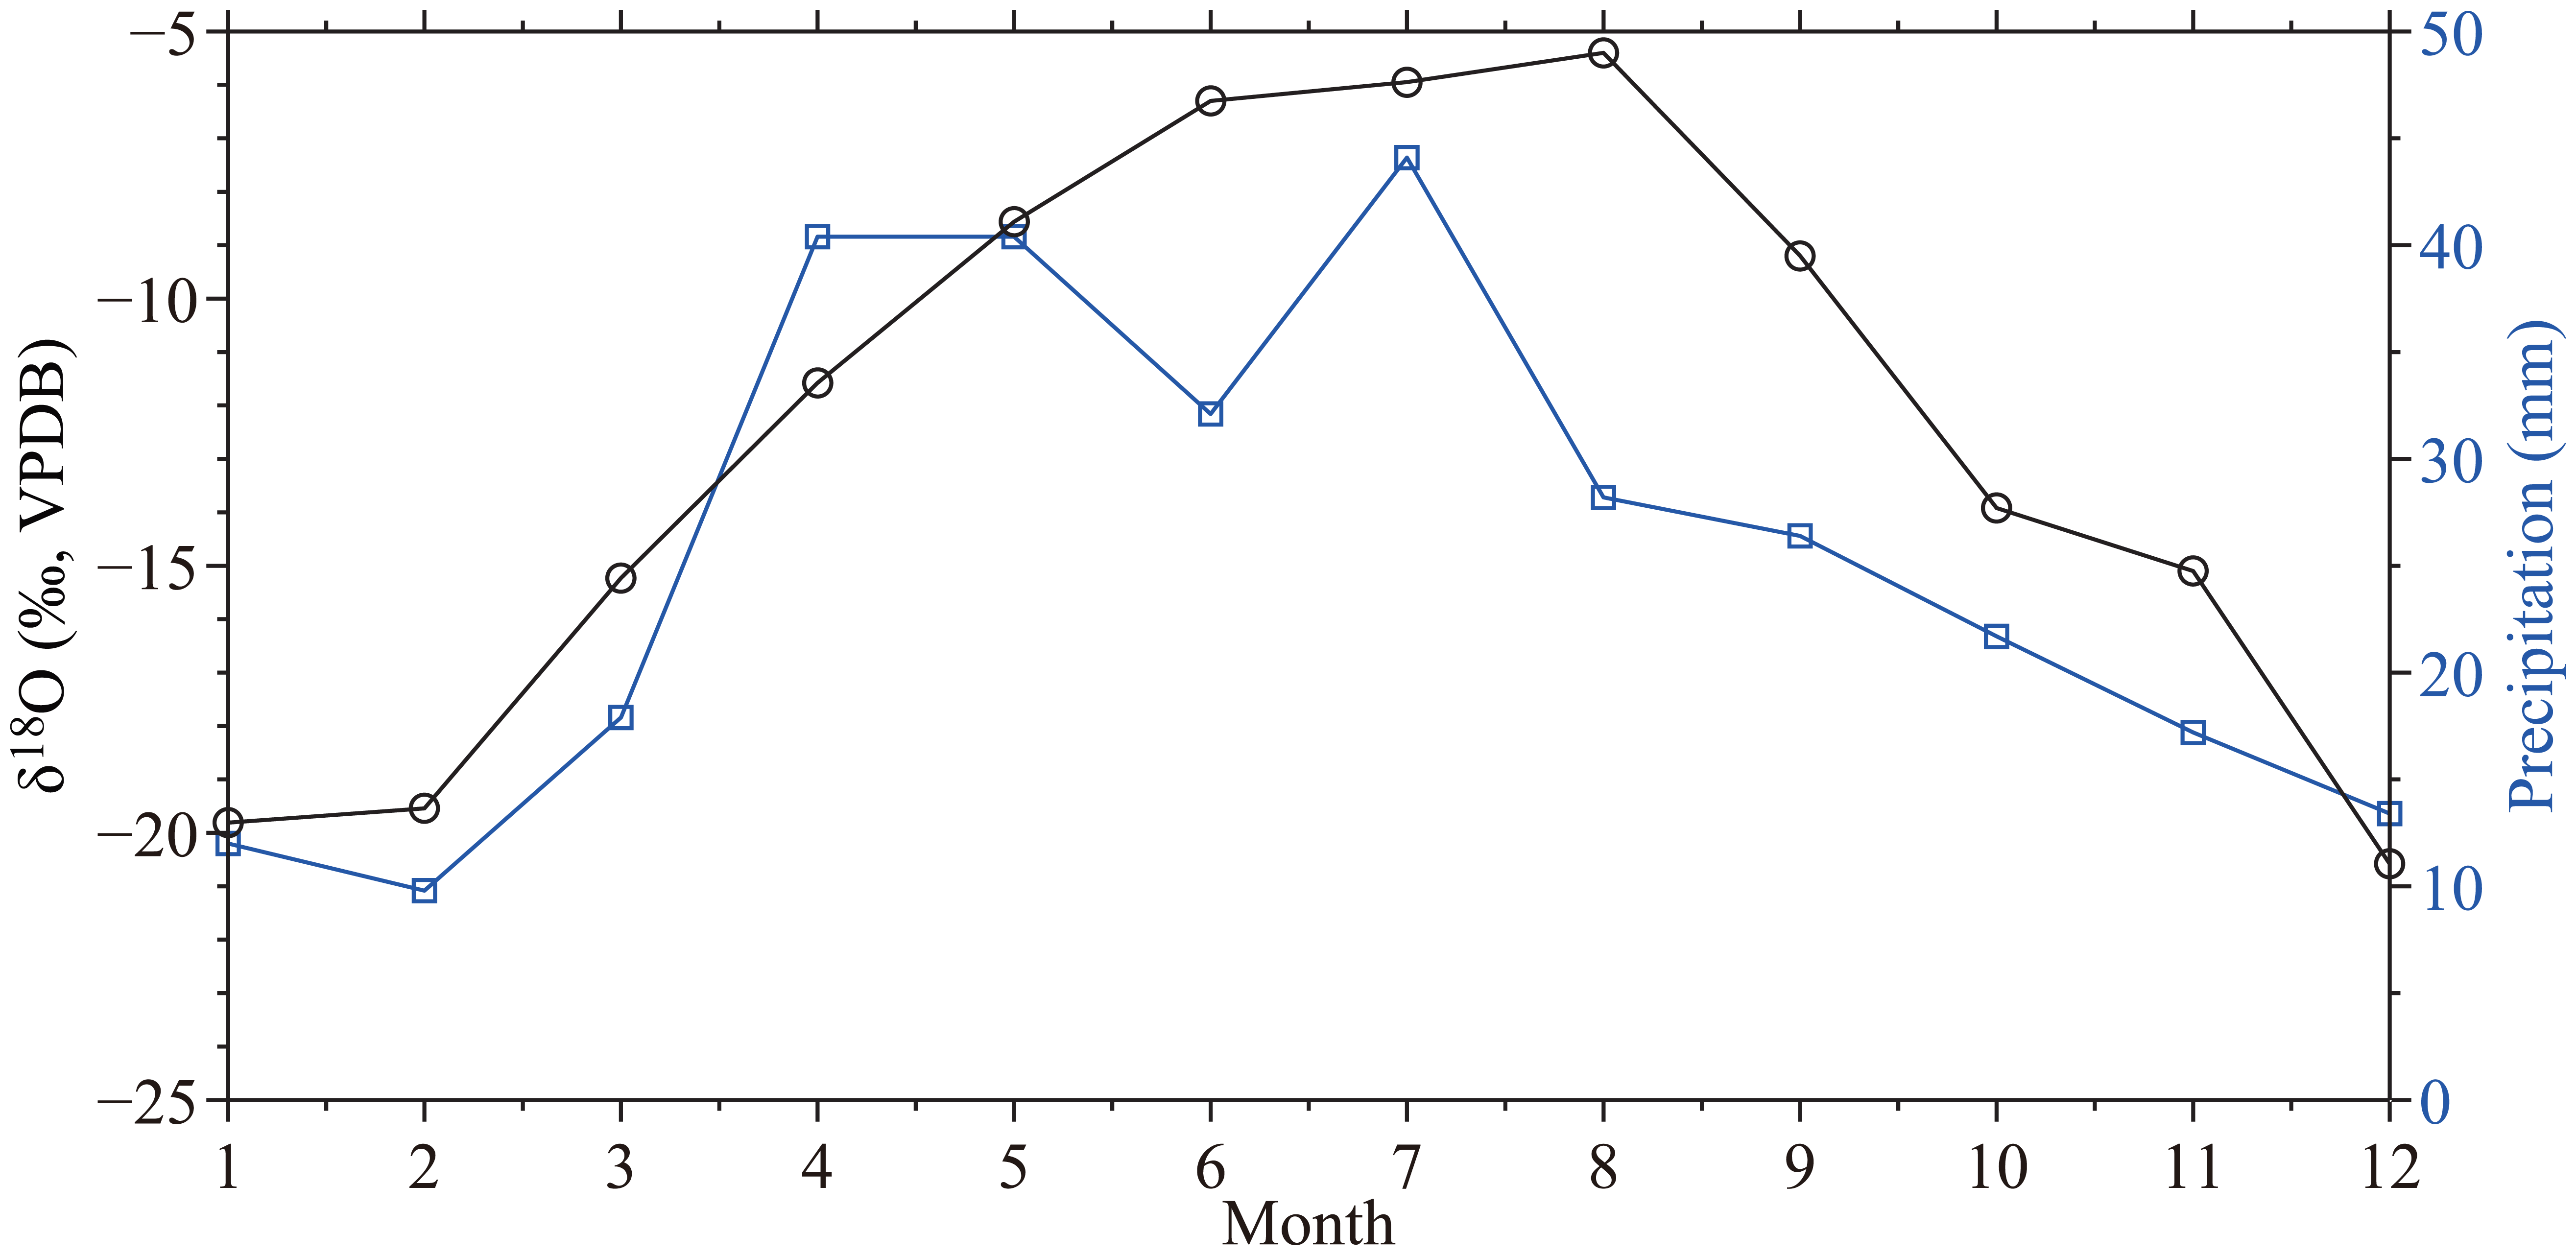
Comparison of monthly mean precipitation (blue curve) and δ18O of precipitation from the GNIP station at Wulumuqi.
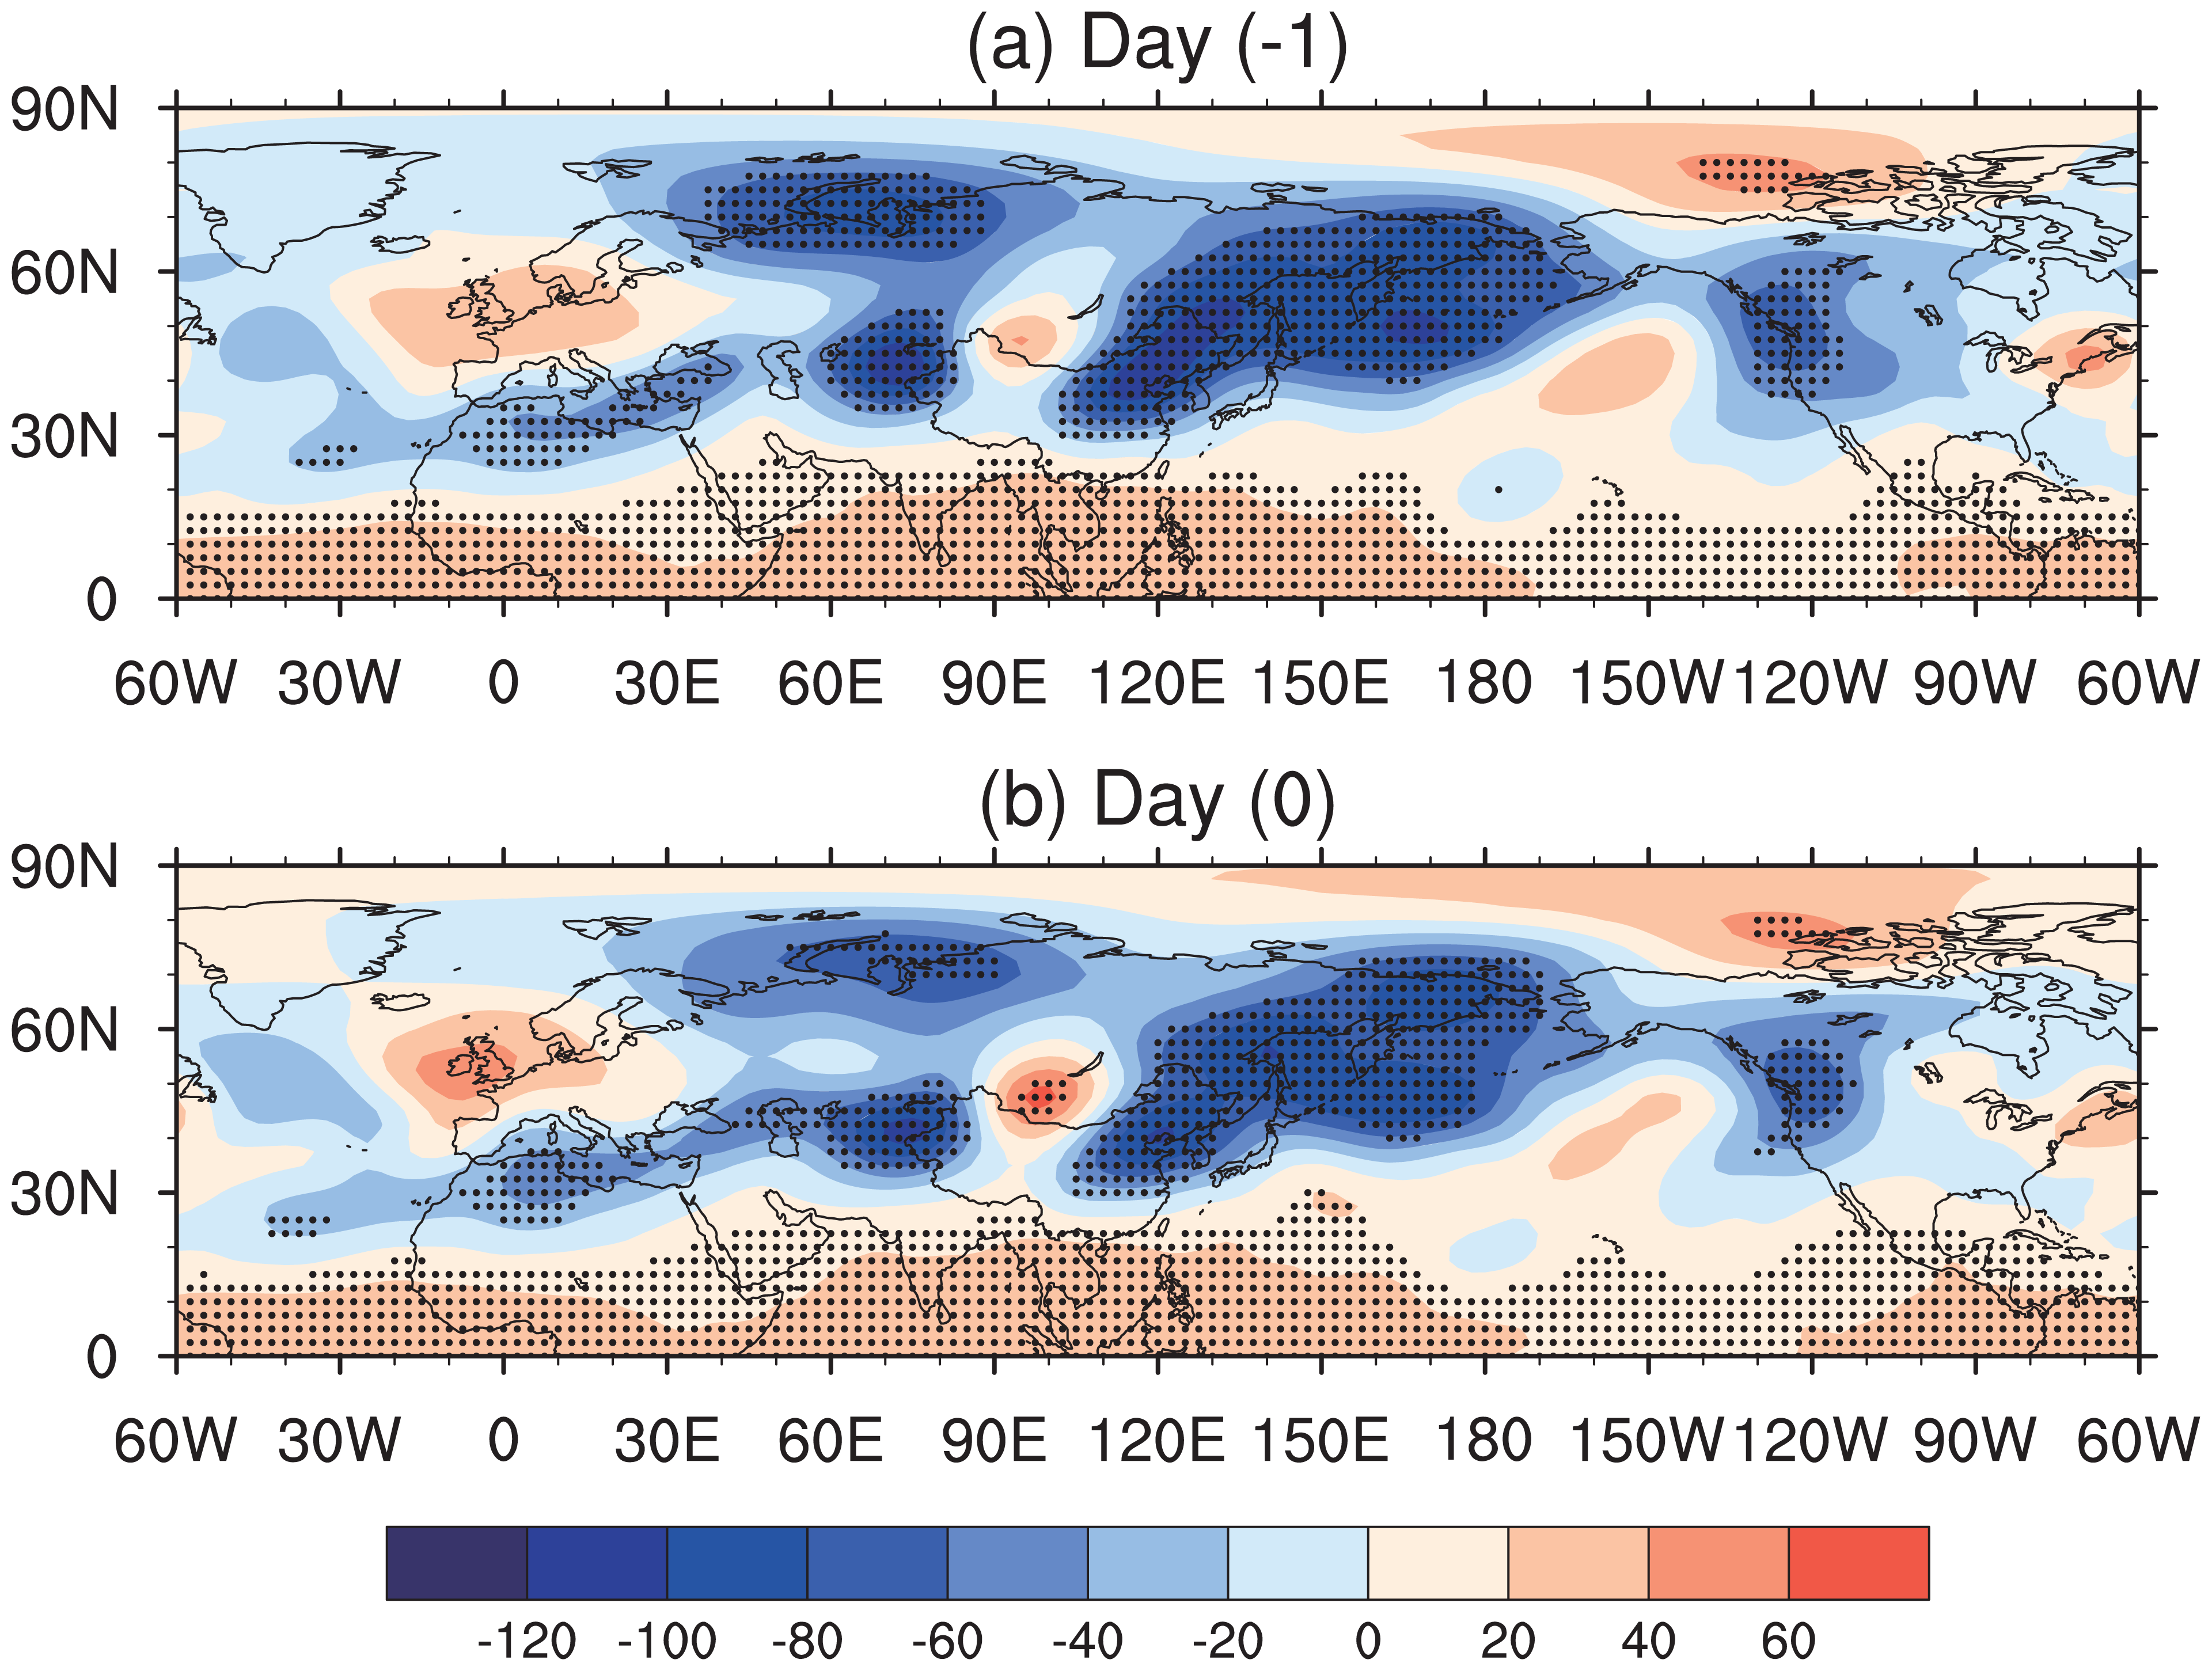
Composite difference of 200 hPa geopotential height (unit: gpm) between the top 50 and bottom 50 daily precipitation events at Wulumuqi weather station in summer during 1960–2012 using the NCEP-NCAR reanalysis daily data set (Kalnay et al., 1996). (a) The days prior to precipitation events. (b) The days during precipitation events. Dotted areas indicate changes that are significant at the 95% confidence level.
During the Holocene, the CGT has shifted from positive phase to negative phase (Figure 1a), which has resulted in a remarkable increase in moisture transportation from the Indian Ocean and a reduction in moisture transportation from the North Atlantic Ocean (Figure 14), in turn causing an increase in the number of heavy rain events and the resultant positive shift of speleothem δ18O values at Kesang Cave (Figure 10a). Hence, the CGT pattern is probably the key in terms of the positive relationship between the speleothem δ18O values from Kesang Cave in South Asia and from Qunf Cave in arid central Asia (Figure 10).
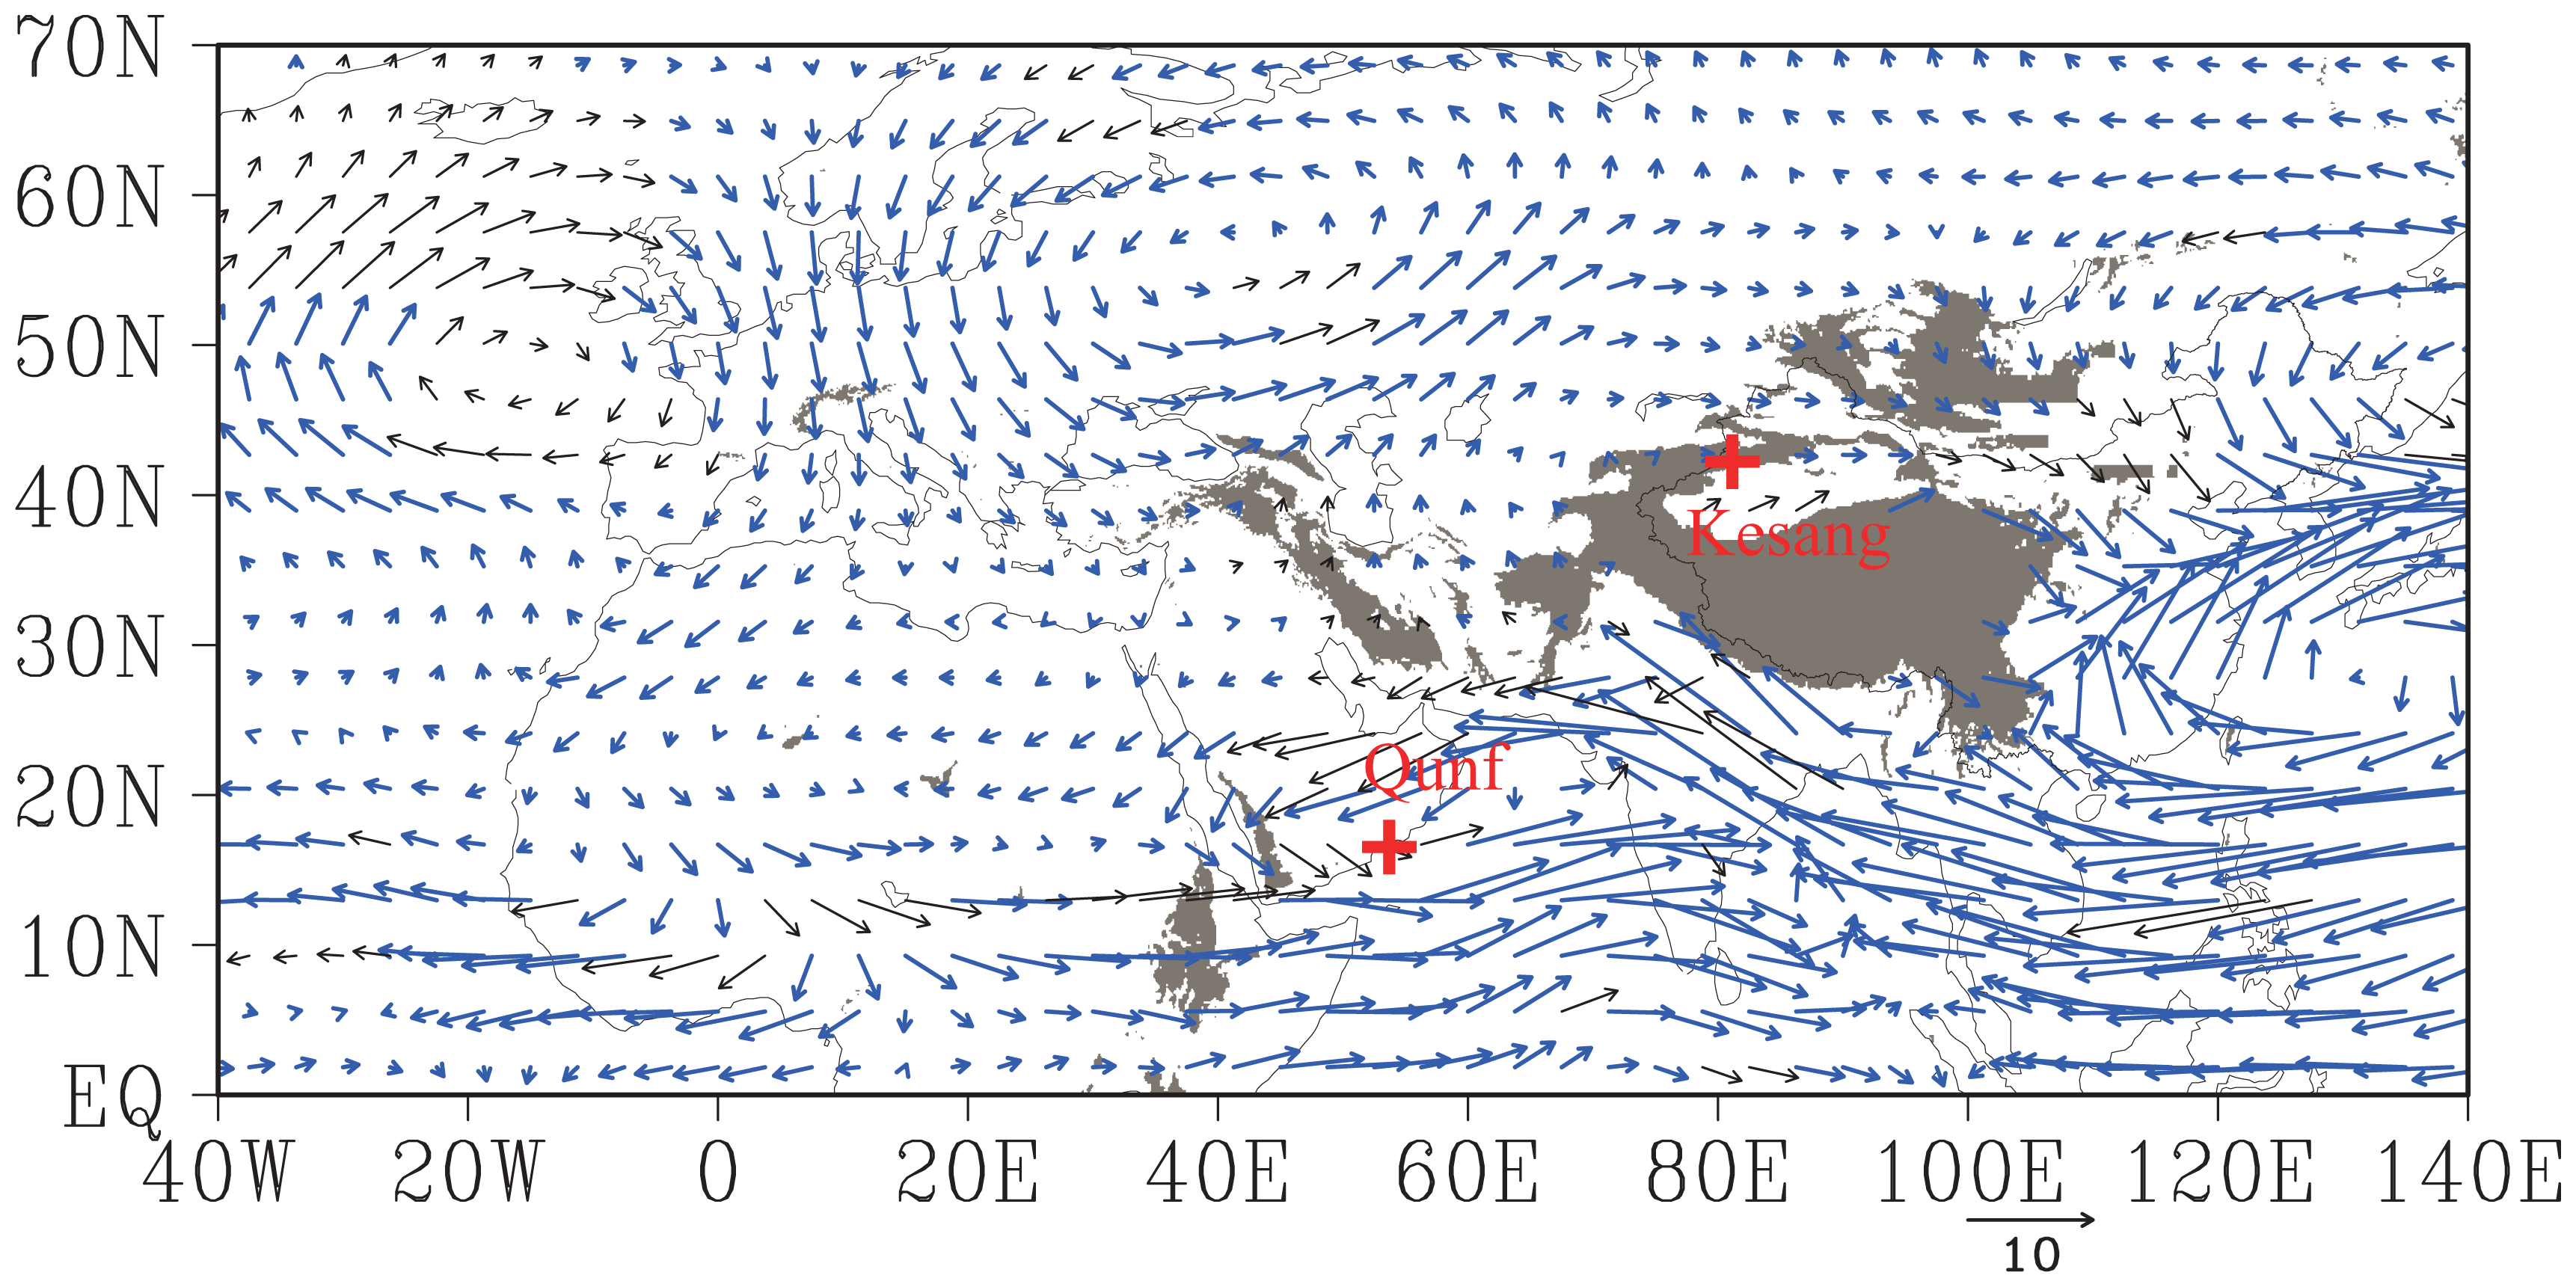
Composite difference of water vapour transportation at 700 hPa (detrended) between positive (top 10%) and negative (bottom 10%) CGTI (detrended) years during the Holocene in the HT simulation. Blue vectors indicate changes that are significant at the 95% confidence level. Areas above 1500 m (above sea level) are shaded in grey. Red crosses indicate Qunf Cave and Kesang Cave. The pressure levels below surface pressure as a result of topography were omitted when computing the water vapour fluxes.
Therefore, our results argue against the conclusion that strong ASM (positive phase of the CGT) can intrude deeply into arid central Asia (e.g. Kesang Cave site; Cheng et al. 2012), as strong south-west winds over northern China impede the monsoonal moisture transport towards arid central Asia during strong monsoon seasons (positive phase of the CGT; Figures 9 and 14). By contrast, monsoonal moisture can be transported to arid central Asia to produce heavy rainfall during weak monsoon seasons (negative phase of the CGT) due to weakened south-west winds over northern China.
Conclusion
In this study, we investigated the behaviour of the CGT and its association with ASM rainfall and temperature during the Holocene in response to insolation forcing and oceanic feedback using model results from a transient simulation forced by orbitally induced insolation variations. Our simulations neglected other forcing factors, such as GHGs and ice sheets, which may hinder a full understanding of the CGT and the associated ASM during the Holocene, as GHGs and ice sheets are important to the ASM (Liu et al., 2014; Lu et al., 2013; Mikolajewicz et al., 2003) and North Atlantic SST (Kutzbach et al., 2011; Renssen et al., 2009). However, our results, nevertheless, describe the main features of the CGT and its association with the ASM since these forcing factors are of minor importance compared with orbital forcing during the Holocene (Schneider et al., 2010).
The spatial pattern of the CGT during the Holocene is quite similar to that at present, based on NCEP-NCAR reanalysis data (Ding and Wang, 2005). The CGTI showed a decreasing trend from the early to late Holocene in response to summer insolation forcing. In addition, the North Atlantic and tropical heating was able to exert an important role in the CGT, leading to a slight increasing trend in the CGTI after ~5 ka BP.
The CGT showed significant correlation with the ASM during the Holocene, especially ISM precipitation in response to insolation, suggesting that the CGT can act as a bridge linking the ASM to insolation forcing. After the removal of the millennial-scale trend, the CGT pattern was still significantly correlated with ASM precipitation. Proxy records have revealed that the ASM is remarkably affected by North Atlantic and IWP SST (Gupta et al., 2003; Wang et al., 2005; Xu et al., 2015), which probably exert their influence via the CGT. The closer relationship between the CGTI and EASM precipitation after detrending implies that oceanic forcing, especially IWP SST, may play a key role in the EASM, since the formation of the EASM is related to the WPSH, which itself is influenced by the IWP SST (Zhou et al., 2009). Given the intermediary role of the CGT in connecting the ASM to insolation, high-latitude forcing (North Atlantic SST) and low-latitude forcing (tropical Ocean SST), we, therefore, conclude that mid-latitude atmospheric circulation has been a key factor in the evolution of the ASM during the Holocene – a point also emphasized by Chiang et al. (2015).
In addition to the ASM, the CGT has a close relationship with the climates of arid central Asia. Heavy rain events in arid central Asia, resulting from moisture input from the Indian Ocean, decrease significantly during the positive phase of the CGT. The moisture source from the Indian Ocean is associated with relatively high δ18O values compared with that from the North Atlantic Ocean, leading to increased precipitation δ18O values. Therefore, the CGT can provide a viable explanation for the increasing trend in the speleothem δ18O values from Kesang Cave but a wetting trend in arid central Asia during the Holocene. The CGT can also influence speleothem δ18O values in South Asia via its effect on the amount of precipitation. Hence, the CGT has probably been the key factor responsible for the out-of-phase relationship in moisture evolution, but the in-phase relationship in speleothem δ18O values, between arid central Asia and the ISM region during the Holocene.
Footnotes
Acknowledgements
The modelling experiments using the KCM were performed at the Computer Centre of Kiel University, Germany. W. Park and L. Mojib of GEOMAR Helmholtz-Zentrum für Ozeanforschung Kiel and Birgit Schneider of Christian-Albrechts-Universität zu Kiel are thanked for their kind help and thoughtful discussion during the use of the KCM for the simulation experiments.
Funding
This work was jointly supported by the National Natural Science Foundation of China (NSFC; 41275071), the State Key Programme of the NSFC (41130102), the National Basic Research Programme of China (973 programme; 2012CB955301) and the Fundamental Research Funds for the Central Universities (lzujbky-2015-218 and lzujbky-2014-271).