



Abstract
A total of 51,074 archaeological sites from the early Neolithic to the early Iron Age (c. 8000–500 BC), with a spatial extent covering most regions of China (c. 73–131°E and c. 20–53°N), were analysed over space and time in this study. Site maps of 25 Chinese provinces, autonomous regions and municipalities, published in the series ‘Atlas of Chinese Cultural Relics’, were used to extract, digitalise and correlate its archaeological data. The data were, in turn, entered into a database using a self-developed mapping software that makes the data, in a dynamic way, analysable as a contribution to various scientific questions, such as population growth and migrations, spread of agriculture and changes in subsistence strategies. The results clearly show asynchronous patterns of changes between the northern and southern parts of China (i.e. north and south of the Yangtze River, respectively) but also within these macro-regions. In the northern part of China (i.e. along the Yellow River and its tributaries and in the Xiliao River basin), the first noticeable increase in the concentration of Neolithic sites occurred between c. 5000 and 4000 BC; however, highest site concentrations were reached between c. 2000 and 500 BC. Our analysis shows a radical north-eastern shift of high site-density clusters (over 50 sites per 100 × 100 km grid cell) from the Wei and middle/lower Yellow Rivers to the Liao River system sometime between 2350 BC and 1750 BC. This shift is hypothetically discussed in the context of the incorporation of West Asian domesticated animals and plants into the existing northern Chinese agricultural system. In the southern part of China, archaeological sites do not show a noticeable increase in the absolute number of sites until after c. 1500 BC, reaching a maximum around 1000 BC.
Keywords
Introduction
Accurately estimated spatiotemporal changes in past human populations at regional and global scale are crucial for (1) a better understanding of past human–environment interactions; (2) testing predictability of the regional and global models, which can be employed for developing future scenarios of climate change and agricultural land use; and (3) evaluation of landscapes vulnerability and responses to climate and socio-economic changes (e.g. Boyle et al., 2011; Brovkin et al., 2013; Rounsevell et al., 2005; Vavrus et al., 2008; Weber et al., 2010). Therefore, robust evaluation of prehistoric population dynamics and their driving mechanisms is important for properly attributing ongoing climate changes to human-induced and/or natural forcing (e.g. Kleinen et al., 2011; Ruddiman et al., 2008; Wanner et al., 2008). Until recently, humans and their activities were not given consideration as a force in changing Earth’s climate on a global scale before the onset of the industrial revolution c. 200 years ago (e.g. Crutzen and Stoermer, 2000). Furthermore, interactions between humans and the environment around them were mainly discussed in terms of how climatic change and environmental catastrophes impacted people (e.g. De Menocal, 2001; Diamond, 2005; Giosan et al., 2012; Leipe et al., 2014). However, a provocative new hypothesis suggesting the ‘anthropogenic greenhouse era’ had already begun by 8000 years ago, as a result of forest clearance and agricultural land use, notably wet rice cultivation in China and associated high population densities, is used to explain the pre-industrial rise in greenhouse gas concentrations (Ruddiman, 2003; Ruddiman et al., 2011). The prehistoric rise in methane levels illustrates the importance of research on past population growth and geographic expansion (e.g. Wang et al., 2014 and references therein).
Eastern China is one of the key regions of the world with early Holocene complex agricultural systems and permanent settlements from where societal changes radiated far beyond (e.g. Crawford, 2009; Liu and Chen, 2012; Wagner and Tarasov, 2014; Zhao, 2011; Zheng et al., 2011 and references therein). Although reliable counts are missing, there have been various attempts to quantify changes in the global and regional populations through the millennia (e.g. Biraben, 2003). The latter study reports a significant population rise in China from 0.8 to 20 million people between 4000 and 2000 years before the Common Era (BCE or BC) and a slight drop to 19 million at 400 BC during the Warring States Period (Cartier, 2002). This estimated rapid population growth in ancient China around 3000 BC was explained (Li et al., 2009a) by improved agricultural practices and the expansion of rice cultivation within the Yellow River (Huang He) and Yangtze drainage areas (Ruddiman et al., 2008). As in the given case, the archaeological data are often used to verify population estimates during prehistoric times. An increase in the number of archaeological sites is interpreted as population growth (e.g. Shelach, 1999; Wagner, 2006) and in terms of growing pressure on the surrounding landscape (e.g. Li et al., 2009a; Ruddiman et al., 2008). Although such a straightforward interpretation has its own limitations (see Ruddiman et al., 2008 for a discussion), it can still be effectively used for reconstructing general trends and testing working hypotheses (e.g. Wagner et al., 2013).
The current study continues the research started in Wagner et al. (2013), who utilised the wealth of archaeological data published in 11 provincial/regional volumes of the ‘Atlas of Chinese Cultural Relics’, covering most of northern China, north of 31°N and east of 90°E. In the current paper, the archaeological data from 25 provinces and regions, representing almost the entirety of China, have been analysed. Our aims are threefold: (1) to build a geo- and chronologically referenced archaeological dataset of more than 50,000 sites (presented as Supplementary material, available online); (2) to analyse spatiotemporal patterns of archaeological site distribution in China from the early Neolithic to the early Iron Age (c. 8000–500 BC); and (3) to discuss the revealed patterns against the available climate and environmental reconstructions and archaeologically approved socio-economical changes in the ancient societies.
Regional environments
The People’s Republic of China (Figure 1) with a population of over 1.35 billion occupies a large area of Central and East Asia, which consists of a very diverse spectrum of landscapes and climatic regions. China extends for almost 4000 km, at the latitude of Beijing, from the Pamir Mountain ranges west of the Tarim Basin to the coasts of Bo Hai Bay of the Yellow Sea and for almost 2300 km, at the longitude of Xi’an, from the border with Mongolia to the South China Sea. Basically, this area consists of three main topographic levels, including low-elevated alluvial plains and coastal lowlands in the east; a chain of mountain ridges, plateaus (e.g. the Loess Plateau, Ordos Plateau and Yunnan-Guizhou Plateau) and intermountain basins (e.g. the Tarim, Junggar and Sichuan basins) in the central and north-western parts elevated to ~1000–2000 m; and the high-elevated mountains (e.g. Kunlun, Pamir) and the Qinghai–Tibet Plateau in the west elevated to ~3000–7000 m a.s.l.
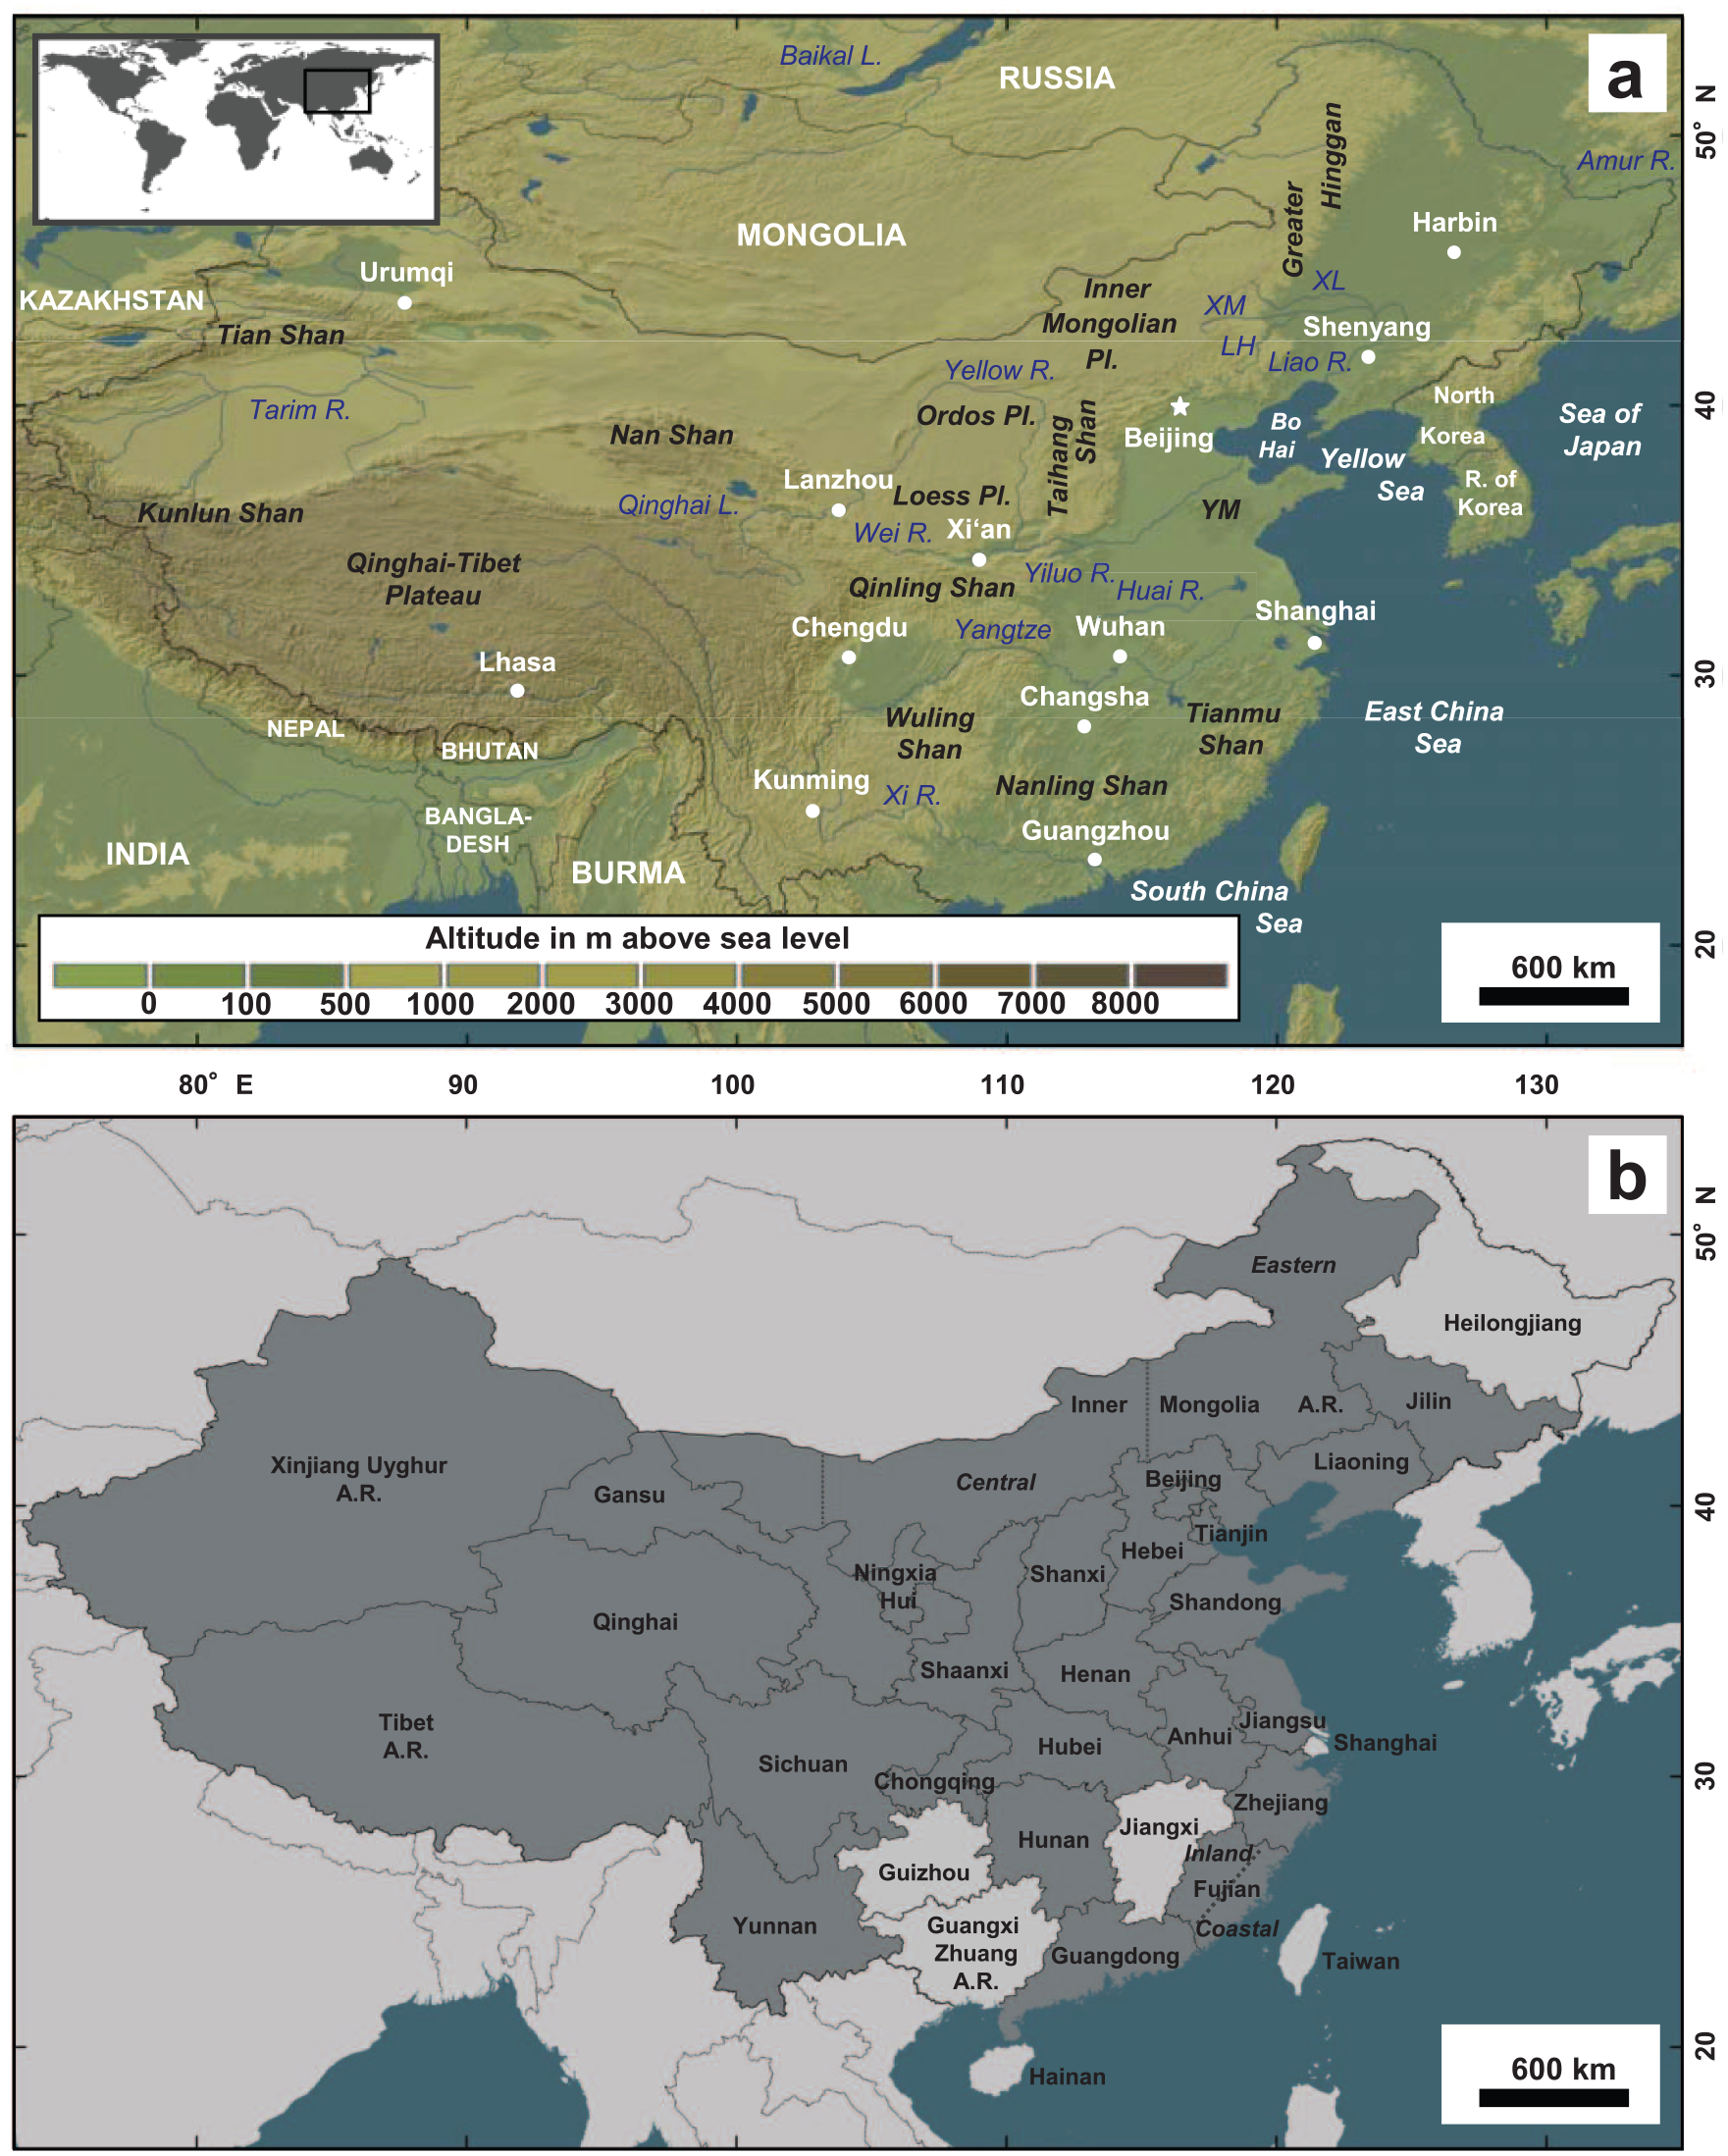
(a) Topographic map of China and neighbouring states with country borders, main rivers and lakes and selected cities and (b) schematic map showing the provinces, autonomous regions and municipalities of China from which archaeological sites data published in the series ‘Atlas of Chinese Cultural Relics’ (coloured dark grey) are used in the current study. Provinces without published data are coloured light grey. In the upper map XM indicates Xar Moron River, LH indicates Laoha River and XL indicates Xiliao River in Liaoning province, and YM indicates Yimeng Mountain area in Shandong province.
The whole area exhibits strong seasonal contrasts in temperature and precipitation, typical of monsoonal climates (Domrös and Peng, 1988), which plays a key role in the vegetation and human dynamics in China during the Holocene (e.g. Tarasov et al., 2006; Wagner et al., 2013; Yancheva et al., 2007). Air masses from Siberia and Mongolia and north-westerly winds associated with the Siberian High (i.e. winter monsoon) predominate during the cold season, and south-easterly winds bring warm and wet air from the Pacific Ocean (i.e. summer monsoon) during the warm season. The precipitation distribution pattern shows a pronounced east–west gradient. Mountainous regions and plains along the sea coasts receive the highest precipitation (i.e. above 1000 mm/yr) and are classified as humid (Domrös and Peng, 1988). The area west of 115°E, receiving 300–500 mm of precipitation annually, is classified as semi-arid. The north-western and western regions, largely isolated from the oceanic influence, receive less than 100 mm of annual precipitation and are classified as arid. The natural vegetation distribution patterns primarily reflect changes in precipitation and moisture availability. High proportions of bare ground are observed in the areas with annual precipitation of less than 300 mm. Additionally, high percentages of woody cover are typical for the areas receiving more than 440 mm/yr, and the highest herbaceous cover percentages occur in the transitional zone (Zheng et al., 2010).
Although the whole area has a precipitation maximum during the warm half of the year, the total amount of precipitation is very low in the north-western and western regions, which also reveal a maximal contrast between winter and summer temperatures. Across the whole area, the winter precipitation accounts for only a small part of the annual total, and snow does not cause a serious problem for humans and their livestock, except in the mountains and the north-eastern region at the border with Russia. With reference to hazardous events that might have endangered the life of the prehistoric inhabitants, mention should be made of occasional winter frosts, which may lead to temperatures dropping down well below 0°C even in the southern regions, catastrophic summer rains causing disastrous floods (Lu et al., 2005), spring dust storms that are particularly pronounced in the western and northern parts of China and tsunamis with devastating effects along the seacoast (Wagner et al., 2013; Wagner and Tarasov, 2014). Year to year precipitation variability is another factor that harms the growth of cultivated plants in China. Even in the relatively humid region around Beijing, 10 times over the past century precipitation was ~50% less than the average norm, causing severe droughts and water shortages associated with a weaker-than-average summer monsoon (Domrös and Peng, 1988).
A broad range of environmental and climatic conditions through the prehistory and historical times of China determines diverse living conditions and correspondingly diverse subsistence strategies (Yancheva et al., 2007). The alluvial and loess plains are extensively used for agriculture, with rice grown south of the Yellow River, and soy, sorghum, millet and wheat successfully cultivated everywhere outside the high mountains (Hou, 2001). Water availability is (and likely was, see for example, Tarasov et al., 2006) a major constraint for agriculture in most of western and central China, outside river valleys and oases (e.g. Wagner et al., 2011). Under natural conditions of the pre-industrial epoch, the semi-arid and arid plains and mountains, covered with herbaceous vegetation, were effectively used as grazing grounds for livestock (mainly sheep, goats, yaks and horses), while extensive agriculture has been confined to the easternmost regions and to the large river valleys, which provided a more stable water supply and fertile soils and controlled the distribution pattern of the Neolithic settlements (e.g. Zhang et al., 2007).
Archaeological data: Information sources and mapping procedure
Three major campaigns of systematic archaeological survey covering the whole country were initiated by the Chinese government. Starting in 1956, 1981 and 2007, respectively, they lasted approximately 3–5 years (Wagner et al., 2013). During these surveys, sites of all prehistoric and historic periods were registered and documented by teams of archaeologists representing central, provincial and city archaeological institutions and state bureaus of cultural relics of all administrative levels. In particular, the second survey campaign during the 1980s provided vast data, which were used by the State Administration of Cultural Heritage (Chinese: Guojia Wenwuju) in the publication project ‘Atlas of Chinese Cultural Relics’, presented as a series of consecutive volumes. Altogether, 25 volumes have appeared to date (Guojia Wenwuju, 1989, 1991, 1993, 1996, 1997, 1998, 2001, 2002a, 2002b, 2003, 2006, 2007a, 2007b, 2008a, 2008b, 2009a, 2009b, 2009c, 2010a, 2010b, 2010c, 2011, 2012, 2013, 2014), each representing a single province, autonomous region or major metropolitan area (e.g. Beijing).
All volumes are consistent in their structure and layout, thus creating a basis for heritage protection, site management and further scientific analysis (see Wagner et al. (2013) for further details). Two principal components of each volume are site location maps and an index of the mapped sites with a short description. Although the atlases provide a rather comprehensive coverage of all known heritage sites obtained by salvage and research excavations, systematic surveys and occasional discoveries, two obstacles for potential users have been noted (Wagner et al., 2013), including the Chinese language of the publications and absence of geographical coordinates in the maps and supplementary texts. Another complication for analysing the data poses the archaeological chronologies, that are often too coarse for comparison with more detailed records.
For the purposes of the current study, we assembled the archaeological site distribution data extracted from the 25 volumes published to date and representing most of the Chinese mainland territory (Figure 1b), except for Heilongjiang, Jiangxi and Guizhou provinces, Guangxi Zhuang Autonomous Region and Shanghai municipality. Our recent compilation includes the dataset from northern China, already discussed by Wagner et al. (2013), and the new data extracted from another 14 volumes representing the western and southern parts of China.
The Inner Mongolia Autonomous Region extends over 2500 km from southwest to northeast with differing site densities in the eastern and western parts (Guojia Wenwuju, 2003). For better handling of the data, we, therefore, divided the territory into two archaeologically and geographically different regions, that is, east and west of 115°E (Figure 1b). Similarly, Fujian province has been subdivided into a coastal and inland region (Figure 1b), each having its own cultural sequences. Therefore, the number of analysed regions increased to 27 (Figure 2).
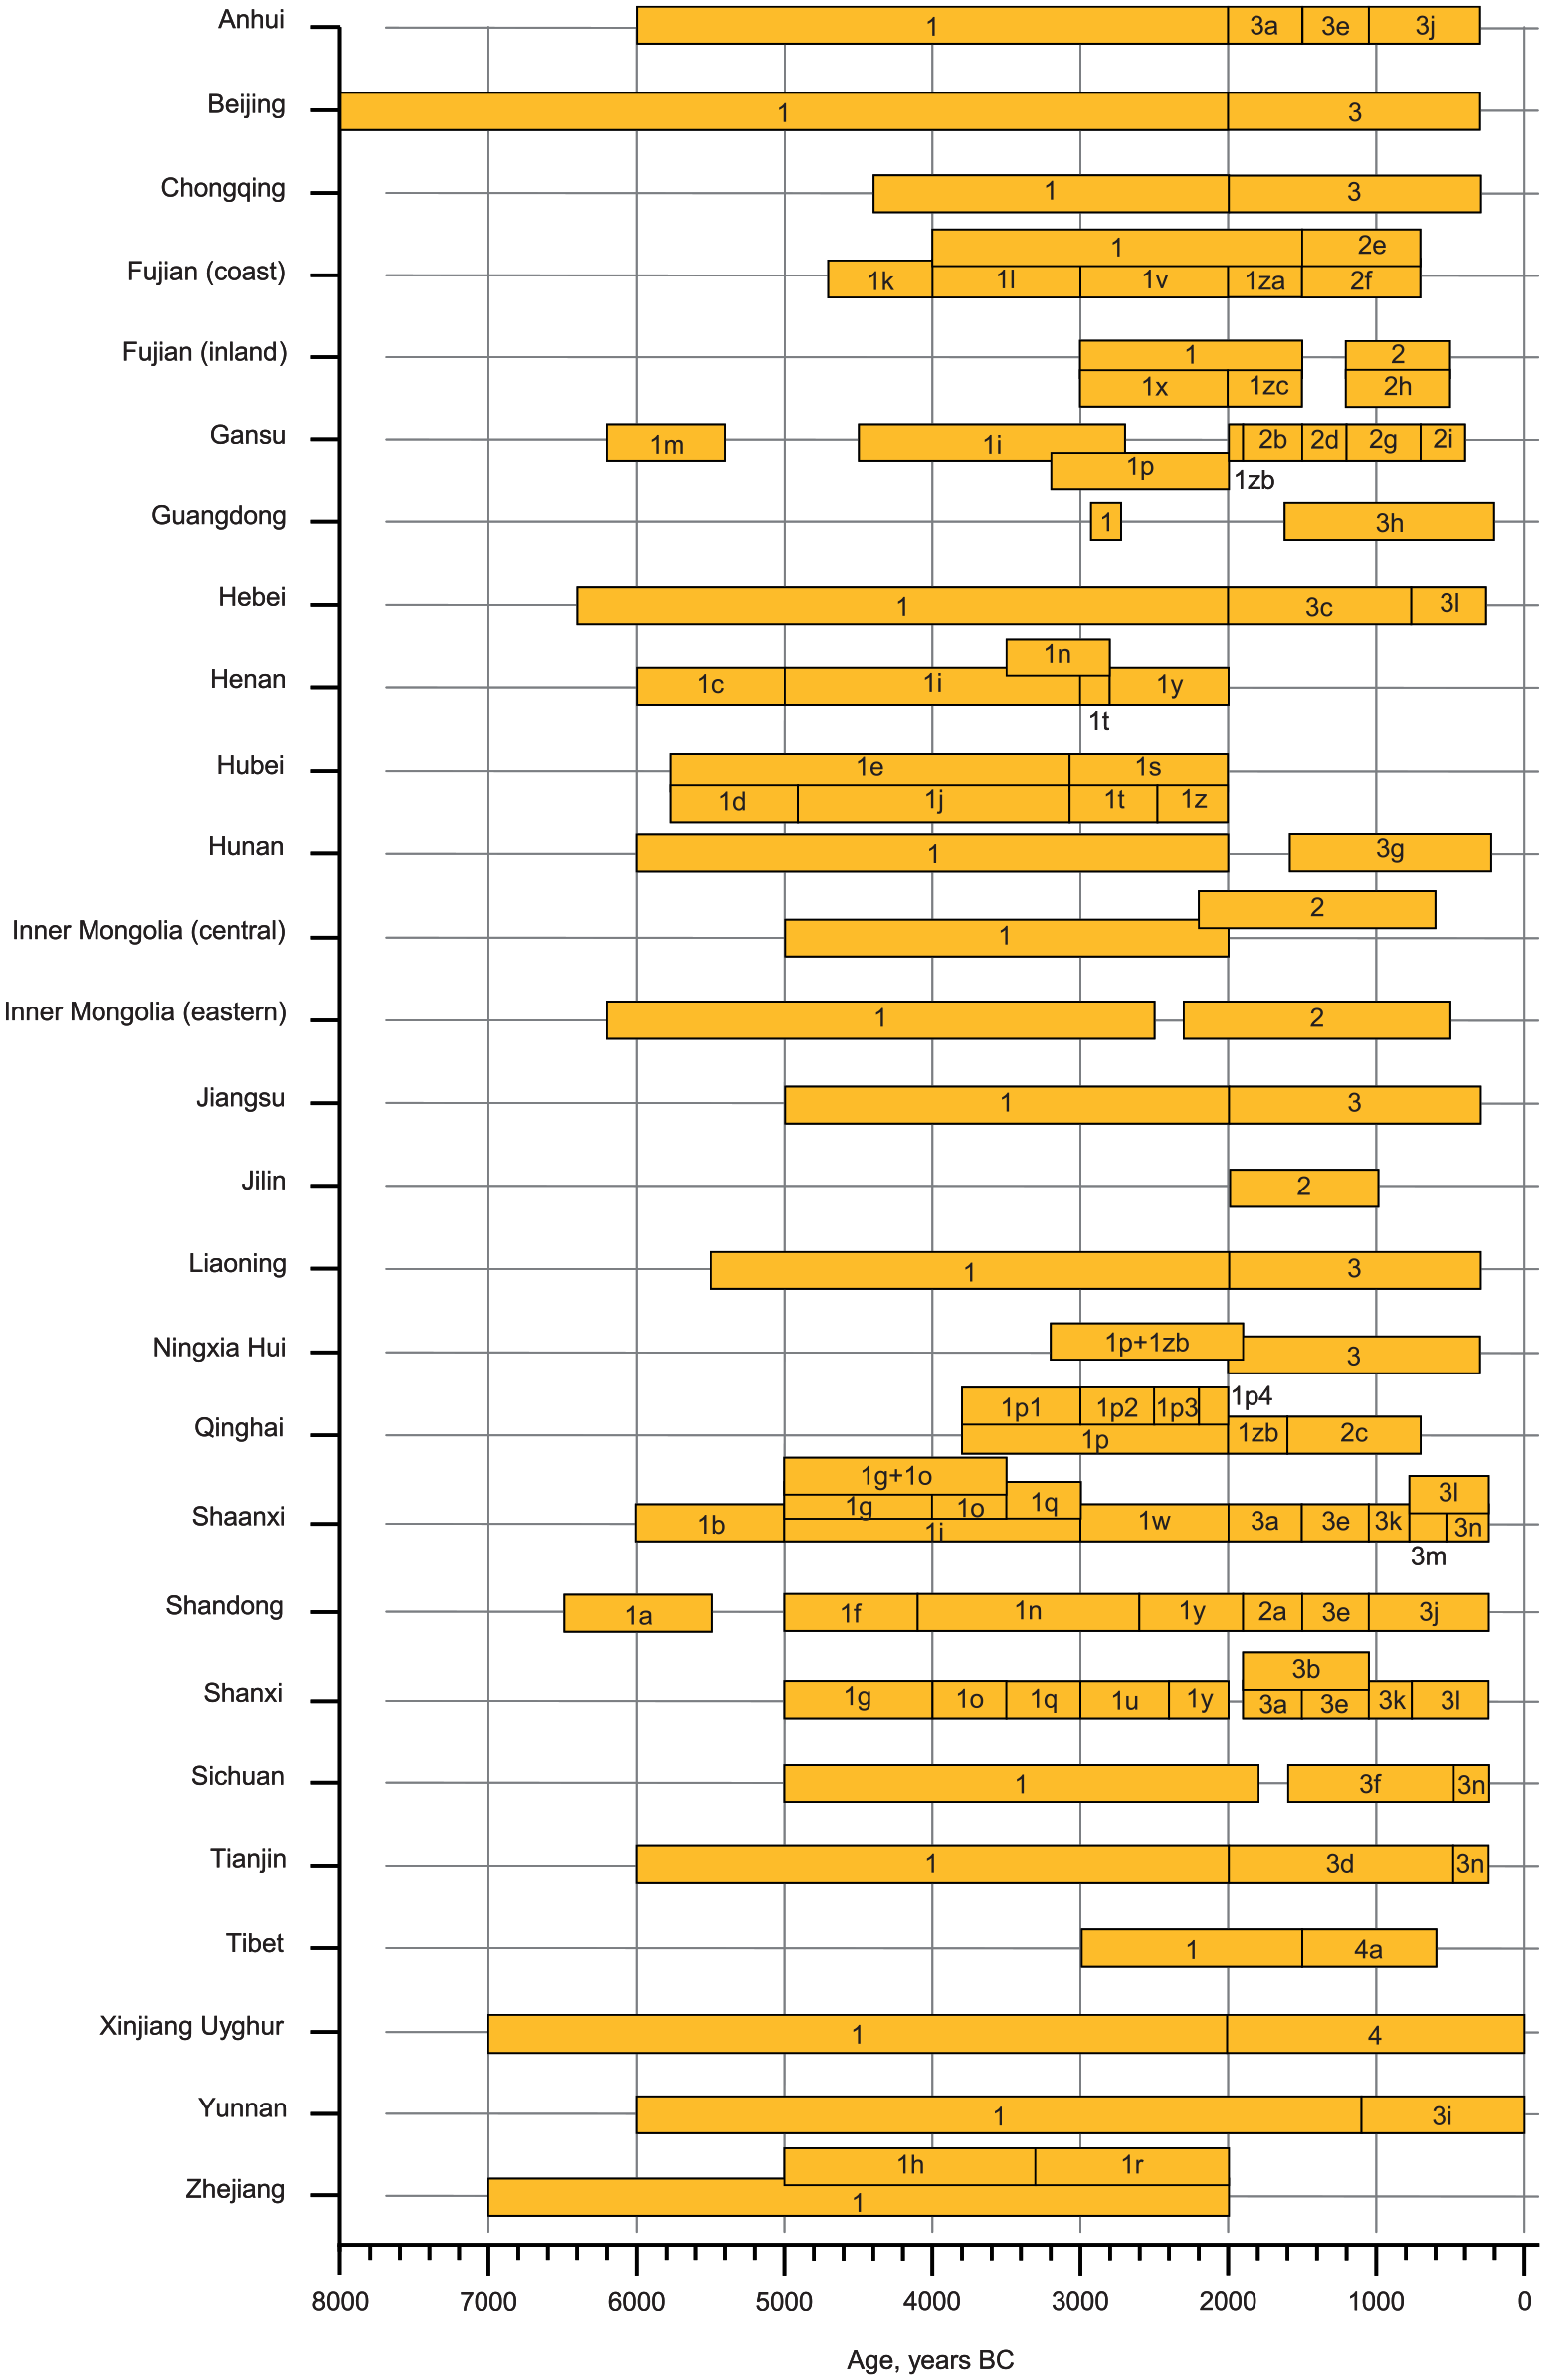
Chronological chart for the Neolithic, Bronze Age and the early dynastic periods in the analysed provinces and regions of China shown in Figure 1b. Numbers indicate the following cultural units as presented in the regional atlases (Guojia Wenwuju): 1 – undistinguished Neolithic cultures; 1a – Houli culture; 1b – Laoguantai culture; 1c – Peiligang culture; 1d – Chengbeixi culture; 1e – Chengbeixi + Daxi cultures; 1f – Beixin culture; 1g – early Yangshao culture; 1h – Majiabang + Songze cultures; 1i – Yangshao culture; 1j – Daxi culture; 1k – Fuguodun culture; 1l – Keqiutou culture; 1m – Dadiwan culture; 1n – Dawenkou culture; 1o – middle Yangshao culture; 1p – Majiayao culture; 1p1 – Shilingxia phase; 1p2 – Majiayao phase; 1p3 – Banshan phase; 1p4 – Machang phase; 1q – late Yangshao culture; 1r – Liangzhu culture; 1s – Qujialing + Shijiahe cultures; 1t – Qujialing culture; 1u – Miaodigou II culture; 1v – Tanshishan culture; 1w – late Neolithic; 1x – Niubishan culture; 1y – Longshan culture; 1z – Shijiahe culture; 1za – Huangguashan culture; 1zb – Qijia culture; 1zc – Hulushan culture; 2 – undistinguished Bronze Age cultures; 2a – Yueshi culture; 2b – Siba culture; 2c – Kayue; Xindian and Nuomuhong cultures; 2d – Xindian culture; 2e – Huangtulun culture; 2f – Fubin culture; 2g – Siwa culture; 2h – Baizhuduan culture; 2i – Shajing culture; 3 – undistinguished Xia-Shang-Zhou dynasty period; 3a – Xia dynasty period; 3b – undistinguished Xia-Shang dynasty period; 3c – undistinguished Xia-Shang-Western Zhou dynasty period; 3d – undistinguished Xia-Shang dynasty-Chunqiu period; 3e – Shang dynasty period; 3f – undistinguished Shang-Western Zhou dynasty-Chunqiu period; 3g – undistinguished Shang-Zhou dynasty period; 3h – undistinguished Shang-early Western Han dynasty period; 3i – undistinguished late Shang-late Western Han dynasty period; 3j – Zhou dynasty period; 3k – Western Zhou dynasty period; 3l – Eastern Zhou dynasty period; 3m – Chunqiu period; 3n – Zhanguo period; 4 – undistinguished Bronze Age–early Iron Age cultures; 4a – undistinguished late Neolithic–early Iron Age cultures.
For consistency, the current study follows the methodological approaches applied in the initial work on northern China (Wagner et al., 2013). In order to map the archaeological sites and analyse the spatiotemporal distribution patterns, a digital regional base map with a Cartesian (unprojected) coordinate system, based on the World Geodetic System 1984 (WGS 84), was created using ArcGIS Desktop v10.2 (Environmental Systems Research Institute, 2013). This map contains topographic information based on SRTM digital elevation data (Jarvis et al., 2008) and the administrative boundaries, major rivers and cities available from the China Historical Geographic Information System (CHGIS, 2007) project. For the administrative boundaries, the provided shape-file was modified from polygon to line format, the boundaries of the coastline deleted and the country boundaries replaced with the spatial data from the Global Administrative Areas Project (http://www.gadm.org). Next, the base map (Figure 1b) was loaded into Map-Xplore software (Hosner et al., 2009; Wagner et al., 2013), which facilitates the process of assigning geographical coordinates to the sites shown on the analogue provincial/regional maps published in the atlases.
The atlas maps were scanned at high resolution to produce digital map images, which were then georeferenced using the open source geographic information system Quantum GIS (Hugentobler, 2008) and ArcGIS Desktop v10.2 (Environmental Systems Research Institute, 2013). Each georeferenced map image was loaded as a new layer into Map-Xplore and geographic coordinates were automatically determined for every archaeological site. Absolute age determination (as provided in the respective atlas), expressed in calendar years BC, was consistently assigned to each site. For the Neolithic and Bronze Age period of Fujian province, the respective atlas only provides a provincial map without visual differentiation of the periods. To make the data analysable, it was necessary to select the Neolithic sites by using the county maps of Fujian published in the atlas. Furthermore, the atlas text does not give proper chronology for all sites, so the age determination was assigned on the basis of additional published data (Chang, 1989; Chen, 2002; Jiao, 2007; Lin, 2012). This information stored in xml files was then ready for use with external drawing or analytical software. It can also be found in the open access PANGAEA Data Publisher for Earth & Environmental Science (https://www.pangaea.de/).
Results
In this paper, a total of 51,074 archaeological sites from 25 administrative units in China (Figure 1b), representing 27 regions (Figures 2 and 3), were analysed. Figure 2 demonstrates substantial differences between the analysed regions in the absolute number of sites and the time span of archaeological records. Thus, the areas of Shandong and Shaanxi provinces (Figure 1b) reveal the highest number of sites, that is, 7134 and 6267, respectively, followed by eastern Inner Mongolia (5885 sites) and Shanxi (4611 sites). By contrast, Tianjin City (124), Beijing City (180) and Chongqing City (189) have the smallest total number of archaeological sites. Of all the analysed regions, Tianjin and Beijing municipalities have the smallest area, which is also largely covered by multi-layered structures from historical and modern times. Therefore, prehistoric sites are poorly preserved. The picture changes when sorting individual regions according to the relative density of archaeological sites. Desert and/or mountainous regions (Xinjiang, Tibet, Yunnan) demonstrate lowest site densities (less than 1 site per 1000 km2), while coastal Shandong reveals the highest density (c. 45 sites per 1000 km2) followed by Shaanxi (c. 30 sites per 1000 km2). In general, regions with a better water supply and fertile loess soils in eastern and central China reveal higher densities compared with the dry western and densely forested southern regions and regions with mountainous terrain.

Quantitative changes in the number of archaeological sites (numbers in italic) across the analysed provinces and regions along with the cultural and chronological sequences. For the numbered culture names see Figure 2 caption. Black triangles indicate representative time slices chosen for mapping (Figure 4).
Temporal changes observed in the number of archaeological sites across the 11 provinces and autonomous regions of northern China (Wagner et al., 2013) allowed selecting six characteristic time slices representing early–middle Neolithic (c. 4250 BC), late–middle Neolithic (c. 3750 BC), late Neolithic (c. 2350 BC), early Bronze Age (c. 1750 BC), Western Zhou dynasty (c. 850 BC) and Eastern Zhou dynasty (c. 650 BC) periods of Chinese prehistory (Liu and Chen, 2012). Time slices ending with 50 were selected for practical reasons, in order to avoid formal boundaries between the archaeological and cultural units (i.e. ending with 00; see Figure 2 for details). The maps created for each of these time slices (Figures 4–6) allow for the identification and comparison of spatiotemporal patterns in the distribution of archaeological sites across China; patterns are described and discussed in the section below.
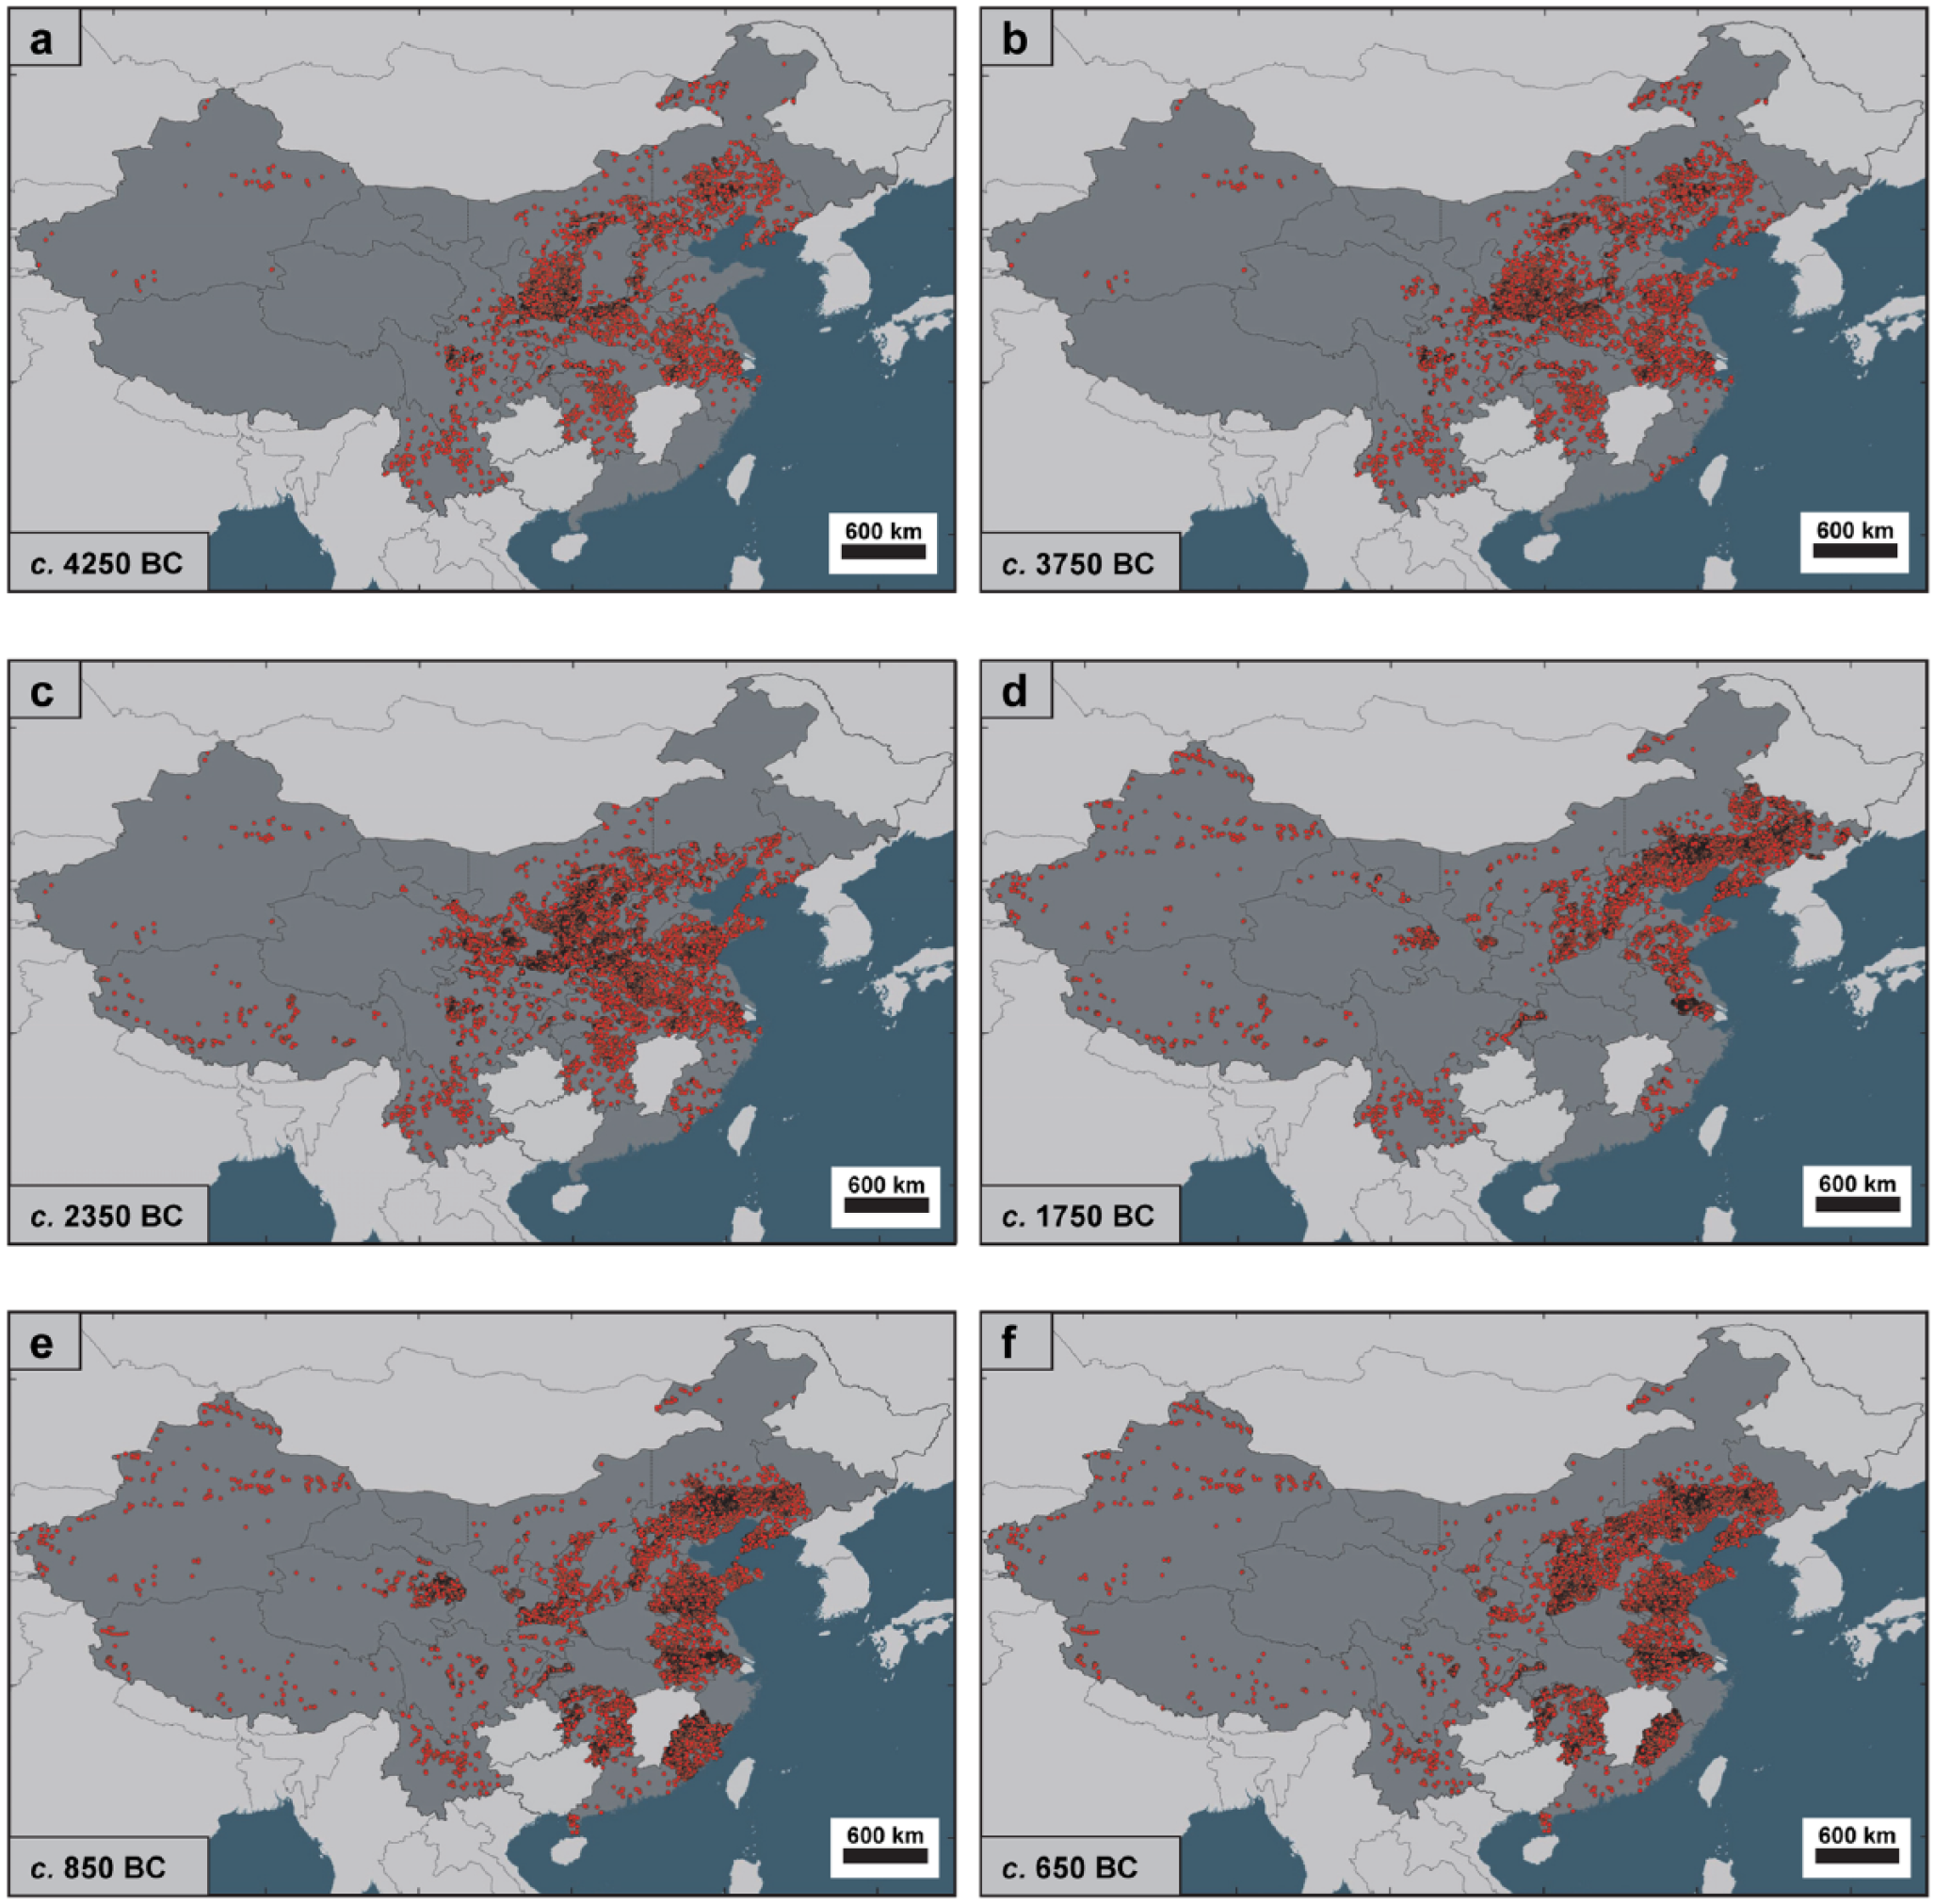
Maps showing distribution of archaeological sites at selected representative time slices: (a) c. 4250 BC, (b) c. 3750 BC, (c) c. 2350 BC, (d) c. 1750 BC, (e) c. 850 BC and (f) c. 650 BC.
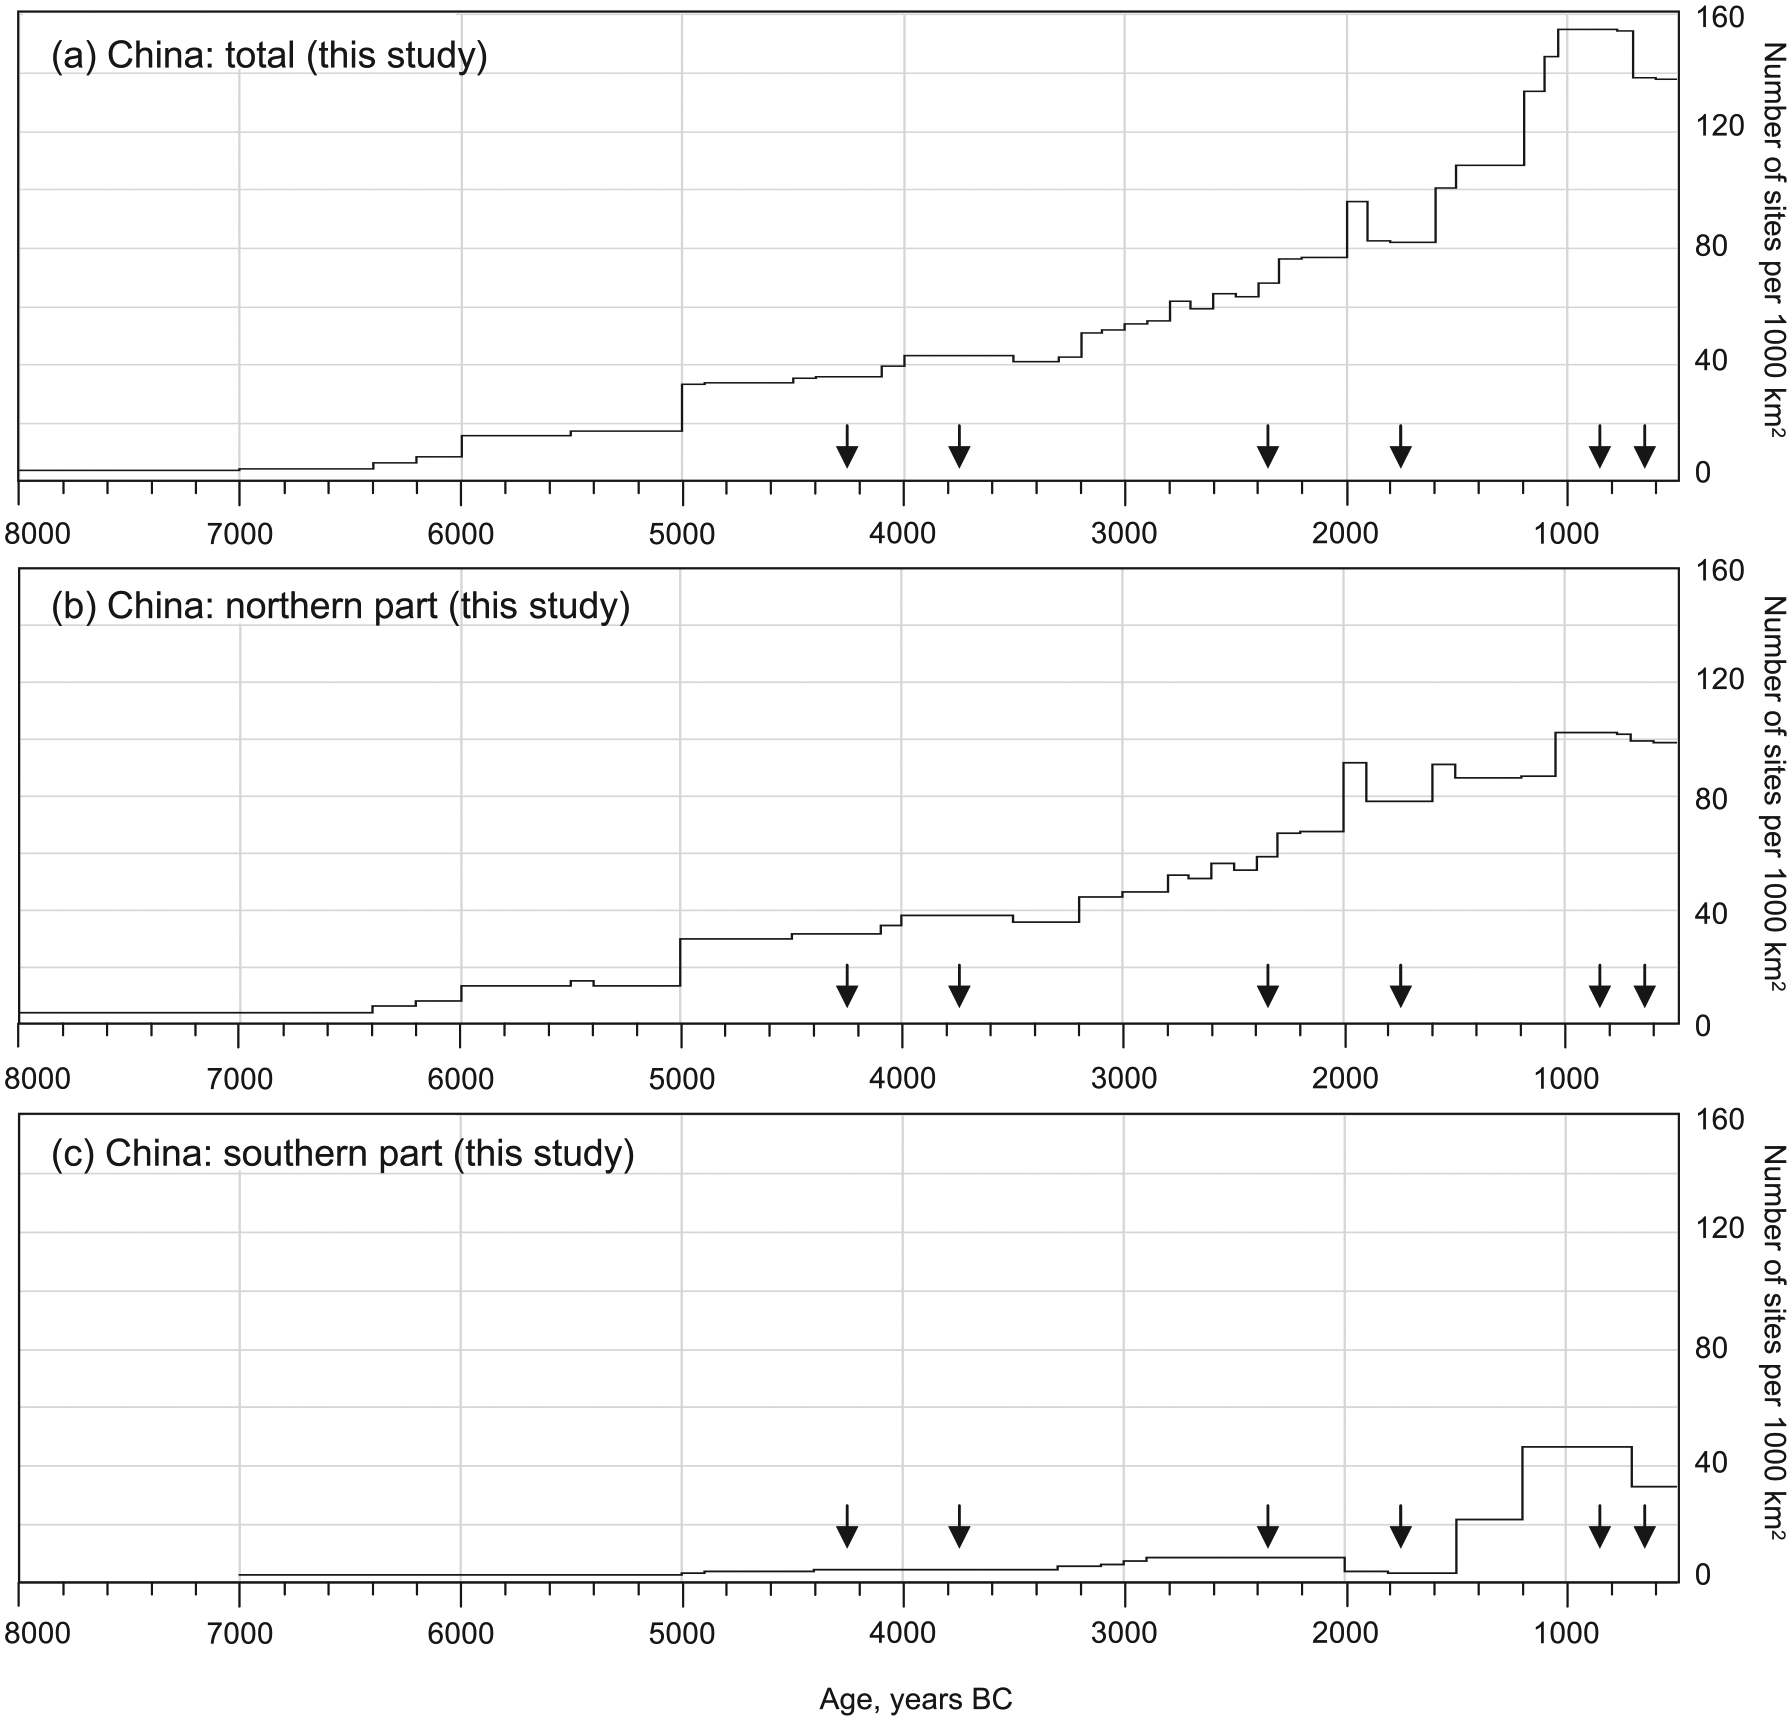
Density average estimates for the archaeological sites (number of sites per 1000 km2) analysed in this study, calculated for (a) the whole area of continental China, (b) northern China and (c) southern China. Black arrows in (a)–(c) indicate time slices chosen for mapping in Figure 4.
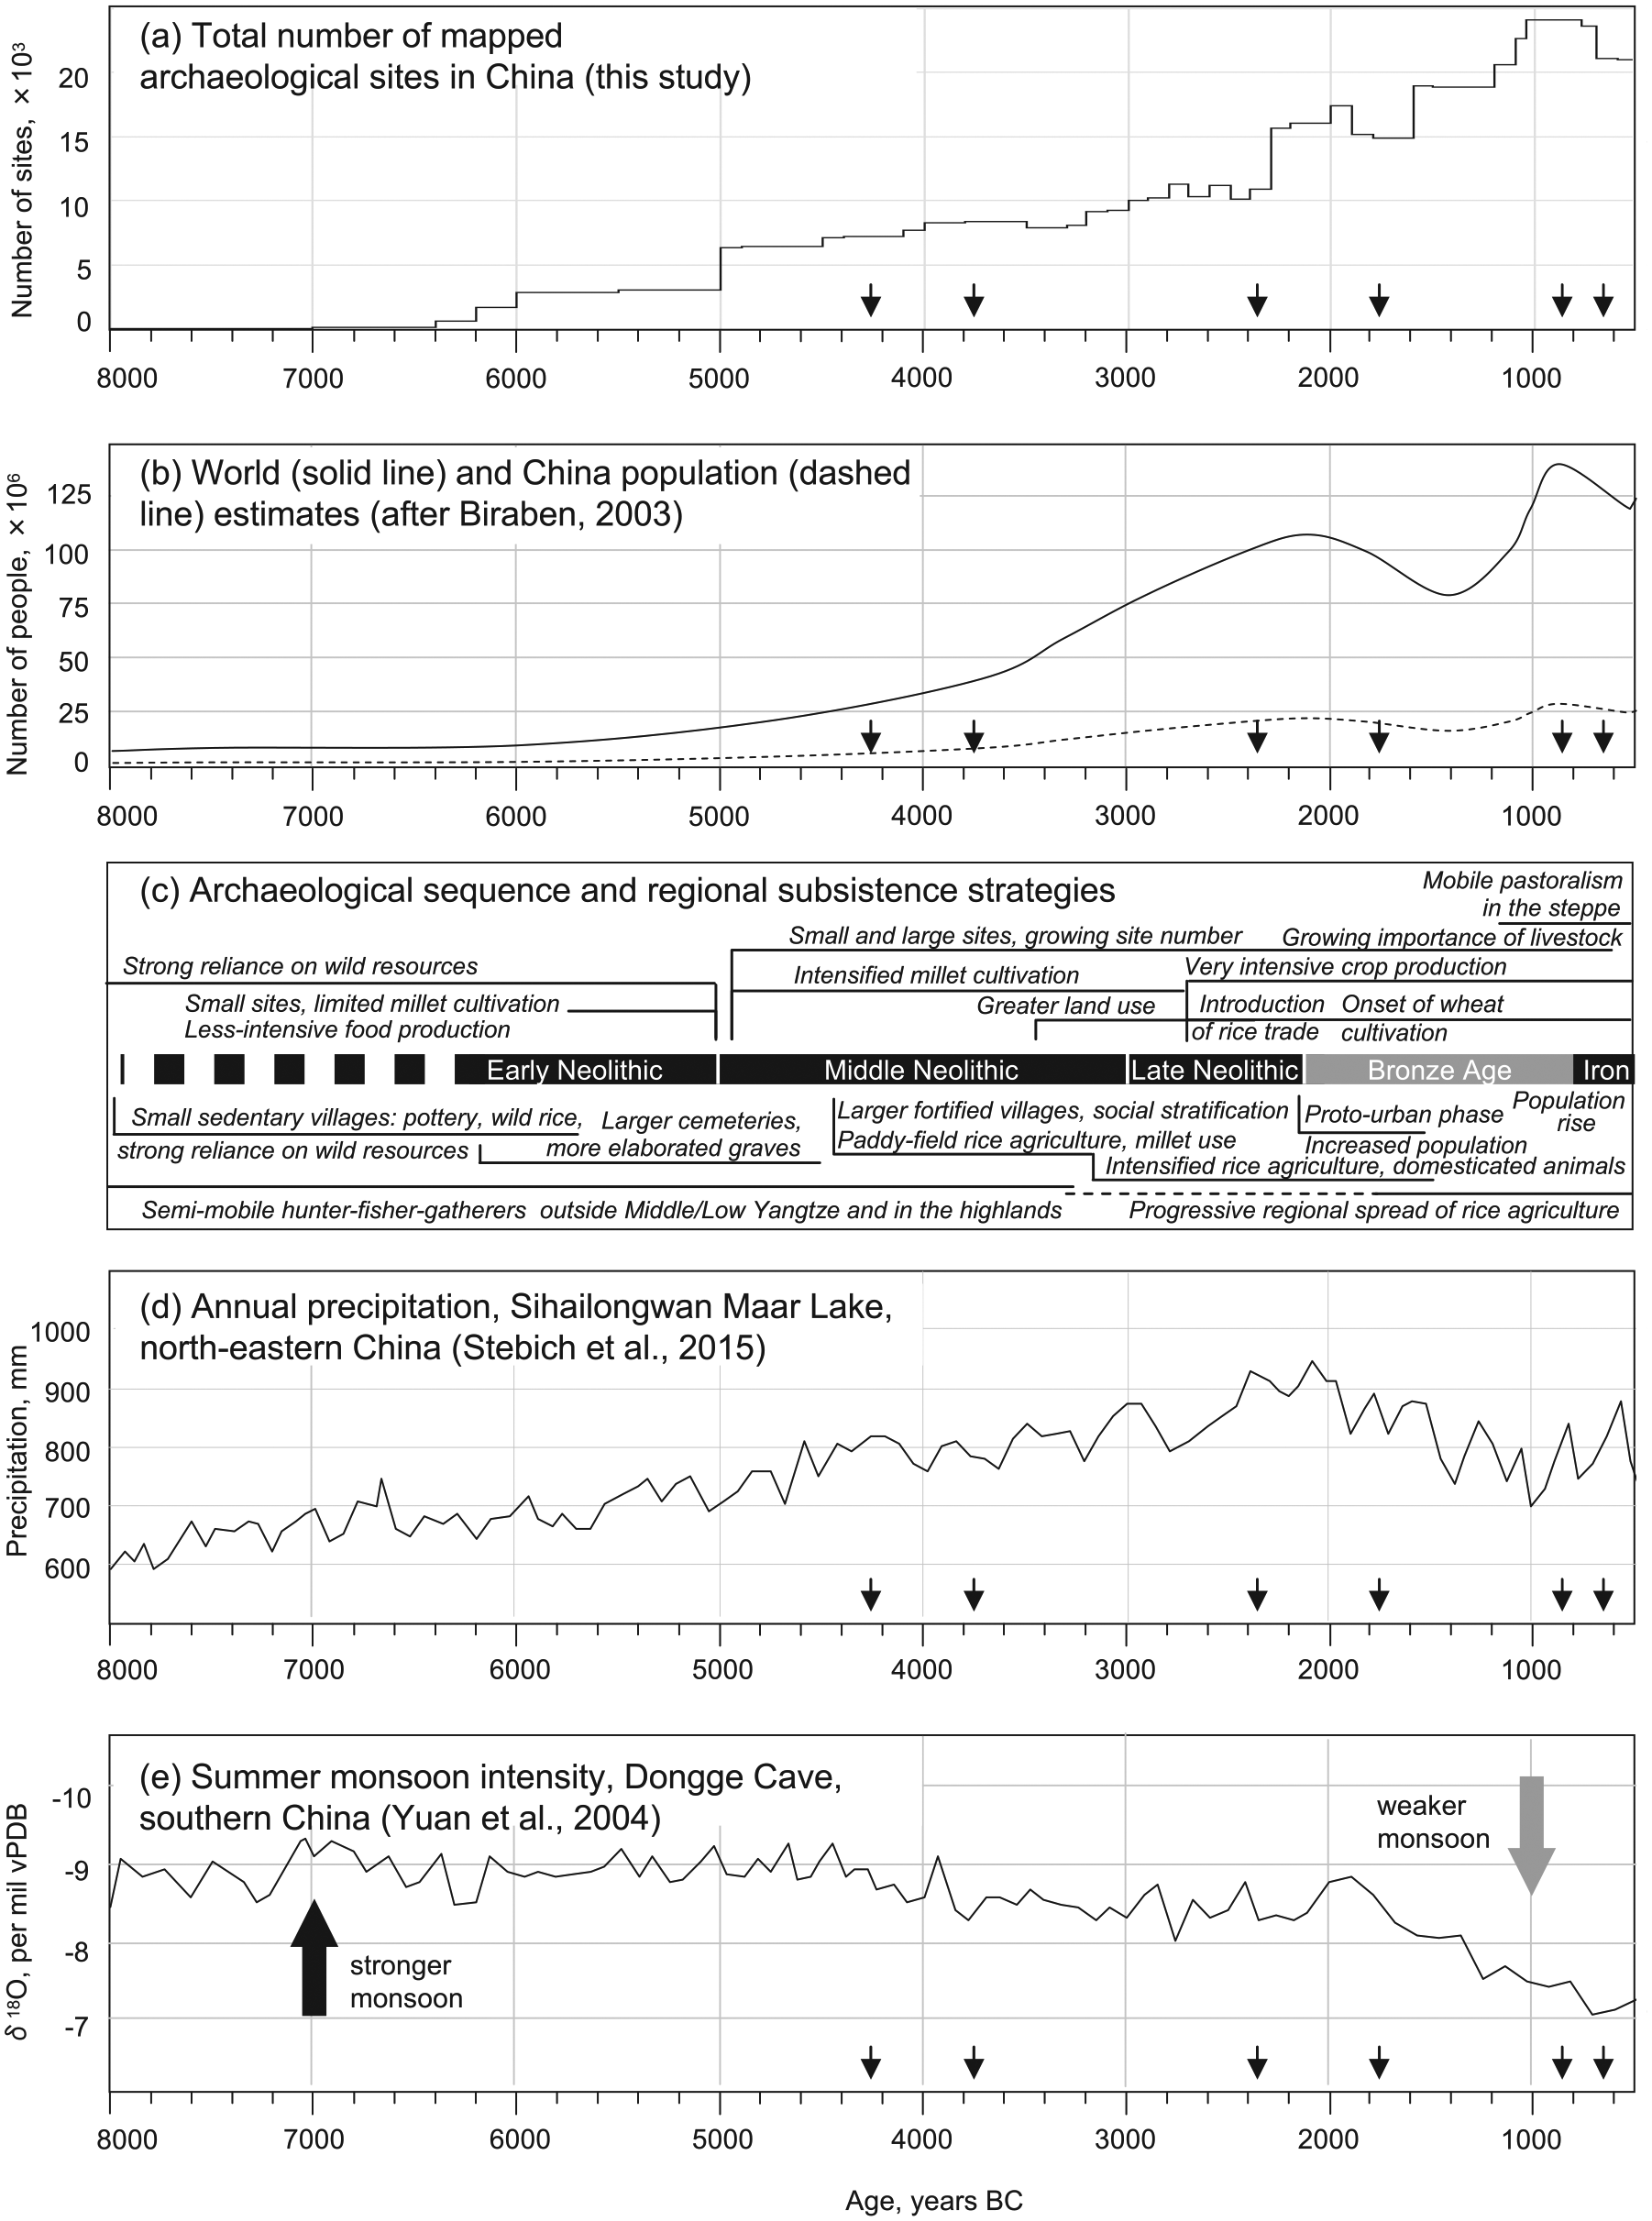
Summary of the records discussed in the text: (a) changes in the number of mapped archaeological sites in China between c. 8000 and 500 BC (this study); (b) solid line indicates changes in the world human population (after Biraben, 2003) and dashed line indicates population estimates for the area of China, roughly representing c. 20% of the world population; (c) archaeological and archaeobotanical evidences of changes in subsistence from predominantly hunting and gathering to intensive food production in northern (upper panel) and southern China (lower panel) (after Cohen, 2014; Lee et al., 2007; Wagner and Tarasov, 2014); (d) pollen-based monsoon precipitation reconstruction from Sihailongwan Maar Lake (after Stebich et al., 2015); and (e) oxygen isotope record from the Dongge Cave stalagmite D4 indicating changes in summer monsoon activity (after Yuan et al., 2004). Black arrows in (a)–(e) indicate time slices chosen for mapping in Figure 4.
Discussion
Early Neolithic
The Neolithic of northern and central China is better known because of a longer history of research (see Liu and Chen, 2012; Wagner and Tarasov, 2014 for details and references). However, with new discoveries and intensive archaeological exploration of southern China in recent years, the gap is rapidly filling (Cohen, 2014 and references therein). Ongoing archaeological research primarily focuses on the onset of the Neolithic, origins of pottery, agriculture and sedentary life, social complexity and population dynamics. The earliest Neolithic cultures appeared in China after a long but poorly understood transitional period. Although pottery dated to c. 18,000–17,000 BC was found in Xianrendong Cave, China’s Jiangxi Province (Wu et al., 2012), it required about 8000–10,000 years until the late Palaeolithic hunter–gatherer groups in the areas of the middle and lower Yangtze established the earliest known villages between c. 10,500 and 7000 BC (Cohen, 2014). However, a considerable amount of evidence suggests that inhabitants of these villages and associated cultural assemblages, which are recognised as the earliest ‘Neolithic’ cultures, continued their hunter–gatherer lifestyle several millennia, until domesticated animals (e.g. dogs and pigs) and cultivated plants (e.g. rice in the south and millet in the north) started to play a role as an important food resource. These very early dates and sites are not reflected in the Atlas of Hunan Province (Guojia Wenwuju, 1997) and only tentatively in the Atlas of Zhejiang Province (Guojia Wenwuju, 2009 c).
Middle Neolithic
Site distribution maps representing two selected middle Neolithic time slices, c. 4250 BC (Figure 4a) and c. 3750 BC (Figure 4b), reveal a high concentration of archaeological sites assigned to the Yangshao culture (Liu and Chen, 2012) in Shaanxi and Henan provinces, including the Wei River valley, the Guanzhong Basin around the modern city of Xi’an, and the Wei and Yellow River confluence (Figure 1). This feature, already pointed out by Wagner et al. (2013), supports the traditional view that this area was the centre of Neolithic development in northern China and supports the initial trend towards larger population sizes (Biraben, 2003; Chang, 1986). Earlier substantial population growth and the development of greater social complexity were confirmed by detailed archaeological survey (Liu et al., 2002–2004) performed in the Yiluo River basin in Henan province. Li et al. (2009b) also reported that cereal crop cultivation was intensified and charcoal concentrations increased between c. 5700 and 3500 BC in the Guanzhong Basin, which they interpreted as the expansion of human populations and agricultural activities in the region. Li et al. (2013b) discussed the relationship between the spatiotemporal distribution of the Neolithic sites and the geographic context further south, in the Hanjiang River (left tributary of Yangtze) area of southern Shaanxi, and pointed out a marked increase from 19 early Neolithic Laoguantai culture sites to 126 Yangshao sites. This sixfold increase in site numbers corroborates the high numbers recorded in northern Shaanxi and Henan (Figure 4a and b). Nevertheless, southern Shaanxi, belonging to the middle Yangtze drainage, with only 6% of the Yangshao sites for the whole Shaanxi province, remained distinctively less populated compared with the northern areas (Li et al., 2013b).
For some regions, the provided information does not allow for detecting differences between the two selected time slices (Figure 4a and b) because the Neolithic has not been subdivided into finer cultural units there (Figure 3). However, differences in site numbers between the regions are noticeable. Abundant archaeological sites occur in northern China, including central and eastern parts of Inner Mongolia and Liaoning. Wagner et al. (2013) noted that the sites are distributed in lines and small clusters in the foothills of the Yin Shan, the Greater Hinggan Mountains and along the Xar Moron, Xiliao and Laoha Rivers (XM, XL and LH in Figure 1a), that is, in those environments, which provide diverse wild plant and animal resources and enough fresh water for agriculture. The high number of sites assigned to the early and middle Hongshan culture (c. 4700–3700 BC: Guojia Wenwuju, 2003; Wagner and Tarasov, 2014) in Inner Mongolia and Liaoning has been interpreted as a sign of complex chiefdom communities (e.g. Drennan and Peterson, 2008; Peterson et al., 2010; Shelach, 1999). In comparison with the northern and central parts of China, east of 100°E, the regions south of the Yellow River/Yangtze River watershed reveal noticeably fewer archaeological sites. The majority of the middle Neolithic sites are concentrated in the Sichuan Basin, along the mountain valleys of Yunnan, in the middle Yangtze region of modern Hunan province (Lin, 2012) and in the coastal areas of Jiangsu province. All these regions are characterised by relatively mild climates supporting dense warm-temperate forest vegetation (Zheng et al., 2014) and they provide its inhabitants with variable wild plant and animal resources. High mountain and desert regions of China, west of 100°E, show either no sites (e.g. Tibet) or very low site numbers (e.g. Xinjiang, Gansu, Qinghai). Archaeological sites are concentrated in the foothill environments of the Kunlun Shan and Tian Shan, the most suitable environments for people, providing rich hunting grounds and access to rivers and terminal lakes, fed by mountain snow and glaciers.
Only a few regions provide archaeological data for the middle Neolithic time slices with higher temporal resolution (Figure 3). In Shanxi and Shaanxi provinces, an increase from 26 and 159 sites, respectively, at 4250 BC (Figure 4a) to 387 and 341 sites at 3750 BC (Figure 4b) marks a transition from the early Yangshao culture to the middle Yangshao culture and an expansion from south to north within the Taihang Mountains (Wagner et al., 2013). In Shandong, numbers also increase from 26 sites attributed to the Beixin culture, located southeast (majority of sites) and north (few sites) of the Yimeng Mountain area, to 563 sites of the Dawenkou culture, advancing into the mountainous region and along the coastline of the Shandong peninsula. In both cases, an observed 15- to 20-fold increase in the number of sites and the area that people occupied parallels the development of social stratification, a complex ritual system and technological innovation (e.g. Allard, 2002; Luan, 1997; Wagner, 2009; Wagner et al., 2013). Similar trends can be traced outside the so-called core area of imperial China, suggesting that observed changes are of extra-regional, rather than local, importance. For example, in Qinghai province, on the north-eastern edge of the Qinghai–Tibet Plateau (Figure 1), the increase is most obvious, with no sites shown on the 4250 BC map (Figure 4a) to 43 sites on the 3750 BC map (Figure 4b). These sites assigned to the Majiayao culture are concentrated in the river valleys, showing the intensified occupation of the elevated areas east of Lake Qinghai at a later stage of the middle Neolithic (Dong et al., 2012, 2013a; Han, 2008; Wagner et al., 2013). The archaeobotanical data from the central part of China (Ruddiman et al., 2008) also demonstrate an increase in the number of new rice-cultivating sites in the middle and lower reaches of the Yangtze River basin after c. 4000 BC compared with the number of sites reported prior to this date.
Late Neolithic and early Bronze Age
Comparison between the late Neolithic (Figure 4c) and early Bronze Age (Figure 4d) time slices demonstrated noticeable changes in site numbers and distribution patterns in the northern part of China. Calculations of site densities per 1000 km2 performed in the current study (Figure 5a) support the conclusions of Wagner et al. (2013) and show an increase from c. 30 sites per 1000 km2 at about 3750 BC to c. 45 sites per 1000 km2 by 2350 BC, and to c. 80 sites per 1000 km2 by 1750 BC in northern China (Figure 5b). Higher resolution data from the late Neolithic period, from Gansu, Qinghai, Shanxi, Shandong, Henan and Hubei, provide a more complex picture of the regional level, expressing partly opposing trends.
In Qinghai province, the numbers first drop from 198 sites 3000–2500 BC (Majiayao phase of Majiayao culture) to 49 sites 2500–2200 BC (Banshan phase of Majiayao culture) before a rapid increase to 307 sites 2200–2000 BC (Machang phase of Majiayao culture) (Figure 3). The Majiayao culture also extended over Gansu province, but in the Gansu atlas, no counts are provided for the sub-phases. However, a count of Majiayao, Banshan and Machang phase sites distributed in the valleys of the upper Yellow, Huangshui, Tao, upper Wei, Zuli and Bailong Rivers performed by Dong et al. (2013b) based on county maps in the Atlas of Chinese Relics of Qinghai and Gansu provinces (Guojia Wenwuju, 1996, 2011) confirms the trends observed on a provincial scale in Qinghai. First, the site numbers decreased from 706 sites (Majiayao phase) to 344 sites (Banshan phase) then increased to 787 sites (Machang phase) (Dong et al., 2013b). In the same study, a high ratio of farming to hunting tools was used to conclude that agriculture was the primary subsistence strategy during the Machang phase. Furthermore, the authors correlated the wet climate with the rapid intensification of agriculture and the spread of Machang sites and people further west into the Hexi Corridor and ultimately to eastern Xinjiang where they encountered ‘the cultures from West Asia and South Siberia around 4000 cal BP’ (Dong et al., 2013b quoting Li, 2009). The same team (Dong et al., 2013a) also reported an opposite trend found in the upper Yellow River area (i.e. between Guide and Minhe counties of Qinghai province). There, the number of sites dropped from 67 (early–mid Majiayao culture) to 25 (late Majiayao culture), thus confirming the theory that Machang (i.e. late Majiayao culture) sites were mainly distributed in the lower Huangshui valley region and not represented in a comparably high density along the upper Yellow River (Dong et al., 2013a).
In the upper and lower Wei River areas, and particularly in the middle and lower Yellow River area (Gansu, Shaanxi, Shanxi, Henan and Shandong province), a major increase in site density during the third millennium BC is visible (Figure 3). Between 3000 and 2000 years BC, the number of sites in Shaanxi rose by c. 10%; in Gansu and Henan, the numbers nearly doubled; in Shanxi, they tripled; and rose by 2.5 times in Shandong. This dramatic increase, first noted by Chang (1986), was verified for different regions and frequently discussed in terms of growing societal complexity, the onset of Chinese civilisation, early statehood and the development of large urban (partly fortified) centres of multi-tiered settlement clusters (e.g. Cohen and Murowchick, 2014; Liu, 2004; Wagner and Tarasov, 2008), or correlated with the incorporation of West Asian domesticates and bronze metallurgy into the existing subsistence and technological systems (e.g. Han, 2008; Liu and Chen, 2012; Yuan et al., 2008). Barton and An (2014) applying a diffusion model of innovation, developed by Rogers (2003) and tested for different archaeological phenomena by several authors (for references see Barton and An, 2014), onto the chronology of the introduction and spread of wheat (Triticum aestivum) in China concluded that ‘the widespread appearance of wheat from 4600 to 4200 BP suggests a rapid diffusion over a large area in roughly 400 years’ (p. 790). Simultaneously, other cultigens were also available in northern China including barley (Hordeum vulgare) and possibly oats (Avena sativa) introduced from western Asia, as well as broomcorn (Panicum miliaeceum) and foxtail (Setaria italica) millet and rice (Oryza sativa) domesticated in eastern China, as exemplified for instance at the Xishanping site in the upper Wei River (Li et al., 2007), indicating an unprecedented agricultural boom.
Only one area in southern China shows a comparably dramatic trend, namely, the tripling of site numbers during the third millennium BC, like in Shanxi province. This is Zhejiang province at the lower Yangtze River, even though the absolute number of the registered sites in Zhejiang is much lower (Figure 3). The highest rate of increase in the number of sites in these two areas corroborates with the conclusions of Liu and Chen (2012), notably that the Taosi culture in Shanxi and the Liangzhu culture in Zhejiang ‘represent the most developed complex societies during the third millennium BC in China’ (p. 251).
The only other area in southern China for which the atlas (Guojia Wenwuju, 2002a) provides Neolithic site numbers distinguished by cultures is Hubei province (middle Yangtze River area). The increase in site density before c. 2000 BC (by c. 2.6 times; Figure 3 1z) is comparably high and reflects the development of the Shijiahe culture into a complex society with proto-urban settlements (Cohen, 2014; Flad and Chen, 2013). It was culturally closely related to contemporary developments in Zhejiang, Henan and Shandong provinces.
The abrupt change in the number of sites around or shortly after c. 2000 BC – decline in some areas and growth in others – was discussed by Wagner et al. (2013). Summarising the results of our site counts for the now available data from 27 regions, the trends can be substantiated as follows (Figure 3):
The increase in site number (in ascending order of their ratio of change from 2- to 15-fold growth): Beijing City (from 63 to 117 sites), Qinghai (from 307 to 595), Tianjin City (from 8 to 18), Hebei (from 440 to 1276), Chongqing City (from 48 to 141), eastern Inner Mongolia (from 1103 to 4782), Xinjiang (from 44 to 153), Jiangsu (from 270 to 1797), Liaoning (from 219 to 3356) and coastal Fujian (from 2 to 31). In Jilin (from 0 to 1187 sites) the time slice of 2000 BC marks the onset of habitation according to the respective atlases (Guojia Wenwuju, 1993, 2010b). The general provincial trend for Qinghai has been corroborated recently for the upper Yellow River region by Dong et al. (2013a), who documented a growth in the number of sites from the late Majiayao culture (25 sites) to the Qijia culture (c. 4100–3600 BC, 93 sites).
The decrease of site number (in ascending order of their ratio of change falling from one-third to a 1/20th part from preceding numbers): Shanxi (from 1073 to 372), Shandong (from 1409 to 314), Ningxia (from 483 to 84), central Inner Mongolia (from 437 to 97), Gansu (1200 to 49), Zhejiang (from 180 to 3), Shaanxi (from 2204 to 11), Henan (from 1248 to 0) and Hubei (from 345 to 0 sites).
Additionally, in regards to the decline in the number of archaeological sites in the Wei River valley and in the middle and lower Yellow River region around c. 2000 BC, the current study shows that also the middle and lower reaches of the Yangtze (i.e. Hubei and Zhejiang provinces) shared the same fate (i.e. habitation collapse) as their northern neighbours.
Habitation developments in Sichuan, Tibet, Yunnan, Hunan, Fujian and Guangdong show different chronological dynamics (Figure 3). A recent study by D’Alpoim Guedes et al. (2014) on seeds from the Ashaonao site in highland western Sichuan (eastern Tibetan Plateau) proved that wheat, barley and flax became staple crops in the region c. 1400 BC. The introduction of these crops replaced the millet-pig based subsistence and also the rice-millet systems in Yunnan and facilitated the spread of humans to higher altitudes.
The archaeological data demonstrate that site numbers and densities remain comparably low and almost unchanged in the southern part of China (Figure 5c) through the middle and late Neolithic and early Bronze Age interval (Figure 4a–d), thus contrasting with the results from northern China (Figure 5b). A new pollen and charcoal record from the Lantianyan peat bog (28°26.040′N, 119°18.849′E; 902 m a.s.l.) in Zhejiang province of southeast China (Ma et al., 2016) demonstrates that human-induced change in the regional broadleaved evergreen forest was negligible prior to c. 1700 BC. Intensive human activity and forest clearing are first recognised by a noticeable increase in charcoal particles at around 1650 BC, followed by a major drop in arboreal pollen percentages and a parallel increase in grass pollen percentages, likely reflecting a transition to rice-paddy agriculture in the study area (Ma et al., 2016).
In central and northwest Europe, the initial farming boom was followed by population declines of 30–60% (Hinz et al., 2012; Shennan et al., 2013). Although the picture in China is different, insofar as the food production boom resulted from the development of a complex agricultural system combining multiple, that is, indigenous and nonindigenous domesticated cereals and animals, it is nevertheless followed by a population decline comparable with that observed in Europe. Shennan et al. (2013) dismissed a direct relationship between climatic and demographic trends, but instead suggest endogenous causes for the European prehistoric demographic bust by comparing the degree of population decline with losses of human lives caused by the medieval big plague outbreak (Black Death) 1347–1351 AD. The applicability of this hypothesis to the Chinese context will be discussed in the following paragraphs.
Western and Eastern Zhou
The c. 850 BC (Figure 4e) and c. 650 BC (Figure 4f) time slices represent archaeological site distribution patterns during the Western Zhou (1045–771 BC) and Eastern Zhou (770–221 BC) dynastic periods, respectively. The time interval reflects the highest numbers and densities for the registered archaeological sites across the whole of China (Figure 5a), with the most pronounced changes registered in its southern portion (Figure 5c). In the south, a two-step increase is registered, that is, from c. 3 sites per 1000 km2 prior to 1500 BC to c. 22 sites per 1000 km2 after this date and, furthermore, to c. 47 sites per 1000 km2 by c. 1200 BC. This major increase through the whole record in southern China postdates a comparable (though more distinct) increase in site number and density in northern China (Figure 5b) by at least 500 years. On the large scale, the c. 850 BC time slice (Figure 4e) demonstrates the highest number of archaeological sites across northern and southern China during the Western Zhou (1045–771 BC) period, reaching maximum values (c. 148 sites per 1000 km2) shortly before the end of the dynasty (Figure 5a). The onset of the Eastern Zhou (770–221 BC) is marked by a decrease in archaeological site densities, more pronounced in the southern part of China (Figure 5c).
Finer chronologies available for the Shaanxi, Shanxi and Gansu territories allow a more detailed discussion of the registered changes along the Western to Eastern Zhou transition. In Shaanxi, 1008 Western Zhou sites were counted but only 768 Eastern Zhou sites (Figure 3). Wagner et al. (2013) concluded that the decrease in site number with the onset of the Eastern Zhou becomes even more pronounced if only the clearly defined 133 sites of the Chunqiu period (770–476 BC) are considered (Figure 3). In the area of Gansu, the decrease from 115 to 14 archaeological sites is also evident. A reverse trend appears in Shanxi, where the number of sites increases from 134 during the Western Zhou to 1680 during the Eastern Zhou (Wagner et al., 2013). In neighbouring Henan, the number of sites also increased from 11 (Western Zhou) to 57 (Eastern Zhou), as documented by the Yiluo River Valley Archaeology Project (Liu et al., 2002–2004).
Historical data on the development of the Zhou dynasty, which evolved on the territory of modern-day Shaanxi province (Shaughnessy, 1999), are helpful for the evaluation of the registered changes in archaeological records. It is known that the power centre of Western Zhou was moved east from its original location near modern Xi’an in Shaanxi to the modern city of Luoyang in Henan province in about 770 BC because of the pressure of nomadic tribes advancing from the western and northern steppe regions into the Guanzhong Basin (Von Falkenhausen, 1999). After the relocation of the capital, the Zhou dynasty became increasingly fragmented, breaking into several rival local states in the region between the Guanzhong Basin and the Yellow Sea coast.
One of the satellite states of the Eastern Zhou was Hua (c. 678–627 BC) located in the Yiluo River basin in Hunan. The high number of archaeological sites is related to the settlement cluster around the Hua capital (Liu et al., 2002–2004). On the territory of present-day Shanxi province, the states Wei and Zhao evolved and the state Yan centred near modern city of Beijing expanded (Lewis, 1999), thus explaining the significant amount of new sites registered there (Wagner et al., 2013). Furthermore, in the eastern part of Inner Mongolia, c. 1000 sites of the Upper Xiajiadian culture (c. 1200–500 BC) registered in Guojia Wenwuju (2003) and 944 collection units reported for the Chifeng area by Shelach et al. (2011) reflect still more numerous inhabitants and likely represent the northern pastoral neighbours of Yan (Psarras, 1999).
The appearance of archaeological sites west of Lake Qinghai on the Western Zhou map (Figure 4e) represents Bronze Age settlements and graves of the Nuomuhong and Kayue cultures and also belong to the agro-pastoral communities living along the southern margins of the Qaidam Basin (Xu et al., 2003) and in the Kunlun Mountains (Wagner et al., 2011). The disappearance of these sites prior to c. 650 BC (Figure 4f) is in accordance with previously proposed climate-driven changes (Kleinen et al., 2011; Stebich et al., 2015) in land-use and subsistence strategies, whereas people in the region directed their economy more towards a mobile pastoral lifestyle in the arid and semi-arid parts of central and eastern Asia during the first millennium BC (Wagner et al., 2011, 2013). The emergence of pastoral nomadism along the northern and western periphery of sedentary China, the eastward shift of the Chinese agricultural states and the spread of advanced bronze and iron smelting as well as rice cultivation to Korea and further into the Japanese archipelago (Barnes, 1993) are all interrelated facets of the same story (Wagner et al., 2013) clearly illustrated in Figures 4e and f.
Archaeological site numbers in comparison with population dynamics, subsistence strategies and climate change
Reconstruction of prehistoric habitation patterns in China is an important step towards understanding past human activities, to evaluate human impact on the environment and climate and to discuss human–environment interactions at regional and global scale. In turn, a number of working hypotheses can be tested comparing the spatiotemporal distribution patterns of archaeological sites in China against high resolution and the most up-to-date archaeological and environmental data.
The use of archaeological data to estimate population numbers during prehistory has both pros and cons. Although increased/decreased numbers and densities of archaeological sites are often interpreted in terms of population growth/decline (e.g. De Menocal, 2001; Leipe et al., 2014; Madella and Fuller, 2006; Wagner, 2006), caution is required in each particular case (Ruddiman et al., 2008). China is the best known example of a remarkable set of censuses dating from the start of the ‘common era’ (Biraben, 2003; Cartier, 2002), although we are not aware of prehistoric population estimates for its territory. However, comparison of the estimated world population (Figure 6b; Biraben, 2003), with the archaeological site numbers obtained in this study (Figure 6a), shows rather similar trends in both curves, suggesting a possible correlation between number/density of archaeological sites and prehistoric population numbers. The 2008 census showed that China’s population of 1333 million people represents c. 20% of the world population. Extrapolating this relationship to the past, we come to a population increase in China from c. 1.4 million at c. 8000 BC to about 28 million people at c. 900 BC (Figure 6b). The latter number corroborates the population estimates for China c. 800 BC based on historical records (Cartier, 2002). Bearing in mind possible uncertainties and error bars occurring in both datasets, we, however, see the opportunity to use the archaeological site distribution data presented in the current study for the rough estimation of population densities within prehistoric China and its regions.
Discussing published population trends in China during historical times (Cartier, 2002), Biraben (2003) pointed out that
periods of peace, in which the spread of technical progress and trade are easier, tend to be periods of prosperity, whereas destructive periods of war, which exacerbate severe food shortages and facilitate the spread of epidemic diseases, are frequently periods of economic and demographic decline. (p. 4)
Up to now, for a large part of Asia, including China, comparatively few studies on the health status and diseases of prehistoric populations have been carried out, although detailed palaeopathological analysis of human skeletal remains has a particularly high research potential in the western regions of China, where extremely arid environments favour the preservation of organic material (e.g. Gresky et al., 2015 and references therein). It is reasonable to assume that future palaeopathological research on excavated human remains will provide more data for comparative studies and help in the evaluation of the role of epidemics, wars and nutrition on archaeological site distributions and density (e.g. Li et al., 2013a; Wagner et al., 2011).
Research on the origin, spread and intensification of agriculture, including plant use, cultivation and domestication, has started booming in China during the past decade and already provided some very detailed and well-dated results for several key archaeological sites assigned to the Neolithic period (e.g. Cohen, 2011; Crawford, 2009; Crawford et al., 2006; Fuller et al., 2009; Wagner and Tarasov, 2014; Wu et al., 2014; Zhao, 2011; and references therein). We build our discussion on the most representative sites, in order to analyse potential impact of the subsistence trajectories and new agricultural practices on the number and densities of sites, as shown in Figures 5 and 6.
Recent archaeological research supports the idea of human occupation in the middle Yellow River valley during the late Palaeolithic and provides a wealth of data for studying the transition from the late Palaeolithic to the early Neolithic (Liu et al., 2013). The Shizitan site cluster in southern Shanxi – a province with a very high number/density of archaeological sites and a detailed archaeological record – includes more than 50 late Palaeolithic localities dating to the time interval between c. 23,000–7000 BC. All of these localities reveal archaeological features that are substantially different from the earliest Neolithic sites in the lower Yellow River valley (Wu et al., 2014), and are characterised primarily by small flaked stone tools, with no pottery, dwelling structures, human burials or storage facilities, suggesting that the occupants were still practising a mobile hunter–gatherers lifestyle (Liu et al., 2013 and references therein) well into the Holocene. This does not contradict the fact that northern China is one of the major regions where agriculture began and is home to one of the world’s longest lasting and sustained agricultural systems (Lee et al., 2007). The oldest ‘unquestioned’ evidence for fully domesticated millet in the region dates to roughly 6000 BC (Lee et al., 2007; Zhao, 2011), although wild dates have been proposed for as far back as 10,000 BC (see review of Miller et al., this issue). The date for fully domesticated rice has been pushed forward in time to roughly 5000 BC, although there is clear evidence that people were collecting it from the wild long before that (e.g. Liu et al., 2013; Wu et al., 2014; Zhao, 2011). Using archaeological and radiocarbon-dated archaeobotanical data from 26 archaeological sites, the changes in subsistence were reconstructed in the Yiluo River valley, Henan province, which belongs to the core area of the Chinese civilisation, and thus can be regarded as characteristic for the middle Yellow River region, representing northern China (Figure 6c, upper panel). Consequently, the archaeologically and archaeobotanically well studied middle Yangtze region discussed in details by Cohen (2014) is chosen as representative for southern China (Figure 6c, lower panel). A comparison of the changes shown in Figures 6a–c demonstrates that the development of agriculture and intensification and diversification of food production corroborates the major trends in the archaeological site and population numbers in both regions. It seems, however, that despite their rather early Neolithic development, the agriculturalists in the middle and low Yangtze regions remained surrounded by semi-mobile hunter–gatherer groups, living in the densely forested, swampy and/or mountainous areas south of the Yangtze River for a much longer time period than their neighbours in the north. The early appearance of well-fortified settlements with walls and moats likely served a defensive function (Cohen, 2014 and references therein).
Summarising the late Quaternary vegetation and climate of China, Winkler and Wang (1993) wrote that ‘the existence of well-developed cultures is thought to indicate more favourable climatic conditions’ (p. 232). In turn, Keightley (1999), discussing Chinese prehistory, supposed that ‘a favourable environment helps to explain the increasing prosperity of the Neolithic and Bronze Age cultures’ (p. 36). Since then, numerous publications have appeared, which addressed the Holocene vegetation and climatic changes and their potential impact on the Chinese population, anthropogenic activities, agricultural development and subsistence strategies (e.g. Bar-Yosef, 2011; Stebich et al., 2015; Wagner and Tarasov, 2014; Yancheva et al., 2007; Zhang et al., 2015; and references therein), although most of the published records are not particularly well dated and often allow controversial interpretations (e.g. see Tarasov and Wagner, 2015 for detailed discussion). Stebich et al. (2015) presented a very detailed and robustly dated reconstruction of the Holocene vegetation and climate dynamics in north-eastern China, which supports the idea of an asynchronous precipitation/humidity pattern in northern (Figure 6d; Stebich et al., 2015) and southern (Figure 6e; Yuan et al., 2004) parts of China. It seems that the first distinct increase in the archaeological site (Figure 6a) and population (Figure 6b) numbers is synchronous to the precipitation maximum in the Sihailongwan Maar Lake record from northern China (Figure 6d) and the moderately strong summer monsoon signal in the Dongge Cave D4 stalagmite record from southern China around 2500–2000 BC (Figure 6e). The following decrease in precipitation and weakening of the summer monsoons between 2000 and 1000 BC (Figure 6d and e) corresponds to the drop in site number (Figure 6a) and a declining population curve (Figure 6b) followed by a new peak around 900 BC. This peak can be traced in both northern (Figure 5b) and southern China (Figure 5c) records. However, in northern China, it coincides with a moderately high precipitation phase (Figure 6d), while southern China experiences continuous weakening of the summer monsoon (Figure 6e). Therefore, the impact of climate on the Neolithic and Bronze Age human population and archaeological site density in China is plausible, although not straightforward and unidirectional.
A comparable phenomenon was recently discussed for the Harappan culture (see Leipe et al., 2014 and references therein). This culture emerged along a long-term trend of weakening of the Indian Summer Monsoon, which, however, improved environmental stability on the Indus River alluvial plains, providing favourable conditions for agricultural activities. The Mature Harappa period (c. 2500–1900 BC) reacted to continuously decreasing precipitation by the establishment of urban centres (Possehl, 2002) and the diversification of cultivated crops (Madella and Fuller, 2006). It seems plausible that similar changes in subsistence in both South and East Asia represent successful adaptation strategies to progressive population growth (Figure 6b) and deteriorating climate conditions, which ultimately allowed persistence, and even economical and political growth, beyond the climatic optimum interval.
Recent studies of prehistoric European population genomics (Haak et al., 2015) support the long-held theory of massive migrations of people from eastern into central Europe around c. 2500 yr BC and the replacement of c. 75% of the ancestry of the early Neolithic farmers there by so-called Yamnaya steppe herders in the early Bronze Age. Another team in a more comprehensive study (Allentoft et al., 2015) traced the spread of the Yamnaya people from their place of origin north of the Caucasus around c. 3000 BC, into eastern Europe by around c. 2800 BC, but simultaneously also towards the Afanasievo culture, that is, into Central Asia and the Altai-Sayan region of southern Siberia. Both teams stress the point that cultural transformations involved human migrations. In the European context, the transformed cultural features included new concepts of family, property and personhood appearing abruptly with the early Bronze Age, which were detected in the archaeological record – mainly through funerary rites – long ago. The driving forces behind these abrupt changes however had not been understood. A research project investigating the origin of Yersinia pestis, by sequencing ancient bacterial genomes from teeth of Bronze Age humans in Eurasia (Rasmussen et al., 2015), related the above-mentioned large-scale population movements with the evolution and spread of the plague. The authors propose the possibility that plague outbreaks may have caused the population declines in the late fourth and the early third millennium BC in Europe as described by Hinz et al. (2012) and Shennan et al. (2013).
Rasmussen and colleagues found Y. pestis also in samples from the Altai-Sayan region, two samples from the Afanasievo culture (Bateni/Afanasievo Gora site, Russia) and one sample from the Andronovo culture (Kytmanovo site, Russia) dated to 2887–2677, 2909–2679 and 1746–1626 cal. BC, respectively (Rasmussen et al., 2015), proving that plague infection was endemic in Central Asia during the third millennium BC. This is roughly the same time period for which the arrival of wheat, sheep/goat, cattle (Figure 7c) and metal in the so-called Northern Zone of China (central Inner Mongolia, Ningxia, northern Shaanxi and Shanxi) has been archaeologically approved. Both Afanasievo and Andronovo cultural contexts have been regarded as possible origins (e.g. Liu and Chen, 2012; Zhao, 2011), but could not be firmly established yet.This hypothesis gains support from mitogenomic meta-analyses, which identified the Mongolian Plateau as a centre of sheep dispersal where breeds from the Middle Eastern domestication centre arrived via the Caucasus and Central Asia in two waves between c. 4800 and 2500 BC and from there were spread further south (Lv et al., 2015). Analysing changes in toolkits (increased finds of mortar-pestle for dehusking cereals) and ratios between wild and domestic (pig, dog, cattle, sheep/goat) animals in assemblages of Northern Zone sites, Liu and Chen (2012) conclude, ‘All these changes indicate a general trend towards intensive agriculture and pastoralism in the Northern Zone during the third millennium BC’ (p. 230). Massive (and numerous compared with other regions) fortifications accompanied this agricultural intensification and are commonly explained as protection against intergroup conflict related to climatic and environmental changes and population pressure (e.g. Liu and Chen, 2012). The influx of agropastoralists bringing West Asian domesticates into the eastern regions inhabited by the Neolithic farmers with traditional north Chinese millet-and-pig-based subsistence could also cause increased population pressure and tensions resulted from this process. The coexistence and mutual influence of the two systems – in archaeological terms: Keshengzhuang II culture (indigenous) and Qijia culture (nonindigenous) (Han, 2008; Wagner and Tarasov, 2014) – between the Wei River and the Ordos Plateau, c. 2500-1900 BC, resulted in an extremely high population density (Shaanxi province, 2204 sites, Figure 3; Figure 7a) indicating the exceptionally strong momentum here. If the plague – or another infectious disease – did spread into this region, the dense settlement clusters and population concentration in urban centres, in particular, would have accelerated its speedy human-to-human transmission and might have caused a pandemic throughout the closely connected societies in the Wei, middle and lower Yellow River area. In order to affect the smaller southern societies along the middle and lower Yangtze River, the disease not necessarily had to spread there. A system crash of this magnitude in the north would inevitably have seriously impacted populations in the south because of the close interconnection between social elites in both realms. Peripheral regions with low site densities did not show site/population decline. They might have become destination areas for out-migrations from the conflict- and disease-struck territories, which contributed to the documented site number increase after c. 2000 BC. Our calculations exhibit the radical north-eastern shift in high site density (more than 50 sites per 100 × 100 km grid cell) from the middle and lower Yellow River to the Liao River region sometime between 2350 (Figure 7a) and 1750 BC (Figure 7b). The Northeast China might have received populations from the Taosi culture realm in Shanxi province and the lower Yellow River which would at least partly explain the astonishing new momentum there, that is, the development of Lower Xiajiadian culture. Tian (1993) was among the first scholars who suggested that the technology of massive settlement fortifications (Figure 7c) was transmitted from the Ordos region to the Chinese Northeast.

Maps showing pronounced north-eastern shift in archaeological site densities in the areas of Gansu, Qinghai, Ningxia, Henan, Inner Mongolia, Shaanxi, Shanxi, Hebei, Beijing, Tianjin, Shandong, Liaoning and Jilin between (a) the late Neolithic (c. 2350 BC) and (b) the early Bronze Age (c. 1750 BC). The site-density analysis reflects all 100 × 100 km grid cells with site number per cell exceeding 50. The areas with low densities (⩽50 sites/cell) remain blank. Map (c) shows third and early second millennium BC archaeological sites (and associated archaeological cultures written in italics) with identified Yersinia pestis (after Rasmussen et al., 2015) along with archaeologically documented wheat finds (after Betts et al., 2014), cattle scapulae used as oracle bones (after Han, 2008) and walled settlements (after Liu, 2004; Shelach, 1999) dated to the late Neolithic–early Bronze age time interval.
It has already been shown that wild rodents from Asia were the plague reservoir for all known worldwide plague pandemics until the 20th century (Harbeck et al., 2013; Schmid et al., 2015). The distribution area of Qijia/Keshengzhuang II communities borders and partly overlaps the steppe zone, which today is one of the main natural plague foci of China (Li et al., 2008). The onset of keeping domesticated grazing animals naturally results in increasing chances of steppe rodents–human contact and infection. However, until Y. pestis has been identified by ancient DNA in relevant sample material from China, this scenario stays hypothetical.
Conclusion
We presented the results of a mapping and spatiotemporal analysis of archaeological sites across China, using the data published in the series ‘Atlas of Chinese Cultural Relics’ (Guojia Wenwuju). A total of 51,074 archaeological sites from the early Neolithic to the early Iron Age, spanning an interval from c. 8000 to 500 BC, with a spatial extent of over 25 provinces, autonomous regions and municipalities of modern China, that is, between 20° and 53°N and between 73° and 131°E, are considered. The resulting database (submitted to the open access database PANGAEA: https://www.pangaea.de/) can be seen as a scientific contribution, which is helpful in addressing a broad spectrum of questions, such as population growth and migrations, the spread of agriculture and changes in land-use and subsistence strategies. The current paper thus provides a substantial, both qualitative and quantitative, update to the earlier work of Wagner et al. (2013), who compiled and georeferenced altogether 36,422 sites representing 11 administrative regions of northern China.
Despite the known limitations of the dataset, which include unequal temporal resolution and variable age control, it provides the best available and most up-to-date coverage of archaeological sites obtained by salvage and research excavations and surveys. The information quality is secured by the fact that the original archaeological data presented in the analysed atlases were thoroughly evaluated prior to publication by the archaeological institute of the respective province or autonomous region.
The obtained results demonstrate that the number and density of the archaeological sites remain low across all of China during the relatively long interval of the early and middle Neolithic. The first noticeable increase in site density (up to c. 30 sites per 1000 km2) occurred after c. 5000 BC in the northern part of China, with the highest site numbers registered in Shaanxi, Henan and Jiangsu provinces at the latitude of Xi’an along the Wei–Yellow River confluence and in the Xiliao River basin, eastern part of Inner Mongolia. However, the low density of archaeological sites (c. 3–6 sites per 1000 km2) remained a feature of the region of southern China for a much longer period.
The results clearly show asynchronous patterns of changes between the northern and southern parts of China (i.e. north and south of the Yangtze River, respectively), but also within these two macro-regions. In northern China, the highest site densities (i.e. 80–100 sites per 1000 km2) were reached after c. 2000 BC, while in the southern part of China, archaeological sites do not show a noticeable increase until after c. 1500 BC, reaching a maximum (above 40 sites per 1000 km2) only around 1000 BC.
Distinctly asynchronous developmental trends are registered at the smaller regional level. Thus, within northern China, the peak density of sites occurred in the Wei–Yellow River area including the Shandong peninsula in the east and the area around Lake Qinghai in the west c. 2500–2000 BC (late Neolithic), whereas the northeast region demonstrates a relatively low number of sites. However, during the early Bronze Age (c. 2000–1500 BC), the Guanzhong Basin around modern Xi’an and nearby parts of the Yellow River valley experienced a substantial decrease in the number of sites, while in the Northeast, the highest number of sites through the whole analysed time interval is registered. The origin and driving forces of these major changes are still to be understood. However, the dataset presented here provides a matrix for further analyses and data-model comparisons.
Footnotes
Acknowledgements
The Map-Xplore package and CHARDA-Xplore archaeological database have been developed under the framework of Cluster 2 ‘Innovationen: technisch, sozial’ (German Archaeological Institute (DAI)). We would like to express our thanks to A Fleck for technical assistance and to W Zhang for help with the translation of Chinese publications related to this study. Last but not least, our gratitude goes to Dr R Spengler for language polishing and critical reading of the revised manuscript and to both anonymous reviewers for their constructive suggestions, which helped us improve this paper.
Funding
This study is a contribution to the ‘Bridging Eurasia’ research initiative supported by the German Archaeological Institute (DAI), Center for International Cooperation of the Free University Berlin and German Research Foundation (DFG TA 540/5). D Hosner gratefully acknowledges financial support of the Federal Ministry of Research and Education (BMBF Grant 01UO1310).